
 Statistics Teaching: Literacy as a Bridge between Preservice Mathematics Teacher Education and Basic Education
Abstract
This paper analyzes the development of statistical literacy in first-year and final-year students of a Mathematics teacher education program at a state university, seeking to answer the extent to which initial teacher education contributes to the construction and consolidation of the skills and competencies involved in this phenomenon. It is an applied, descriptive study with a mixed qualitative–quantitative approach. Research techniques included bibliographic research and an observational field study. The results indicate that first-year students show limited evidence of statistical literacy, with a strong reliance on basic procedural knowledge. Furthermore, although final-year students demonstrate progress, especially in the mastery of techniques and calculations, difficulties persist in critical analysis and contextual interpretation skills, which are characteristic of the higher levels of literacy. Although the study is not generalizable, it offers parameters for curricular revisions in the analyzed teacher education program, aiming to strengthen critical statistical literacy in alignment with the BNCC (Brazil's National Common Curricular Base).
Keywords:
Statistical literacy levels; Mathematics teacher education; Statistics teaching; Basic Education; State University
Resumo
Este artigo analisa o desenvolvimento do letramento estatístico em estudantes ingressantes e concluintes de um curso de licenciatura em Matemática de uma universidade pública, buscando responder em que medida a formação inicial contribui para a construção e consolidação das habilidades e competências implicadas nesse fenômeno. Trata-se de uma pesquisa aplicada, de natureza descritiva, com tratamento qualiquantitativo dos dados. Como técnicas de pesquisa, utilizamos pesquisa bibliográfica e estudo observacional de campo. Os resultados indicam que os ingressantes apresentam evidências limitadas de letramento estatístico, com forte dependência de conhecimentos procedimentais básicos. Além disso, embora os concluintes demonstrem avanços, especialmente no domínio de técnicas e cálculos, persistem dificuldades em habilidades de análise crítica e interpretação contextual, características dos níveis mais elevados de letramento. Embora o estudo não seja generalizável, oferece parâmetros para revisões curriculares no curso de licenciatura analisado, visando fortalecer o letramento estatístico crítico em alinhamento com a BNCC.
Palavras-chave:
Níveis de letramento estatístico; Formação de professores de Matemática; Ensino de Estatística; Educação Básica; Universidade Pública
1 Introduction
Nowadays, access to technology provides frequent contact with statistical information that directly influences everyday life and guides decision-making, thereby demanding the development of skills for its interpretation and critical analysis. In this context, the importance of statistical literacy emerges, defined by Gal (2002, 2019) as the ability to interpret and critically evaluate data in its various contexts, linked to the ability to argue and question the credibility of information. Such proficiency is important for the formation of citizens and assumes special relevance in the education of Mathematics teachers, who act as multipliers of the knowledge involved.
Despite the growing importance of Statistics in the Brazilian Basic Education curriculum, from the National Curriculum Parameters (PCNs) to the National Common Curricular Base (BNCC), a challenge persists in teacher education. Goulart (2015) points out that both the guiding documents for Basic Education and Mathematics degree programs tend to focus on calculations, formulas, and mechanical procedures to the detriment of interpretation and critical analysis. This approach, as Cazorla and Castro (2008) warn, fails to give meaning to the content and to bring it closer to the students’ reality. Therefore, there is an evident need to ground initial teacher education so that it prepares future educators to emphasize the fundamental concepts and ideas of the field (Gal, 2002), structuring practices that effectively promote statistical literacy in Basic Education (Costa; Pamplona, 2011).
Given the problem presented, this paper seeks to answer the following guiding questions: (i) do first-year students in a Mathematics teacher education program demonstrate any evidence of statistical literacy? (ii) to what extent does the initial education of these future teachers contribute to the development of statistical literacy? The study is based on the following hypotheses: (i) first-year students in a Mathematics teacher education program present limited evidence of statistical literacy; (ii) the initial education of Mathematics teachers contributes, albeit partially, to the development of this skill. The answers to these questions and the validation of the hypotheses will be grounded in and delimited by the analysis of the study sample presented here, composed of students in a Mathematics teacher education program, as described in the methodology section.
The general aim of this paper is to analyze the elements of knowledge and disposition associated with statistical literacy, according to the model proposed by Gal (2002), in students of a Mathematics teacher education program. To achieve this purpose, the following specific aims were defined: (i) to understand statistical literacy as a cognitive, affective, behavioral, and social phenomenon; (ii) to highlight its relevance in the education of Mathematics teachers; (iii) to problematize knowledge about Statistics and its teaching among prospective Mathematics teachers.
2 Methodology
In order to achieve the proposed aims, we conducted an applied and descriptive study, with a qualitative-quantitative approach to data treatment (Prodanov; Freitas, 2013). The applied nature of the research is directed toward understanding the processes involved in the phenomenon of statistical literacy and its development in the education of Mathematics teachers. Its descriptive counterpart is expressed in the characterization of factors that affect the investigated phenomenon, without proposing intervention in the context examined, based on the data obtained from the sample (cf. Section 2.2). To this end, we used two main investigative techniques: bibliographic research and an observational field study (Marconi; Lakatos, 2021), through which we collected both numerical and categorical data.
2.1 Research Context
The observational study required a survey of interdisciplinary literature, the results of which concerning the components of the phenomenon of statistical literacy are presented in Sections 3 and 4 of this paper. For the observational stage, we selected the Mathematics teacher education program at the Advanced Campus of Patu (CAP), of the State University of Rio Grande do Norte (UERN). This choice was based on two interrelated factors: it is the oldest and the only in-person program in the region, which gives it a privileged formative status, and it is a free public institution focused on the education of teacher-researchers, which confirms it as a relevant locus for the sample-based examination of the phenomenon.
2.2 Participants
After approval by the Research Ethics Committee for Human Beings (CEP/UERN1), the students enrolled in the Mathematics teacher education program at CAP/UERN were invited to participate in the study. The inclusion criteria comprised all first-year and final-year students in the year of the research, resulting in a sample of 15 volunteers (8 first-year students and 7 final-year students) out of a total of 37 eligible students. None of the volunteers was working as a teacher. Students with uncorrected visual impairments or diagnosed cognitive or psychological disabilities were excluded. Participation was formalized through the signing of the Informed Consent Form (ICF) and the Informed Assent Form (IAF) for participants under 18 years old. The identity of the volunteers was kept confidential through the use of an alphanumeric code.
2.3 Research Techniques and Method for Data Analysis and Interpretation
For the development of the investigation, we articulated two main techniques: (i) bibliographic research and (ii) an observational study. To survey the state of research regarding the knowledge and attitudes involved in the phenomenon of statistical literacy (first specific aim) and its importance in and for the education of Mathematics teachers (second specific aim), we surveyed and examined secondary indirect documentation (Marconi; Lakatos, 2021). In this case, academic-scientific texts were analyzed following these criteria: (a) identification of the current design of the statistical literacy model proposed by Iddo Gal; (b) comparison of references retrieved from Iddo Gal’s foundational texts; (c) survey of the model’s reception by different researchers. Based on these three criteria, we listed the sociocognitive and behavioral characteristics of the phenomenon as presented in Section 3. Subsequently, we tracked the treatment given to statistical literacy in Mathematics teacher education in Brazil. The results are discussed in Section 4.
The observational component of the study involved the in-person administration of a questionnaire organized into four sections (see Appendix 1). The first six questions were designed to outline the participants’ general profile. Questions 7 to 12 addressed their conceptions of Statistics, with the aim of eliciting episodic memory in order to recover relevant affective and social aspects (Kandel et al., 2023; Gazzaniga et al., 2025). The third section, comprising questions 13 to 19, assessed specific statistical knowledge based on the elements of Gal’s (2002) model, to access knowledge stored in semantic memory (Kandel et al., 2023; Gazzaniga et al., 2025). Finally, a feedback section sought to identify participants’ difficulties and their perceptions of the questionnaire, thereby making it possible to examine the affective and social impacts triggered by the reflexive dimension of the research itself (Cunliffe, 2020; Jamieson, Pownall, & Govaart, 2023; Olmos-Vega et al., 2023).
3 The Phenomenon of Statistical Literacy
Society undergoes constant transformations, accompanied by the expansion of technologies and communication media. This advancement amplifies, in increasing volume and speed, the dissemination of information. An example of this is the contemporary dynamic of news dissemination by the media, with much content related to Statistics, whether explicitly or implicitly.
Statistics is widely used to communicate information to different audiences. During the Covid-19 pandemic, for instance, statistical content was especially prominent in news coverage concerning vaccine effectiveness, projections of the pandemic peak, mortality rates, and related issues. Statistical data play a crucial role in the decision-making processes of individuals, businesses, and governments. In election periods, electoral polls likewise become a recurrent presence.
Statistics permeates a wide range of fields, including health, education, and public safety, encompassing issues across the social, political, and economic spheres. Its presence has also become increasingly prominent on digital platforms and popular social media networks such as Facebook, Instagram, WhatsApp, and Telegram. This reality underscores the urgent need to consolidate the knowledge required to verify and question the reliability of information; without such knowledge, many citizens may become vulnerable to manipulation.
When the media presents statistical data — whether through graphs, tables, indices, measures, or written text — these are usually recognized as reliable and rarely prompts questioning from the public. However, when attempts are made to verify its accuracy, individuals generally face difficulties in formulating consistent counterarguments (Cazorla; Castro, 2008). This highlights the need to foster a statistically literate society.
Stastitical literacy can be defined as “the motivation and ability to access, understand, interpret, critically evaluate, and if relevant express opinions, regarding statistical messages, data-related arguments, or issues involving uncertainty and risk” (Gal, 2021, p. 41). According to Monteiro and Carvalho (2021), the concept is directly associated with individuals’ stance when confronted with statistical news, as well as with analysis and critical thinking in relation to semiotic elements such as graphs, tables, and statistical measures.
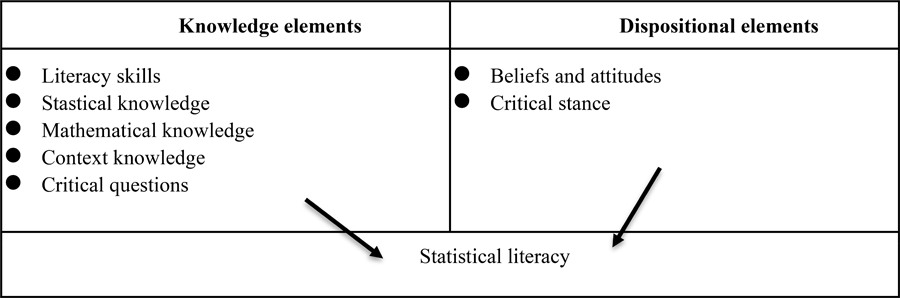
Gal (2002) developed a model to describe the phenomenon of statistical literacy, which is composed of five knowledge elements and two dispositional elements, all of which are interconnected (Chart 1).
According to Gal (2002), the knowledge elements that make up the statistical literacy model can be described as follows:
-
Literacy skills: these refer to the ability to read, understand, and interpret written or spoken texts, graphs, tables, and other formats used to present statistical data. They include the capacity to understand the context in which information is embedded, identify technical terms, and deal with messages that may be incomplete or ambiguous. These skills are essential for constructing meaning from information and for communicating opinions in a precise and well-grounded manner.
-
Statistical knowledge: this encompasses the understanding of fundamental concepts, such as descriptive measures (mean, median, percentages), graphs, and tables, in addition to basic notions of probability and inference. It involves understanding how data are produced and analyzed, recognizing errors or biases in collection and interpretation processes. This knowledge is essential for critically evaluating data-based conclusions and participating in informed debates.
-
Mathematical knowledge: this refers to the ability to apply basic mathematical concepts, such as percentages, means, and proportions, that are necessary for interpreting statistics and their representations. It includes understanding the calculations underlying statistical indicators and the ability to interpret data displayed in graphs and tables. This knowledge helps individuals identify the limitations and characteristics of statistical information circulated in the media and in other contexts.
-
Context knowledge: this refers to familiarity with the real-world scenarios and situations in which statistical data are generated and applied. This knowledge involves understanding how data are linked to relevant social, economic, or environmental phenomena, with the context being the source of meaning and the basis for the application of statistical procedures and the interpretation of results (Gal, 2019). It also requires the ability to interpret statistics considering contextual factors, promoting a critical analysis of the social and practical implications of the results.
-
Critical questions: these refer to the ability to assess the reliability of statistical information by considering possible limitations in the data, methods, or sources. This involves questioning biases, errors, or intentions behind the presentation of results, as well as reflecting on the social and ethical implications of such information. These competencies are fundamental for interpreting statistical messages with discernment and for making more informed decisions.
The dispositional elements, also emphasized in Gal’s (2002) model, concern individuals’ motivations when engaging with statistical messages. These aspects influence their willingness to question, interpret critically, and use statistical data in an active and reflective manner. They may be characterized as follows:
-
Critical stance: this refers to the predisposition to question and analyze statistical messages reflexively, considering potential biases, limitations, and underlying intentions. It involves adopting an attitude of curiosity and skepticism, seeking to understand the context and the possible impacts of the information presented.
-
Beliefs and attitudes: these are dispositional aspects that influence how individuals engage with statistical data and messages. They shape motivation, interest, and the willingness to reflect and act based on statistical information. Beliefs refer to people’s perceptions and understandings regarding the relevance, usefulness, and reliability of Statistics in different contexts. They also include individuals’ self-confidence in dealing with statistical content, which may directly affect their willingness to engage with data. Attitudes, in turn, refer to the emotional or behavioral responses individuals display when confronted with statistical messages, including feelings of curiosity, apprehension, or even resistance. Positive attitudes facilitate critical engagement, whereas negative attitudes may limit interaction with statistical content.
Watson and Callingham (2003) propose a model of statistical literacy composed of six hierarchical levels: Level 1 – idiosyncratic, in which the individual engages with statistical problems on the basis of personal beliefs disconnected from the data, uses statistical terms tautologically, and demonstrates only basic counting skills; Level 2 – informal, characterized by colloquial (common-sense) engagement, non-statistical intuitive beliefs, an understanding of isolated elements of statistical terminology, and basic calculations involving tables and graphs; Level 3 – inconsistent, in which engagement with context is selective, the individual recognizes appropriate conclusions but is unable to provide adequate justifications, and relies more on qualitative than quantitative ideas; Level 4 – consistent non-critical, marked by the correct application of basic statistical skills, such as calculating averages, simple probabilities, and interpreting features of graphs, but without critically questioning the context or situation presented in a problem; Level 5 – critical, involving critical engagement in both familiar and unfamiliar contexts, appropriate use of terminology, qualitative interpretation of probabilities, and appreciation of the notion of variation/variability; and Level 6 – critical mathematical, the highest level, which requires critical engagement involving proportional reasoning, an understanding of uncertainty in predictions, interpretation of subtle aspects of language, and the ability to critically question the validity of data and the representativeness of a sample.
Statistical literacy, as described by Gal (2002), is a multifaceted phenomenon that integrates cognitive, affective, and behavioral dimensions in an interdependent way (Friedrich et al., 2024). The knowledge elements highlight its cognitive basis, as they require the understanding, interpretation, and evaluation of statistical messages across different contexts. By contrast, the dispositional elements show that engagement with Statistics is mediated by affective responses, such as curiosity, apprehension, and motivation, which directly influence one’s willingness to question and interact with data. In addition, the practical application of this knowledge — whether in questioning information, making informed decisions, or actively using statistics in debates and social practices — confirms its behavioral nature. These three aspects are inseparable, since cognitive skills are activated and strengthened by beliefs and attitudes, while behavior reflects the concrete application of such literacy in everyday life (García-Santillán et al., 2012). Thus, Gal’s (2002) model reinforces the idea that statistical literacy is not merely a technical competence, but rather a complex phenomenon that requires the integrated development of cognitive, affective, and behavioral capacities, all of which are essential to the education of critical and participatory citizens in a data-permeated society.
Moreover, statistical literacy, as described by Gal (2002), is inherently a social phenomenon and, therefore, imbued with ethical responsibility (Magalhães; Nóbrega, 2023). This social dimension is evident in the central role of context knowledge, which connects statistical data to the economic, political, and cultural phenomena that affect societies. Context provides both meaning and the basis for the application of statistical procedures, and is inseparable from the social dynamics and informational needs of groups and communities (Gal, 2019). Statistical literacy enables citizens to participate in public debates, question information presented by the media, and understand the social and ethical implications of the use of data in fields such as health, education, and environmental policy (Gal, 2021). Therefore, the phenomenon of statistical literacy not only equips individuals to master the technical aspects of Statistics, but also entails engagement with the social, ethical, and political dimensions of information use, demonstrating that statistical literacy extends beyond the individual and is rooted in the social interactions that shape the contemporary world.
4 Statistics in Initial Teacher Education
According to Silva and Santos (2021), although research in Statistics Education has emphasized the need to prepare students to develop a critical stance toward statistical information, high school still reveals a gap between the intended educational goals and the competencies students actually attain by the end of this stage of schooling.
As pointed out by Santana (2016), the teaching of Statistics is frequently restricted to the application of formulas, calculations, and mechanical procedures, generally based on fictitious data found in textbooks, disconnected from the students’ sociocultural reality. In this sense, Cazorla and Castro (2008) highlight that the Mathematics teacher must go beyond simple technical teaching, attributing meaning and relevance to the covered content and bringing it closer to the students' experiences. According to the authors, “the Mathematics teacher cannot be limited to being a mere conveyor of formulas and algorithms, but must give meaning and life to this school mathematics that seems so distant, but which is becoming increasingly necessary” (Cazorla; Castro, 2008, p. 50, our translation).
Curricular reforms always impact Basic Education and bring challenges to teacher education. Cazorla and Castro (2008) highlight that, since the introduction of statistical content in the PCNs, it has become imperative for Mathematics teaching degree programs to approach such content not just as a set of techniques and procedures, but as belonging to a field that promotes the development of critical sense, interpretation, and argumentation among future teachers. In this context, Lopes (2013) emphasizes the importance of using real-life situations in the teaching of Statistics to stimulate critical thinking in students and connect them to the practical applicability of the content. With the implementation of the BNCC, this need becomes even more urgent, requiring initial education that prepares teachers to integrate Statistics into teaching in a contextualized manner.
Gal (2019) considers that the teaching of Statistics should prioritize the development of knowledge more connected to the real world, reducing the centrality of formulas and repetitive processes. Although mathematical knowledge is essential for performing calculations, it is through its application that students can critically interpret the information surrounding them and build solid arguments. To achieve this goal, Monteiro and Carvalho (2021) highlight that teacher education plays a central role in the development of statistical literacy.
However, as observed by Barbosa, Velasque, and Silva (2016), many Mathematics teachers do not receive adequate preparation to teach statistical concepts in the classroom. In this sense, Borba and Monteiro (2013) suggest that Mathematics teacher education programs should demonstrate to prospective teachers the potential of Statistics Education to promote scientific inquiry, citizenship education, and critical thinking among students. In addition, the curricula of these programs still lack an integrated approach encompassing didactic, curricular, conceptual, and cognitive dimensions, all of which are essential for preparing teachers to meet official educational guidelines.
Although most undergraduate programs include at least one Statistics course, according to Pinto, Silva, and Silva (2011), there is a worrying trend toward reducing its course load or even removing it from curricular structures altogether. Based on their analysis of the Mathematics teacher education program at UFMT’s Araguaia Campus, Costa and Pamplona (2011) note that, between 1988 and 2003, the only Statistics course was offered in the final semester and was limited to traditional content, disconnected from teaching practice and from the demands of Basic Education. From 2004 onward, however, advances were made both in course load and in content approach, with the inclusion of discussions on the relevance of Statistics and Probability in Basic Education, as well as on the historical and social dimensions associated with the development of these fields. This curricular reform reflects the need to prepare future Mathematics teachers not only as Mathematics educators but also as Statistics educators, expanding their pedagogical repertoire in line with contemporary educational demands and promoting reflective, contextualized practices.
The difficulties faced by undergraduate students in Statistics classes, often accompanied by a rejection of the subject, are pointed out by Lopes, Coutinho, and Almouloud (2010). The authors suggest that a possible solution lies in the teacher’s performance, who must demonstrate the relevance of Statistics within the students’ professional context. Costa Júnior and Monteiro (2020) highlight that, in Mathematics teaching degree programs, Statistics is frequently treated as an extension of Applied Mathematics, with a predominant focus on calculations and proofs, which can limit the development of a broad perspective of statistical literacy. For the authors, it is fundamental that undergraduate students be encouraged to overcome this approach, understanding Statistics as a critical tool for the analysis and interpretation of data in real-world contexts.
Barreto et al. (2022) reinforce the importance of teacher education that integrates cognitive and affective elements of statistical literacy, evidencing that many future teachers present gaps regarding the mastery of statistical concepts and the development of critical skills, which compromises their ability to implement investigative and contextualized pedagogical practices. These challenges underscore the need for initial teacher education that empowers teachers not only in technical procedures but also in the reflexive application of Statistics in the classroom.
The studies reviewed make it clear that changes are still needed in the initial education of Mathematics teachers if they are to be adequately prepared to teach Statistics. In addition, continuing professional development for these teachers must take into account the demands of current curricula, such as the BNCC, and prioritize the development of statistical literacy, understood as an essential competence for the critical and contextualized interpretation of data (Oliveira; Nóbrega, 2024). In this regard, Carvalho and Monteiro (2024) stress the importance of integrating statistical literacy into teacher education, arguing that it goes beyond technical application to encompass the ethical and social dimensions of using and analyzing real data. Such an approach not only enables teachers to understand statistical concepts more deeply but also equips them to foster pedagogical practices that connect Statistics to students’ everyday lives, preparing them to make informed and responsible decisions in a data-driven society.
5 What does the sample say?
The study was conducted with 15 volunteers: 8 first-year students, who were enrolled in the second semester of the program at the time of data collection ( x̄age = 22,5;sage = 5,8) and 7 final-year students, who were enrolled in the last semester of the program (x̄age = 23,9;sage = 2,3). Among the first-year students, 50% were women, whereas among the final-year students, women accounted for 42.9% of the group. None of the participants was working as a teacher, and only one reported already holding a degree in another field (Agronomy). According to the Pedagogical-Political Project of the program analyzed, the courses related to Statistics follow a strictly theoretical approach and are offered in the fourth semester (Descriptive Statistics) and the sixth semester (Probability and Statistics). Thus, the selection of first-year and final-year students made it possible to conduct a comparative analysis and thereby assess the impact of initial teacher education on the development of statistical literacy among pre-service teachers.
5.1 Levels of Statistical Literacy
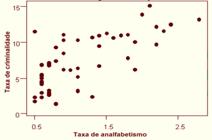
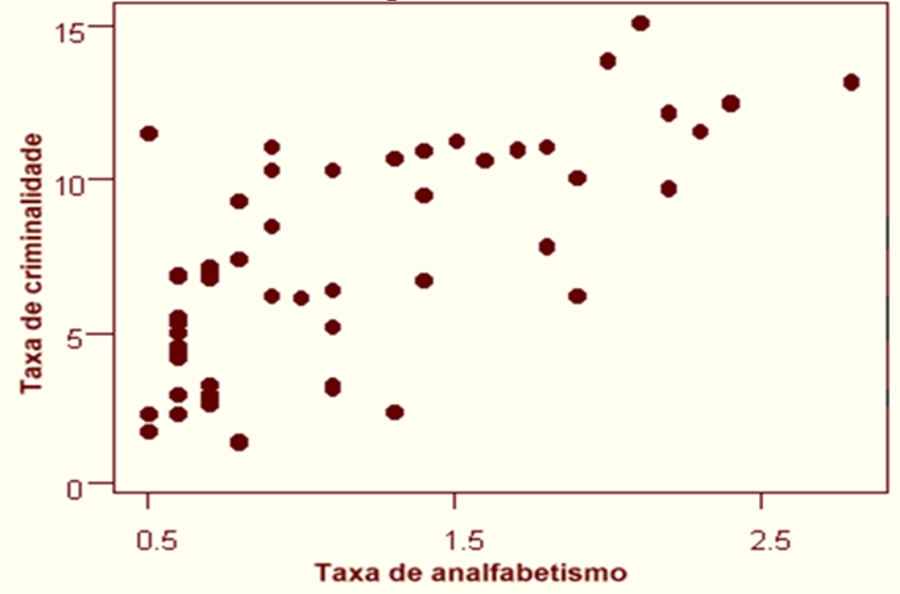
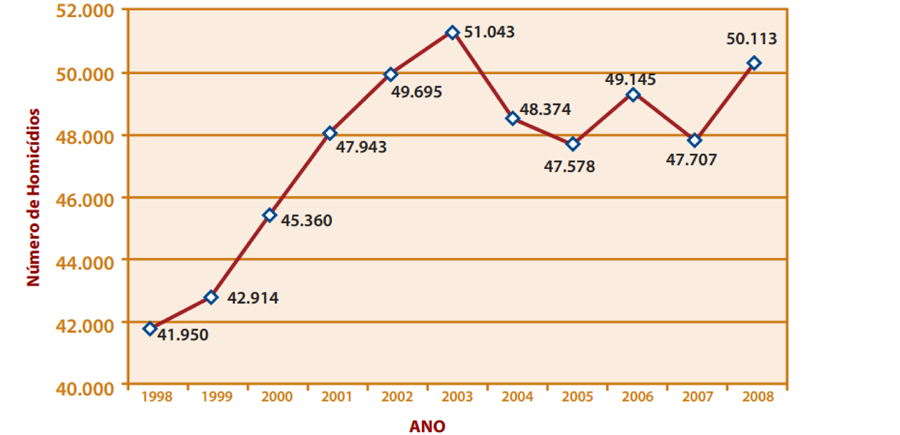
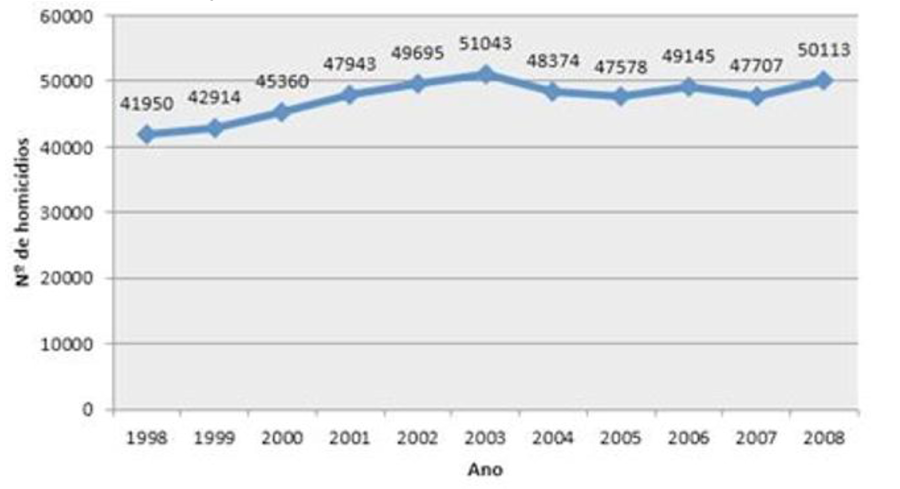
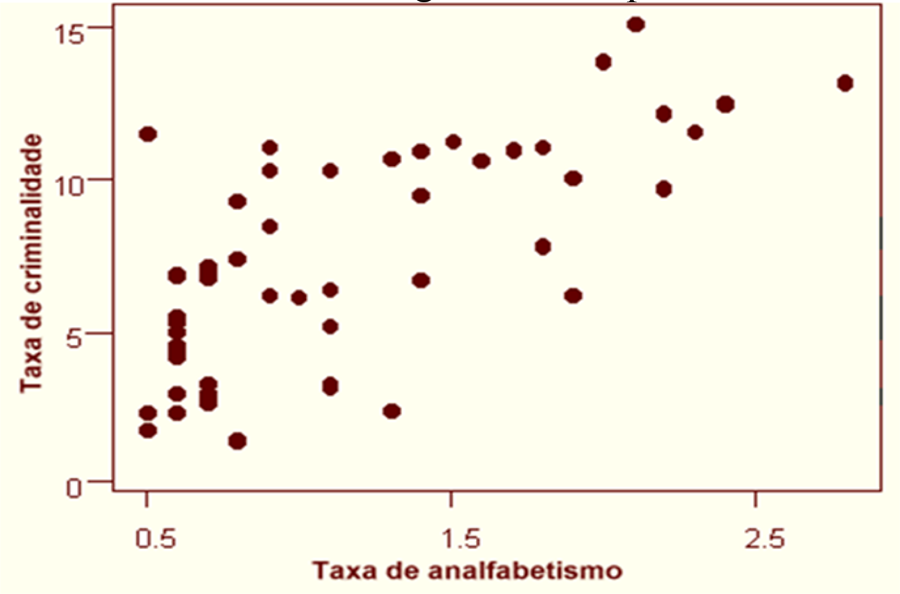
When analyzing the performance of the participants, we observed that the students are mostly situated between Level 2 (informal) and Level 3 (inconsistent). The final-year students demonstrated specific progress toward Level 4 (consistent non-critical), especially in procedural tasks such as the calculation of the simple arithmetic mean. In these tasks, they achieved 85.7% and 71.4% correct answers for questions 13a (requesting the calculation of the arithmetic mean of interest rates for 10 stocks) and 14c (demanding the calculation of the mean and variability of customer waiting times in bank lines), respectively. However, both first-year and final-year students exhibited low performance in tasks that required more critical reasoning. For example, only one out of the seven final-year students (14.3% of graduating students; 6.7% of all participants) knew how to construct an adequate graph for question 14d (where participants were expected to draw a graph corresponding to the waiting time in line for each of the three presented banks), and only two out of all fifteen participants (13.3%) identified the most appropriate scale in question 16b (which asked which of two graphs presented the data in the most suitable manner). The same pattern was repeated in tasks requiring the identification of relationships between variables — such as question 18a, regarding the relationship between illiteracy and crime rates presented in a scatter plot — or the understanding of variability (question 13b, concerning the variability of interest rates for 10 stocks), in which the accuracy rate was low for both groups. This performance suggests that even at the end of the program, future teachers have not consolidated the competencies for Level 5 (critical) and Level 6 (critical mathematical).
Taking Gal’s (2002) model as a reference, the data interpretation supports this finding. Regarding knowledge elements, participants evidenced context knowledge, being able to cite various applications of Statistics in daily life (question 11, a direct inquiry about the relationship between Statistics and daily life). However, statistical and mathematical knowledge were largely restricted to mechanical procedures and remained superficial in topics such as variability, with only 26.7% correct answers for question 13b (regarding the variability of interest rates for 10 stocks). The knowledge element critical questions proved to be the most deficient, evidenced by the difficulty in identifying inadequacies and biases in graphs and in evaluating research methods. This reinforces that, in the investigated sample, initial education has not yet satisfactorily developed critical capacity, a pillar of statistical literacy. Regarding dispositional elements, participants demonstrated positive beliefs and attitudes regarding the relevance of Statistics, recognizing its importance. However, this belief contrasts with an attitude of insecurity, as 87% feel unfit or only partially confident to teach the content.
5.2 Clues of the Knowledge Elements
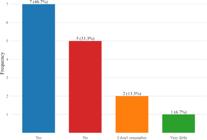
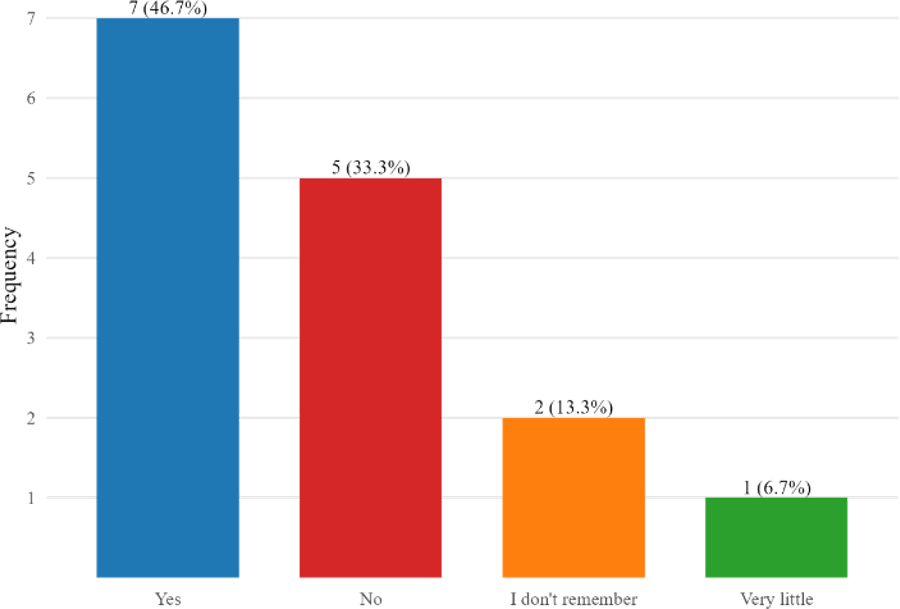
The types of knowledge investigated in the study were distributed across five areas: calculation of measures; frequency distributions; construction, analysis, and interpretation of graphs; research design; and statistical models. It was found that more than half of the participants had studied Statistics during Basic Education (Figure 1). Table 1 lists the contents explicitly mentioned by the respondents. Based on the distribution of the areas investigated, it became evident that no knowledge elements related to research design or statistical models were identified. The area of calculation of measures appears to have been the most emphasized in the participants’ mathematics classes during Basic Education, especially measures of central tendency. Knowledge related to the analysis and interpretation of graphs appeared next.
In addition to mathematical and statistical knowledge, context knowledge and critical questions, which are also included in Gal’s (2002) model, were elicited, as shown in Chart 2. The left-hand column was organized by the researchers in order to group contextual and everyday-life indications of situations in which Statistics is present. The right-hand column contains some of the responses on which the researchers based the organization of these categories.
The categories were constructed on the basis of lexical cues that evoked context knowledge and critical questions, as well as elements of mathematical and statistical knowledge. The labels we adopted were intended to bring together the diversity of responses into broader, superordinate categories.
5.3 Clues of Dispositional Elements
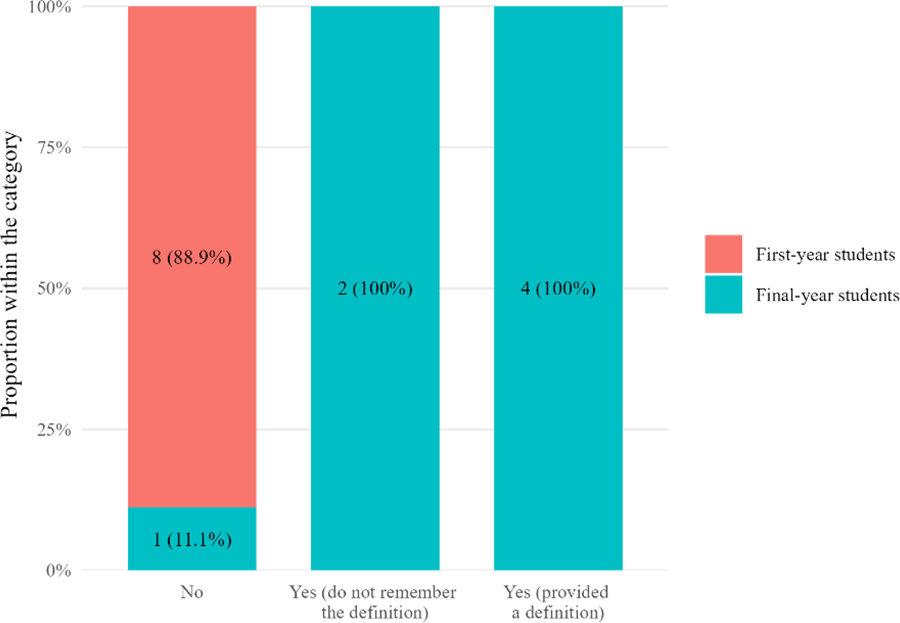
Figure 2 highlights two points that merit particular attention, based on participants’ responses to Question 12, which asked whether they were familiar with the concept of statistical literacy. Despite the place Statistics occupies in official curricular documents, the expression statistical literacy was unknown to the first-year students. This is not surprising, since they had not yet been exposed to more in-depth conceptual discussions, especially given that the BNCC does not use the term and that, during Basic Education, students do not usually have formal contact with this nomenclature. Thus, the lack of familiarity among first-year students with the concept should not be interpreted as a gap in their education, but rather as an expected condition at this initial stage of the program.
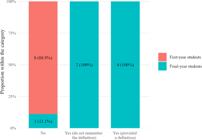
Given this entry-level scenario, the Mathematics teaching degree program appears to have an impact on the future teachers' awareness of what is implied in the phenomenon under investigation. However, it should be noted that 33% of those who claimed to have heard of statistical literacy were unable to provide even a rudimentary definition. Among those who did provide a definition, all identified interpretation as a constitutive element of literacy.
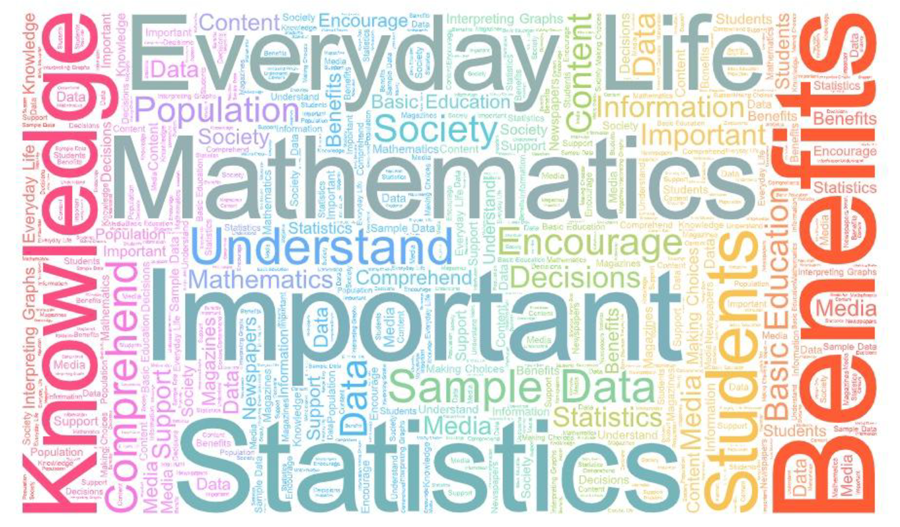
Although not all participants had heard of statistical literacy or remembered what it meant, all of them recognized the importance of teaching Statistics in Basic Education. As the word cloud in Figure 3 shows — based on the responses to Question 8, which asked precisely about this issue — the participants revealed a body of knowledge consistent with that described in Chart 1. Even without being familiar with Gal’s (2002) model, these pre-service teachers demonstrated some knowledge elements (such as data, graphs, samples, information, and population) as well as dispositional elements (such as understanding, interpretation, decisions, and choices).
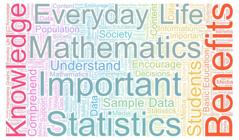
– Word cloud from Question 8: Do you consider the teaching of Statistics in Basic Education important?
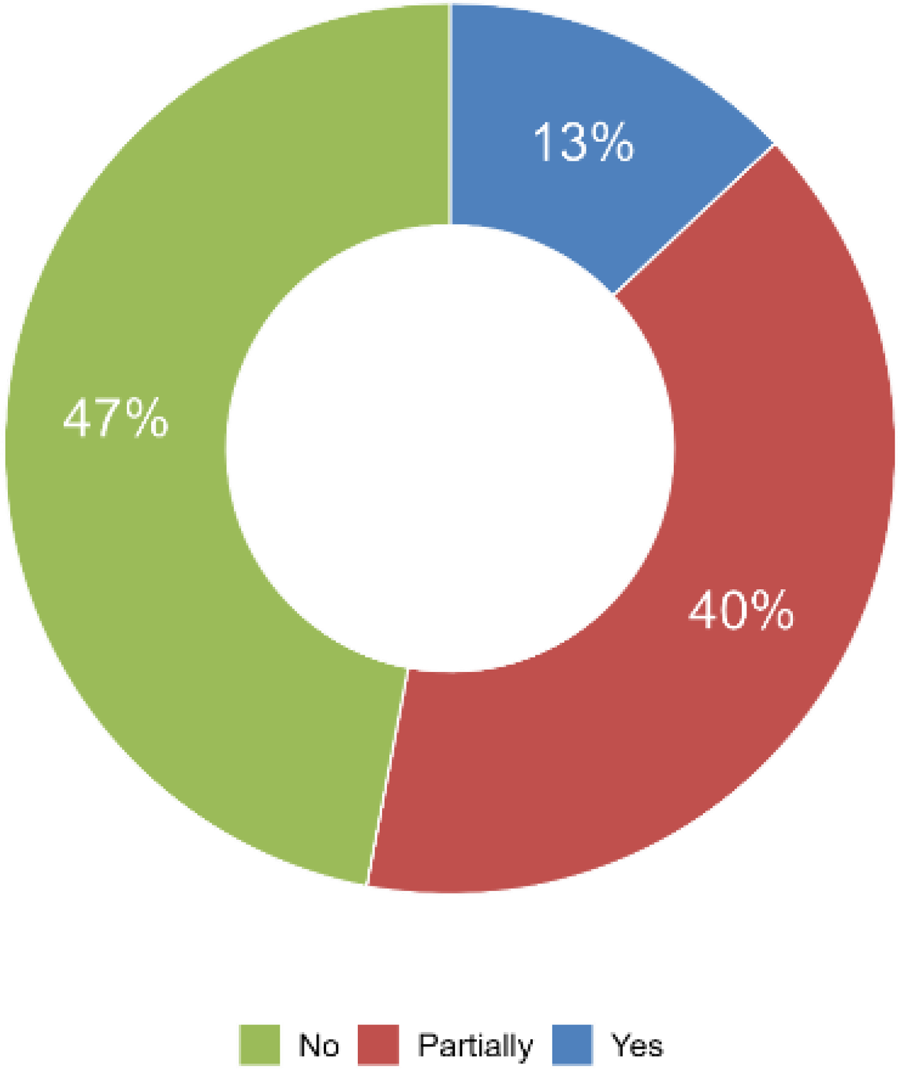
In light of these findings, it is consistent that 87% of the participants expressed a sense of insecurity regarding the teaching of Statistics (Figure 4). The two participants (13.3% of respondents) who reported feeling confident about teaching statistical content in Basic Education were final-year students and were also able to define statistical literacy appropriately, as requested in Question 12 of the questionnaire.
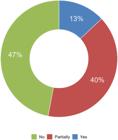
– Frequency of responses to Question 10: Do you feel confident/prepared to teach Statistics content to Basic Education students?
Based on Questions I and II of the feedback section, it is possible to reinterpret the findings in light of the reflexive dimension of the research. Question II, which aimed to identify participants’ self-perception regarding their mathematical, statistical, and contextual knowledge, showed that the difficulties they reported were, in ascending order, related to the calculation of measures (especially measures of variability), the interpretation of graphs, and the interpretation of the problem or situation itself. Question I suggests that, although the pre-service teachers who participated in the study tend to feel insecure about teaching Statistics —even though they intuitively demonstrate knowledge of the elements of Gal’s (2002) model —they also tend to value the assessment resources presented in the questionnaire (Questions 13 to 19) as pedagogical instruments.
6 Conclusion
Statistical literacy, as conceptualized by Gal (2002, 2019), is a complex and multidimensional phenomenon that is indispensable to the exercise of citizenship, as it brings together knowledge, dispositions, and skills needed to interpret and critically evaluate data-based information. This paper was grounded in the problem of how statistical literacy manifests itself in, and is developed by, students enrolled in a Mathematics teacher education program. Based on the two research questions proposed — first-year students demonstrate evidence of statistical literacy and to what extent initial teacher education contributes to its development —the two hypotheses formulated are not rejected: (i) first-year students display limited evidence of statistical literacy; and (ii) initial teacher education contributes only partially to the development of statistical literacy, especially in skills related to reading and interpreting graphs, using statistical terminology, and calculating measures, although critical analysis skills remain incipient.
To investigate the proposed questions, we adopted an applied and descriptive research methodology with a mixed qualitative-quantitative approach. The combination of bibliographic research with an observational study allowed for the achievement of the proposed aims. The literature review grounded the understanding of statistical literacy as a cognitive, affective, behavioral, and social phenomenon (first specific aim) and highlighted its relevance in teacher education (second specific aim). The administration of the questionnaire, in turn, enabled the problematization of statistical knowledge among Mathematics undergraduates (third specific aim), generating data that allowed for the diagnosis of the knowledge and disposition elements associated with statistical literacy in the researched sample, thus fulfilling the general aim of the study.
From a theoretical standpoint, this study aligns with contemporary reviews that contribute to a scalar understanding of the model of statistical literacy proposed by Gal (2002). With regard to its applied dimension, the limited sample size of the observational study does not allow for generalization of the findings. Nevertheless, a close examination of the conditions of this particular teacher education program — which serves as an important center for teacher preparation in the western region of Rio Grande do Norte and in neighboring states such as Ceará and Paraíba — makes it possible to establish an authentic point of reference for curricular revisions aimed at strengthening engagement with real-world contexts and the development of critical competencies, in line with the guidelines of the BNCC and the broader challenges of contemporary society.
References
-
BARBOSA, M. T. S.; VELASQUE, L. de S.; SILVA, A. S. da. O letramento estatístico na formação dos professores: um tutorial metodológico. VIDYA, Santa Maria, v. 36, n. 2, p. 397 - 408, jul./dez. 2016. Disponível em: https://periodicos.ufn.edu.br/index.php/VIDYA/article/view/1822/1747 Acesso em: 19 DEZ. 2024.
» https://periodicos.ufn.edu.br/index.php/VIDYA/article/view/1822/1747 -
BARRETO, M. C.; MENDONÇA, M. C.; FARIAS, G. F.; OLIVEIRA, R. M. Compreensão estatística de professores em formação inicial. Bolema, Rio Claro, v. 36, n. 74, p. 1115-1134, dez. 2022. Disponível em: https://www.scielo.br/j/bolema/a/YQLCGms6kLgDJWsDpRmg9ph/?format=pdf⟨=pt Acesso em: 19 DEZ. 2024.
» https://www.scielo.br/j/bolema/a/YQLCGms6kLgDJWsDpRmg9ph/?format=pdf⟨=pt - BORBA, R. E. de S. R.; MONTEIRO, C. E. F. Processos de ensino e aprendizagem em educação matemática Recife: Ed. Universitária da UFPE, 2013.
-
CARVALHO, L. M. T. L.; MONTEIRO, C. E. F. (org.) Letramento estatístico no contexto de dados reais: oportunidades e desafios para professores e estudantes. Recife: Ed. Universitária da UFPE, 2024. Disponível em: https://editora.ufpe.br/books/catalog/view/920/920/3065 Acesso em: 19 JAN. 2025.
» https://editora.ufpe.br/books/catalog/view/920/920/3065 -
CAZORLA, I. M.; CASTRO, F. C. O papel da Estatística na leitura do mundo: o letramento estatístico. Publ. UEPG Ci. Hum., Ci. Soc. Apl., Ling., Letras e Artes, Ponta Grossa, v. 16, n.1, p. 45-53, jun. 2008. Disponível em: https://revistas.uepg.br/index.php/humanas/article/view/617/605 Acesso em: 10 DEZ. 2024.
» https://revistas.uepg.br/index.php/humanas/article/view/617/605 -
COSTA JÚNIOR, J. R.; MONTEIRO, C. E. F. A importância do letramento estatístico na licenciatura em matemática. Revista Paranaense de Educação Matemática, Campo Mourão, v. 09, n. 19, p. 624-646, jul./out, 2020. Disponível em: https://periodicos.unespar.edu.br/rpem/article/view/6207/4230 Acesso em: 10 DEZ. 2024.
» https://periodicos.unespar.edu.br/rpem/article/view/6207/4230 -
COSTA, W. N. G.; PAMPLONA, A. S. Entrecruzando Fronteiras: a Educação Estatística na formação de Professores de Matemática. Bolema, Rio Claro, v. 24, n. 40, p. 897-911, dez. 2011. Disponível em: https://www.periodicos.rc.biblioteca.unesp.br/index.php/bolema/article/view/5299/4176 Acesso em: 19 DEZ. 2024.
» https://www.periodicos.rc.biblioteca.unesp.br/index.php/bolema/article/view/5299/4176 -
CUNLIFFE, A. L. Reflexividade no ensino e pesquisa de estudos organizacionais. Revista de Administração de Empresas - RAE, São Paulo, v. 60, n. 1, p. 64-69, 2020. Disponível em: https://www.scielo.br/j/rae/a/5rgdbxCf7JKQXnpwDFHmxBB/?format=pdf⟨=pt Acesso em: 18 DEZ. 2024.
» https://www.scielo.br/j/rae/a/5rgdbxCf7JKQXnpwDFHmxBB/?format=pdf⟨=pt -
FRIEDRICH, A.; SCHREITER, S.; VOGEL, M.; BECKER-GENSCHOW, S.; BRÜNKEN, R.; KUHN, J.; LEHMANN, J.; MALONE, S. What shapes statistical and data literacy research in K-12 STEM education? A systematic review of metrics and instructional strategies. International Journal of STEM Education, New York, v. 11, n. 58, p. 1-24, 2024. Disponível em: https://link.springer.com/content/pdf/10.1186/s40594-024-00517-z.pdf Acesso em: 18 DEZ. 2024.
» https://link.springer.com/content/pdf/10.1186/s40594-024-00517-z.pdf -
GAL, I. Adults' statistical literacy: Meanings, components, responsibilities. International Statistical Review, Rotterdam, v. 70, n. 1, p. 1-25, 2002. Disponível em: https://www.statlit.org/pdf/2002-Gal-ISR.pdf Acesso em: 10 DEZ. 2024.
» https://www.statlit.org/pdf/2002-Gal-ISR.pdf -
GAL, I. Understanding statistical literacy: About knowledge of contexts and models. In: CONGRESO INTERNACIONAL VIRTUAL DE EDUCACIÓN ESTADÍSTICA, 3., 2019, Granada. ACTAS… Granada: Universidad de Granada, 2019. p. 1-15. Disponível em: www.ugr.es/~fqm126/civeest/ponencias/gal.pdf Acesso em: 10 DEZ. 2024.
» www.ugr.es/~fqm126/civeest/ponencias/gal.pdf -
GAL, I. Promoting statistical literacy: challenges and reflections with a Brazilian perspective. In: MONTEIRO, C. E. F.; CARVALHO, L. M. T. L. (org.). Temas emergentes em letramento estatístico. Recife: Ed. Universitária da UFPE, 2021. Disponível em: https://editora.ufpe.br/books/catalog/view/666/677/2080 Acesso em: 17 DEZ. 2024.
» https://editora.ufpe.br/books/catalog/view/666/677/2080 -
GARCÍA-SANTILLÁN, A.; MORENO-GARCÍA, E.; CARLOS-CASTRO, J.; ZAMUDIO-ABDALA, J. H.; GARDUÑO-TREJO, J. Cognitive, Affective and Behavioral Components that Explain Attitude toward Statistics. Journal of Mathematics Research, Ontario v. 4, n. 5, p. 8-16, 2012. Disponível em: https://ccsenet.org/journal/index.php/jmr/article/download/20494/13464 Acesso em: 17 DEZ. 2024.
» https://ccsenet.org/journal/index.php/jmr/article/download/20494/13464 - GAZZANIGA, M. S. et al. Cognitive Neuroscience: the biology of mind. 6. ed. New York: W. W. Norton & Company, 2025.
- GOULART, A. Um estudo sobre a abordagem dos conteúdos estatísticos em cursos de licenciatura em matemática: uma proposta sob a ótica da ecologia do didático. 2015. 167f. Tese (Doutorado em Educação Matemática) - Faculdade de Ciências Exatas e Tecnologia, Universidade Católica de São Paulo, São Paulo, 2015.
-
JAMIESON, M. K.; GOVAART, G. H.; POWNALL, M. Reflexivity in quantitative research: A rationale and beginner's guide. Social and Personality Psychology Compass, New Jersey, v. 17, n. 4, p.1-15, 2023. Disponível em: https://compass.onlinelibrary.wiley.com/doi/epdf/10.1111/spc3.12735 Acesso em: 12 DEZ. 2024.
» https://compass.onlinelibrary.wiley.com/doi/epdf/10.1111/spc3.12735 - KANDEL, E. R. et al. Princípios de Neurociências. 6. ed. Porto Alegre: Artmed, 2023.
-
LOPES, C. E. Educação estatística no curso de licenciatura em Matemática. Bolema, Rio Claro, v. 27, n. 47, p. 901-915, dez. 2013. Disponível em: https://www.scielo.br/j/bolema/a/cksyjNpSzCTLn3cCVB8k7rN/?format=pdf⟨=pt Acesso em: 15 DEZ. 2024.
» https://www.scielo.br/j/bolema/a/cksyjNpSzCTLn3cCVB8k7rN/?format=pdf⟨=pt - LOPES, C. E.; COUTINHO, C. de Q. e S.; ALMOULOUD, S. A. Estudos e reflexões em educação estatística Campinas: Mercado de Letras, 2010.
-
MAGALHÃES, A. S.; NOBREGA, M. P. Letramento Estatístico em perspectiva dialógica: os saberes e a responsabilidade ética. In: DUARTE, Rodrigo Gonçalves; DUARTE, Leonardo Felipe Gonçalves; CORRÊA, Ana Maria. (org.). Educação em Perspectiva: possibilidades e desafios em contextos multidisciplinares. 1. ed. Itapiranga: Schreiben, 2023, v. 1, p. 92-102. Disponível em: https://www.editoraschreiben.com/_files/ugd/e7cd6e_8af62e25599749d0bd8a3cd30c9db1a5.pdf Acesso em: 20 DEZ. 2024.
» https://www.editoraschreiben.com/_files/ugd/e7cd6e_8af62e25599749d0bd8a3cd30c9db1a5.pdf - MARCONI, M. A.; LAKATOS, E. M. Técnicas de pesquisa. 9. ed. São Paulo: Atlas, 2021.
-
MONTEIRO, C. E. F.; CARVALHO, L. M. T. L. (org.). Temas emergentes em letramento estatístico. Recife: Ed. Universitária da UFPE, 2021. Disponível em: https://editora.ufpe.br/books/catalog/view/666/677/2080 Acesso em: 17 DEZ. 2024.
» https://editora.ufpe.br/books/catalog/view/666/677/2080 - OLIVEIRA, R. F.; NÓBREGA, M. P. O letramento estatístico e a formação inicial do professor de Matemática. In: MOURA, Jónata Ferreira de. (org.). A formação de professores que ensinam Matemática na Educação brasileira. 1. ed. Jundiaí - SP: Paco Editorial, 2024, p. 35-50.
-
OLMOS-VEGA, F. M. et al. A practical guide to reflexivity in qualitative research: AMEE Guide No. 149. Medical Teacher, Dundee, v. 45, n. 3, p.241-251, 2023. Disponível em: https://www.tandfonline.com/doi/epdf/10.1080/0142159X.2022.2057287?needAccess=true Acesso em: 17 DEZ. 2024.
» https://www.tandfonline.com/doi/epdf/10.1080/0142159X.2022.2057287?needAccess=true -
PINTO, S. S.; SILVA, M. M. P.; SILVA, J. A. Modelo Pedagógico Relacional na Educação Estatística. In: CONFERÊNCIA INTERAMERICANA DE EDUCAÇÃO MATEMÁTICA, 13., 2011, Recife. Anais.. Recife: IACME, 2011, p. 1-8. Disponível em: https://repositorio.furg.br/handle/1/1045 Acesso em: 19 DEZ. 2024.
» https://repositorio.furg.br/handle/1/1045 -
PRODANOV, Cleber Cristiano; FREITAS, Ernani Cesar de. Metodologia do trabalho científico: métodos e técnicas da pesquisa e do trabalho acadêmico. 2. ed. Novo Hamburgo: Feevale, 2013. Disponível em: https://www.feevale.br/Comum/midias/0163c988-1f5d-496f-b118-a6e009a7a2f9/E-book%20Metodologia%20do%20Trabalho%20Cientifico.pdf Acesso em: 19 DEZ. 2024.
» https://www.feevale.br/Comum/midias/0163c988-1f5d-496f-b118-a6e009a7a2f9/E-book%20Metodologia%20do%20Trabalho%20Cientifico.pdf -
SANTANA, M. de S. Traduzindo pensamento e letramento estatístico em atividades para sala de aula: construção de um produto educacional. Bolema, Rio Claro, v. 30, n. 56, p. 1165-1187, dez. 2016. Disponível em: https://www.scielo.br/j/bolema/a/dFv4bGpf7MwdSGMHjsP34jq/?format=pdf⟨=pt Acesso em: 14 DEZ. 2024.
» https://www.scielo.br/j/bolema/a/dFv4bGpf7MwdSGMHjsP34jq/?format=pdf⟨=pt -
SILVA, M. F.; SANTOS, G. O. Abordagem da Estatística em livros didáticos de matemática do Ensino Médio do PNLD 2018 - o letramento estatístico. Revista Eletrônica de Educação Matemática - REVEMAT, Florianópolis, v. 16, p. 1-23, jan./dez., 2021. Disponível em: https://periodicos.ufsc.br/index.php/revemat/article/view/79174/45756 Acesso em: 24 FEV. 2026.
» https://periodicos.ufsc.br/index.php/revemat/article/view/79174/45756 -
WATSON, J.; CALLINGHAM, R. Statistical literacy: a complex hierarchical construct. Statistics Education Research Journal, Auckland, v. 2, n. 2, p. 3-46, 2003. Disponível em: https://iase-pub.org/ojs/SERJ/article/view/553/417 Acesso em: 14 DEZ. 2024.
» https://iase-pub.org/ojs/SERJ/article/view/553/417
Anexo 1
Questionnaire with activities
-
How do you identify your gender?
-
How old are you?
-
What is your major? ( ) Mathematics ( ) Pedagogy
-
In which year did you enter this program, and which semester are you currently in?
-
Do you already hold another higher education degree? If yes, please specify which one.
-
Do you already work as a classroom teacher? ( ) Yes ( ) No
If yes, indicate in which level(s) of Basic Education:
( ) Early Childhood Education ( ) Elementary School – Early Years
( ) Elementary School – Final Years ( ) High School
-
Throughout Basic Education, did you study Statistics? If so, cite which contents.
-
Do you consider the teaching of Statistics in Basic Education important? Justify your answer.
-
During your undergraduate program, which courses related to Statistics have you taken? In what year did you take them?
-
Do you feel confident/prepared to teach Statistics content to Basic Education students?
-
What is the relationship between Statistics and our daily lives?
-
Have you ever heard of statistical literacy? If so, give a definition with your own words.
-
(Morettin; Bussab, 2010 – adapted) The interest rates received by 10 stocks during a certain period were: 2.59%; 2.64%; 2.60%; 2.62%; 2.57%; 2.55%; 2.61%; 2.50%; 2.63%; 2.64%.
a) What is the mean interest rate received from the 10 stocks?
b) What can we notice about its variability?
-
(Triola, 2008) The table below shows the waiting time, in minutes, of three customers at three different banks. At Bank 1, the manager changes the number of tellers according to demand; at Bank 2, all customers wait in a single line serving all tellers; at Bank 3, customers wait in separate lines for each teller.
Based on the table, answer:
a) Suppose you need to decide which of these banks to go to. Which would you choose? Justify your answer.
b) Is there any advantage or disadvantage in choosing any of the banks?
c) What is the mean waiting time at each bank?
d) Draw the graph that corresponds to each bank.
-
(Santos, 2018) In Carolina’s class, the students were curious to know what the interclass games would be like, so the teacher organized a discussion circle to understand the reason for their concern. One student commented: “You know, teacher! The interclass games are coming, and we are curious to know what the games will be this year! Many of us did not like last year’s games. What can we do to change some of the events?” After so much concern, the teacher decided to carry out a survey together with the class.
a) How do we carry out this research?
b) Who are those involved in the research?
c) What instruments do we use to collect the data?
d) How can we communicate the data obtained through the research?
-
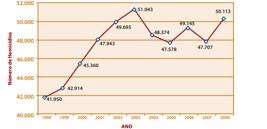
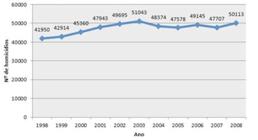
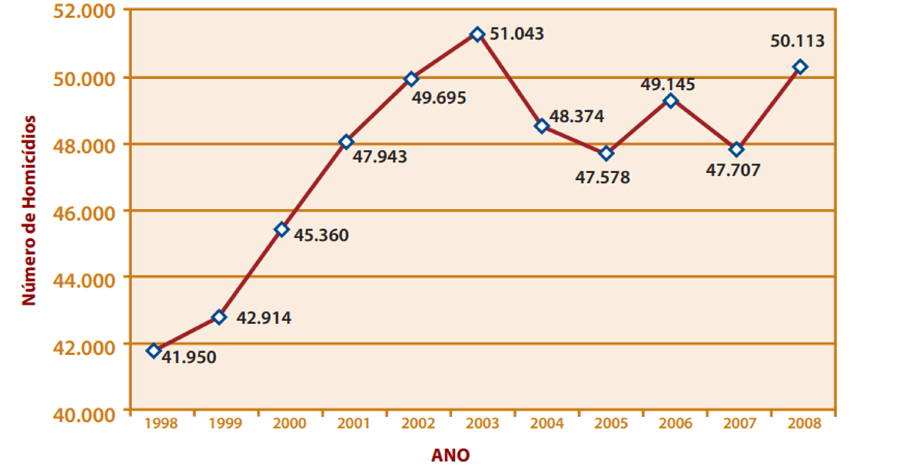
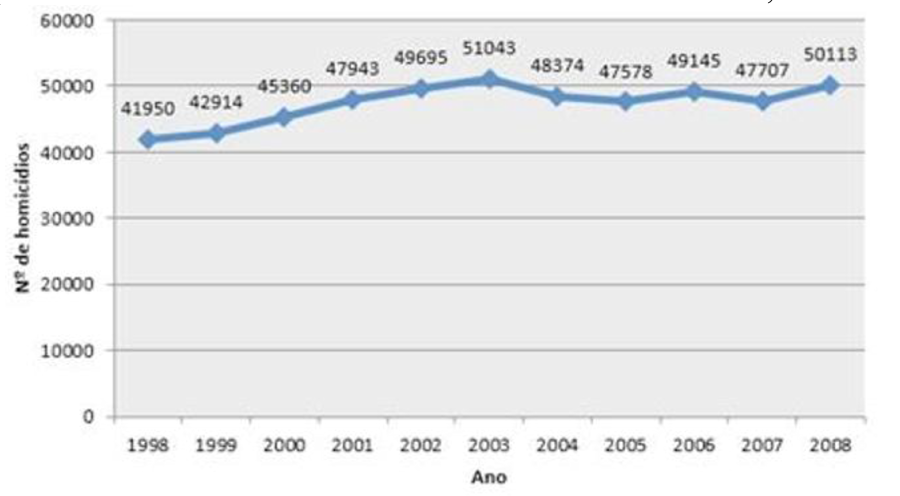
(Borges; Soares, 2016 – adapted) Observe the graph below taken from the Federal Senate website.
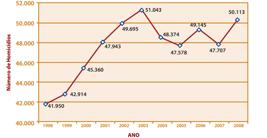
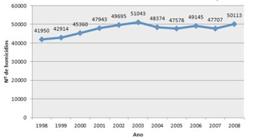
a) What is the difference between the two graphs?
b) Which of the two graphs presents the data in the most appropriate way?
-
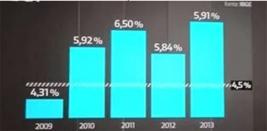
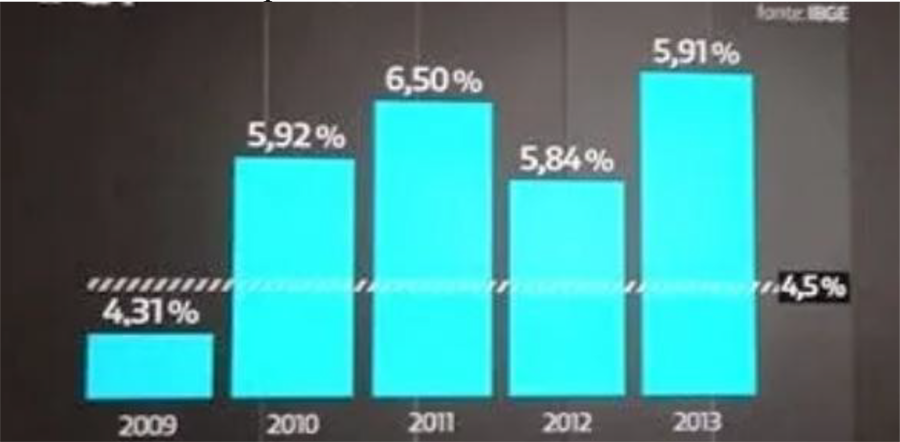
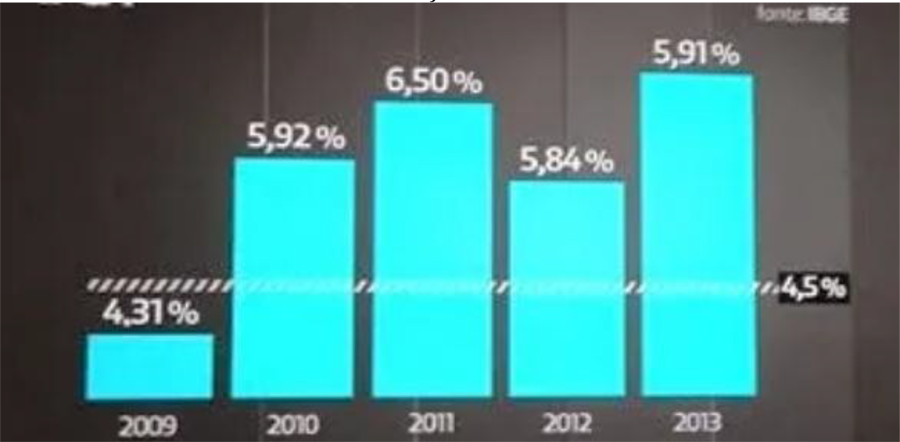
Observe the graph presented on the cable channel Globo News in the program Conta Corrente regarding inflation in Brazil.
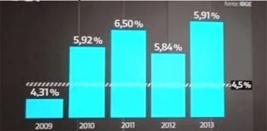
a) What can we conclude about inflation rates in Brazil between 2009 and 2013?
b) Is the type of graph the most appropriate for presenting this information?
c) If you were responsible for constructing this graph, would you add, remove, or change any information? If so, indicate which ones.
-
The following scatter plot presents the illiteracy rate (x) and the crime rate (y), in which these two variables were observed in 50 U.S. states.
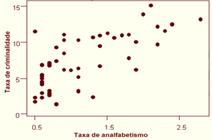
a) Observing the graph, is there any relationship between the illiteracy rate and the crime rate?
b) Knowing there is a linear trend, where the adjusted line is . What would be the crime rate if the illiteracy rate of one of these states were 2.4?
c) Thinking about reducing the crime rate in U.S. states, do you suggest something that could be done?
-
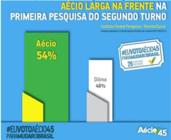
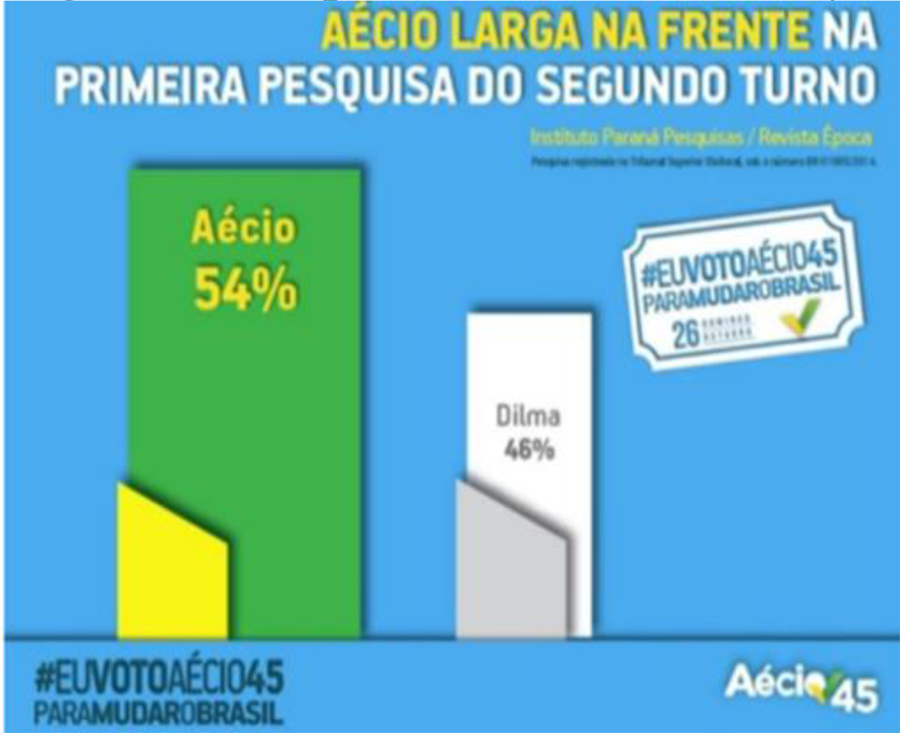
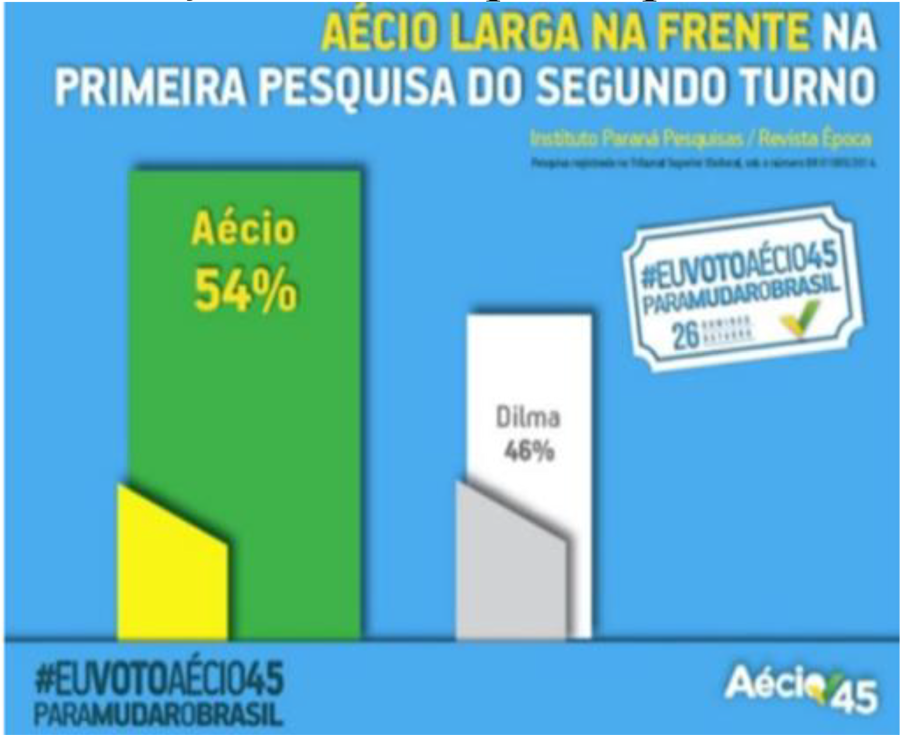
(Santos; Branches, 2019 – adapted) Observe the following graph, which was posted on the social network of the presidential candidate Aécio Neves, according to the El País portal in 2014.
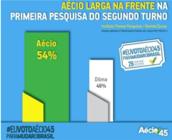
a) What is your analysis when observing the graph?
b) If you were the one responsible for constructing this graph, would you change any element? Would you add any information?
c) How many people participated in this poll? Was it conducted by means of a census or a sample?
Feedback (Costa Júnior, 2019)
-
What is your opinion about activities of this type for teaching Statistics in Basic Education?
-
Did you have difficulty answering any of the proposed activities? Which one(s)? Why?
-
Do you consider that the approaches to content in the teacher education program (pedagogical, didactic, specific, among others) provide support for carrying out the role of teacher in Basic Education? Why?
-
Editor-in-Chief:
Prof. Dr. Marcus Vinicius Maltempi
-
Associate Editor:
Profa. Dra. Celi Espasandin Lopes
The data generated or analyzed during this study are included in the published paper.

 Thumbnail
 Thumbnail
 Thumbnail
 Thumbnail
 Thumbnail
 Source: prepared by the authors
 Source: prepared by the authors
 Source: prepared by the authors
 Source: prepared by the authors
 Source: Borges & Soares (2016)
 Source: Borges & Soares (2016)
 Source:
  Source:
  Source: Santos & Branches (2019).

 Fonte: Borges e Soares (2016)
 Fonte: Borges e Soares (2016)
 Fonte:
 Fonte:
  Fonte: Santos e Branches (2019)