
 Pathological Studies in Uteruses by X-ray Microtomography
Abstract
X-ray computed microtomography (microCT) is an advanced technique for evaluating materials that uses the principle of X-ray attenuation to form high-resolution two- and three-dimensional images. This technique allows detailed visualization of the microstructures of biological samples through the digital combination of hundreds of cross-sections. As a non-destructive technique, microCT requires minimal sample preparation and does not cause damage to the analyzed material. This work aims to use microCT to obtain high-resolution images of the ex-vivo uterus, demonstrating the possibility of visualizing microstructures, detailing tissues and contributing to the anatomical and pathological study of these organs. The research also highlights the relevance and usefulness of microCT as a modern and effective technique for the non-destructive analysis of biological samples, emphasizing its potential in several areas of science and medicine. In addition, it seeks to validate microCT as an essential tool for medical research, providing a deeper understanding of the internal structures of organs and their possible pathologies.
Keywords:
microct; microtomography; X-rays; radiation
Resumo
A microtomografia computadorizada por raios X (microCT) é uma técnica avançada de avaliação de materiais que utiliza o princípio da atenuação de raios X para formar imagens bidimensionais e tridimensionais em alta resolução. Esta técnica permite a visualização detalhada das microestruturas de amostras biológicas através da combinação digital de centenas de cortes transversais. Por ser uma técnica não destrutiva, a microCT requer mínimas preparações das amostras e não causa danos ao material analisado. Este trabalho tem como objetivo utilizar a microCT para obter imagens de alta resolução do útero ex-vivo, demonstrando a possibilidade de visualizar microestruturas, detalhar tecidos e contribuir para o estudo anatômico e patológico desses órgãos. A pesquisa também destaca a relevância e a utilidade da microCT como uma técnica moderna e eficaz para a análise não destrutiva de amostras biológicas, enfatizando seu potencial em diversas áreas da ciência e da medicina. Além disso, busca-se validar a microCT como uma ferramenta essencial para a pesquisa médica, proporcionando um entendimento mais profundo das estruturas internas dos órgãos e suas possíveis patologias.
Palavras-chave:
microCT; microtomografia; raios X; radiação
1. INTRODUCTION
The discovery of X-rays revolutionized medicine, enabling the development of several imaging techniques, such as radiography, fluoroscopy, angiography, mammography and computed tomography (CT). Derived from CT, microcomputed tomography (microCT) is an advanced technique capable of producing high-resolution images of samples, allowing the reconstruction of three-dimensional images through the digital union of hundreds of cross sections of the evaluated material [1].
MicroCT, also known as high-resolution microtomography, is a non-invasive technique that allows the formation of detailed three-dimensional models of samples. This advance was made possible by the combination of X-rays and computing, considered one of the great innovations of the second half of the 20th century (Hessenbruch, 2002). [1]
Although microCT emerged in the medical field, its applications have extended to several other disciplines, including material characterization, archaeology, geology, tissue engineering, dentistry and orthopedics. The formation of the microtomographic image is based on the physical principle of X-rays attenuation, which varies according to the composition and density of the materials (Machado et al., 2014) [2].
The aim of this work is to use X-rays computed microtomography (microCT) to obtain high-resolution images of biological samples, such as the ex-vivo uterus. The study aims to visualize microstructures, detail tissues and contribute to the anatomical and pathological understanding of these organs. In addition, it intends to demonstrate the relevance of microtomography as a modern and effective technique for the non-destructive analysis of biological samples, highlighting its potential in science and medicine.
2. MATERIALS AND METHODS
For this research, a gynecological biological sample (cervix) was used for research purposes, involving the microCT technique, in anatomical studies of the visualization of microstructures and pathologies of human organs. The University Hospital of Vassouras (Vassouras - RJ, Brazil) provided the sample with the approval of the Ethics Committee of the University of Vassouras (#56031916.00000.5290). It came from a patient who underwent a hysterectomy procedure under benign conditions.
The cervix is a fundamental part of the female reproductive system. It is located at the bottom of the uterus and extends into the vagina, acting as a crucial passage between these two organs. The microCT technique allows detailed visualization of the microstructures, offering valuable information for anatomical and clinical research.
The gynecological image was obtained using the V|tomex|m300 X-ray microtomography system. The methodology applied included qualitative analysis and image processing. With the acquired microtomographic images, it was possible to visualize the microstructures of the anatomy of the analyzed organs, demonstrating the effectiveness of the methods employed.
2.1. Sample preparation
The sample was preserved in a 10% formalin solution at room temperature for more than 24 hours to preserve the cellular structure and tissue. After removal from the solution, it was washed twice with distilled water and then immersed in a 10% Lugol's solution (a 1% solution in equilibrium with 2% iodine in distilled water). The concentration containing iodine (a radiodense chemical element) was used to impregnate the samples and improve contrast [1].
In the laboratory, the sample was stored in a refrigerator at temperatures ranging from 2°C to 10°C. It was then removed from the Lugol's solution, washed in running water to remove excess stain/solution, and dried with tissue paper. The sample was vacuum packed, sealed in PVC film (polymer) and fixed on Styrofoam (polystyrene), which served as a support for the sample, ensuring mechanical stability and preventing movement during the image acquisition procedure. The polymer and polystyrene did not interfere with the image quality, as the sample had its density increased by the contrast. After the acquisitions were completed, the samples were returned to the iodine solution to prevent degradation.
2.2. Image acquisition
The images were acquired using a V|tomex|m300 system. The microtomography scanner has a nanofocus X-ray tube with energy projections of up to 180 kV at 15 W, and another high-power microfocus tube with transmission of up to 300 kV at 500 W. The filaments of both X-ray tubes are made of tungsten. The system that cools the tubes provides high performance in beam stability, since the powers are high and the beams are small in size. The detector is a digital, temperature-stable GE PXR250RT detector with an approximate size of 402.8 x 404.8 mm and a 2014 x 2014 matrix (GE MEASUREMENT & CONTROL, 2014).
2.3. MicroCT analysis
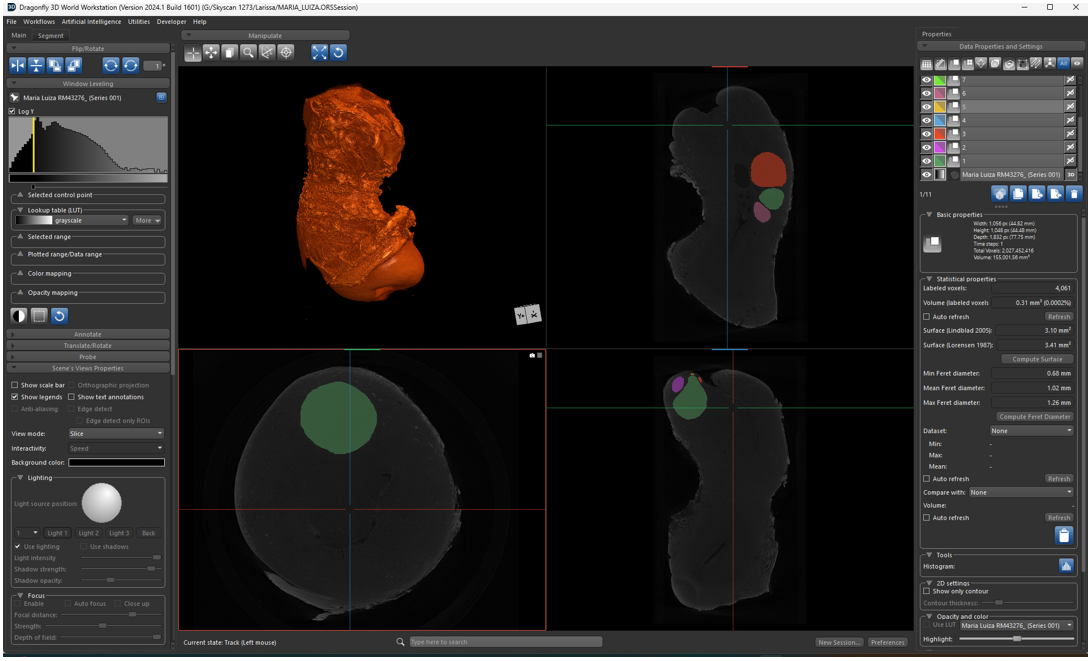
Dragonfly version 2022.2.0.1399 software was used for visualization and analysis of the reconstructed images. Dragonfly offers robust tools for visualization, 3D reconstruction, segmentation and quantitative analysis of images, allowing detailed and accurate analysis.
A significant advantage is Dragonfly's free license, which provides many features at no cost, ideal for researchers, students, and professionals. Its intuitive interface makes it easy to use, even for beginners, making it an excellent choice for a variety of scientific and industrial applications, such as materials analysis and life sciences.
In one of the program interface panels, we can select 3D and 2D viewing simultaneously, dividing the main screen into four panels, one containing the 3D reconstruction and the others containing axial, transverse and coronal sections in two-dimensional images.
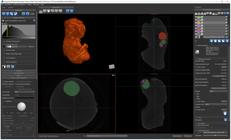
In the two-dimensional images, the myomas were mapped and then drawn as regions of interest (ROIs). The drawings were made in some slices and the initial image and the final image were also delimited; the interpolation function was used to join the slices and the drawings made, forming a region of interest for the myoma. This process was performed for each myoma found, totaling 9 myomas.
3. RESULTS AND DISCUSSIONS
Each region of interest was selected individually to undergo the Volume Thickness process, where this region is reconstructed three-dimensionally on a color scale according to its thickness. It is possible to visualize the myomas in the three-dimensional model by choosing to visualize the regions of interest that have undergone the volume thickness process and reducing the opacity of the organ, as shown in Figure 2.
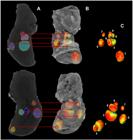
Regions of interest (ROI) in two-dimensional images (Fig. 2a) and applied in 3D reconstruction (Fig. 2b), three-dimensional volumes with color coding corresponding to thickness (Fig. 2c)
From the regions of interest drawn and interpolated, it was possible to obtain results from the delimited area; the program quantifies the regions and returns the values of surface, volume, minimum and maximum diameter, represented in Table 2.
3.1. Statistical analysis
To better understand the characteristics and behavior of uterine myomas, a series of statistical analyses were performed using the data obtained in the quantification and which are presented in Table 2. These analyses include multiple regression and K-means cluster analysis. The analysis was performed in the RStudio program version 2023.3.0.
3.1.1. Multiple regression
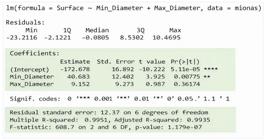
Multiple regression was used to understand which factors influence myoma surface area. The results indicate that the minimum diameter (Min_Diameter) is a significant predictor of the myoma surface area, with a p-value=0.00775. In contrast, the maximum diameter (Max_Diameter) did not show significance (p-value=0.36174). The regression model explained 99.35% of the variation in the myoma surface area (adjusted R²=0.9935). This suggests that myomas with a larger minimum diameter tend to have a larger surface area. Therefore, the minimum diameter may be an important factor in assessing the superficial extent of myomas and should be considered in clinical evaluations.
The importance of the minimum diameter (Min_Diameter) as a significant predictor of the myoma surface area (p-value=0.00775) suggests that MicroCT provides high-resolution insights into tumor morphology that transcend conventional linear measurements. In clinical practice, myoma evaluation is largely centered on the dominant myoma diameter and the uterine volume obtained via ultrasound or MRI for monitoring and surgical planning [6, 10]. However, this high-resolution MicroCT study demonstrates that the irregular shape and minimum dimensions of myomas are crucial factors for quantifying their surface extension. Advanced imaging studies, such as 3D ultrasound, support this, indicating that 3D volumetric measurement provides values closer to the actual volume compared to 2D measurements [8, 12]. Our finding, highlighting the minimum diameter as a predictor of surface, reinforces the utility of MicroCT in the detailed analysis of myoma's non-spherical morphology, a characteristic potentially correlated with vascularization and growth rate.
For myoma volume:
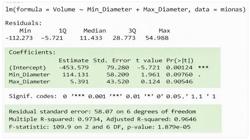
For volume, minimum diameter showed a marginal influence (p-value=0.09760), and maximum diameter was not significant (p-value=0.90546). The regression model explained 96.46% of the variation in myoma volume (adjusted R² = 0.9646). This suggests that, as with surface area, minimum diameter may be a more relevant indicator of myoma volume than maximum diameter. Understanding this relationship is crucial to assessing the progression and impact of myomas on the uterus.
Measurements such as minimum diameter can be monitored over time to assess myoma progression and adjust treatment plans as needed. Ongoing monitoring is essential to ensure that treatment remains appropriate as myomas evolve.
3.1.2. K-means cluster analysis
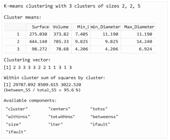
K-means clustering analysis identified three distinct clusters of myomas:
-
Cluster 1: Myomas with moderate surface area and volume.
-
Cluster 2: Myomas with high surface area and volume.
-
Cluster 3: Myomas with low surface area and volume.
This categorization can be useful for diagnosis and treatment planning. Myomas in Cluster 2, with larger surface areas and volumes, may require more aggressive interventions, while myoma in Clusters 1 and 3 may be treated with less intensive approaches. Cluster analysis provides a practical way to categorize myomas based on their characteristics and may help in personalizing treatments.
The K-means clustering (k=3) of myomas based on morphometric characteristics offers direct clinical implications for risk stratification. Cluster 2, defined by high surface area and volume, represents large-sized myomas. Clinically, myomas larger than 10 cm are typically more likely to cause significant symptoms (mass effect) or intense bleeding, often leading to recommendations for surgical intervention (hysterectomy) or procedural treatment (embolization) [10, 11]. In contrast, Cluster 3, which groups myomas with low surface area and volume, aligns with the recommended course of expectant management, where small, asymptomatic myomas require periodic surveillance rather than immediate treatment [9, 10]. This objective categorization validates MicroCT not only as a visualization tool but also as a quantitative method for stratifying pathologies and aiding in clinical decision-making, reinforcing that management should be personalized based on the myoma's quantified dimensions and characteristics [7] .
The information obtained from these analyses may allow for personalized treatment for patients. Large myoma (Cluster 2) may require more intensive treatments, while smaller myomas (Cluster 3) may be monitored less frequently. Personalizing treatment based on myoma characteristics may improve the effectiveness of interventions and reduce risks for patients.
4. CONCLUSIONS
The study confirmed the high effectiveness of X-ray microcomputed tomography (MicroCT) for obtaining high-resolution images of microstructures in ex-vivo biological samples, such as the uterus, enabling detailed visualization of anatomical and pathological features. The methodology, supported by careful sample preparation using the Lugol's solution contrast agent, successfully validated MicroCT as an essential non-destructive quantitative tool in biomedical research for the detailed analysis of soft tissues. A major contribution of this work lies in the quantitative statistical analysis: multiple regression revealed the minimum diameter as a significant predictor of the myoma surface area, and K-means clustering provided objective cluster grouping (e.g., Cluster 2 for large myomas). This analysis demonstrates that MicroCT can objectively stratify pathologies and directly assists in personalized treatment planning [9]. Ultimately, the ability of MicroCT to provide detailed three-dimensional images without destroying samples establishes it as an indispensable technique for future research and diagnostics, contributing significantly to the advancement of biomedical sciences.
ACKNOWLEDGMENTS
This research was supported by the Nuclear Engineering Institute. We thank our colleague from National Water and Sanitation Agency (ANA) for comments that greatly improved the manuscript.
-
This study was supported by the Coordination for the Improvement of Higher Education Personnel (CAPES grant 88887.476179/2020-00 to OMOA) and National Council for Scientific and Technological Development - CNPq, INCT-INAIS (grant 406303/2022-3 and productivity fellowships 314225/2021 to RTL).
DATA AVAILABILITY STATEMENT
The authors declare that the data supporting the results of this study are available in the article. Derived data supporting the conclusions of this study are available upon request from the corresponding author.
REFERENCES
- MOREIRA, A. J. P. A microtomografia de raios X para o estudo da anatomia da microestrutura de órgãos e suas patologias. Dissertação de Mestrado, Programa de Pós-graduação em Engenharia Nuclear, COPPE/UFRJ, 2021.
-
QUEIROZ, P. J. B., et al. Microtomografia computadorizada: princípios de funcionamento e utilização em amostras biológicas. Enciclopédia Biosfera, vol. 16, p. 1073, 2019.
» https://doi.org/10.18677/encibio_2019a90 -
LIMA, R. S.; AFONSO, J. C. Raios-x: fascinação, medo e ciência. Química Nova, vol. 32, p. 263-270, 2009
» https://doi.org/10.1590/s0100-40422009000100044 - HOFFMANN, E. C. Estudo de parâmetros físicos envolvidos com a qualidade da imagem em tomografia computadorizada de feixe cônico. Trabalho de Conclusão de Curso, Bacharelado em Física Médica, PUCRS, 2010.
- ALONSO, T. C., et al. Parâmetros relacionados à qualidade da imagem em tomografia computadorizada-TC. X Congreso Regional Latinoamericano IRPA, 2015.
- SILVA, N. A. C. da, et al. Melhora em parâmetros de qualidade de vida e redução do volume uterino após embolização de artérias uterinas. Revista Brasileira de Ginecologia e Obstetrícia, vol. 33, n. 5, p. 201-206, 2011.
- SOCIEDADE PORTUGUESA DE GINECOLOGIA. Miomas Uterinos 2024. Lisboa: SPG, 2024. 103 p.
- ZLOTNIK, S. E., et al. Measuring the volume of uterine fibroids using 2- and 3-dimensional ultrasound and comparison with histopathology. Journal of Ultrasound in Medicine, v. 32, n. 9, p. 1599-1605, 2013.
-
STEWART, E. A.; LAUGHLIN-TOMMASO, S. K. Miomas uterinos (leiomiomas) - epidemiologia, características clínicas, diagnóstico e história natural. UpToDate, 2021. Disponível em: https://pt.scribd.com/document/500222594/
» https://pt.scribd.com/document/500222594/ - BRASIL. MINISTÉRIO DA SAÚDE. Mioma Uterino. Brasília: Secretaria de Atenção à Saúde, 2017.
-
AMERICAN FIBROID CENTERS. Qual tamanho de mioma é normal?. Blog American Fibroid Centers, 2024. Disponível em: https://fibroidexpert.com/pt/blog/which-size-of-fibroid-is-normal/
» https://fibroidexpert.com/pt/blog/which-size-of-fibroid-is-normal/ - ZIVKOVIĆ, N., et al. Measuring the volume of uterine fibroids using 2- and 3-dimensional ultrasound and comparison with histopathology. Archives of Gynecology and Obstetrics, vol. 288, n. 6, p. 1319–1324, 2013.
Edited by
-
SCIENTIFIC EDITOR:
Prof. Dr. Bernardo Maranhão Dantas http://orcid.org/0000-0002-2388-6073
-
SCIENTIFIC EDITOR:
Prof. Dr. Alfredo Lopes Ferreira Filho http://orcid.org/0000-0002-0806-1284
-
SCIENTIFIC EDITOR:
Prof. Dr. Fernando Roberto de Andrade Lima
-
SCIENTIFIC EDITOR:
Dra. Carmen C. Bueno http://orcid.org/0000-0001-7881-7254
-
SCIENTIFIC EDITOR:
Dra. Josemary A. C. Gonçalves http://orcid.org/0000-0002-8940-9544

 Source: Printscreen of Dragonfly's analytics page.Figure 1
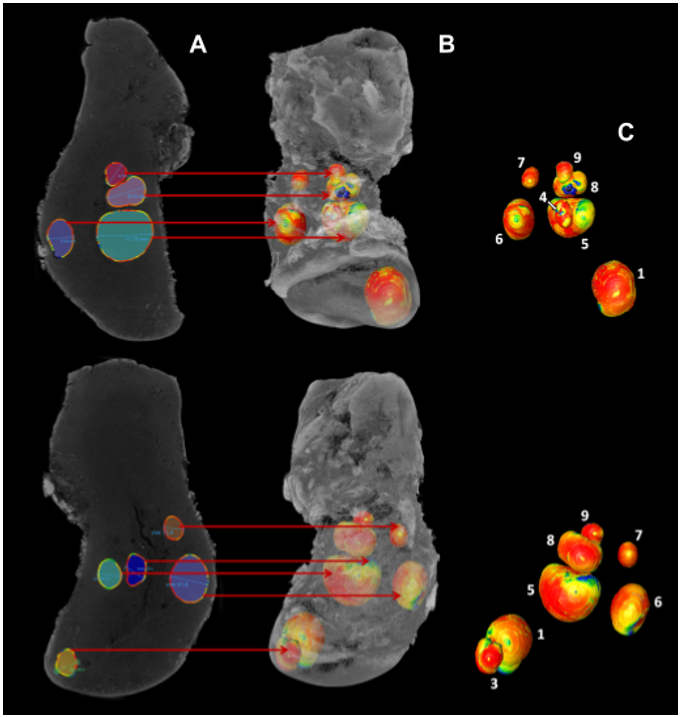 Figure 2
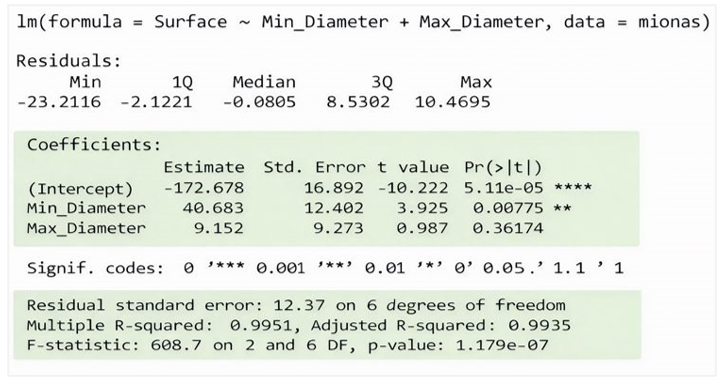 Figure 3
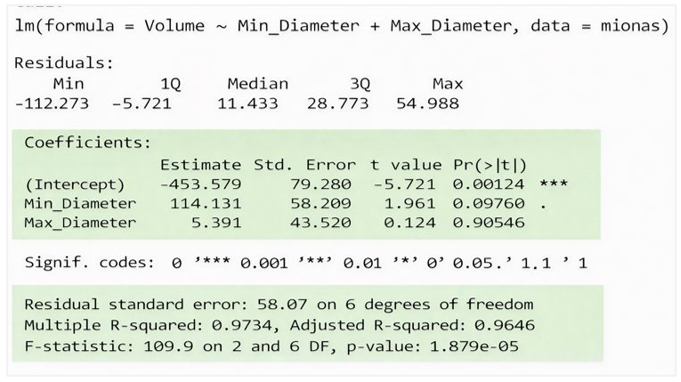 Figure 4
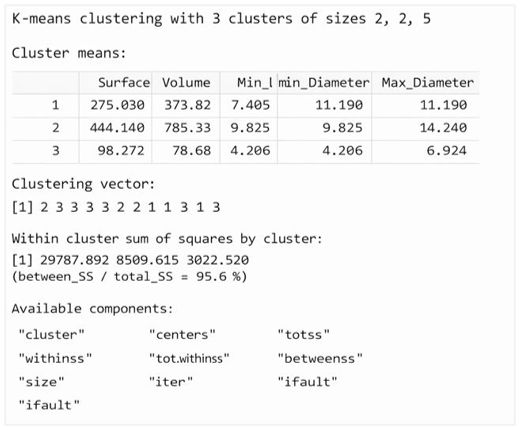 Figure 5