 Development of healthy fruit- and vegetable-based jams with propolis: Low-calorie and rich in antioxidant properties
Abstract
The incorporation of bioactive ingredients into various food matrices presents a challenge in developing functional foods, as the final product must maintain good organoleptic characteristics such as appearance, taste, smell, and color. This study aimed to formulate jams made from carrot and yellow plum (JCP), incorporating 0.15% and 0.20% propolis, respectively, to confer functional properties and ensure sensory acceptance. An experimental design was implemented, and physicochemical, functional, and sensory analyses were conducted. Parameters evaluated included pH, color, moisture content, water activity (aw), antioxidant capacity (AC) measured by the Trolox equivalent antioxidant capacity (TEAC) test, and total polyphenol content (TPC) determined using the Folin-Ciocalteu method. The results indicated that the formulation with 0.15% propolis (carrot and yellow plum) received higher consumer acceptance, attributed to its pleasant sweet and acidic flavor attributes, making it an attractive market option. The formulation with resin exhibited greater antioxidant activity compared to the base formulation, highlighting the importance of propolis in enhancing functional properties. Moreover, the analysis revealed that its incorporation not only enriched the nutritional profile but also increased its potential as a functional food. This finding emphasizes the need to balance bioactive ingredients with sensory attributes to develop marketable products, showcasing the feasibility of creating healthy and functional jams that meet the growing demand for products offering health benefits without compromising the consumer's sensory experience. Overall, these innovative formulations represent a promising approach to increasing fruit and vegetable consumption while addressing public health challenges associated with dietary habits. They contribute to the development of healthy, functional products that align with consumer demands for health benefits without compromising sensory appeal
Keywords:
Propolis resin; Sensory acceptance; HPLC; Polyphenols; Bioactive ingredients; Functional food
Highlights
Jams made from carrot and yellow plum with natural antioxidant power was obtained, due to the polyphenols from propolis
Isomalt masked the bitter taste of propolis, improving sweetness, smoothness, and acceptability
The JCP with propolis responds to healthy trends, reducing artificial compounds and promoting natural benefits
1 Introduction
In recent decades, Argentina has experienced significant changes in food consumption behaviors, styles, and habits, altering the nutritional landscape of its population. The Nutritionist Manual, ENNyS 2 (Argentina, 2019), reveals alarming data showing a high incidence of Non-Communicable Diseases (NCDs), with obesity being the most common form of malnutrition. In August 2018, the World Health Organization (WHO) published a series of recommendations emphasizing that maintaining a healthy diet throughout life helps prevent malnutrition in all its forms, as well as various NCDs and disorders (World Health Organization, 2023). Among the recommendations is the consumption of at least 400 g (five servings) of fruits and vegetables daily, excluding starchy vegetables; ensuring that less than 30% of daily caloric intake comes from fats; consuming less than 5 g of salt per day; and that less than 10% of total caloric intake comes from free sugars. Regarding sugar consumption, in 2015, WHO issued guidelines aimed at formulating recommendations to reduce the risk of NCDs in adults and children, focusing particularly on the prevention and control of unhealthy weight gain and dental caries (World Health Organization, 2015). In this context, the WHO established a strong recommendation and a conditional recommendation regarding sugar intake, setting levels below 10% and 5% of total daily caloric intake.
Low consumption of fruits and vegetables has been widely associated with poor health and an increased risk of developing NCDs, such as cardiovascular diseases, type 2 diabetes, and certain types of cancer (Budreviciute et al., 2020). Fruits and vegetables are not only rich in essential vitamins and minerals but also provide dietary fiber, which is vital for the proper functioning of the digestive system and the prevention of diseases such as constipation and colon cancer. Moreover, they contain bioactive compounds such as phytosterols, flavonoids, and other antioxidants that, although not considered essential nutrients, play a crucial role in protecting the body against oxidative stress, inflammation, and cellular degeneration (Padayachee et al., 2017). Adequate and varied consumption of fruits and vegetables helps maintain nutritional balance, supports body weight control, and can significantly reduce the risk of developing multiple diseases. According to the World Health Organization (2019), a diet that includes at least five daily servings of fruits and vegetables helps ensure the intake of these essential nutrients and promotes optimal health throughout life. Furthermore, diversity in the consumption of fruits and vegetables ensures that the body receives a wide range of phytonutrients, each with protective and preventive properties against various pathologies (Arumugam et al., 2021).
According to the Dietary Guidelines for the Argentine Population (Guías Alimentarias para la Población Argentina - GAPA) developed by the Ministry of Health (Argentina, 2016), a daily intake of 700 g of fruits and vegetables is recommended (400 g of non-starchy vegetables and 300 g of fruits). However, the most recent National Household Expenditure Survey (Encuesta Nacional de Gastos de los Hogares - ENGHo) conducted in 2012 (Instituto Nacional de Estadística y Censos, 2014) indicated that the average consumption is 135 g of non-starchy vegetables and 93 g of fruits, totaling 228 g, which only covers 32.5% of the daily recommended intake in our country (Giacobone et al., 2018).
Currently, in the development of new mass-consumption products, there is a focus on replacing artificial compounds while also reinforcing or diversifying the profile of beneficial compounds provided to consumers. In response to this, the natural content of polyphenols with high antioxidant capacity found in propolis, a by-product of the beehive, represents an attractive option as a functional ingredient. This product is made from certain plant species collected by bees in the form of resinous, gummy, and balsamic substances, waxes, essential oils, and pollen, which have a viscous consistency. These materials are transported into the hive and partially modified by the bees' salivary secretions. The composition of propolis varies depending on the plant species of origin and its function within the hive (Argentina, 2023).
Propolis is known for its numerous functional properties derived from its rich composition of bioactive compounds such as flavonoids, phenols, terpenes, and aromatic acids (Irigoiti et al., 2021). Among its main benefits are its antioxidant properties, which help neutralize free radicals and reduce oxidative stress in cells. It also possesses antibacterial, antifungal, and antiviral properties, making it an effective agent in preventing infections (Zulhendri et al., 2021). Additionally, propolis acts as a potent anti-inflammatory and immunomodulator, enhancing immune response and aiding tissue recovery. These qualities make it a valuable component in functional foods and products aimed at improving overall health (Magnavacca et al., 2022; El-Seedi et al., 2022).
The incorporation of propolis into jam formulations positions it as a functional food that can be part of a mass-consumption diet. When consumed frequently, it may help reduce the risk of developing Non-Communicable Diseases (NCDs) (Contieri et al., 2022). In addition to its recognized antibacterial properties, propolis is attractive to the food industry due to its high concentration of amino acids and other nutrients, making it a valuable resource for human nutrition. In fact, it has been found to contain 20 of the 22 amino acids necessary for protein synthesis in the body (Maicelo-Quintana et al., 2024), further reinforcing its potential as a nutritional supplement and its ability to enhance the quality of food products. This nutritional profile, combined with its functional properties, suggests that propolis can play an important role in promoting a healthy diet and preventing diseases (Rivera-Yañez et al., 2020.
However, for such a development to be successful, it is essential to conduct sensory studies that enable the creation of a product that masks the intense bitter flavor characteristic of propolis, derived from the functional compounds intended to be incorporated (Cedeño-Pinos et al., 2021). This will ensure that the jelly is not only health-beneficial but also pleasant to the consumer's palate.
Considering the above, the objective of this work was to develop a fruit- and vegetable-based jam without added simple sugars, incorporating propolis extract as a source of bioactive compounds to enhance its antioxidant capacity and confer functional properties. Additionally, physicochemical, functional, and sensory characterizations were carried out.
2 Material and methods
2.1 Materials
The ingredients used to make the jam (all food grade) were: carrot (31.67%), yellow plum (31.67%), maltodextrin (24.17), isomalt (8.40%), pectin (0.22%), citric acid (0.2%), stevia (0.2%), sucralose (0.2%), agar-agar (0.18%), propolis retained in calcium carbonate (3.1%) and gelling agents (purchased in the local market). Propolis was provided by the Gualeguaychú Beekeeping Cooperative (Entre Ríos, Argentina). All the reagents used in the different determinations were of analytical grade.
2.1.1 Experimental design of mixtures to select gelling agents for the preparation of sugar-free jam
A mixture model was applied using a D-optimal experimental design with four factors and four responses (Design Expert 11.0) to establish the limits and extreme concentrations of gelling agents, aiming to achieve a product with a texture similar to that of commercial jam. The four selected factors were the ingredients responsible for the textural characteristics of the “jam-like” product: pectin (0.13-0.37%), agar-agar (0.13-0.37%), isomalt (8.00-24.47%), and maltodextrin (8.00-24.47%). The four response variables were the acceptability of the attributes texture, smoothness, sweetness, and overall sensory acceptability of the jams (Table 1), evaluated through sensory analysis with an internal panel. This panel consisted of 16 untrained assessors, to identify sensorially acceptable formulations (Watts et al., 1992; Stone et al., 2020). A 5-point hedonic scale was used for the evaluation of the jam formulations: 1) Dislike; 2) Dislike slightly; 3) Neither like nor dislike; 4) Like slightly; 5) Like. The quantification of the response parameters was determined as the average score for each attribute.
Impact of the factors (%) of the formulations proposed by the mixture design and average liking values from the members of the internal sensory panel.
2.1.2 Purification of propolis resin using calcium carbonate
The extraction of propolis was carried out following the procedure described by Archaina et al. (2016), with some modifications. Five grams of raw propolis were weighed and mixed with 100 mL of 89% ethanol. The mixture was agitated for 30 minutes at 35 °C. Once the extraction process was completed, the mixture was centrifuged at 2500 rpm for 5 minutes. The supernatant was collected and kept at 0 °C for 24 hours to allow the insoluble waxes to precipitate. Finally, the resins were retained using calcium carbonate as a matrix, resulting in two powders: one containing 6.5% and the other containing 5% resins, which were used in the formulations to be developed.
2.1.3 General process for jam production
The methodology used for preparing the jam was divided into six stages: I) the solid ingredients, maltodextrin, isomalt, stevia, sucralose, pectin, agar-agar, and citric acid, were weighed and then properly mixed. II) the carrots and plums were processed, mixed in a pot, and taken to cooking. III) the previously mixed solid ingredients were gradually added to the carrot and plum mixture while stirring constantly to prevent lump formation. Once the solids dissolved, the mixture was heated to approximately 80 °C. IV) the mixture was maintained at 80 °C for 30 min to ensure the cooking and softening of the fruits, as well as the elimination of pathogenic and spoilage microorganisms. V) once the cooking time has elapsed, the pot was removed from the heat and allowed to cool to 55-60 °C to minimize the degradation of bioactive components (Feng et al., 2021). Then, the propolis resins retained in the calcium carbonate at two different concentrations were added, stirring until complete homogenization. VI) the hot mixture was poured into previously sterilized glass jars (sterilized by immersion in boiling water), then covered, and stored in the refrigerator until ready use.
2.1.4 Sensory analysis to establish propolis concentration
To determine the most suitable final concentration of propolis resin, two jam formulations were developed with propolis resin content of 0.15% (JCP15) and 0.20% (JCP20). A consumer panel of 94 adults (aged 18 to 65) from the Faculty of Bromatology at the National University of Entre Ríos (FB-UNER) evaluated the intensity of the characteristic descriptors and the overall liking to identify the one with the highest acceptance.
To assess the intensity of the descriptors texture, smoothness, color, bitterness, acidity, sweetness, and fruitiness, a 5-point Just About Right (JAR) scale was used. Data was then restructured into three categories: Low (1 and 2), Just Right (3), and High (4 and 5) (Bruzzone et al., 2012; Diapri et al., 2024). The degree of overall liking was measured using a hedonic scale from 1 (I dislike it a lot) to 7 (I like it a lot). Additionally, a penalty analysis was conducted to assess the impact of each attribute on overall acceptability at intensity levels below and above the ideal point. This analysis identifies which attributes negatively affect acceptance and helps to understand the most accepted characteristics (Palazzo & Bolini, 2017).
The penalty analysis was based on two types of data: preference data from the overall liking index and data from the JAR scale, which was restructured into three groups. The frequency percentage of consumers who considered each attribute outside their “ideal point” was calculated, and the “degree of penalty” for each attribute was determined. Attributes that affected more than 25% of consumers and had a penalty greater than 1 were considered “penalized”.
2.2 Characterization of vegetable jams with and without propolis
2.2.1 Physicochemical characterization
2.2.1.1 Water content and pH
The water content of the fruit was determined gravimetrically by official method 925.09 (Association of Official Analytical Chemists, 2005). Moisture was expressed as grams of water per 100 grams. The pH was determined on a fraction of crushed fruit using the official method 945.27 (Association of Official Analytical Chemists, 2005) and a HI 2223 pH meter (Hanna®, Buenos Aires, Argentina).
2.2.1.2 Water activity
Water activity (aw) was determined by official method 925.09 (Association of Official Analytical Chemists, 2005). Measurements were made at 25 ± 3 °C using an Aqualab 3TE dew point hygrometer (Decagon Devices, Washington, USA) with a sensitivity of ±0.003, which was previously calibrated with saturated salt solutions.
2.2.1.3 Color
Surface color was measured using a portable Hunter Lab Mini Scan EZ photocolourimeter (USA) using the D65 illuminant and 2° observer angle. CIELab space L*, a*, b* parameters were recorded (Martínez-Girón et al., 2017). Results were reported as the average of 10 measurements ± standard deviation.
2.2.2 Antioxidant components determination
2.2.2.1 Extracts for the determination of antioxidant components
A methanolic extract (ME) was prepared according to Archaina et al. (2016) with some modifications. Subsequently, ~1.0 g of the sample was mixed with 5 mL of methanol under a magnetic stirrer for 5 min, and then, it was vacuum-filtrated. The supernatant was recovered, and the sample was washed with methanol up to 25 mL using a volumetric flask. The ME was stored at -80 °C until the colorimetric determination of total phenolic compounds (TPC) and antioxidant capacity were performed.
2.2.2.2 Total Phenolic Compounds (TPC)
The determination was conducted using the Folin-Ciocalteu method as described by Archaina et al. (2016). In this procedure, 100 μL of the ME was mixed with 900 μL of distilled water, 100 μL of Folin–Ciocalteu reagent (Extrasynthese, China), and 600 μL of 20% sodium carbonate solution. The samples were then incubated for 30 min in a thermostatic bath at 40 °C. After incubation, the absorbance was measured at 765 nm using a spectrophotometer. The results were expressed as grams of gallic acid per kilogram of jam.
2.2.2.3 Polyphenol profile
A High Performance Liquid Chromatography (HPLC) technique, as described by Spácil et al. (2008) with modifications, was employed to determine the polyphenolic compound profile. A sample weighing 1 g was dissolved in 50 mL of a solvent mixture of ethanol and water (87:13). An aliquot was then filtered using a 0.45 µm nylon membrane and injected (20 µL) into the HPLC system (Waters 1525, USA), which was equipped with a photodiode array detector (Waters 2996, USA). A Lichrospher® 100 RP-18e column (250 × 4 mm, 5 μm) and an automatic injector (Waters 2707, USA) were utilized for the analysis. The mobile phase consisted of acetonitrile (Phase A) and a mixture of water and phosphoric acid (99:1) (Phase B). The chromatographic gradient was operated at a flow rate of 1 mL/min, maintained at 30 °C, with a maximum runtime of 70 minutes. Detection was carried out over a wavelength range of 200-450 nm.
To identify and quantify the various constituents in the sample, standards from Sigma-Aldrich® were used, including caffeic acid, benzoic acid, ferulic acid, cinnamic acid, p-coumaric acid, vanillinic acid, protocatechuic acid, sinapic acid, chrysin, ellagic acid, quercetin, pinocembrin, gallic acid, chlorogenic acid, galangin, kaempferol, and apigenin. These standards were prepared in the ethanolic phase at a concentration of 200 ppm and filtered before injection into the chromatographic system using a 0.45 µm syringe filter. The quantification of these compounds was performed using the external standard technique. The area under the curve for each peak identified in the chromatogram was measured and compared with the corresponding standard area (Schenk et al., 2021). The concentration of polyphenols was then calculated, taking into account the dilution of the sample, and expressed in micrograms per 100 g of sample.
2.2.2.4 Antioxidant Capacity (AC)
The AC was determined using the Trolox Equivalent Antioxidant Capacity (TEAC) method with the 2,2-azinobis-[3-ethylbenzothiazoline-6-sulfonic acid] (A1888-Sigma-Aldrich, USA) to produce the cationic free radical (ABTS•+). ABTS•+ was generated through the interaction of the ABTS•+ reagent and potassium persulfate. The solution was allowed to stand in the dark at room temperature for 16 h, after which it was diluted with 0.01 M phosphate buffer to achieve an absorbance of 1.00 ± 0.01 at 734 nm. An aliquot of 100 μL of the ME was mixed with 1.9 mL of the ABTS•+ solution, and the absorbance was measured at 734 nm. The results were expressed as milliequivalents of Trolox per kilogram of jam (Rivero et al., 2021).
2.2.2.5 Statistical analysis
The results were statistically analyzed by analysis of variance (ANOVA) to determine significant differences between the samples. The analysis of the means was performed using the Fisher LSD procedure at p < 0.05, and multivariate of Principal Components Analysis (PCA) and cluster analysis were used. Statistical analyses were performed (PCA), and the statistical analyses were done using InfoStat v. 2018 for Windows.
3. Results and discussion
3.1 Ideal formulation of the sugar-free jam
The full mixture design generated twenty-two (22) experimental points, including three replicates of the center point, each with their respective responses, values that can be found in the Supplementary Material (Table 1s). The best model was fitted with a low standard deviation and a high r2 (0.86), suggesting a good level of accuracy in predicting sensory responses. The p values of the acceptable model were less than 0.1, while the pvalues for lack of fit were greater than 0.05, indicating that the model fits the experimental data well.
The ANOVA results, presented in Table 2s of the supplementary material, show that texture fitted a cubic model, indicating that this characteristic of the jam, which includes carrot and yellow plum, depends on complex interactions among the ingredients, resulting in nonlinear effects. On the other hand, smoothness fitted a linear model, suggesting that this response varies directly and proportionally with the proportions of the components, with no significant interactions. Finally, both sweetness and overall acceptability fitted a quadratic model, suggesting that the perception of acceptability is mainly influenced by sweetness and that both responses are affected by synergistic interactions among the ingredients.
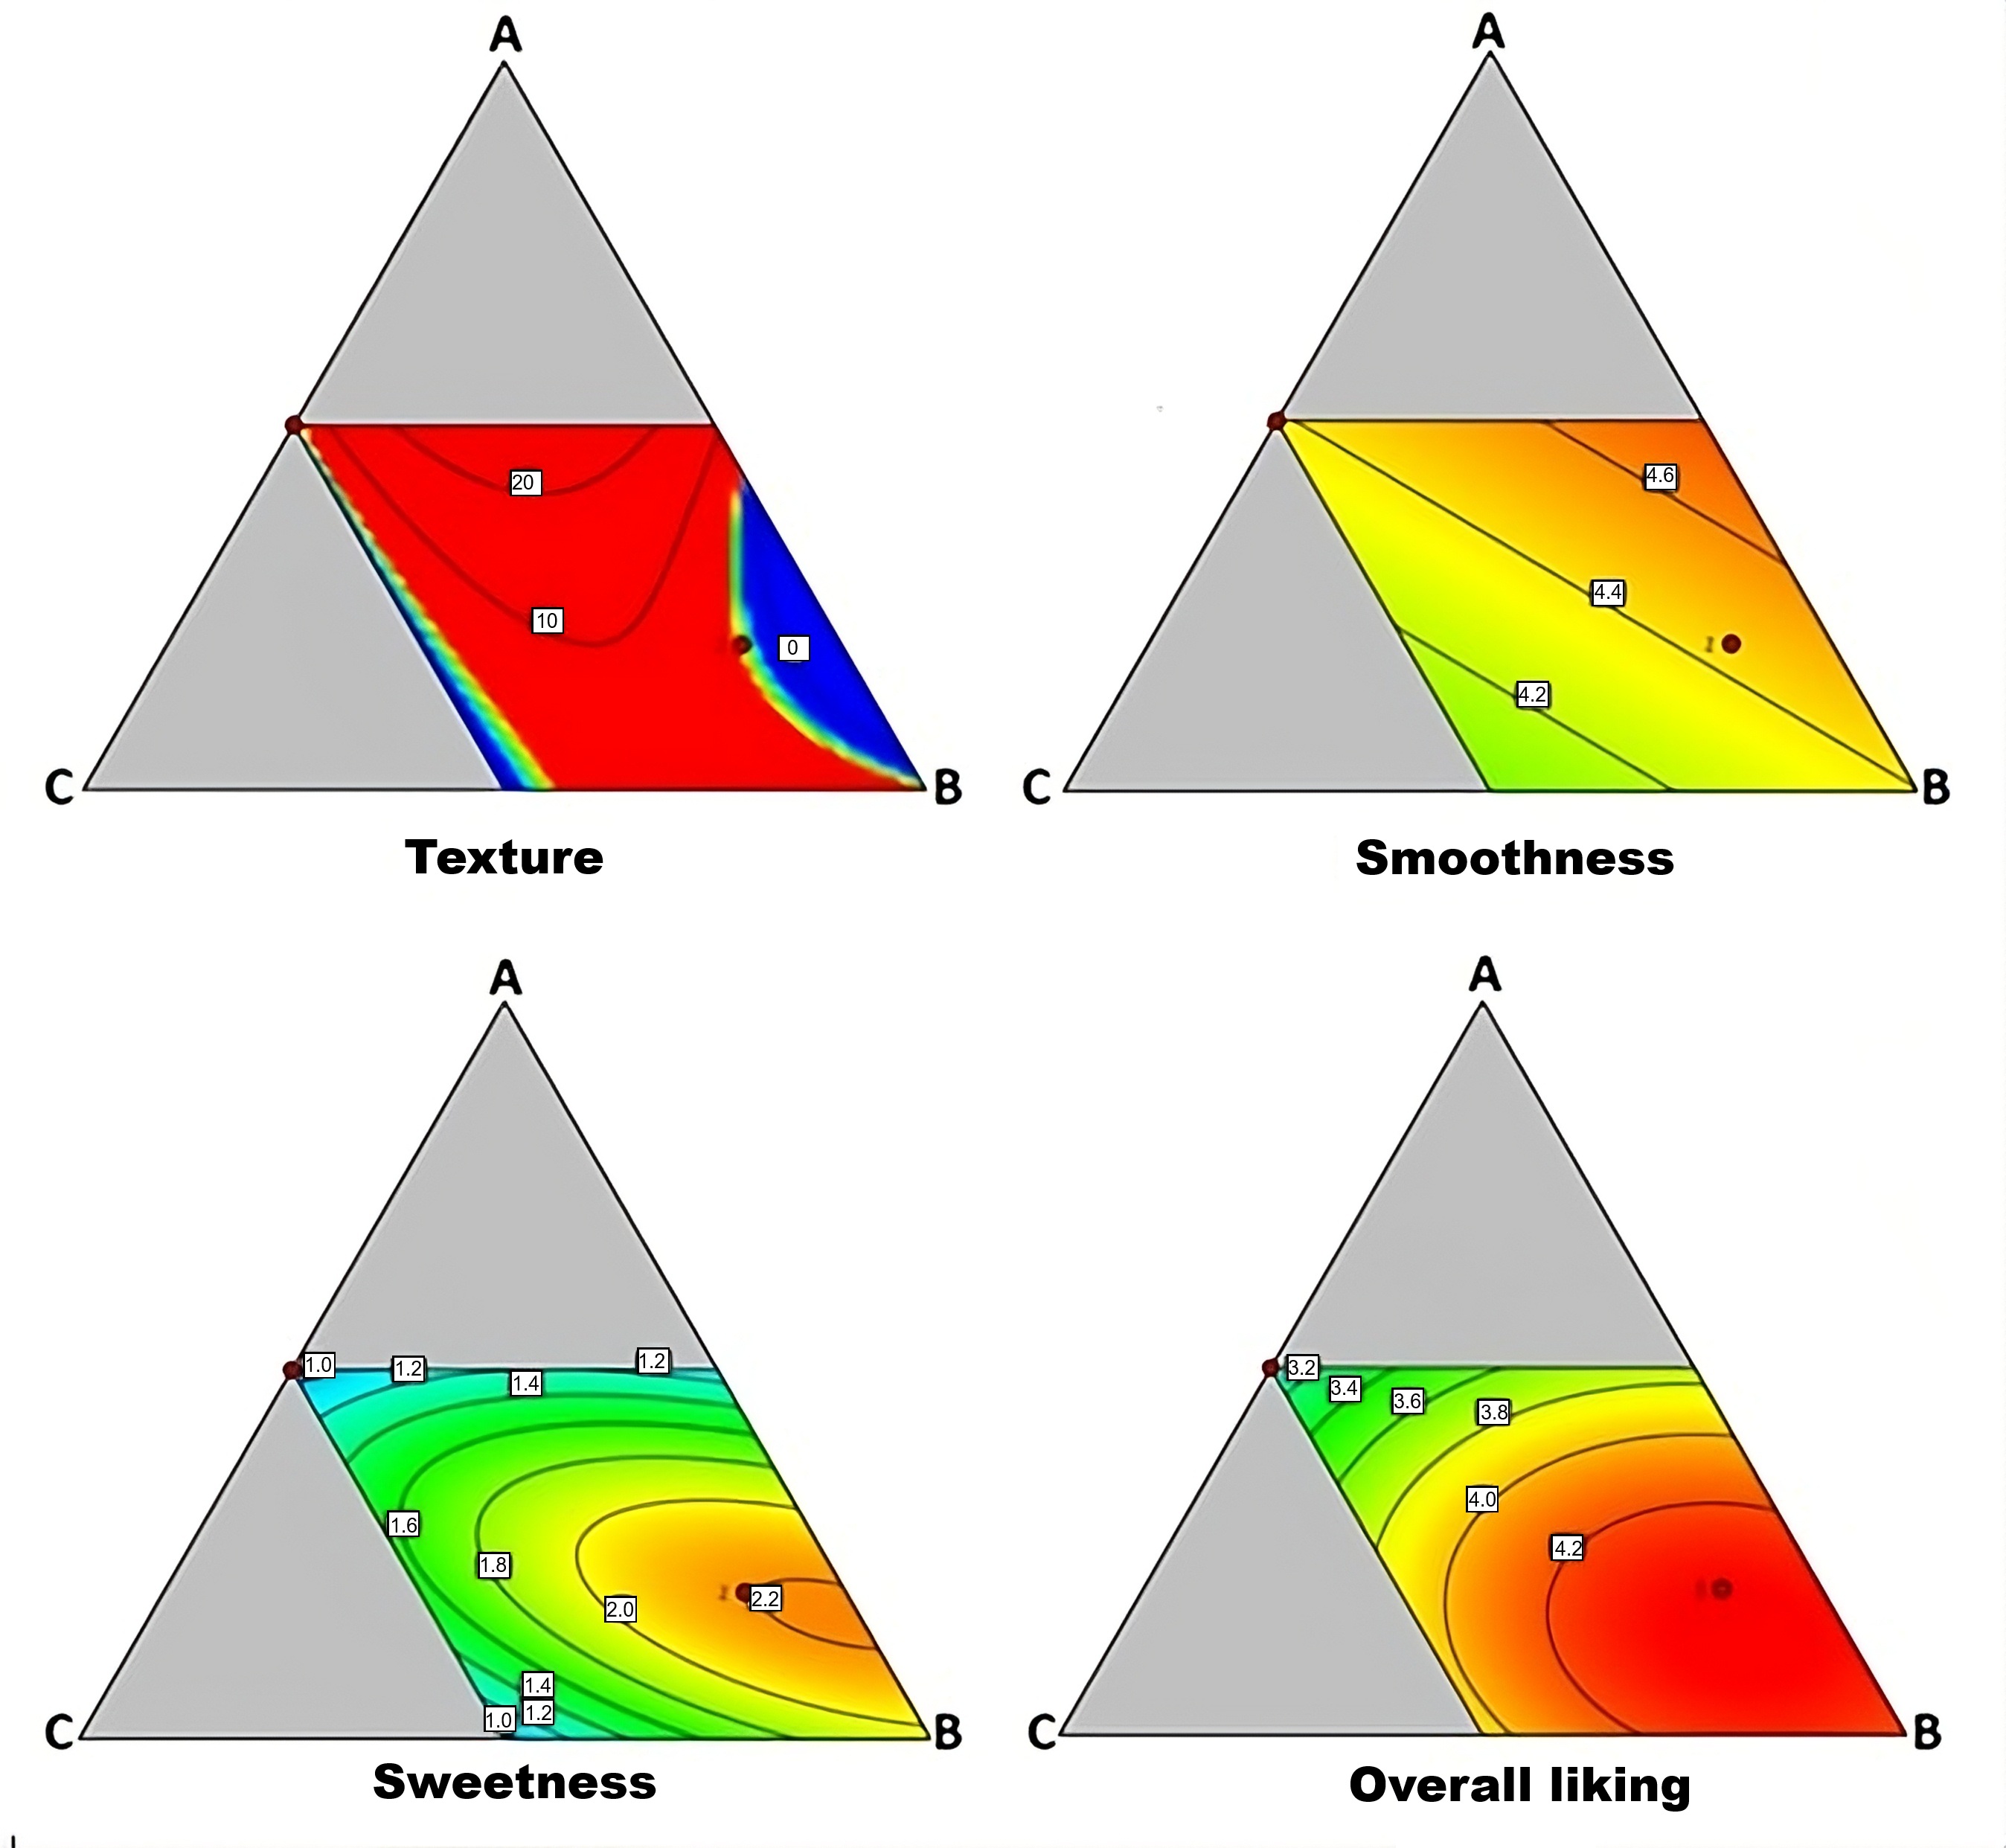
Figure 1 shows how blend variables influence the acceptability of the attributes texture, smoothness, sweetness, and overall liking of jams. The increase in the acceptability of each sensory parameter is represented by red tones. The graphs are set to a maltodextrin concentration of 24.47%, which showed the optimal levels of acceptability. This can be attributed to maltodextrin being a complex carbohydrate that acts as a bulking agent, helping to balance mouthfeel, improving texture, and having the ability to mask bitter or acidic flavors, which contributes to an increased perception of sweetness (Gomes et al., 2023; Bertelsen et al., 2018). Furthermore, liking is enhanced by the increase in isomalt, which acts as a low-calorie sweetener with a flavor profile similar to sugar, thereby boosting the perception of sweetness (Schweitzer et al., 2024).
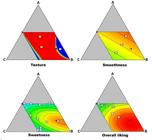
Response variables of the JCP mixture design. Pectin (A); Isomalt (B); Agar-agar (C); and for the maximum fixed maltodextrin concentration set at 24.47%.
Regarding texture, it is observed that acceptability significantly improves as the concentrations of isomalt and pectin increase, especially when the amount of agar-agar is reduced. An excess of agar-agar negatively affects the texture of gels and mouthfeel (Padmesh & Singh, 2021). Additionally, an increase in agar-agar leads to greater gumminess, which could interfere with the perception of sweetness, potentially making the product less palatable (Agorastos et al., 2020). This behavior is consistent with the cubic fit of the model for texture acceptability, reflecting the complexity of interactions between the ingredients. On the other hand, smoothness exhibits linear behavior, suggesting that its acceptance increases directly with the simultaneous increase of isomalt and pectin, indicating a predictable relationship between the components.
Concerning sweetness and overall acceptability, both responses exhibit similar behavior, with an initial increase in acceptance until an optimal point is reached. This peak occurs when the amount of isomalt is increased, close to the minimum amount of agar-agar and approximately one-third of the maximum amount of pectin. However, a slight decline in acceptability is observed beyond the optimal point, possibly associated with sensory saturation of certain attributes, among which sweetness may be included. This behavior is consistent with the quadratic model fit, which captures the curvature of the responses and highlights the importance of interactions among the ingredients.
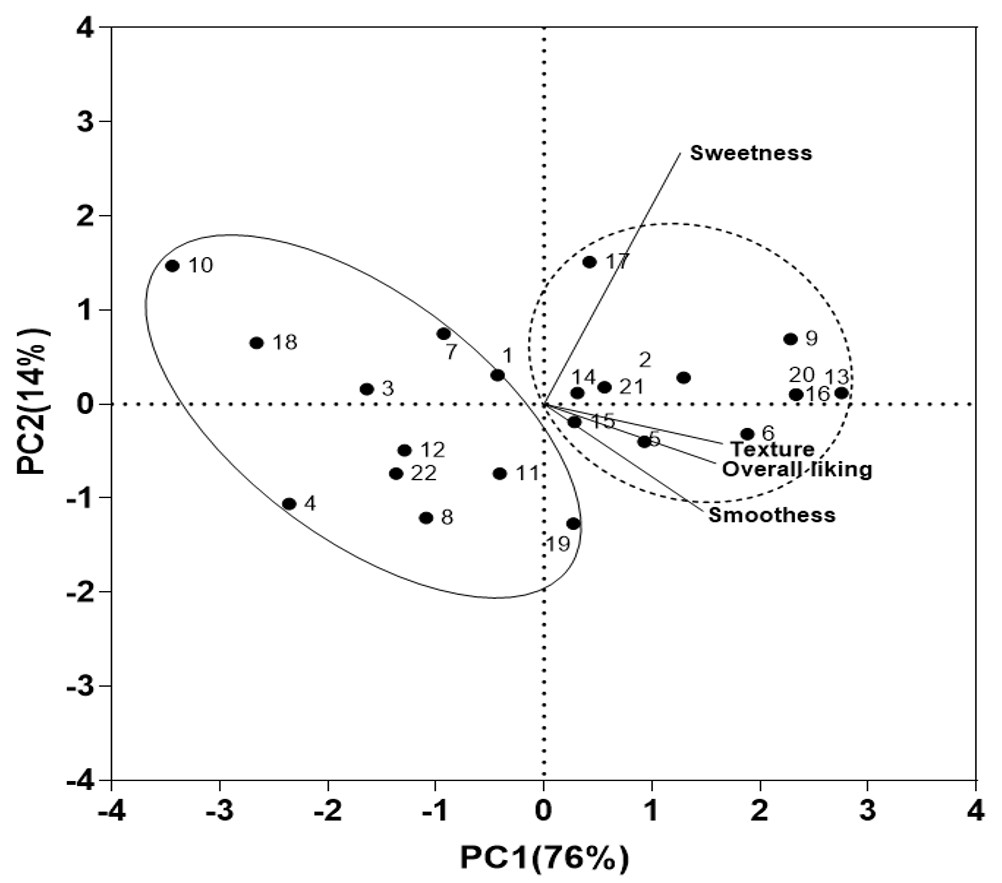
Figure 2 presents the PCA, where the two principal components (PC1 and PC2) together explain 90% of the total variability among the samples. In addition, cluster analysis was performed based on the results of the PCA, using all the variables considered in the analysis. This allowed us to identify the sample groups according to the acceptability of the attributes evaluated in the samples. In addition, cluster analysis was performed based on the results of the PCA, using all the variables considered in the analysis. This allowed us to identify the sample groups according to the acceptability of the attributes evaluated in the samples. The clusters determined the grouping of the samples into two large groups (represented by smooth and dotted ellipses), which were determined by CP1.
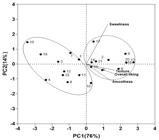
Sensory attributes and blend variables studied through principal component analysis. Samples generated by the mixture design (●).
PC1 is strongly influenced by all sensory attributes, especially texture and overall liking, indicating that this axis represents a clear gradient of overall product liking. Formulations with high positive PC1 values — such as samples 9, 13, 16, and 20— show high overall acceptance and elevated ratings across all sensory dimensions. These samples commonly contain high levels of maltodextrin (24% to 36%) and moderate to high levels of isomalt, suggesting that the combination of both ingredients enhances the acceptability. Notably, formulation 13 (sample 13) achieved the highest scores in texture, smoothness, and overall liking, with 36.64% isomalt and low agar-agar content, reinforcing the idea that agar-agar might have a limiting effect on acceptability. Conversely, formulations with negative PC1 values —such as samples 4, 10, 18, and 3— are those with the lowest sensory scores. These samples tend to contain low maltodextrin levels (below 20%) and high amounts of agar-agar, which appears to negatively influence texture and smoothness. Additionally, some of these formulations include high isomalt levels without a balanced matrix, possibly leading to less harmonious sensory profiles.
PC2 is mainly determined by sweetness, which contrasts with the other attributes. Formulations with high PC2 coordinates —such as samples 10 and 17— are characterized by a profile dominated by sweetness. The sample 17 combines high sweetness acceptability (4.4) with good overall liking (3.8), whereas sample 10, despite its high sweetness acceptability (3.6), has low overall liking (2.5), suggesting that sweetness alone does not ensure product appeal unless supported by smoothness or texture.
Overall, the analysis reveals that maltodextrin is positively associated with all sensory attributes, especially when combined with moderate isomalt content and low agar-agar levels. Pectin, in contrast, does not show a clear or consistent influence, suggesting a more neutral or context-dependent role. Thus, PCA helps establish connections between formulation composition and sensory performance, identifying combinations that maximize product acceptability.
The ideal formulation was obtained through the optimization of mathematical models generated from sensory data, aiming to maintain texture acceptability within a desired range, minimize the influence of greasiness, and maximize the acceptability of sweetness and overall liking. This optimization resulted in the following formulation:
The ingredients used to make the jam (all food grade) were: carrot (31.67%), yellow plum (31.67%), maltodextrin (24.17%), isomalt (8.40%), pectin (0.22%), citric acid (0.2%), stevia (0.2%), sucralose (0.2%), agar-agar (0.18%), propolis retained in calcium carbonate (3.1%), and gelling agents (purchased from the local market).
3.2 Selection of the maximum propolis resin content in jams through sensory analyses
The results of the sensory attribute intensity evaluation for formulations JCP15 and JCP20 are presented in Figure S1 of the supplementary material. Sensory analysis is essential for the comprehensive characterization of products, as it allows for the evaluation of how consumers perceive different attributes and contributes to determining the overall acceptance of a formulation. In this study, it was observed that the propolis resin content in formulation JCP15 had a limited impact on the color and texture of the jams. This phenomenon may be attributed to a slight increase in carbonate content, which affects the acidity and consequently the pH of the mixture. This change in pH influences the flavonoids and anthocyanins present in yellow plums (Vio Michaelis, 2020; Sottile et al., 2023; Kapoor et al., 2023), resulting in a decrease in the brightness of the jams with higher carbonate levels, giving them a darker appearance. This visual effect may be related to the alteration of polyphenolic compounds due to the increase in pH, which is often associated with increased opacity of the product (Valverde García et al., 2020). Additionally, pH has a significant effect on the solubility and interaction of gelling pectins, which impacts the final texture of the jams (Sidhu et al., 2021). Changes in pH can alter the gelling state of pectins, thus affecting both the consistency and firmness of the jams, which in turn influences consumers' sensory acceptance of the product.
Moreover, it was noted that bitterness and acidity were perceived with less intensity in formulation JCP15, while sweetness was considered more intense by consumers. These perceptions may be associated with the lower carbonate content and the propolis resin, which provides a strong bitter flavor that can mask other sensory attributes (El-Sakhawy et al., 2023). This effect was also evident in formulation JCP20, which displayed lower values in fruity flavor intensity.
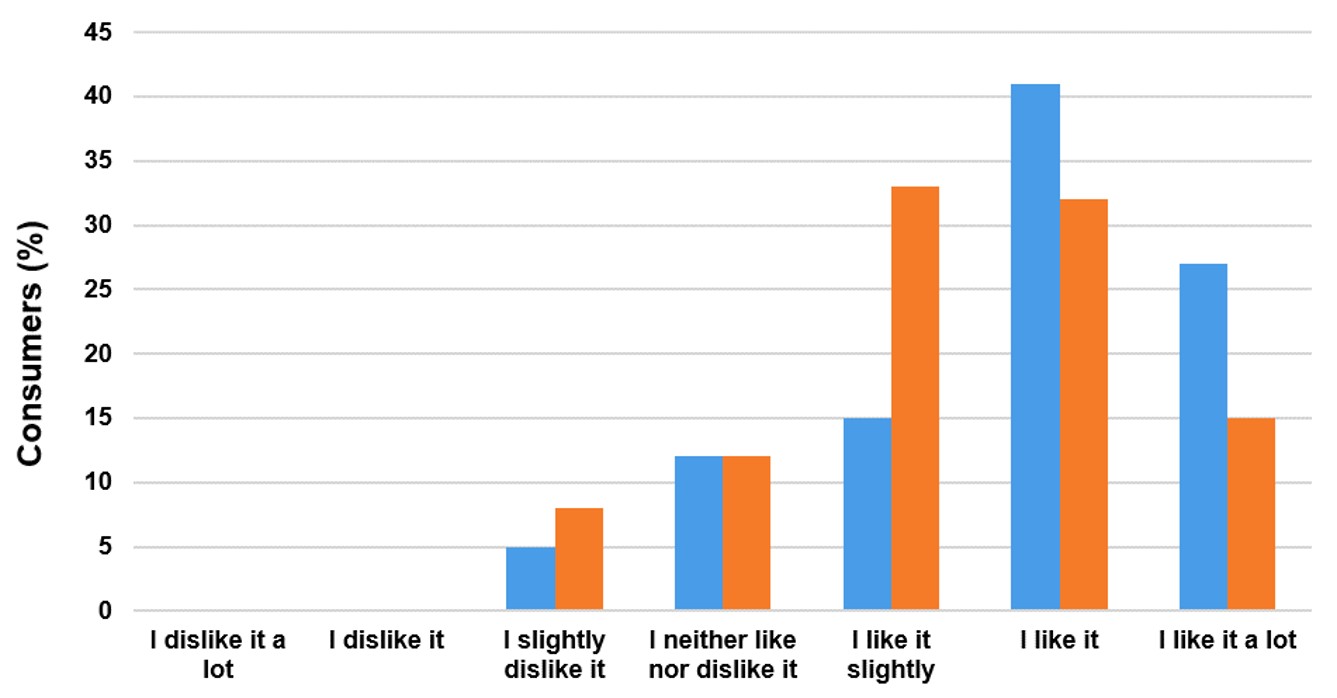
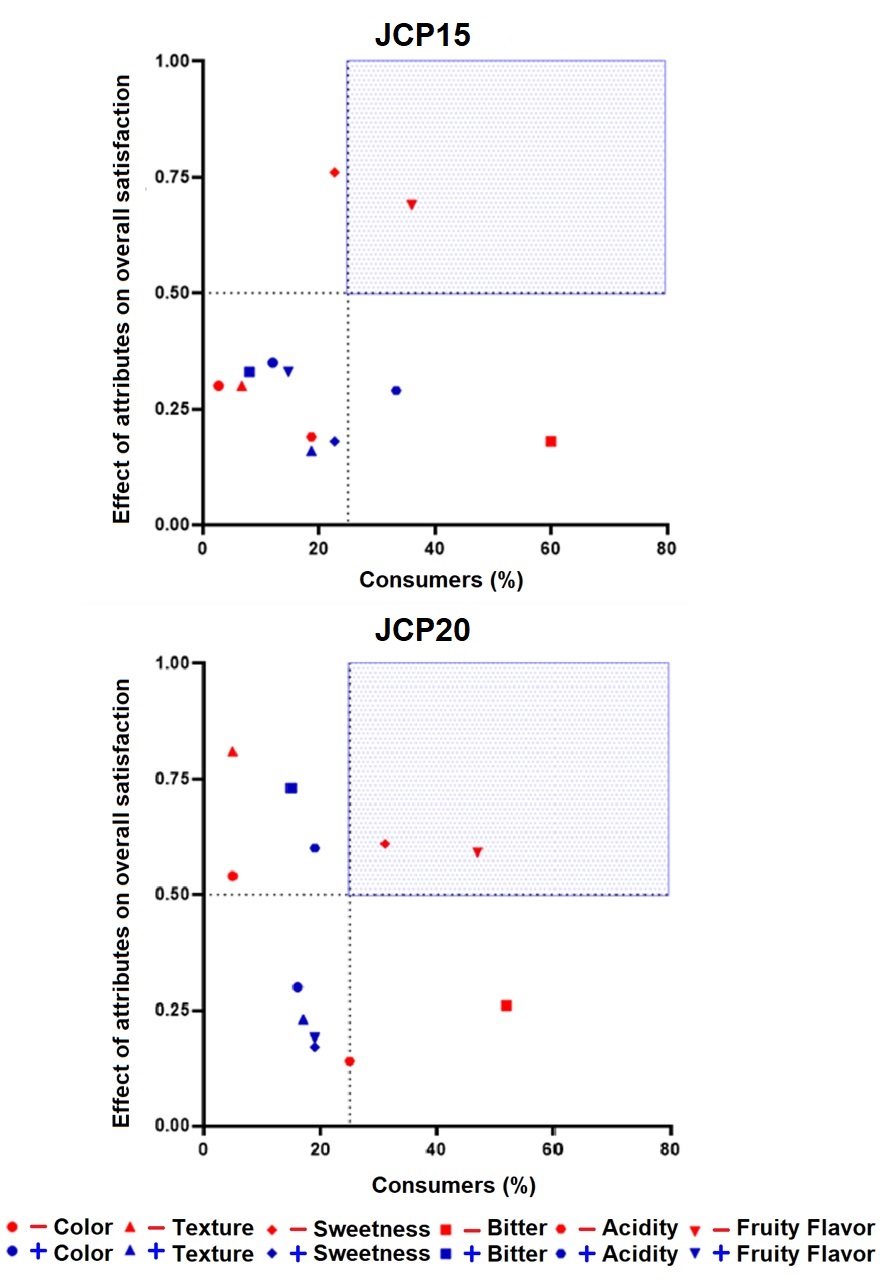
In terms of overall liking (Figure 3), both formulations received acceptance ratings (I like it a lot, I like it, and I like it slightly) above 80%; however the JCP15 formulation had higher frequencies in the two liking categories of higher acceptance (I like it and I like it a lot), reflecting greater consumer acceptance. Penalty analysis (Figure 4) showed that the JCP15 formulation faced a penalty for low fruitiness, probably due to the carrot and propolis flavours overshadowing the expected plum flavour. While the low level of sweetness also affected acceptability, it did not reach significant penalty levels. On the other hand, the JCP20 formulation showed penalties in two attributes: low fruit flavour and low sweetness, attributable to the intense bitter taste caused by the higher propolis content, which reduced the acceptance of these attributes. This sensory analysis confirmed that the JCP15 formulation (0.15% propolis resin) was preferred over the JCP20 (0.20% propolis resin) due to its better balance between flavour and texture attributes. According to Paries et al. (2022), the penalized attributes should be adjusted to improve product acceptability.
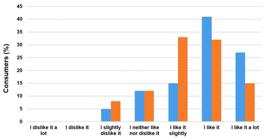
Distribution of consumers' overall acceptance across the 7 likability categories for the global preference attribute. JCP15 is represented by blue bars and JCP20 by red bars.
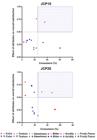
Penalty analysis of the influence of attribute intensity on general consumer satisfaction in jams with 0.15% (JCP15) and 0.20% resin (JCP20). Red represents those categorized as 'Low' and blue as 'High'.
3.3 Physicochemical and functional characteristics of JCP
3.3.1 Physicochemical characteristics
Table 2 shows the physicochemical and functional characteristics of JCP with (JCP15) and without propolis. Traditional jams must meet certain physicochemical parameters, such as a pH not exceeding 4.3 and a water activity (aw) between 0.80 and 0.86 to ensure proper preservation (Argentina, 2023). Both formulations complied with these requirements established by Argentine legislation.
Regarding moisture, the JCP15 formulation showed a higher content (40.7%) compared to the control (36.5%), although this increase cannot be directly attributed to the propolis resin. On the other hand, the significant rise in pH (from 3.3 to 4.3) is mainly related to the presence of carbonate in the matrix used to retain the propolis resin, which acts as an alkalizing agent and modifies the product's acid-base balance. While no significant differences were found in water activity or soluble solids (°Brix), slightly higher aw values and lower Brix values were recorded in the propolis-containing formulation. In terms of color, the incorporation of propolis led to a decrease in L* values (from 45.3 to 37.6), indicating a darker coloration. Likewise, the intensity of red (a*) decreased (from 16.7 to 14.2), while that of yellow (b*) increased (from 16.1 to 19.4), suggesting a more yellowish tone. These changes were accompanied by a decrease in chroma (from 48.1 to 42.3) and hue angle (from 46.0° to 36.2°), indicating lower color vividness and a tone modification, possibly linked to the yellow pigments of polyphenolic compounds present in the propolis and the pigments from the carrot used in the formulation, which could have been affected by the pH change. From a functional perspective, the addition of propolis improved the antioxidant properties of the jam. The antioxidant capacity increased significantly (from 19.71 to 27.21), as did the total polyphenol content (from 252.4 to 288.9 mg GAE/100 g). These results reflect the well-known bioactive activity of propolis and highlight its potential as a functional ingredient in fruit-based products.
3.3.2 Polyphenolic compounds profile by high-pressure liquid chromatography (HPLC)
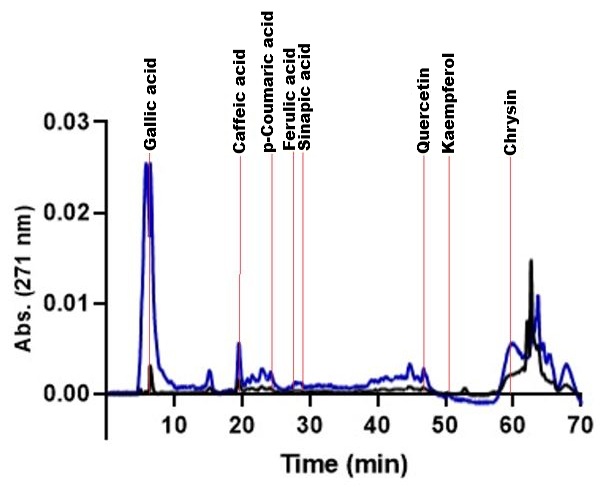
Figure 5 shows the flavonoids identified in the polyphenolic profile of the base jam (without propolis) and in the jam enriched with propolis resin. The chromatograms show a significant increase in both the height and the number of peaks corresponding to polyphenols in the jam with propolis resin. This finding highlights the influence of the compounds provided by the resin, demonstrating its enriching effect and its ability to enhance the presence of bioactive compounds that contribute to the functional properties of the jam.
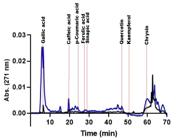
Polyphenol profile present in the jam sample. Blue line - formulation with propolis resin; black line - base formulation.
Within the array of flavonoids present in the product, JCP may exhibit a variety of beneficial properties derived from its individual components from propolis resin. Gallic acid stands out for its potent antioxidant action, providing the greatest protection against cellular oxidation. Chrysin, a flavone, has demonstrated antimicrobial, antibacterial, and antitumor effects, suggesting broad therapeutic potential. Caffeic acid contributes to the neutralization of reactive oxygen species (ROS), crucial for mitigating oxidative stress. P-coumaric acid (CoA) provides antioxidant and anti-inflammatory properties, relevant in the prevention of various pathologies. Ferulic acid, in turn, synergizes with the antioxidant action of vitamin C, enhancing its beneficial effects. Sinapic acid, present in a wide range of foods, plants, and edible fruits, also contributes to the overall antioxidant capacity of JCP. Quercetin and kaempferol, two important flavonoids, exert protective effects on the gastric mucosa, demonstrating antiulcer properties. Additionally, chrysin has shown anxiolytic and antidepressant activity, expanding its therapeutic potential (Gaspar et al., 2010; Mendo, 2023). It is important to note that quercetin, kaempferol, and chrysin were identified as the compounds present in the highest concentrations in the propolis used in the JCP formulation (Figure 6). This high concentration of bioactive compounds in propolis could explain, at least in part, the properties observed in the final product. It should also be noted that the chromatogram shown in Figure 5 was obtained at 271 nm, a wavelength at which certain compounds, such as gallic acid, exhibit high absorbance. As a result, even at low concentrations, these compounds can produce prominent peaks. Therefore, the intensity of a peak in the chromatogram does not necessarily reflect the actual concentration of the compound. The quantification shown in Figure 6 was performed through direct comparison with external standards, allowing for accurate determination of concentrations in mg/g of dry extract.

Compounds identified in the polyphenol profile present in the JCP sample derived from propolis.
4 Conclusion
JCP15 formulation was developed as a functional product, reduced-sugar with significant antioxidant capacity and acceptable sensory properties. The application of mixture design enabled the optimization of key ingredients— isomalt, agar-agar, maltodextrin, and pectin—resulting in a formulation competitive with traditional jams. Maltodextrin and isomalt levels significantly affected product acceptability, while propolis incorporation below 0.20% maintained overall liking without negatively impacting sweetness or fruit flavor. The polyphenolic profile analysis confirmed the presence of bioactive compounds with antioxidant properties and potential health benefits. This study demonstrates the feasibility of producing healthier fruit and vegetable jams that meet consumer preferences and current food industry trends.
Supplementary Material
Supplementary material accompanies this paper.
Table 1s
Table 2s
Figure S1
This material is available as part of the online article from https://doi.org/10.1590/1981-6723.1072024
Data Availability Statement
All data generated or analyzed in this study are included in this published article.
-
Cite as:
Vallejos, O. A., Rivero, R. C., & Sosa, N. (2025). Development of healthy fruit- and vegetable-based jams with propolis: Low-calorie and rich in antioxidant properties. Brazilian Journal of Food Technology, 28, e2024107. https://doi.org/10.1590/1981-6723.1072024
-
Funding:
None.
References
-
Agorastos, G., Halsema, E. V., Bast, A., & Klosse, P. (2020). Review of Mouthfeel Classification: A new perspective of food perception. J Food Sci&Nutri, 107, 1. http://doi.org/10.46715/jfsn2020.09.1000107
» http://doi.org/10.46715/jfsn2020.09.1000107 -
Archaina, D., Rivero, R., Sosa, N., & Baldi Coronel, B. (2016). Influence of the harvesting procedure and extracting process on the antioxidant capacity of ethanolic propolis extracts. Journal of Apicultural Research, 54(5), 474-481. http://doi.org/10.1080/00218839.2016.1181838
» http://doi.org/10.1080/00218839.2016.1181838 -
Argentina. Ministerio de Salud. (2016). Manual para la aplicación de las guías alimentarias para la población Argentina. Retrieved in 2024, September 30, from https://www.argentina.gob.ar/sites/default/files/bancos/2020-08/guias-alimentarias-para-la-poblacion-argentina_manual-de-aplicacion_0.pdf
» https://www.argentina.gob.ar/sites/default/files/bancos/2020-08/guias-alimentarias-para-la-poblacion-argentina_manual-de-aplicacion_0.pdf -
Argentina. Ministerio de Salud de la Nación. (2019). 2° Encuesta Nacional de Nutrición y Salud ENNYS 2. Resumen ejecutivo Retrieved in 2024, September 30, from https://cesni-biblioteca.org/wp-content/uploads/2019/10/0000001565cnt-ennys2_resumen-ejecutivo-20191.pdf
» https://cesni-biblioteca.org/wp-content/uploads/2019/10/0000001565cnt-ennys2_resumen-ejecutivo-20191.pdf -
Argentina. Administración Nacional de Medicamentos, Alimentos y Tecnología Médica – ANMAT. (2023). Código alimentario Argentino Buenos Aires: Ministerio de Salud. Retrieved in 2024, September 30, from https://www.argentina.gob.ar/anmat/codigoalimentario
» https://www.argentina.gob.ar/anmat/codigoalimentario - Arumugam, T., Sona, C. L., & Maheswari, M. U. (2021). Fruits and vegetables as superfoods: Scope and demand. Journal of Pharmaceutical Innovation, 10, 119-129.
- Association of Official Analytical Chemists – AOAC. (2005). Official Methods of Analysis (18th ed.). Gaithersburg: AOAC International.
-
Bertelsen, A. S., Laursen, A., Knudsen, T. A., Møller, S., & Kidmose, U. (2018). Bitter taste masking of enzyme‐treated soy protein in water and bread. Journal of the Science of Food and Agriculture, 98(10), 3860-3869. PMid:29363768. http://doi.org/10.1002/jsfa.8903
» http://doi.org/10.1002/jsfa.8903 -
Bruzzone, F., Ares, G., & Giménez, A. N. A. (2012). Consumers’texture perception of milk desserts. Ii–comparison with trained assessors’data. Journal of Texture Studies, 43(3), 214-226. http://doi.org/10.1111/j.1745-4603.2011.00332.x
» http://doi.org/10.1111/j.1745-4603.2011.00332.x -
Budreviciute, A., Damiati, S., Sabir, D. K., Onder, K., Schuller-Goetzburg, P., Plakys, G., Katileviciute, A., Khoja, S., & Kodzius, R. (2020). Management and prevention strategies for non-communicable diseases (NCDs) and their risk factors. Frontiers in Public Health, 8, 574111. PMid:33324597. http://doi.org/10.3389/fpubh.2020.574111
» http://doi.org/10.3389/fpubh.2020.574111 -
Cedeño-Pinos, C., Marcucci, M. C., & Bañón, S. (2021). Contribution of green propolis to the antioxidant, physical, and sensory properties of fruity jelly candies made with sugars or fructans. Foods, 10(11), 2586. PMid:34828866. http://doi.org/10.3390/foods10112586
» http://doi.org/10.3390/foods10112586 -
Contieri, L. S., de Souza Mesquita, L. M., Sanches, V. L., Chaves, J., Pizani, R. S., Silva, L. C., Vigano, J., Ventura, S. P. M., & Rostagno, M. A. (2022). Recent progress on the recovery of bioactive compounds obtained from propolis as a natural resource: Processes, and applications. Separation and Purification Technology, 298, 121640. http://doi.org/10.1016/j.seppur.2022.121640
» http://doi.org/10.1016/j.seppur.2022.121640 -
Diapri, S. P., Jariyah, J., & Priyanto, A. D. (2024). Sensory profile of candied tomatodates using the just about right method. AJARCDE (Asian Journal of Applied Research for Community Development and Empowerment), 8(3), 175-179. http://doi.org/10.29165/ajarcde.v8i3.487
» http://doi.org/10.29165/ajarcde.v8i3.487 -
El-Sakhawy, M., Salama, A., & Mohamed, S. A. (2023). Propolis applications in food industries and packaging. Biomass Conversion and Biorefinery, 14, 13731-13746. https://doi.org/10.1007/s13399-023-04044-9
» https://doi.org/10.1007/s13399-023-04044-9 -
El-Seedi, H. R., Eid, N., Abd El-Wahed, A. A., Rateb, M. E., Afifi, H. S., Algethami, A. F., Zhao, C., Al Naggar, Y., Alsharif, S. M., Tahir, H. E., Xu, B., Wang, K., & Khalifa, S. A. M. (2022). Honey bee products: Preclinical and clinical studies of their anti-inflammatory and immunomodulatory properties. Frontiers in Nutrition, 8, 761267. PMid:35047540. http://doi.org/10.3389/fnut.2021.761267
» http://doi.org/10.3389/fnut.2021.761267 -
Feng, S., Yi, J., Li, X., Wu, X., Zhao, Y., Ma, Y., & Bi, J. (2021). Systematic review of phenolic compounds in apple fruits: Compositions, distribution, absorption, metabolism, and processing stability. Journal of Agricultural and Food Chemistry, 69(1), 7-27. PMid:33397106. http://doi.org/10.1021/acs.jafc.0c05481
» http://doi.org/10.1021/acs.jafc.0c05481 -
Gaspar, A., Martins, M., Silva, P., Garrido, E. M., Garrido, J., Firuzi, O., Miri, R., Saso, L., & Borges, F. (2010). Dietary phenolic acids and derivatives. Evaluation of the antioxidant activity of sinapic acid and its alkyl esters. Journal of Agricultural and Food Chemistry, 58(21), 11273-11280. PMid:20949946. http://doi.org/10.1021/jf103075r
» http://doi.org/10.1021/jf103075r - Giacobone, G., Castronuovo, L., Tiscornia, V., & Allemandi, L. (2018). Análisis de la cadena de suministro de frutas y verduras en Argentina (56 p.). Argentina: Fundación Interamericana del Corazón Argentina.
-
Gomes, A., Bourbon, A. I., Peixoto, A. R., Sanches Silva, A., Tasso, A., Almeida, C., Nobre, C., Nunes, C., Sánchez, C., Gonçalves, D. A., Castelo-Branco, D., Figueira, D., Coelho, E., Gonçalves, J., Teixeira, J. A., Pastrana Castro, L. M., Coimbra, M. A., Pintado, M., Parente Ribeiro Cerqueira, M. Â., Fuciños, P., Teixeira, P., Fernandes, P. A. R., & Alves, V. D. (2023). Strategies for the reduction of sugar in food products. In M. A. P. R. Cerqueira & L. M. P. Castro (Eds.), Food structure engineering and design for improved nutrition, health and well-being (pp. 219-241). Cambridge: Academic Press. http://doi.org/10.1016/B978-0-323-85513-6.00008-6
» http://doi.org/10.1016/B978-0-323-85513-6.00008-6 -
Instituto Nacional de Estadística y Censos – INDEC. (2014). Encuesta Nacional de Gastos de los Hogares 2012-2013 Retrieved in 2024, September 30, from https://www.indec.gob.ar/uploads/informesdeprensa/engho_25_04_14.pdf
» https://www.indec.gob.ar/uploads/informesdeprensa/engho_25_04_14.pdf -
Irigoiti, Y., Navarro, A., Yamul, D., Libonatti, C., Tabera, A., & Basualdo, M. (2021). The use of propolis as a functional food ingredient: A review. Trends in Food Science & Technology, 115, 297-306. http://doi.org/10.1016/j.tifs.2021.06.041
» http://doi.org/10.1016/j.tifs.2021.06.041 -
Kapoor, A., Kapoor, S., & Aggarwal, P. (2023). Rheological, microstructural and biochemical characterisation of fruit pomace jams. Journal of Food Measurement and Characterization, 17(5), 4267-4279. http://doi.org/10.1007/s11694-023-01947-z
» http://doi.org/10.1007/s11694-023-01947-z -
Magnavacca, A., Sangiovanni, E., Racagni, G., & Dell’Agli, M. (2022). The antiviral and immunomodulatory activities of propolis: An update and future perspectives for respiratory diseases. Medicinal Research Reviews, 42(2), 897-945. PMid:34725836. http://doi.org/10.1002/med.21866
» http://doi.org/10.1002/med.21866 -
Maicelo-Quintana, J. L., Reyna-Gonzales, K., Balcázar-Zumaeta, C. R., Auquinivin-Silva, E. A., Castro-Alayo, E. M., Medina-Mendoza, M., & Silva-Zuta, M. Z. (2024). Potential application of bee products in food industry: An exploratory review. Heliyon, 10(1), e24056. http://doi.org/10.1016/j.heliyon.2024.e24056
» http://doi.org/10.1016/j.heliyon.2024.e24056 -
Martínez-Girón, J., Figueroa-Molano, A. M., & Ordóñez-Santos, L. E. (2017). Effect of the addition of peach palm (Bactris gasipaes) peel flour on the color and sensory properties of cakes. Food Science and Technology, 37(3), 418-424. http://doi.org/10.1590/1678-457x.14916
» http://doi.org/10.1590/1678-457x.14916 - Mendo, D. F. R. B. (2023). Compuestos bioactivos en extractos de plantas aromáticas y medicinales de la dehesa extremeña (Doctoral dissertation). Universidad de Extremadura, Badajoz.
-
Padayachee, A., Day, L., Howell, K., & Gidley, M. J. (2017). Complexity and health functionality of plant cell wall fibers from fruits and vegetables. Critical Reviews in Food Science and Nutrition, 57(1), 59-81. PMid:25830345. http://doi.org/10.1080/10408398.2013.850652
» http://doi.org/10.1080/10408398.2013.850652 - Padmesh, S., & Singh, A. (2021). Agars: Properties and applications. In Inamuddin, M. I. Ahamed, R. Boddula & T. Altalhi (Eds.), Polysaccharides: Properties and applications (pp. 75-93). New York: Wiley.
-
Palazzo, A. B., & Bolini, H. M. A. (2017). Sweeteners in diet chocolate ice cream: Penalty analysis and acceptance evaluation. Journal of Food Studies, 6(1), 1-1. http://doi.org/10.5296/jfs.v6i1.10655
» http://doi.org/10.5296/jfs.v6i1.10655 -
Paries, M., Bougeard, S., & Vigneau, E. (2022). Multivariate analysis of Just-About-Right data with optimal scaling approach. Food Quality and Preference, 102, 104681. http://doi.org/10.1016/j.foodqual.2022.104681
» http://doi.org/10.1016/j.foodqual.2022.104681 -
Rivera-Yañez, N., Rivera-Yanez, C. R., Pozo-Molina, G., Mendez-Catala, C. F., Mendez-Cruz, A. R., & Nieto-Yanez, O. (2020). Biomedical properties of propolis on diverse chronic diseases and its potential applications and health benefits. Nutrients, 13(1), 78. http://doi.org/10.3390/nu13010078
» http://doi.org/10.3390/nu13010078 -
Rivero, R., Archaina, D., Sosa, N., & Schebor, C. (2021). Development and characterization of two gelatin candies with alternative sweeteners and fruit bioactive compounds. Lebensmittel-Wissenschaft + Technologie, 141, 110894. http://doi.org/10.1016/j.lwt.2021.110894
» http://doi.org/10.1016/j.lwt.2021.110894 -
Schenk, M., Ferrario, M., Schmalko, M., Rivero, R., Taravini, I., & Guerrero, S. (2021). Development of extracts obtained from yerba mate leaves with different industrial processing steps: Antimicrobial capacity, antioxidant properties, and induced damage. Journal of Food Processing and Preservation, 45(6), e15482. http://doi.org/10.1111/jfpp.15482
» http://doi.org/10.1111/jfpp.15482 - Schweitzer, L., Wouters, R., & Theis, S. (2024). Replacing sugar with the polyol isomalt: Technological advances and nutritional benefits focusing on blood glucose management. International Journal on Nutraceuticals, Functional Foods and Novel Foods, 1, 551-559. http://doi.org/10.17470/NF-024-0064.
- Sidhu, N., Mahil, S., Liu, S., & Kim, C. (2021). Natural pH indicators and their sensitivities to pH. Expedition, 11, 1.
-
Sottile, F., Napolitano, A., Badalamenti, N., Bruno, M., Tundis, R., Loizzo, M. R., & Piacente, S. (2023). A New bloody pulp selection of myrobalan (Prunus cerasifera L.): Pomological traits, chemical composition, and nutraceutical properties. Foods, 12(5), 1107. PMid:36900625. http://doi.org/10.3390/foods12051107
» http://doi.org/10.3390/foods12051107 -
Spácil, Z., Nováková, L., & Solich, P. (2008). Analysis of phenolic compounds by high performance liquid chromatography and ultra performance liquid chromatography. Talanta, 76(1), 189-199. PMid:18585262. http://doi.org/10.1016/j.talanta.2008.02.021
» http://doi.org/10.1016/j.talanta.2008.02.021 - Stone, H., Bleibaum, R. N., & Thomas, H. A. (2020). Sensory evaluation practices Cambridge: Academic Press.
-
Valverde García, D., Pérez Esteve, É., & Barat Baviera, J. M. (2020). Changes in cocoa properties induced by the alkalization process: A review. Comprehensive Reviews in Food Science and Food Safety, 19(4), 2200-2221. PMid:33337074. http://doi.org/10.1111/1541-4337.12581
» http://doi.org/10.1111/1541-4337.12581 - Vio Michaelis, S. (2020). Profiling phenolics, soluble sugars and carotenoids in different cultivars of European plum (Prunus domestica L.) (Doctoral dissertation). Technische Universität München, Baviera.
- Watts, B. M., Ylimaki, G. L., Jeffery, L. E., & Elías, L. G. (1992). Pruebas orientadas al consumidor. Métodos sensoriales básicos para la evaluación de alimentos Ottawa: CIID.
-
World Health Organization – WHO. (2015). Information note on recommended sugars intake in the WHO guideline for adults and children. Geneva: WHO. Retrieved in 2024, September 30, from https://apps.who.int/iris/bitstream/handle/10665/154587/WHO_NMH_NHD_15.2_spa.pd
» https://apps.who.int/iris/bitstream/handle/10665/154587/WHO_NMH_NHD_15.2_spa.pd - World Health Organization – WHO. (2019). Increasing fruit and vegetable consumption to reduce the risk of noncommunicable diseases. Geneva: WHO.
- World Health Organization – WHO. (2023). Saturated fatty acid and trans-fatty acid intake for adults and children: WHO guideline. Geneva: WHO.
-
Zulhendri, F., Chandrasekaran, K., Kowacz, M., Ravalia, M., Kripal, K., Fearnley, J., & Perera, C. O. (2021). Antiviral, antibacterial, antifungal, and antiparasitic properties of propolis: A review. Foods, 10(6), 1360. PMid:34208334. http://doi.org/10.3390/foods10061360
» http://doi.org/10.3390/foods10061360
Edited by
-
Section Editor:
Silvia P. M. Germer.