 The importance of conservation for the provision of ecosystem services in flood control
Abstract
Climate change exacerbates natural disasters, primarily driven by environmental degradation, which leads to the reduction of available ecosystem services (ES). In this context, a comparative analysis of land use and land cover (LULC) and hydrological significance (HS) over a 30-year period was conducted to assess the loss of services in the Cubatão River Basin – SC, focusing on flood control. A matrix-based calculation was employed, integrating slope, transmissivity, soil texture, land use and cover, and the topographic wetness index to determine the hydrological significance of the study area. The urban area doubled in size (1992: 7.82% – 2022: 15.53%), while natural areas decreased by 5.3%. These natural areas, which still comprise over 50% of the territory, exhibit “Good” hydrological significance, covering nearly 40% of the total area and providing more than 15 ES. However, despite this favorable hydrological condition, the southern bay of Florianópolis suffered losses exceeding BRL 40 million in natural disasters of climatic and hydrological origin, in 2008. These findings highlight that, even with adequate hydrological performance, flooding events remain a threat. Thus, urban expansion planning, guided by municipal master plans that evaluate ES and the conservation of key areas for flood control, is essential to ensure social, economic, and environmental security.
Keywords:
hydric significance; ecosystem service; flood; Grande Florianópolis; natural desaster
Resumo
A mudança climática intensifica desastres naturais, resultantes da degradação do meio ambiente, que leva a diminuição de serviços ecossistêmicos (SE) disponíveis. Nesse contexto, foi feito um comparativo do uso e ocupação do solo e a significância hídrica (SH) num intervalo de 30 anos, a fim de determinar a perda de serviços na Bacia do Rio Cubatão – SC para controle de inundação. Para isso, um cálculo matricial considerando declividade, transmissividade e textura de solo, uso e ocupação de solo e índice topográfico de umidade, definiram a significância hídrica da área de estudo. A malha urbana dobra de tamanho (1992: 7.82% - 2022: 15.53%), enquanto as áreas naturais mostram uma diminuição de 5.3%. Essas, representam mais 50% da área, com significância hídrica de classe “Boa” representando quase 40% da área total, além de oferecerem mais de 15 SE. Ainda assim, a baía sul de Florianópolis, teve uma perda de mais de R$40 mi por conta de desastres naturais de origem climática e hídrica, em 2008. Conclui-se então que, mesmo com uma boa qualidade da SH, casos de inundação ainda acontecem. Portanto, planejar a expansão urbana através de Planos Diretores das Cidades que avaliem provisão de SE e conservação de áreas chave para controle de inundação, são importantes para garantir segurança social, econômica e ambiental.
Palavras-chave:
significância hídrica; serviço ecossistêmico; inundação; Grande Florianópolis; desastre natural
1. Introduction
The physical climate system has undergone significant changes, notably the intensification of extreme events, which has led to adverse impacts on both natural and human systems on a global scale. These impacts include the degradation and loss of ecosystems, reduced water and food security, and increased damage to infrastructure. Additionally, there have been observed increases in mortality and morbidity, as well as human migration and displacement. Other effects include harm to livelihoods, the rise of mental health issues, and a widening of social inequalities (IPCC, 2022).
In an attempt to slow down these processes, the academic community seeks to understand the biotic and abiotic components of the environment and their interrelations, which drive processes and functions that, in turn, ensure the provision of ecosystem services (ES). These services can be identified through their characteristics, functional attributes, and organizational properties (Schneiders and Müller, 2017).
Such services are defined by the contributions that ecosystems provide to human well-being. However, it is important to highlight the distinction between well-being and benefits, which are subsequent outcomes derived from the services provided. The Common International Classification of Ecosystem Services (CICES V5.1) is one of the tools used to classify and identify these environmental services for each macrohabitat on Earth. These are divided into the following groups with some examples of use: i) Provisioning services – water, food and timber; ii) Regulation and maintenance services – nutrient cycling, flood control and biological control; iii) Cultural services – cognitive development, spiritual and recreation.
It is important to note that these services depend on living processes, which may involve species or individuals, the habitats they occupy, or even entire ecosystems (Haines-Young and Potschin, 2018).
Even though urban managers and space producers are aware of the benefits, the environment is constantly neglected. There remains a significant challenge in quantifying ES compared to economic services and manufactured capital, meaning they are rarely recognized by commercial markets, which can jeopardize human survival in the biosphere (Costanza et al., 1997). However, Costanza and collaborators (1997 and 2014) were able to identify the monetary value of ES and continue to update these values, enabling the academic community to quantify them. This creates a bridge between ES and the market, enhancing the chances for their understanding and conservation. The authors also warn that the greatest challenge in valuing ES lies in determining the relative contribution of natural capital stocks in human-nature interactions, balancing resource exploitation with sustainability.
Considering the provisioning service of food, we have the city of Florianópolis, responsible for 70% of Santa Catarina's oyster harvest, making it the state leader in this sector (Luz, 2019). Food production itself requires space and natural resources. The protected position of the island’s northern and southern bays, along with the reduced water currents due to their location, provides an ideal environment for the mollusk to allocate energy towards mass growth rather than reinforcing its shells. As a result, the oysters are softer, juicier, and have smaller shells, making them highly preferred in the market (Nascimento, 2002).
Aquaculture of bivalves, crustaceans, fish, and other species is part of a food industry that has been growing substantially (FAO, 2017). Fish provides a food source for more than 3.1 billion people, accounting for approximately 20% of the total protein consumed worldwide (FAO, 2016). Brazil plays an important role in fish farming, with the state of Santa Catarina (SC) standing out by representing 95% of the country’s bivalve mollusk production, mainly mussels, oysters, and scallops (Dorow, 2013).
The attention to this issue is so significant that, to maintain the flow and production of this important source of protein without depleting the natural stock of marine individuals, humanity has been promoting constant improvements to strengthen the coastal marine system (Troell et al., 2014).
However, humans remain susceptible to extreme environmental events, such as those that occurred in 2022, specifically in November and December in the metropolitan area of Greater Florianópolis. An abnormal volume of rainfall (around 2,000 mm accumulated) was highlighted in the southern region of the country, according to the National Institute of Meteorology (INMET) (INMET, 2022). The overflow of the Cubatão River caused numerous flooding points and inundations that led several municipalities to declare a state of emergency (Hugen, 2022).
The Cubatão River Basin region has one of the highest population densities in the state, representing high urbanization and intense migration flow (Silva and Mattei, 2013). The state of SC experienced 1,344 flooding episodes over a 30-year period (1980-2010), which accounts for nearly 20% of natural disasters occurring in the state (Herrmann, 2014). In Cubatão River Basin, 90% of natural disasters were caused by sudden floods (Pizzi, 2020).
The control of this disaster is closely related to environmental processes and conditions, and their respective ES. Hydrological infiltration and interception processes regulate water balance and are related to land use and occupation (Betrie et al., 2011). Šatalová and Kenderessy (2017) developed an indicator expressed by calculating the water retention function, based on altimetric parameters, soil type, and land occupation type, defined by the landscape's ability to retain water, reduce runoff, and encourage water infiltration into the soil. Known as hydrological significance, this indicator can assess the ecosystem functions of water retention.
Therefore, a natural landscape ensures the provision of ES; the opposite, its suppression leads to environmental and economic impacts that directly affect the local and regional population. Our aim is to assist in understanding this phenomenon. Considering the population, particularly the caiçara community, tourism, and shellfish production in Greater Florianópolis, this study proposes a comparative analysis of the loss of natural landscape associated with the hydrological significance of the soil and the identification of ES related to the control of flooding, impacting both the local population and public management of the affected cities. To achieve this, a temporal analysis was conducted for the years 1992 and 2022, identifying the natural systems that have been suppressed and the hydrological significance of the region for each period.
2. Material and Methods
2.1. Area of Interest: São José, Palhoça, Santo Amaro da Imperatriz, and the Southern Bay of Florianópolis
The cities in the study area are located in the RH8 – Coastal Center region of the state of Santa Catarina, namely: São José, Palhoça, Santo Amaro da Imperatriz, and the Southern Bay of Florianópolis (see in Figure 1). Within this area is the Cubatão Watershed, located in the Greater Florianópolis region, where the main rivers are Vargem do Braço and Cubatão do Sul, which are responsible for supplying water to 700,000 people living in the region (Florianópolis, 2010). The watershed has a total area of 738 km2, of which 342 km2 are within the Serra do Tabuleiro State Park (Santa Catarina, 2017).
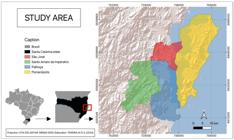
Location of the cities of São José, Palhoça, Santo Amaro da Imperatriz, and the Island of Santa Catarina (ISC).
2.1.1. Remote analysis: macrohabitats
To characterize the patterns of landscape structure, geoprocessing of satellite images from Google Earth Pro with a resolution of up to 2m was utilized through a Geographic Information System (GIS) and analyzed using QGIS Biatowieza 3.22 software. For the analysis of land use and land cover, data obtained from MAPBIOMAS collection 8.0 was used. In the case of marine farms, those present in the Southern Bay were considered, as they were identified as the most affected by flooding, according to municipal reports.
2.1.2. Identification of ecosystem services: CICES v5.1
To classify and gain a better understanding of the ecosystem services offered by the macrohabitats within the study area, CICES V5.1 was utilized. This system is designed to evaluate, account for, and measure ecosystem services and is widely used in identifying quality indicators, mapping, and valuing services (Haines-Young and Potschin, 2018). In this version of CICES V5.1, for each defined service, its purpose or available use provided by the ecosystem is identified, along with its attributes and behaviors. Therefore, the aim of CICES is to classify the contributions that ecosystem services provide for human well-being, which are derived from biotic environmental processes.
2.1.3. Analysis of the hydric significance of the region
The analysis of hydric significance was established through a matrix calculation, as validated by Šatalová and Kenderessy (2017), adjusting the parameters used to fit the reality of the study area. The parameters analyzed are considered by the aforementioned author as the main drivers of the environment's function, including:
-
Precipitation (P) – The precipitation in milimiters data were obtained from the National Water Agency (Agência Naciona de Águas - ANA) extension “ANA Data Acquisition” in QGIS 3.36.0 Maidenhead, over a period of 30 years: 1992 and 2022. Three rain gauge stations identified by the codes 02748004, 02748005, and 02748006 were analyzed. Due to the proximity of the points, the mean and maximum for each point were defined, and the maximum among the three points for each month in each year was transcribed. Initially, three precipitation volume scenarios were adopted for use in the final formula: score 0.5 (precipitation less than 400 mm); score 2 (precipitation between 1200 and 1400 mm); and score 3.5 (precipitation greater than 2600 mm). Precipitation holds the highest weight in the formula proposed by Šatalová and Kenderessy (2017). When a higher score is applied to represent rainfall volume in the formula, the resulting significance of water increases from “Good” to “Excellent.” Therefore, for the purpose of analyzing water significance and potential differences over a 30-year interval, only score 2 will be used, which represents precipitation between 1200 and 1400 mm in the region.
-
Slope (S) - The slope in degrees was obtained using the “Open Topography DEM Downloader,” which is also an extension within QGIS.
-
Soil (Texture (Tex) and Transmissivity (Trans)) - The pedology of the area was obtained from Embrapa data (https://www.bdsolos.cnptia.embrapa.br/consulta_publica.html). The texture and transmissivity were classified according to the Brazilian Soil Classification System (SiBICS, 1999). The nomenclature for classes established by Embrapa was followed, as listed: Cxa – Aluminum Haplic Cambisol; CXdb – Dystrophic Haplic Cambisol; CYbd – Dystrophic Fluvisol; DN – Dunes; Eko – Humic Orthic Spodosol; ESKg – Hydromorphic Ferralitic Spodosol; GXbd – Dystrophic Haplic Gleisol; Gxve – Eutrophic Haplic Gleisol; GZn – Saline Solonetzic Gleisol; Oxy – Hemic Haplic Organosol; PVAa – Aluminum Yellowish Red Argisol; PVAd – Dystrophic Yellowish Red Argisol; Rld – Dystrophic Litholic Neosol; RQg – Hydromorphic Quartzarenic Neosol; Rqo – Orthic Quartzarenic Neosol.
-
Moisture (Topographic Wetness Index - TWI) - The Topographic Wetness Index (TWI) was calculated to determine the groundwater condition and water accumulation, thereby identifying areas prone to flooding based on the values of each pixel (Beven and Kirkby, 1979).
-
Land Use and Land Cover (lulc) - This was extracted from MAPBIOMAS collection 8.0, where the area of interest includes: Forest Formation; Mangrove; Silviculture; Wetland; Pasture; Land Use Mosaic; Beach, Dune, and Sandy Area; Urban Area; Exposed Soil; Rocky Outcrop; Mining; Aquaculture; Apicum; Water Bodies; Soy; Rice; Temporary Crops; and Arboreal Restinga. There is a divergence in the nomenclature of natural systems among some authors. Neves (2017) separates mangroves, water bodies, and wetlands, while da Nunes da Cunha et al. (2015) considers those mentioned by Neves (2017) as macrohabitats of wetlands. In the present study, the original separation established by MapBiomas was maintained. For the use designated as “Mosaic of uses” by MapBiomas, an analysis was conducted on a larger scale to define the actual use, and it was preferable to establish the mosaic of uses as exposed soil.
Then, calculations were made according to the following Formula 1:
Each component of the cited parameters receives a score based on its relationship with water dynamics, considering storage capacity and infiltration, established through a literature review and the authors' prior knowledge. Finally, each parameter receives a value based on the weight represented in the analysis, as established by the literature (Šatalová and Kenderessy, 2017) (as shown in Table 1).
Parameters used with respective weights and scores employed in the formula proposed by Šatalová and Kenderessy (2017).
3. Results
3.1. Land use and Land Cover
Eighteen macrohabitats were identified in the study area, with 8 being natural and 10 anthropogenic, where soybean land use appeared only from 2002 onwards. It is noteworthy that anthropogenic areas account for 44.1% of land use (see Table 2), with the urban area doubling in size (1992: 7.82% - 2022: 15.53%), while natural areas represented 55.8% of the territory in 2022, showing a decrease of 5.3% over thirty years. This fact is due to the presence of the Serra do Tabuleiro State Park in the area, which, along with other conservation units, represents 34.6% of the studied territory.
Comparison of the area in hectares of each land use and land cover in the study area between the years 1992, 2002, 2012, and 2022.
3.2. Classification of ES from Each Natural System
All studied areas are capable of providing at least one ecosystem service, even the anthropized areas. However, overall, urban areas contribute minimally, if at all, to the provision of essential ecosystem services that underpin human existence. The lists of all services from the natural areas can be found in Table 3. It is essential to highlight the importance of forests and wetlands for the provision of ES, as they can offer 15 different services from the three proposed groups, including water flow regulation, climate regulation, disturbance moderation, and erosion prevention.
3.3. Water Significance Index
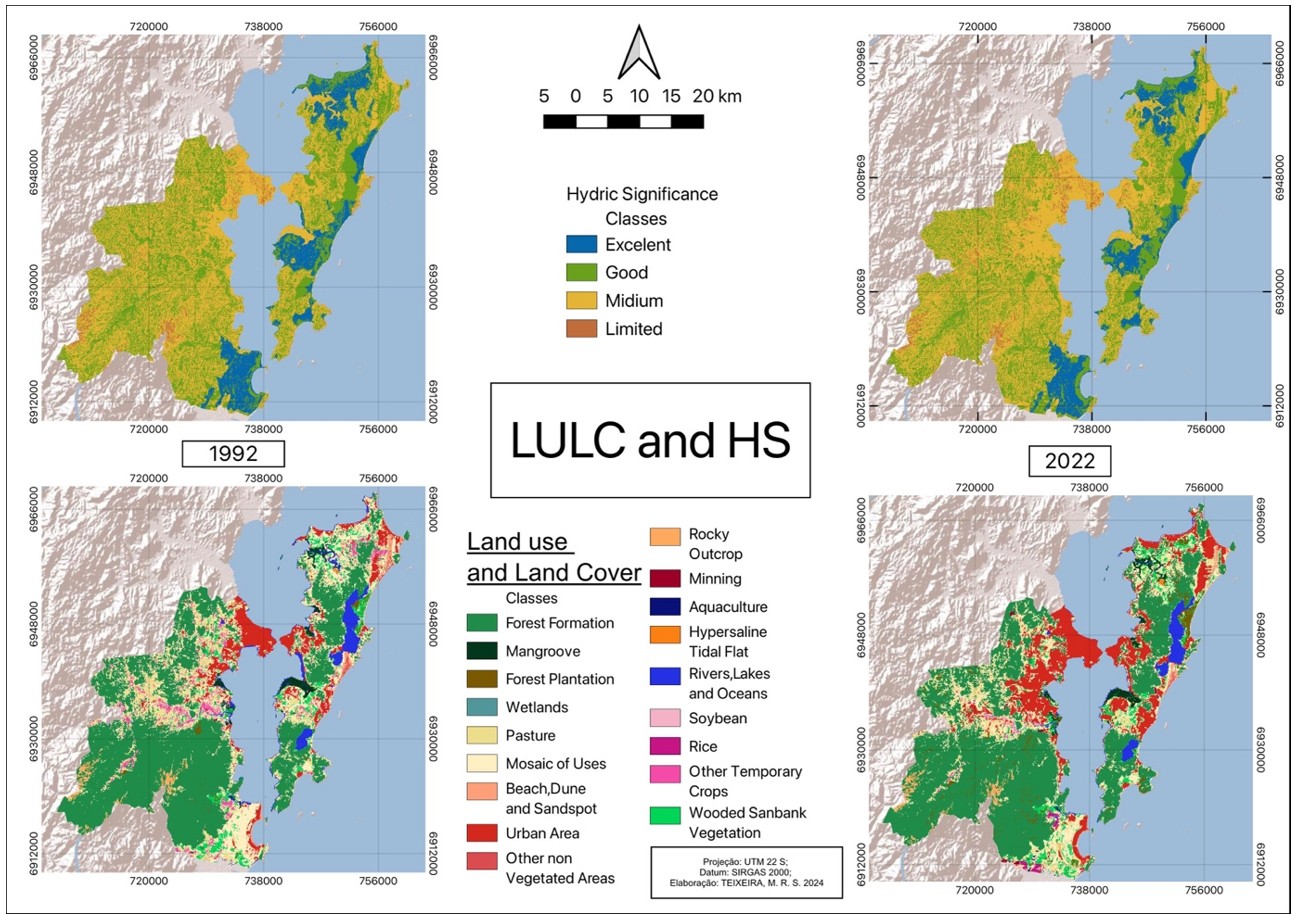
Summing the macrohabitats, separated into anthropized areas and natural areas, both in 1992 and 2022, natural areas account for the majority of the “Good” and “Excellent” water significance classifications. In contrast, anthropized areas are more prevalent in the “Limited” and “Moderate” categories (see Table 4).
Comparison of HS between the years 1992 and 2022, with the sum of anthropogenic (antro) and natural areas expressed as a percentage of the total area present in each class.
According to the results found, there is a minimal change in land use and occupation, as previously presented. Consequently, it was also expected that the change in hydric significance would be modest (as shown in Figure 2). Furthermore, the geography of the area exhibits significant altimetric variation, which favors the speed of surface water flow, contributing to HS in the 'limited' and 'medium' classes.

Evolution of hydric significance (first line) and land use and land cover (second line) between the year 1992 and 2022.
4. Discussion
Many authors discuss and analyze the effects of climate change on natural disasters in Southern Latin America, a region that is highly responsive to the effects of phenomena such as El Niño and La Niña. In 2014, Herrmann and collaborators presented a map showing the regions with the highest frequency of gradual flooding by municipality in Santa Catarina, with Greater Florianópolis (São José, Palhoça, Santo Amaro da Imperatriz, and Florianópolis) falling within the High to Very High frequency (maximum). In other words, the most common natural disaster in the state of Santa Catarina is gradual flooding, which causes multimillion-dollar socioeconomic impacts and becomes more severe during El Niño years.
In the case of Baptista and Severo (2018), the authors determined regions with homogeneous precipitation by grouping cities with similar characteristics. The area studied in this work is classified as “region 4.” This region corresponds to the Itajaí Valley and Greater Florianópolis, where severe flooding occurred between 1983 and 1984 as a result of El Niño. Additionally, since the 2000s, there has been an increase in the spectrum of precipitation variance for this region, with particular emphasis on the events of 2008, which is also attributed to the effects of El Niño. In another analysis, over a 30-year period (1979-2010), 13 episodes of accumulated rainfall exceeding 200 mm within 3 consecutive days were identified in the Greater Florianópolis region. Overall, this type of event does not occur more than once a year, except in 2008, when three cases were recorded, as mentioned above (Rodrigues et al., 2011).
It is known that the area studied by Šatalová and Kenderessy (2017) differs from the coastal region of Santa Catarina, and in order to adjust this analysis to Brazilian reality, some changes in the formula and parameters were necessary. However, it is important to highlight the impermanence of the formula concerning water volume scores. An increase in precipitation volume leads to an increase in surface water flow, which results in a decrease in the soil's absorption capacity (Tucci and Clarke, 1997). However, when the weight and score values within the formula are increased, the pixel values involved will also be higher. This gives a false impression that there will be a larger area of “Excellent” HS with an increase in rainfall volume.
As previously explained in the results, this 30-year interval showed little difference in the landscape, and in both years analyzed, the largest area of the map is classified as “Good” HS, accounting for 51.2%, leaving only 7.6% for the “Limited” significance class. Even with positive results regarding the hydric significance of the study area, the literature reports numerous cases of flooding in the region (Rodrigues et al., 2011; Gotado et al., 2018; Baptista and Severo, 2018; Magnago et al., 2021).
The region has a large forested area covering more than 50% of the total area, and one of the reasons for its high level of conservation is the presence of the Serra do Tabuleiro State Park. Based on its position when overlaid with the Digital Elevation Model, it can be said that this area is in a higher topographic region. Conversely, the lower topographies, closer to zero, are where the urban centers are located. Thus, even with the provision of flood control services upstream of the watershed, the position of urban areas still favors extreme flood events, making it necessary to reconsider downstream conservation and urban development.
Gotado et al. (2018) present an annual average precipitation of 1,743 mm in the Eastern region (Greater Florianópolis) of the state, with a maximum monthly precipitation of 928.78 mm. In a temporal analysis over a 30-year period (1985-2015), the average precipitation increased each decade, corresponding to 1,547 mm (1985-1994), 1,723 mm (1995-2004), and 1,897 mm (2005-2015), with a projection of 2,021 mm for 2024, indicating an increase of just over 21%, representing the highest increase in precipitation trends in the state.
A more recent analysis also found that hydrological natural disasters in the state of Santa Catarina are more frequent compared to climatological, meteorological, and geological disasters from 1998 to 2019, particularly in relation to variations in hydroclimatic events associated with El Niño and La Niña events (Magnago et al., 2021).
It is well known that coastal areas undergo intense urbanization processes (Woodroffe, 1995), which are strongly associated with flooding due to soil impermeabilization. The increase in water runoff causes large quantities of water to flow quickly, overwhelming drainage systems (Tucci and Bertoni, 2003). As observed in the study area during the months of November and December 2022, an overloaded drainage system combined with impermeable soil directs floodwater into the sea, resulting in physicochemical changes in the marine system.
Wetlands are extensively recognized for their water storage services, particularly in cases of flooding, as they reduce the volume of river flow and consequently diminish the economic value used for disaster containment. When associated with rivers, this function of wetlands is expressed downstream during floods (Nyman, 2011). Considering the author's observations regarding the conservation of wetlands downstream from the area of interest, the presence of urbanized areas in regions with high TWI values was a determining factor in increasing the discharge of freshwater into the southern bay of Greater Florianópolis.
According to the loss estimation reports conducted by EPAGRI, the flood of 2022 lead to a loss of 90% in the mussel production resulting in a total monetary loss of R$18,612,000, directly affecting 82 producers and families. In oyster production, there was also a 90% loss, totaling R$2,673,000. In São José, mollusc production experienced a 40% decline, with a loss of R$1,245,456.00 due to the desalination of water caused by the elevated freshwater road.
Oysters are typically found in estuarine areas where natural production is high, ensuring their development. However, these regions are also exposed to pollutants from human activities, particularly heavy metals resulting from agriculture, aquaculture, and urban development (Páez-Osuna et al., 1991).
The authors Souza et al., (2018) analyzed the capacity to reach concentrations of fecal indicator organisms (FIOs) and concluded that the urban infrastructure surrounding the studied watershed was significantly associated with variations in FIO levels in the water and in mussels. Similarly, the work of Ferguson et al. (1996) showed that water quality in the Georges River estuary in Sydney, Australia, was significantly affected by contaminating pathogens (fecal coliforms, Giardia, among others) due to rainfall runoff. Therefore, when considering changes in land use and land cover, there is a negation of natural processes that impacts their functions, failing to provide the essential services necessary to maintain water quality and, consequently, the concentration of contaminants in associated aquaculture.
As aforementioned studies link the positioning of watersheds and the effects of rainfall as exacerbating factors of contamination, allowing for a parallel to be drawn between water runoff (from rain, rivers, and streams) and areas directly affected by urbanization, particularly when observed through the digital elevation model of the region. In this context, the topography in the eastern part of Greater Florianópolis, extending to the nearest margins of the drainage systems, indicates that urbanized areas have a significant potential influence on aquaculture.
The favorable position of aquaculture in the southern bay of the Ilha Santa Catarina (ISC) supports the growth of bivalves; however, it can also be detrimental due to the impact of freshwater drainage from the mainland, which negatively affects the growth and survival of these species (Souza et al., 2016). EPAGRI (2009) reported high mortality rates of mussels due to severe rainfall events in 2008. Furthermore, scallops exhibit low tolerance to variations in salinity, which, in turn, is critical given their high economic value (Rupp and Parsons, 2004; Christophersen and Strand, 2003).
Natural disasters of climatic and hydrological origin make the state of Santa Catarina significantly susceptible to environmental and economic impacts, with flooding due to excessive rainfall being the primary phenomenon responsible for generating losses of over R$ 36 million in 2001 and R$ 42.6 million in 2008 across the state (Herrmann, 2014), and more than R$ 22.5 million in 2022.
When considering the anthropogenic and natural areas present, a false sense of security can be generated. Even though, in the studied region, natural areas are still larger than anthropogenic ones, it is crucial to take into account the positioning of cities, farmland, and exposed soils on the map. In Table 4, it is observed that over the 30-year period, areas with limited and moderate hydrological significance increase, while areas with good and excellent hydrological significance decrease. This change occurs due to the alteration in land use and land cover, as seen in Table 1.
These are situated in lower altitude regions and closer to the sea. Thus, the direction and flow of runoff would ultimately converge in anthropogenic areas, exacerbating social and economic impacts.
There is significant discussion within the academic community regarding how to classify and quantify ecosystem services (ES). One way to quantify these services is through monetary valuation via benefit transfer (Costanza et al., 2014). In this sense, the valuation of ES quantifies the contributions or benefits provided by the ecosystem to ensure human well-being (EPA, 2009). The use of a financial indicator is also a tool to quantify the risk of loss of these areas. However, it is important to remember that, as explained in the work of Nunes da Cunha et al. (2015), once a natural area has been lost, the values of the services lost are irreversible.
As a strategy to mitigate flood effects, the construction of reservoirs in urbanized areas is implemented to retain water volume and reduce its runoff (Penna et al., 2019). However, constructed/anthropogenic wetlands do not provide the same services as natural areas. According to Siva et al. (2023), reservoirs built for flood control purposes show a decline in water quality and the biodiversity of native fish species. Data collected on biodiversity and water quality upstream indicated a balanced ecological system, which was lost as it approached the anthropogenic reservoir. Furthermore, the study concluded that this strategy is not recommended due to the ecological impact caused.
The suppression of the landscape discus in this paper, has led to the loss of ecosystem services related to flood control in an urbanized area. This brings risks to society in both sanitary and economic terms, especially since this region is critical for the production of shellfish and tourism. Thus, even with money invested in the value of ecosystem services, an anthropogenic tool or even a restored ecosystem will never offer its services to the same extent or at the full value provided by a natural and conserved ecosystem. Therefore, even in a region with the presence of a conservation unit upstream of the watershed, the city's position greatly influences the level of risk the population faces from flooding. Hence, in addition to conserving key areas for the provision of ecosystem services. planning urban expansion through City Master Plans that assess the loss of ecosystem services, the costs of such losses, and the conservation of key areas for flood control is essential to ensure social, economic, and environmental security.
Acknowledgements
I would like to thank CAPES for the science funding scholarship that allows me to dedicate myself fully to the work conducted. I also extend my gratitude to UFSCar for its excellent efforts in developing the Graduate Program in Ecology and Natural Resources, of which I am a part.
References
-
BAPTISTA, G.C.Z. and SEVERO, D.L., 2018. Variabilidade espacial e temporal da precipitação de Santa Catarina. Geosul, vol. 33, no. 68, pp. 184-200. https://doi.org/10.5007/2177-5230.2018v33n68p184
» https://doi.org/10.5007/2177-5230.2018v33n68p184 -
BETRIE, G.D., MOHAMED, Y.A., VAN GRIENSVEN, A. and SRINIVASAN, R., 2011. Sediment management modelling in the Blue Nile Basin using SWAT model. Hydrology and Earth System Sciences, vol. 15, no. 3, pp. 807-818. https://doi.org/10.5194/hess-15-807-2011
» https://doi.org/10.5194/hess-15-807-2011 -
BEVEN, K.J. and KIRKBY, M.J., 1979. A physically based, variable contributing area model of basin hydrology/Un modèle à base physique de zone d’appel variable de l’hydrologie du bassin versant. Hydrological Sciences Journal, vol. 24, no. 1, pp. 43-69. https://doi.org/10.1080/02626667909491834
» https://doi.org/10.1080/02626667909491834 -
CHRISTOPHERSEN, G. and STRAND, Ø., 2003. Effect of reduced salinity on the great scallop (Pecten maximus) spat at two rearing temperatures. Aquaculture, vol. 215, no. 1-4, pp. 79-92. http://doi.org/10.1016/S0044-8486(02)00094-7
» http://doi.org/10.1016/S0044-8486(02)00094-7 -
COSTANZA, R., D’ARGE, R., DE GROOT, R., FARBER, S., GRASSO, M., HANNON, B., LIMBURG, K., NAEEM, S., O’NEIL, R.V., PARUELO, J., RASKIN, R.G., SUTTON, P. and VAN DEN BELT, M., 1997. The value of the world’s ecosystem services and natural capital. Nature, vol. 387, no. 6630, pp. 253-260. http://doi.org/10.1038/387253a0
» http://doi.org/10.1038/387253a0 -
COSTANZA, R., DE GROOT, R., SUTTON, P., VAN DER PLOEG, S., ANDERSON, S.J., KUBISZEWSKI, I., FARBER, S. and TURNER, R.K., 2014. Changes in the global value of ecosystem services. Global Environmental Change, vol. 26, pp. 152-158. http://doi.org/10.1016/j.gloenvcha.2014.04.002
» http://doi.org/10.1016/j.gloenvcha.2014.04.002 - DOROW, R., 2013. Coordenação e governança: um estudo de caso na cadeia de malacocultura da grande Florianópolis. Porto Alegre: Universidade Federal do Rio Grande do Sul, 237 p. Dissertação de Mestrado em Agronegócios.
- ENVIRONMENTAL PROTECTION AGENCY – EPA, 2009. Valuing the protection of ecological systems and services. Washington: EPA.
- EPAGRI, 2009. Síntese anual da agricultura de Santa Catarina Florianópolis: Instituto CEPA/EPAGRI.
-
FERGUSON, C.M., COOTE, B.G., ASHBOLT, N.J. and STEVENSON, I.M., 1996. Relationships betweenindicators, pathogens and water quality in an estuarine system. Water Research, vol. 30, no. 9, pp. 2045-2054. http://doi.org/10.1016/0043-1354(96)00079-6
» http://doi.org/10.1016/0043-1354(96)00079-6 -
FLORIANÓPOLIS. Prefeitura Municipal, 2010 [viewed 2 February 2023]. Plano municipal integrado de saneamento básico – PMISB [online]. Available from: https://www.pmf.sc.gov.br/arquivos/arquivos/pdf/20_08_2010_17.52.55.f36f3efbae9e3d317fc02f7512786bc9.pdf
» https://www.pmf.sc.gov.br/arquivos/arquivos/pdf/20_08_2010_17.52.55.f36f3efbae9e3d317fc02f7512786bc9.pdf - FOOD AND AGRICULTURE ORGANIZATION OF THE UNITED NATIONS – FAO, 2016. The state of world fisheries and aquaculture Rome: FAO.
- FOOD AND AGRICULTURE ORGANIZATION OF THE UNITED NATIONS – FAO, 2017. Fisheries and aquaculture statistics – Yearbook 2015 Rome: FAO.
-
GOTADO, R., PIAZZA, G.A., TORRES, E., SEVERO, D.L. and KAUFMAN, V., 2018. Distribuição espacial e temporal das chuvas no estado de Santa Catarina. Geosul, vol. 33, no. 67, pp. 253-276. http://doi.org/10.5007/2177-5230.2018v33n67p253
» http://doi.org/10.5007/2177-5230.2018v33n67p253 - HAINES-YOUNG, R. and POTSCHIN, M.B., 2018. Common international classification of ecosystem services (CICES). V5.1 and guidance on the application of the revised structure. Nottingham: Fabis Consulting, 53 p.
- HERRMANN, M.L.P., 2014. Atlas de desastres naturais do estado de Santa Catarina: período de 1980 a 2010 Florianópolis: IHGSC/Cadernos Geográficos.
-
HUGEN, D., 2022 [viewed 5 January 2023]. Dois rios estão em estado de emergência para enchentes e são monitorados em SC; veja cidades [online]. Available from: https://ndmais.com.br/tempo/dois-rios-estao-em-estado-de-emergencia-para-enchentes-e-sao-monitorados-em-sc-veja-cidades/
» https://ndmais.com.br/tempo/dois-rios-estao-em-estado-de-emergencia-para-enchentes-e-sao-monitorados-em-sc-veja-cidades/ -
INSTITUTO NACIONAL DE METEOROLOGIA – INMET, 2022 [viewed 5 January 2023] Eventos extremos: chuvas intensas e onda de calor foram os destaques de dezembro de 2022 no Brasil [online]. Available from: https://portal.inmet.gov.br/noticias/eventos-extremos-chuvas-intensas-e-onda-de-calor-atingem-diferentes-regiões-do-brasil-em-dezembro-de-2022
» https://portal.inmet.gov.br/noticias/eventos-extremos-chuvas-intensas-e-onda-de-calor-atingem-diferentes-regiões-do-brasil-em-dezembro-de-2022 -
INTERGOVERNMENTAL PANEL ON CLIMATE CHANGE – IPCC, 2022 [viewed 9 September 2024]. Sixth assessment report: Climate change 2022: Impacts, adaptation and vulnerability [online]. Cambridge: Cambridge University Press. Available from: https://www.ipcc.ch/report/ar6/wg2/
» https://www.ipcc.ch/report/ar6/wg2/ -
LUZ, A., 2019 [viewed 5 November 2021]. Sul da Ilha: o maior berço das ostras catarinenes [online]. Available from: https://ndmais.com.br/economia/sul-da-ilha-o-maior-berco-das-ostras-catarinenses/
» https://ndmais.com.br/economia/sul-da-ilha-o-maior-berco-das-ostras-catarinenses/ -
MAGNAGO, R.F., MEDEIROS, P., RAIMUNDO, R.P. and COSTA, S.C., 2021. Desastres Naturais no Estado de Santa Catarina - 1998 a 2019. MIX Sustentável, vol. 7, no. 4, pp. 105-114. http://doi.org/10.29183/2447-3073.MIX2021.v7.n4.105-114
» http://doi.org/10.29183/2447-3073.MIX2021.v7.n4.105-114 - NASCIMENTO, R., 2002. Atlas ambiental de Florianópolis: Instituto Larus. Florianópolis: Instituto Larus, 81 p.
- NEVES, J., 2017. Uso da terra e a urbanização dos ambientes costeiros na ilha de Santa Catarina, SC, Brasil Florianópolis: Universidade Federal de Santa Catarina, 364 p. Tese de doutorado.
- NUNES DA CUNHA, C., PIEDADE, M.T.F. and JUNK, W.J., eds., 2015. Classificação e delineamento das áreas úmidas brasileiras e de seus macrohabitats Cuiabá: EdUFMT, vol. 1.
-
NYMAN, J.A., 2011. Ecological functions of Wetlands. In: B. LEPAGE, ed. Wetlands Dordrecht: Springer, pp. 115-128. https://doi.org/10.1007/978-94-007-0551-7_6
» https://doi.org/10.1007/978-94-007-0551-7_6 -
PÁEZ-OSUNA, F., ZAZUETA-PADILLA, H.M. and IZAGUIRRE-FIERRO, G., 1991. Trace metals in bivalves from Navachiste lagoon, México. Marine Pollution Bulletin, vol. 22, no. 6, pp. 305-307. http://doi.org/10.1016/0025-326X(91)90809-7
» http://doi.org/10.1016/0025-326X(91)90809-7 -
PENNA, L., RIBEIRO, F., ROCHA, C. and FILHO, A., 2019. A utilização de reservatórios no amortecimento de vazões de cheia: apresentação e discussão de casos do sudeste brasileiro. Geografia e Ordenamento do Território, no. 16, pp. 275-295. http://doi.org/10.17127/got/2019.16.012
» http://doi.org/10.17127/got/2019.16.012 - PIZZI, E. 2020. Análise de precipitação intensa e desastres naturais por meio de séries climatológicas no período de 1998 a 2009 no Vale do Itajaí e Grande Florianópolis em Santa Catarina. Palhoça: Universidade do Sul de Santa Catarina, 91 p. Trabalho de Conclusão de Curso - Engenharia Ambiental e Sanitária.
- RODRIGUES, M.L.G., YNOUE, R. and ALVES, M.P., 2011. Episódios de chuva intensa na região da grande Florianópolis/SC: análise preliminar dos eventos e caracterização sinótica. In: IV Simpósio Internacional de Climatologia, 16-19 Outubro 2011, João Pessoa. João Pessoa: SBMet.
-
RUPP, G.S. and PARSONS, G.J., 2004. Effects of salinity and temperature on the survival and byssal attachment of the lion’s paw scallop Nodipecten nodosus at its southern distribution limit. Journal of Experimental Marine Biology and Ecology, vol. 309, no. 2, pp. 173-198. http://doi.org/10.1016/j.jembe.2004.03.018
» http://doi.org/10.1016/j.jembe.2004.03.018 -
SANTA CATARINA, 2017 [viewed 1 August 2024]. Plano estadual de recursos hídricos de SANTA CATARINA - PERH/SC [online]. Available from: https://www.aguas.sc.gov.br/jsmallfib_top/DHRI/Plano%20Estadual/etapa_c/PERH_SC_Recomendacoes_enquadramento_CERTI-CEV_2017_final.pdf
» https://www.aguas.sc.gov.br/jsmallfib_top/DHRI/Plano%20Estadual/etapa_c/PERH_SC_Recomendacoes_enquadramento_CERTI-CEV_2017_final.pdf -
ŠATALOVÁ, B. and KENDERESSY, P., 2017. Assessment of water retention function as tool to improve integrated watershed management (case study of Poprad river basin, Slovakia). The Science of the Total Environment, vol. 599-600, pp. 1082-1089. http://doi.org/10.1016/j.scitotenv.2017.04.227 PMid:28511353.
» http://doi.org/10.1016/j.scitotenv.2017.04.227 - SCHNEIDERS, A. and MULLER, F., 2017. A natural base for ecosystem services. In: B. BURKHARD and J. MAES, eds. Mapping ecosystem services. Sofia: Pensoft Publishers, pp. 35-40.
- SILVA, M.C. and MATTEI, L., 2013. Breves notas sobre a demografia na região da Grande Florianópolis na primeira década do século XXI. Revista NECAT-Revista do Núcleo de Estudos de Economia Catarinense, vol. 2, no. 3, pp. 89-101.
- SISTEMA BRASILEIRO DE CLASSIFICAÇÃO DE SOLOS – SiBICS, 1999. Sistema brasileiro de classificação de solos Brasília: Embrapa.
-
SIVA, L.A., KIMURA, R.S.Y., BRAMBILLA, E.M., SILVA, S.O. and NOGUEIRA, M.G., 2023. Impacts of an urban flood control infrastructure on the limnology and ichthyofauna of a basaltic Cuesta stream (southeast Brazil). Brazilian Journal of Biology = Revista Brasileira de Biologia, vol. 83, pp. e276585. http://doi.org/10.1590/1519-6984.276585 PMid:38126641.
» http://doi.org/10.1590/1519-6984.276585 -
SOUZA, R.V., DE CAMPOS, C.J.A., GARBOSSA, L.H.P., VIANNA, L.F.N. and SEIFFERT, W.Q., 2018. Optimising statistical models to predict faecal pollution in coastal areas based on geographic and meteorological parameters. Marine Pollution Bulletin, vol. 129, no. 1, pp. 284-292. http://doi.org/10.1016/j.marpolbul.2018.02.047 PMid:29680550.
» http://doi.org/10.1016/j.marpolbul.2018.02.047 -
SOUZA, R.V., NOVAES, A.L.T., GARBOSSA, L.H.P. and RUPP, G.S., 2016. Variações de salinidade nas Baías Norte e Sul da Ilha de Santa Catarina: implicações para o cultivo de moluscos bivalves. Agropecuária Catarinense, vol. 29, no. 3, pp. 45-48. http://doi.org/10.52945/rac.v29i3.147
» http://doi.org/10.52945/rac.v29i3.147 -
TROELL, M., NAYLOR, R.L., METIAN, M., BEVERIDGE, M., TYEDMERS, P.H., FOLKE, C., ARROW, K.J., BARRETT, S., CREPIN, A., EHRLICH, P.R., GREN, A., KAUTSKY, N., LEVIN, S.A., NYBORG, K., OSTERBLOM, H., POLASKY, S., SCHEFFER, M., WALKER, B.H., XEPAPADEAS, T. and ZEEUW, A., 2014. Does aquaculture add resilience to the global food system? Proceedings of the National Academy of Sciences of the United States of America, vol. 111, no. 37, pp. 13257-13263. http://doi.org/10.1073/pnas.1404067111 PMid:25136111.
» http://doi.org/10.1073/pnas.1404067111 - TUCCI, C.E. and BERTONI, J.C., 2003. Inundações urbanas na América do Sul. Itajaí: ABRH-SC, 471 p.
- TUCCI, C.E.M. and CLARKE, R.T., 1997. Impacto das mudanças da cobertura vegetal no escoamento: revisão. Revista Brasileira de Recursos Hídricos, vol. 2, no. 1, pp. 135-152.
-
WOODROFFE, C.D., 1995. Response of tide‐dominated mangrove shorelines in Northern Australia to anticipated sea‐level rise. Earth Surface Processes and Landforms, vol. 20, no. 1, pp. 65-85. http://doi.org/10.1002/esp.3290200107
» http://doi.org/10.1002/esp.3290200107