 Navigating economic shocks: the role of oil prices, fiscal policy, and technology in Iran's agricultural sector
Abstract
The instability of global oil markets significantly challenges Iran's economy, primarily due to the government's substantial dependence on oil revenues for its annual budget. This study uses a dynamic stochastic general equilibrium (DSGE) model to analyze the effects of oil revenue fluctuations, government spending, and technological advancements on various economic sectors, focusing particularly on agriculture. Our findings indicate that oil price shocks negatively impact agricultural production, primarily due to the Dutch disease affecting Iran's economy. The increase in oil revenues has shown limited beneficial spillover into non-oil sectors, highlighting structural inefficiencies. Although shocks in government spending initially boost employment across agriculture, industry, and services, their long-term effects on production and investment are minimal. In contrast, technological advancements reliably improve production, employment, and investment in all sectors, underscoring innovation's vital role in fostering economic growth. The study emphasizes the need for strategic fiscal policies to lessen the dependence between government budgets and oil revenues, thereby reducing the negative repercussions of oil price fluctuations. Additionally, targeted incentives for technological adoption are crucial for enhancing productivity and economic resilience. This research offers key insights for policymakers focused on stabilizing Iran's economy amid global oil market volatility and provides a strong framework for understanding the relationship between resource dependence, fiscal policy, and technological advancement in resource-rich countries.
Keywords:
oil price shock; agriculture; production; DSGE model; Dynamic Stochastic General Equilibrium; technological innovation; dutch disease
Resumo
A instabilidade dos mercados globais de petróleo representa um desafio significativo para a economia iraniana, principalmente devido à forte dependência do governo em relação às receitas do petróleo para seu orçamento anual. Este estudo utiliza um modelo de Equilíbrio Geral Estocástico Dinâmico (DSGE) para analisar os efeitos das flutuações das receitas do petróleo, dos gastos governamentais e dos avanços tecnológicos em diversos setores econômicos, com foco particular na agricultura. Nossos resultados indicam que os choques nos preços do petróleo impactam negativamente a produção agrícola, principalmente devido à Doença Holandesa que afeta a economia iraniana. O aumento das receitas do petróleo apresentou um impacto benéfico limitado em setores não petrolíferos, evidenciando ineficiências estruturais. Embora os choques nos gastos governamentais inicialmente impulsionem o emprego na agricultura, indústria e serviços, seus efeitos a longo prazo sobre a produção e o investimento são mínimos. Em contrapartida, os avanços tecnológicos melhoram de forma consistente a produção, o emprego e o investimento em todos os setores, ressaltando o papel vital da inovação no fomento do crescimento econômico. O estudo enfatiza a necessidade de políticas fiscais estratégicas para reduzir a dependência entre os orçamentos governamentais e as receitas do petróleo, diminuindo assim as repercussões negativas das flutuações do preço do petróleo. Além disso, incentivos direcionados à adoção de tecnologias são cruciais para aumentar a produtividade e a resiliência econômica. Esta pesquisa traz informações importantes para formuladores de políticas focados na estabilização da economia iraniana em meio à volatilidade do mercado global de petróleo e fornece uma estrutura sólida para a compreensão da relação entre dependência de recursos, política fiscal e avanço tecnológico em países ricos em recursos naturais.
Palavras-chave:
choque do preço do petróleo; agricultura; produção; modelo DSGE; Equilíbrio Geral Estocástico Dinâmico; inovação tecnológica; doença holandesa
1. Introduction
The agricultural sector is crucial for developing countries heavily reliant on oil exports. It ensures food security, creates jobs, boosts non-oil exports, and reduces rural migration (Permeh et al., 2017). In developing nations, a significant percentage of the population is directly or indirectly reliant on agriculture for their livelihood (Mozumdar, 2012). It provides vital support for various economic activities, including manufacturing, marketing, trade, and services. From 2000 to 2020, the sector accounted for approximately 19% of the total employment in major and minor oil-exporting countries. Additionally, it plays a significant role in meeting the food consumption needs of the population, particularly in rural areas (Abdlaziz et al., 2018). In many major oil-exporting nations, rapid population growth and high unemployment rates pose significant challenges. The oil and gas sectors, being capital and technology-intensive, do not effectively address these issues. In contrast, the agricultural sector has the potential to make a substantial impact by reducing unemployment rates and positively influencing macroeconomic structures (Mansfeld and Winckler, 2007).
The significance of oil in the macro economy has declined over the past thirty years, but oil prices still have a substantial influence on the economy. Studies have shown that changes in oil prices affect the agricultural sector, but there is limited research on the specific impacts of these shocks (Wang et al., 2020; Dahl et al., 2020; Elleby et al, 2020). The susceptibility of the agricultural sector to oil price shocks, encompassing both demand shocks associated with non-OPEC oil and supply shocks stemming from OPEC, has been the focus of considerable scrutiny. Investigating and quantifying these shocks and their impact on agriculture is undoubtedly crucial (Alwerfalli, 2022). Oil price shocks have a substantial impact on economic activity, especially in open economies (Meenagh et al., 2015; Oladunni, 2020). These effects stem from the timing of economic agents' decisions and can explain a significant portion of business cycle fluctuations. Oil-exporting emerging economies, in particular, face distinct challenges from oil price shocks, including the Dutch disease. The impacts of oil price shocks on these economies are contingent on their underlying causes and the economic conditions (Charles et al., 2021). Macroeconomic uncertainty, which encompasses the indirect spillover effects of both supply and demand shocks, plays a vital role in magnifying the response of economic activity to oil price shocks (Charles et al., 2021). In essence, the effects of oil price shocks on economic activity are intricate and multi-faceted, underscoring the necessity for detailed analysis (Ahmadi and Manera, 2021). Every economy, no matter its level of development or size, is vulnerable to the negative effects of uncertainties and economic shocks. These unpredictable events can cause substantial damage and turmoil to economic factors, creating higher risk and decision-making complexities (DeMartino et al., 2024). Moreover, the interdependence of economic factors can magnify the impact of the shocks, ultimately leading to economic instability. This instability can result in various costs, including disruption in resource allocation, decreased production, investment, and employment, as well as fluctuations in prices (Pant et al., 2014). It is imperative for policymakers and economic stakeholders to comprehend how shocks spread and to assess their influence on economic factors. This understanding is essential for making well-informed decisions to alleviate the negative repercussions of such shocks. Moreover, this knowledge offers valuable perspectives for investors and economic players, enabling them to foresee and mitigate potential ramifications, and thus make prudent decisions that minimize risk.
Revenue derived from the sale of oil plays a pivotal role as a primary source of financial and foreign currency for governments of oil-exporting nations. Given the substantial oil share in Iran's economy, the impact of volatile oil revenues on tangible sectors has consistently been substantial. An increase in oil prices has varying impacts on the growth of tradeable and non-tradeable goods and services. This causes a notable disparity in the prices of factors and price indices across different sectors, resulting in a weakening of tradables (e.g., agriculture and industry) and a strengthening of non-tradeables (e.g., construction) (Permeh et al., 2017).
The existing body of literature delves into the correlation between oil price shocks and the agricultural sector using various models and frameworks, notably computable general equilibrium (CGE) (Sun et al., 2021), vector autoregressive (VAR) (Raouf, 2021), and dynamic stochastic general equilibrium (DSGE) models (Zhang et al., 2022; Amin et al., 2022). These studies reveal that oil price shocks can lead to significant indirect impacts on the agricultural sector by influencing product and factor markets. This influence manifests in distinct ways for oil-exporting and oil-importing countries, affecting government expenditure on current and capital outlays, and subsequently impacting output, oil prices, and economic activity through diverse channels. Moreover, the susceptibility of emerging economies to oil price shocks is an area of concern due to their escalating reliance on oil consumption. Hanson (1991) and Hanson et al. (1993) studied the effects of oil price shocks on U.S. agriculture. They found that factors such as exchange rate adjustments, foreign borrowing, and government support programs for agriculture also play a significant role beyond the direct and indirect energy costs. Sayadi and Bahrami (2015) and Sayadi et al. (2016) explored the impact of oil revenue shocks using a DSGE model. Their findings suggest that such shocks can lead to increased consumption and government spending and reduced short-term inflation. Additionally, their research revealed that oil revenue growth can support private-sector production and contribute to the National Development Fund.
Several empirical studies have demonstrated a relationship between government expenditure and economic development (Herrera, 2007; Usman et al., 2011; Ebong et al., 2016; Nyasha and Odhiambo, 2019 and Ahuja and Pandit, 2020). Some research indicates that government spending is influenced by economic growth, suggesting that as different sectors of the economy develop, the government may need to increase its spending. Conversely, other studies suggest that government spending is an exogenous factor that can directly impact economic growth and serve as a policy instrument. An uptick in government spending, which results in heightened aggregate demand, fosters increased overall production in the economy and has the potential to drive up employment, profitability, and investment (Nwude et al., 2023). In many oil-exporting countries, empirical evidence suggests that government consumption expenditure is influenced by fluctuations in oil income. This implies a positive correlation between oil income and financial policies in these nations. Therefore, the sudden fluctuation in global oil prices can have ripple effects on various economic indicators, such as government expenditure (Agboola et al., 2024). Notably, public investment has the most substantial effect, leading to a persistent and favorable impact on GDP (Patel and Sandnes, 2020). Nevertheless, the influence on private consumption is not consistently positive. These findings underscore the intricate nature of evaluating the macroeconomic implications of government spending shocks (Colombo, 2019).
In the past few decades, agriculture has experienced a significant transformation driven by technological advancements, establishing itself as a key sector in major economies such as China, India, the U.S.A., and Brazil (Abdullahi et al., 2015). This transformation has involved a shift from traditional farming methods to market-driven entrepreneurship and the incorporation of modern technologies. While technology has led to increased productivity, employment, and sustainability, it has also raised concerns about labor availability and environmental impact (Ahmad and Sultan, 2021). More recently, the agricultural sector has adopted information technologies, including IoT, AI, autonomous robots, and cyber-physical systems, giving rise to digital agriculture. This integration has resulted in improved productivity and efficiency, particularly during labor shortages caused by the Covid-19 pandemic (Passarelli et al., 2023).
The field of oil economy research has mostly focused on various aspects, but there has been a lack of attention given to studying the effects of oil import/export, government spending, and technological advances on economic variables, especially within the agricultural sector. To fill this gap, our research aims to construct a model to analyze the impact of oil shocks within a stochastic dynamic general equilibrium framework (real business cycle model) on the economy of Iran, with a specific focus on the agricultural sector.
2. Materials and Methods
Dynamic Stochastic General Equilibrium (DSGE) modeling represents a macroeconomic methodology commonly employed by monetary and fiscal authorities for policy analysis, historical time-series data interpretation, and future forecasting purposes. DSGE econometric modeling leverages general equilibrium theory and microeconomic principles in a manageable fashion to postulate economic phenomena, including economic growth, business cycles, policy effects, and market shocks. DSGE is a type of economic models that can calculate the trajectory of fundamental economic variables while taking into account external shocks and initial conditions (Torres, 2020). The model framework in this study represents a real business cycle model rooted in microeconomics principles. It considers essential conditions such as competitive markets and a frictionless economy. The study segregates production, investment, capital stock, and employment variables into public and private sectors to observe the impact of oil impulses and government consumption expenditures on both sectors. In the context of Iran's oil-based economy, it has traditionally been assumed that the government would derive its revenue primarily from oil sources. Based on this income, the government engages the labor force from households and allocates a portion of its earnings to government-led production. As such, the overarching economic model encompasses the interactions between the firm, household, and government sectors.
2.1. Households
In this economic model, there is an infinite number of atomistic yet identical households within the population. Thus, a representative household is used to approximate the consumption and work-hour preferences of all households. The main aim of the representative household is to maximize utility while operating within an intertemporal budget constraint. The utility function is formulated in Equations 1 and 2 in a specific mathematical form.
Where is the discount factor, is a composite index of consumption goods, are hours of work, is the relative risk aversion coefficient, otherwise referred to as the inverse of the elasticity of inter-temporal substitution, and is the elasticity of the marginal dis-utility of labour. Both and take, strictly, positive values. The total consumption of the household, denoted as Ct, comprises of non-tradable (domestic) goods, , as well as imported goods, . The composite consumption for the economy can be represented using aggregator Equation 3:
The parameter " " represents the proportion of domestically produced, non-tradable goods in total consumption. This can be interpreted as the "home bias" coefficient. On the other hand, "1- " represents the weight of foreign goods in total consumption, indicating the import share in total domestic consumption. This can be referred to as the degree of openness index for this economy. The parameter " > 0" represents the elasticity of substitution between domestically produced non-tradable goods () and imported goods (), signifying the consumer's preference for product variety.
The consumption of non-tradable and imported goods is delineated through the use of Constant Elasticity of Substitution (CES) of aggregates, as expressed by a constant elasticity of substitution in Equation 4.
To optimize household expenditure on goods, it is essential to minimize expenses for each category by employing the respective Constant Elasticity of Substitution (CES) consumption aggregators. By reducing the overall cost of consumption based on the composite consumption index, an optimal allocation of spending for a household can be determined. This allocation takes into consideration the significance of non-tradable goods and imports in the total consumption basket, leading to the derivation of the subsequent demand functions (Equations 5, 6 and 7).
The consumer price index, denoted as Pt, is defined as the overall measure of the change in prices of a defined basket of goods and services that are typically purchased by households.
The application of a log transformation to the Equation 6 yields a Consumer Price Index (CPI) represented in the Cobb-Douglas functional form as in the Equation 8:
The intertemporal budget constraint of the representative household can be formulated as follows (Equation 9):
The consumer's minimum total consumption expenditure (PtCt) depends on the wage rate (Wt) and the asset portfolio (Bt) and its nominal pay-off in the next period (Bt+1). The domestic interest rate is denoted as Rt, the lump-sum tax is represented as Tl, and the profits transferred to households by the domestic monopolistically competitive firms are indicated as Pt. In the context of economic decision-making, the representative household optimizes its consumption, labor choices, and asset allocation to maximize overall well-being, while adhering to the current inter-temporal budget constraint.
Under the household budget constraint, the fundamental structure of the household problem can be defined as Equation 10:
Where is the Lagrangian multiplier capturing the marginal utility of wealth. The FOCs (first order conditions) for Equation 10 with respect to consumption (Ct), labor supply (hours of work) (Lt), and household portfolio of assets (Bt) can be derived as Equations 11-13:
Upon combining Equations 11 and 12, we derive the subsequent Equation 14:
Equation 14 represents the labor supply equation, equating the marginal value of labor to the marginal utility of consumption. It highlights the trade-off between leisure and consumption, stating that higher consumption is only possible with an increase in labor hours or a rise in real wages while maintaining the same level of leisure.
Equation 15 is the Consumption Euler equation, obtained by re-arranging Equation 13 and substituting and .
The consumption Euler equation emphasizes the impact of the interest rate (R) on household decisions regarding inter-temporal consumption.
2.2. Firm
The empirical data from oil-exporting nations suggests that a substantial portion of oil revenues is channeled into government investment once the influx of oil revenues into the economy surpasses a certain level. It is crucial to note that the rise in government investment has the potential to enhance the efficiency of the capital stock within this sector. The concept of relative efficiency suggests that the efficiency of government capital stock after the oil shock, as compared to before the shock, can gauge the influence of increased oil revenues on real production growth. Hence, to examine the impact of state capital on actual production, an exogenous inclusion of state capital has been made in the private sector's production function. This entails that the private sector does not play a role in determining the quantity of public sector capital. The anticipation is for the government to inject funds into enhancing and establishing economic infrastructure, leading to the internalization phenomenon that will benefit the private sector. The household possesses a private business that manufactures private product according to the Equation 16:
In this production function, the firm utilizes three fundamental inputs: private capital per capita (), labor supply (), and government capital per capita (). The per capita capital of the public sector is believed to boost the production of private sector businesses. However, this variable is considered exogenous, and enterprises do not influence it.
The Cobb-Douglas production function Equation 16 has been specified with constant returns to scale for private capital and labor per capita. Market prices are taken into consideration for determining the company's profit, and the company aims to maximize the profit derived from the production of goods (Equations 17-20).
The firm's goal of profit maximization requires that the marginal production of input equals the marginal cost:
2.3. Government
The government sector is an important part of Iran's economy, involved in producing public goods. The government is assumed to hire labor from households and allocate a portion of its investment towards producing public goods. The production function for public goods or the public sector can be expressed in the Equation 21:
The variables and represent the amount of labor and capital utilized by the government in the production of public goods. Meanwhile, signifies the technical progress in total production, standardized to 1 for convenience. The impact of technology on the economy is commonly perceived through the avenue of oil revenue allocation. This production function maintains a constant return to scale, akin to the firm production function. Furthermore, it assumes that the productivity levels of both the private and public sectors are equivalent.
This study operates under the assumption that government investment in Iran, akin to most resource-rich nations, encounters constraints and inefficiencies, resulting in elevated investment costs for the public sector. To demonstrate the inefficiencies of public sector investment, we can analyze the government sector's capital accumulation process in the Equation 22:
represents the gross government investment (exogenous), is the capital depreciation rate (ranging between zero and one), and denotes the state capital stock. Additionally, if the final production of labor equals the marginal cost of its use, another equilibrium condition can be derived as in the Equation 23:
In every period, the government is confronted with the following budget constraint (Equation 24):
The government expenses for consumer goods, investment, and bonuses cannot exceed the total foreign income (Equation 25). Additionally, capital cannot be freely transferred between the private and public sectors. The government's fiscal policy is based on oil revenues. This is reflected in a VAR model that shows the impact of oil revenues on government consumption and the economy.
In this regard, represents the level of oil revenues in a stable state and represents oil impulses.
2.4. Market clearing condition
To achieve market equilibrium, the total supply must match the total demand. In this context, the total production encompasses both the non-oil sector and oil production (Equation 26):
The non-oil production in the country equals the combined production of the private and public sectors (Equation 27):
Also, total investment in the economy () is equal to the sum of public sector investment () and private sector investment () (Equation 28):
Hence, based on these analyses, the market clearing condition may be formulated as in the Equation 29:
2.5. Parameter calibration, model solution and simulation
For the analysis of the impact of an oil revenue shock, the model's structural parameters have been calibrated to align with the general characteristics of small open economies that export primary products. This calibration also takes into account the specific features of Iran's economy. In this process, we draw from the extensive small open economy literature and the limited literature on Iran and similar emerging and developing economies' business cycle traits. Additionally, data-driven estimates obtained from time series procedures have been utilized. For an economy to reach equilibrium, households and firms need to optimize their decision-making, the government has to balance its budget, and all markets must reach stability. This state of rational expectations involves a group of external variables that generate a series of equations derived from optimization, government budget constraints, and overall market stability. In this study, we attempted to optimize the model parameters to achieve the closest possible alignment between real statistical data and generated simulation data.
3. Results
3.1. Effects of oil price shocks
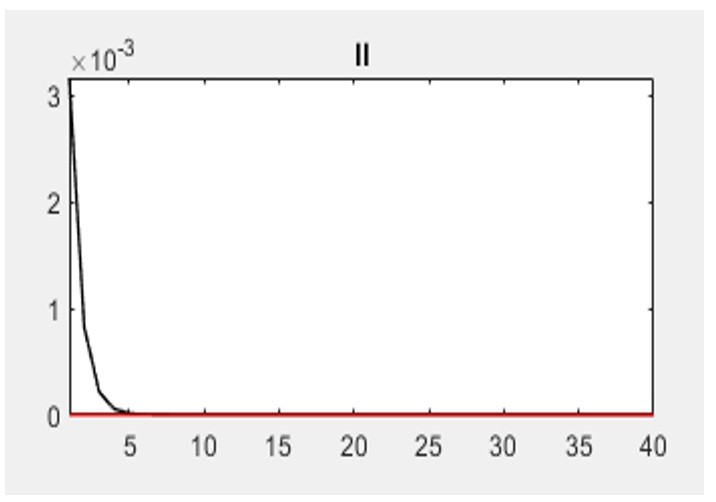
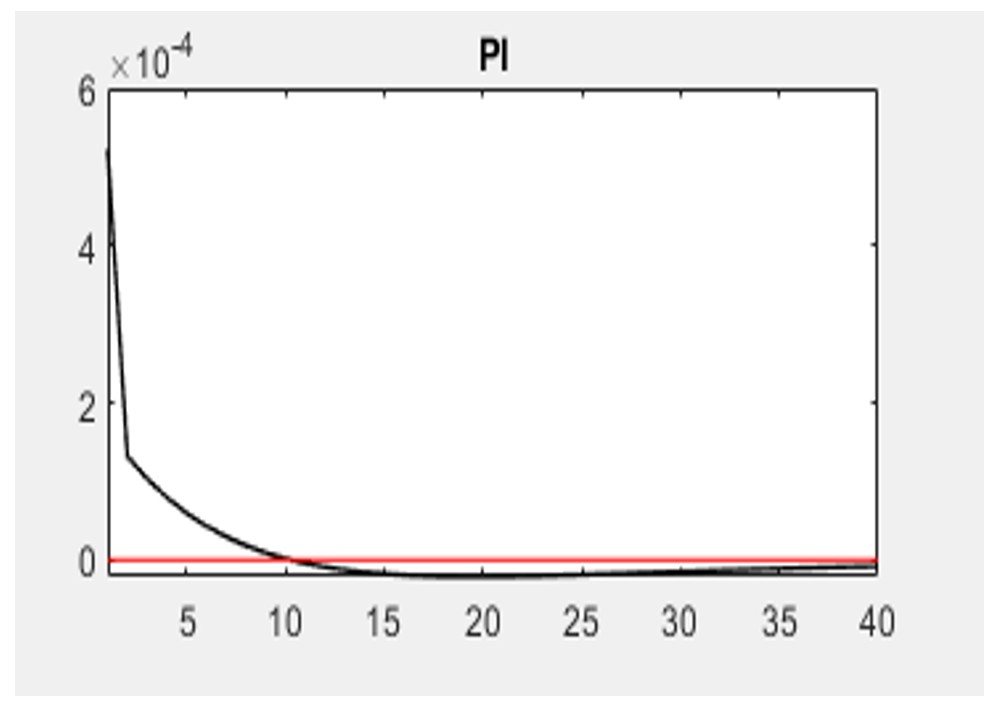
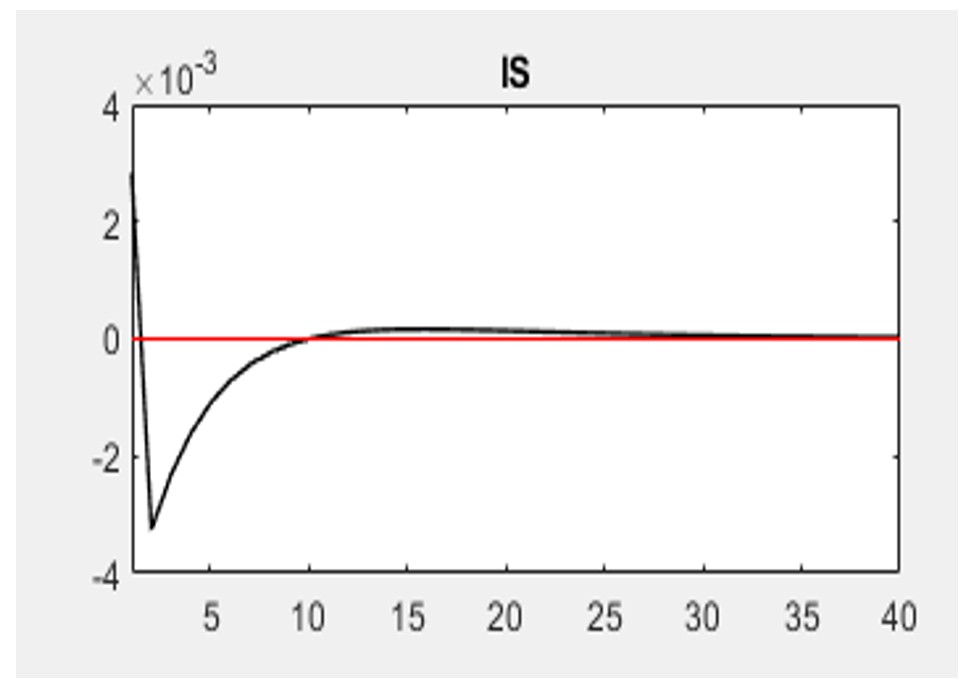
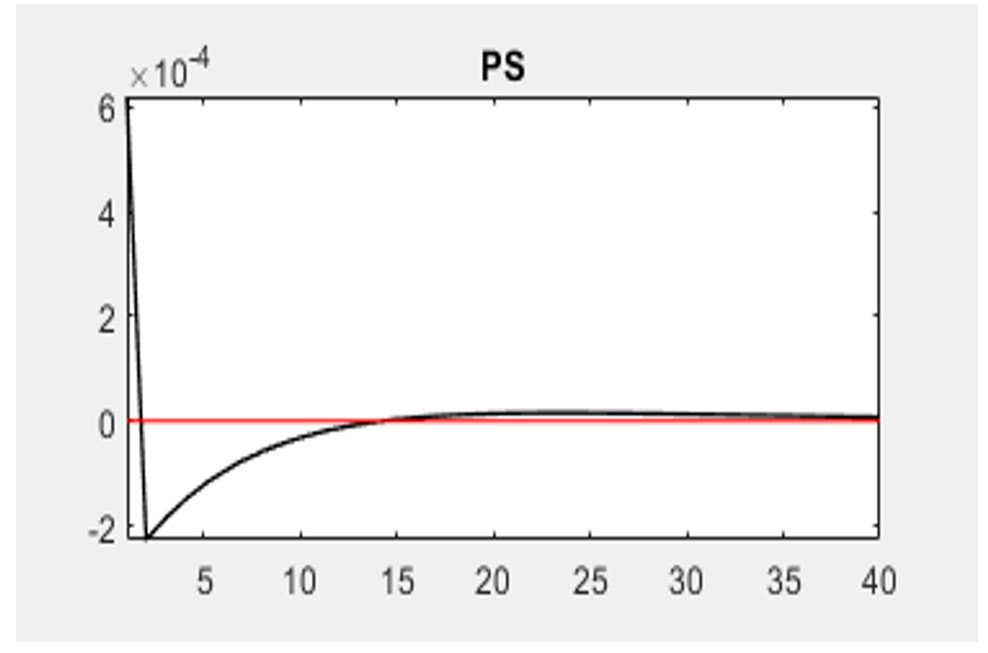
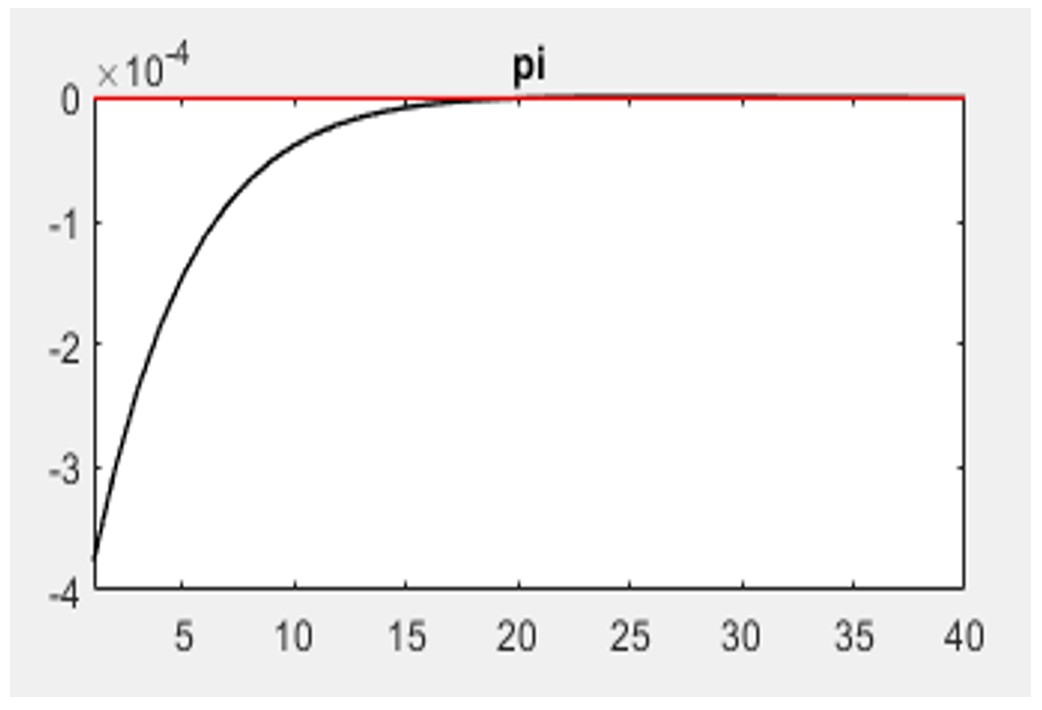
According to Figures 1-4, in the industry sector, the oil price shock initially led to a surge in total industry production during the first period. The highest growth rate, at 0.045%, occurred in the first year. However, after this, total production experienced a steep decline due to the increase in oil prices, resulting in negative changes in production rates from the second year onwards. Nevertheless, after 15 years, there was a shift towards positive changes in overall industry production trends, slightly exceeding zero. Over time, the shock gradually waned in the latter years, indicating a diminishing long-term impact on overall industry production. The impact of an oil price shock on overall economic output is insufficient to raise production levels above zero for multiple periods. As a result, it can be inferred that a one standard deviation shock to oil prices will not lead to sustained real production growth in the industrial sector over the long term. The results found that the initial impact of an oil price shock on industrial sector investment is positive, leading to a 0.28% increase in the first year. However, this effect diminishes rapidly, and from the fifth period onward, the impact of the shock becomes less pronounced. Consequently, the long-term effect of oil price shocks on industrial sector investment is deemed insignificant. The impact of the oil price shock on industry employment is initially positive but gradually decreases, returning the economy to its equilibrium path. In the first year, the impact on employment is significant at 0.18%, but it gradually decreases over time. The inflation rate in the industrial sector initially increased by 0.046% in the first year but decreased significantly in the second year. This downward trend continued and stabilized from the tenth year onwards. The effect of oil price shock on industrial inflation is generally positive, driven by factors such as production growth, investment, employment, and increased household demand.


After the oil price shock, the production of the service sector initially showed a 0.02% positive effect in the first year (Figures 5-8). However, it later experienced a significant decline in production, leading to negative growth. Over the long term, the output of the service sector transitioned to damping behavior. The effect of the oil price impulse on the service sector's investment is positive in the first year at 0.24%, but becomes negative in subsequent years, decreasing to -0.30%. The effect of an oil price shock on service sector employment and investment are similar. However, the influence of an oil price shock on service sector employment is lower than the impact of this shock on investment. The oil shock initially had a 0.07% effect on service sector employment, which later decreased to -0.02%. The oil price shock initially increases inflation in the service sector, but this effect diminishes over time and the economy eventually returns to its equilibrium path.


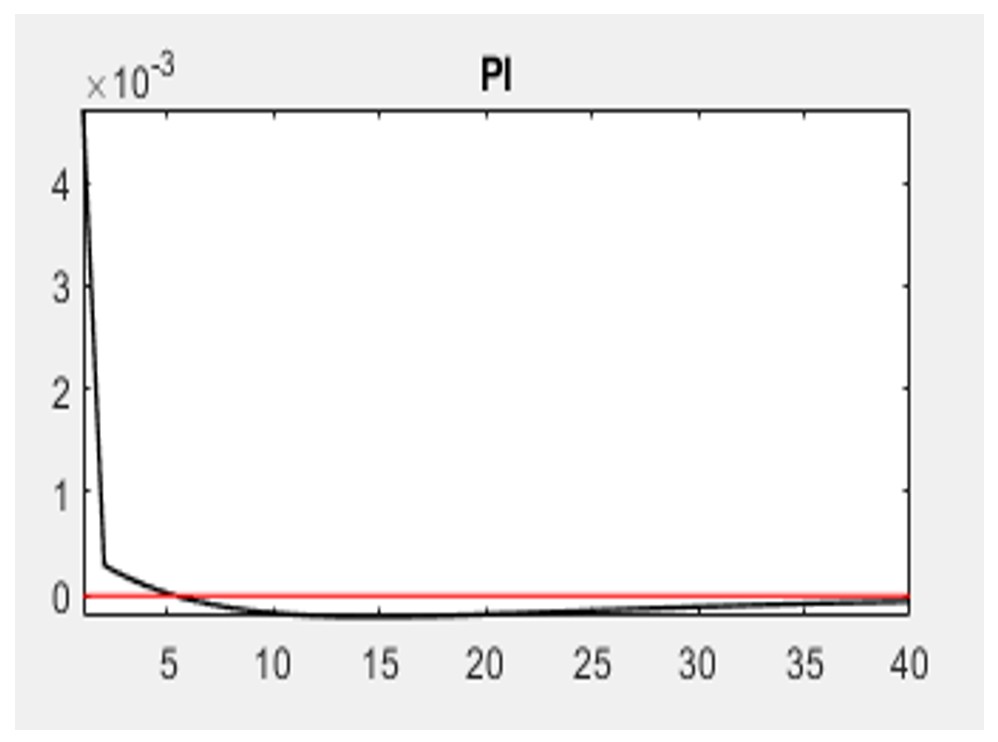
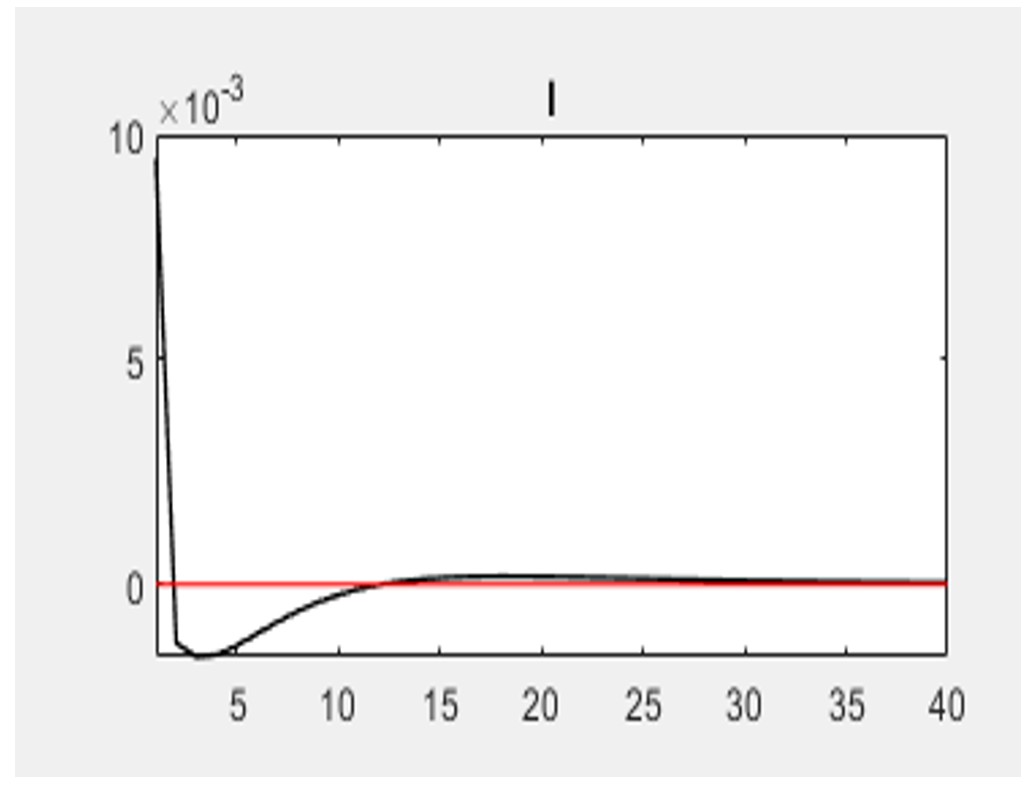
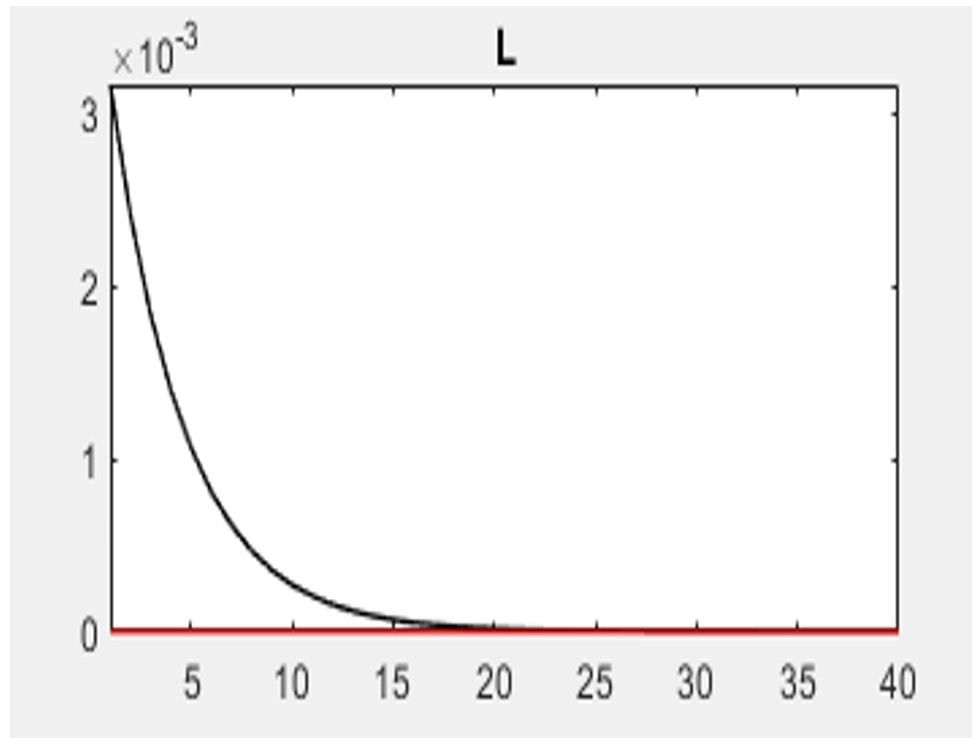
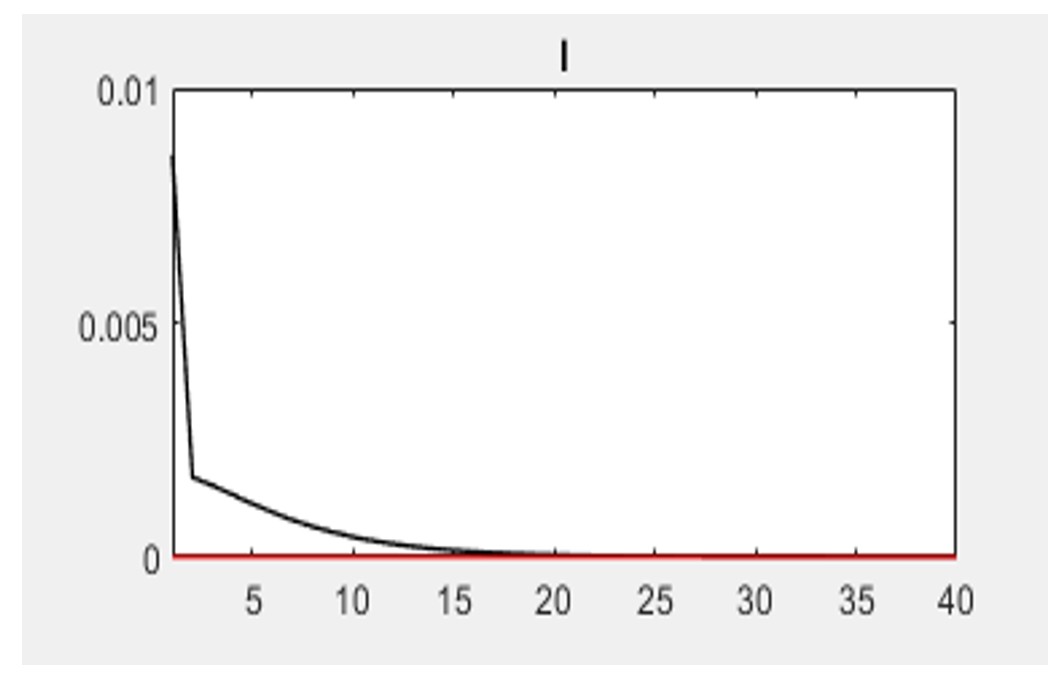
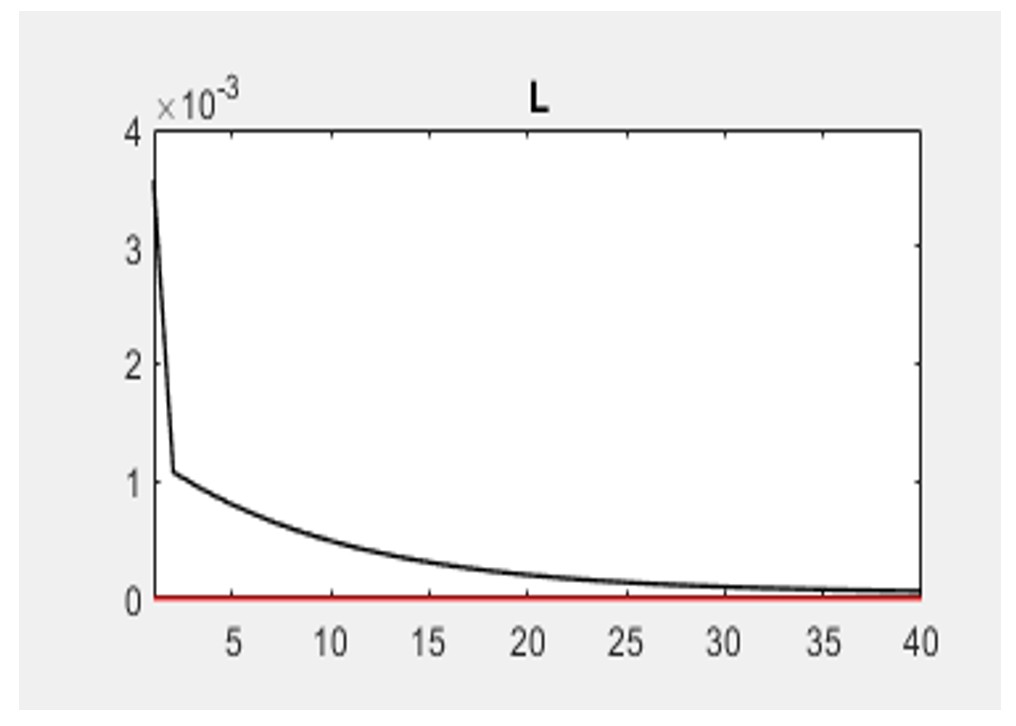
The results indicate that the oil price impact led to a 0.05% increase in agricultural sector production in the first year, followed by a sudden significant decrease of -0.05% (Figures 9-12). The average effect of oil prices on the agricultural sector's production is generally negative, due to the presence of Dutch disease in Iran's economy. The oil price shock had a positive impact on investment in the agricultural sector initially, increasing investment by 0.28% in the first year. However, this effect diminishes rapidly, with investment changes turning negative soon after and approaching a stable trend below the zero line. The agricultural sector sees an initial increase in employment due to the oil price shock, but this trend eventually declines. Throughout all years, the impact of the oil price impulse on agricultural sector employment remains positive, with the variable tending towards a long-term trend above zero. The results indicate a 0.01% increase in agricultural sector inflation in the first year due to oil price impact. Subsequently, the inflation rate shows a downward trend, becoming negative starting from the seventh period, and later experiencing an upward trend following changes in the general price index for the agricultural sector.


3.2. Effects of government expenditure shocks
The results revealed that government expenditure shock initially boosts industrial sector production by 0.08%, but then it gradually decreases until it reaches the zero line (Figures 13-16). The investment variable in the industrial sector increases due to government expenditure shock but eventually decreases and tends towards negative values. The results indicate that government expenditure shock will initially boost employment in the industrial sector, but the impact diminishes over time. Once industrial investment returns to its stable trend, employment levels adjust quickly and approach the baseline rapidly. After a government expenditure increase, industry sector inflation rose by 0.4% in the first year, then rapidly decreased, eventually having a negative effect from the fifth period onwards.


A government expenditure shock in Iran resulted in a 0.12% initial increase in production in the service sector, followed by a moderated trend approaching the long-term path with a downward trajectory (Figures 17-20). The impact of fiscal policy on service sector production is more compared to the industry sector. Similarly, the impulse of government expenditure positively influenced investment in the service sector, leading to a 0.058% increase. However, the trend of this variable declined, falling slightly below the zero line after the 10th year, ultimately returning to its long-term values. The government expenditure impulse has a smaller impact on service sector investment compared to industry sector investment. The impact of government expenditure on employment in the service sector is positive. However, this effect diminishes quickly, and employment stabilizes after the fifth period. Government expenditure has increased production, leading to higher employment and lower inflation.


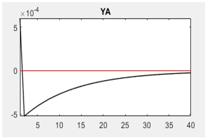
The government expenditure shock initially boosts agricultural production by 0.27%, but then causes a decline, with the biggest decrease occurring between 10 and 15 years (Figures 21-24). Eventually, the shock's impact diminishes, and in the long run, total production is expected to recover, although it may not surpass the zero level. The positive government expenditure impulse increases agricultural sector investment by 0.8%, but the effect is greatly reduced and the investment eventually returns to its stable values. The shock's effects gradually diminish from the 10th period onwards. The impact of government expenditure shock on agricultural sector employment is initially positive but diminishes after the tenth period. The impulse of government expenditure on agricultural sector employment is consistently positive and statistically significant. Moreover, while the effect of government expenditure shock on agricultural sector inflation starts off as positive, it diminishes to -0.35% in the second period. Then inflation continues to increase. From the 15th period onwards, the economy returns to the equilibrium path. An increase in government spending leads to higher total demand, causing prices to rise, assuming other conditions are constant.



3.3. Effects of technology shocks
The findings indicate that technological advancements lead to increased production in the industrial sector. Figures 25 and 26 illustrates that a technology shock resulted in a 1.3% increase in production. Subsequently, the shock gradually diminished, and production converged towards its stable value. With the technology shock, industry sector investment increases. Initially, the increase is high, but it gradually decreases and reaches a stable level. The industry sector investment is expected to increase by 0.7% in the first year with the technological impulse. The impact of technological advancements on industrial sector employment is apparent in Figures 27 and 28. However, this impact diminishes quickly, and industrial sector employment returns to its long-term trajectory around the fifth period. Due to advancements in technology, inflation in the industry sector is expected to decrease as a result of supply-side pressures increase. Starting from the first year, inflation rate changes will show an upward trend and by the seventh period, they will surpass the zero line.

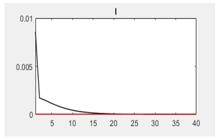


The technology shock initially increased the output of the service sector, but the effect gradually decreased and almost disappeared after the 25th period (Figures 29-32). This shock had a more lasting impact on service sector production than on the industry. The shock immediately increased investment in the service sector by 2.6%, but this effect decreased over time. The technology shock had a negative effect on the inflation rate of the service sector, causing it to initially decrease, then trend upward before the shock's effects disappeared after the 20th period. The increase in service sector production due to technological advancements justifies further reduction of inflation in this sector. The technological advancements along with an increase in production and investment, led to higher demand for labor.


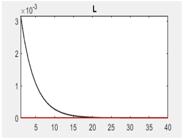
The technological impulse increases the production of the agricultural sector. The changes in the amount of agricultural production due to the improvement of technology in the first year is 2.2% (Figures 33-36). Then, the production of the agricultural sector goes through a downward trend and returns to its long-term balance in periods of more than 20 years. Due to technological advancements, there was initially an increase in employment in the agricultural sector. However, this effect was short-lived as agricultural employment quickly returned to its stable levels. The impact of technological advancements on industrial sector employment was similarly negligible. It's worth noting that the industrial sector saw a larger increase in employment compared to the agricultural sector. As technology improves and the supply curve shifts, prices are expected to decrease, resulting in a 0.037% decrease in the inflation rate in the first year. Over time, the negative effect of technological advancements on price growth diminishes and becomes negligible after the 15th period.


4. Discussion
In this research, a stochastic dynamic general equilibrium model was developed and used to assess the impact of oil prices, government expenditures, and technology shocks on Iran's economy. The impulse response functions of these factors were analyzed separately for the industry, service, and agriculture sectors. The findings indicate that the shock to the oil price does not lead to long-term real production growth in the industrial sector. Moreover, the oil price shock demonstrates an insignificant effect on long-term industrial sector investment. However, the short-term impact of the oil price impulse is evident in the employment levels of the industry sector, with these changes gradually diminishing in the long term. Overall, the oil price shock has a positive effect on industry sector inflation, stemming from production growth, increased investment and employment, and a rise in household final demand. The results also showed that the amount of production in this sector decreased drastically due to the oil price impulse. Further, the effects of the shock will slowly decrease over time and production will slowly return to its stable value. The findings suggest that the private sector will receive increased facilities as a result of the oil price shock, leading to higher production and greater investment in the service sector. Furthermore, it was noted that the impact of the oil price shock on employment in the service sector gradually normalizes, and after the 15th year, the shock's effect vanishes entirely, returning the variable to its long-term value. According to the results, the effect of the oil price impulse on the inflation rate of the service sector in the first year is 0.045%. Meanwhile, from the second year onwards, the impact of the shock is greatly reduced and the inflation variable of the service sector reaches -0.20%. After the second year, the inflation rate of the service sector will increase again, and from the fifteenth year onwards, the shock effect will disappear. Results showed that the average impact of the oil price shock on the agricultural sector's production was predominantly negative, indicating the presence of Dutch disease in Iran's economy. Although the initial effect of the oil price shock on investment in the agricultural sector is positive, it diminishes quickly, eventually resulting in negative changes. However, the oil price shock has had a consistently positive effect on employment in the agricultural sector over the years, with this variable tending towards a long-term trend of values above zero. Additionally, it is evident from the results that the inflation rate increases by 0.01% in the first year following the oil price shock application. Subsequently, the inflation rate exhibits a downward trend from the seventh period onwards, eventually resulting in negative values. According to the results of the research, the positive effect of the improvement of technology shock on production, employment, investment and the reduction of inflation of the three economic sectors and the lack of favorable effect of the impulse of government spending in this direction, it is necessary to observe monetary and financial discipline by the governments. In this regard, governments should avoid allocating a large share of oil revenues to current expenses and invest these revenues in order to improve the productivity of various sectors in order to increase production, employment, investment and increase the welfare of households. To boost production, the government should offer incentives for companies to upgrade their technology. Proper planning is crucial for spending oil revenues because the government budget relies on oil prices and revenues. Reducing the correlation between the government budget and oil revenues can minimize the effects of oil price fluctuations on the economy.
5. Conclusion
Every economy, regardless of its development status and size, is vulnerable to the negative impact of uncertainties and economic shocks, which can lead to significant harm. Economic shocks introduce increased risk and decision-making complexities due to the disruption and volatility they create in economic variables. The interplay of economic variables facilitates the transmission and amplification of shock effects across the entire economy, leading to economic instability. This instability results in various costs including suboptimal resource allocation, reduced production, investment, and employment, as well as price fluctuations. Understanding the propagation of shocks and analyzing their impact on economic variables enables policymakers and economic stakeholders to make informed decisions to mitigate adverse effects. This knowledge also empowers investors and economic producers to make proactive and informed decisions, anticipating potential consequences.
-
Data Availability Statement
The research data analyzed in this study are not publicly available by any means.
References
- ABDLAZIZ, R.A., AHMAD, M.N.N. and SLESMAN, L., 2018. Dutch disease effect of oil price on agriculture sector: evidence from panel cointegration of oil exporting countries. International Journal of Energy Economics and Policy, vol. 8, no. 5, pp. 241-250.
-
ABDULLAHI, H.S., MAHIEDDINE, F. and SHERIFF, R.E., 2015. Technology impact on agricultural productivity: a review of precision agriculture using unmanned aerial vehicles. In:Wireless and Satellite Systems: 7th International Conference, WiSATS 2015, Bradford, UK, 6-7 July 2015. Cham: Springer International Publishing, pp. 388-400. https://doi.org/10.1007/978-3-319-25479-1_29
» https://doi.org/10.1007/978-3-319-25479-1_29 -
AGBOOLA, E., CHOWDHURY, R. and YANG, B., 2024. Oil price fluctuations and their impact on oil-exporting emerging economies. Economic Modelling, vol. 132, pp. 106665. https://doi.org/10.1016/j.econmod.2024.106665
» https://doi.org/10.1016/j.econmod.2024.106665 -
AHMAD, F. and SULTAN, M., eds. 2021.Technology in agriculture London: IntechOpen. https://doi.org/10.5772/intechopen.92469
» https://doi.org/10.5772/intechopen.92469 - AHMADI, M. and MANERA, M., 2021. Oil price shocks and economic growth in oil-exporting countries. Washington, DC: International Monetary Fund. IMF Working Paper, no. WP/17/287.
-
AHUJA, D. and PANDIT, D., 2020. Public expenditure and economic growth: evidence from the developing countries. FIIB Business Review, vol. 9, no. 3, pp. 228-236. https://doi.org/10.1177/2319714520938901
» https://doi.org/10.1177/2319714520938901 - ALWERFALLI, F., 2022.An empirical study of current account balances in oil-exporting countries.Besançon: Université Bourgogne Franche-Comté. Doctoral dissertation.
-
AMIN, S., MARSILIANI, L., RENSTRÖM, T. and TAGHIZADEH-HESARY, F., 2022. The vulnerability to oil price shocks of the Bangladesh economy. In: F. TAGHIZADEH-HESARY and D. ZHANG, eds. The handbook of energy policy Singapore: Springer Nature Singapore, pp. 1-30. https://doi.org/10.1007/978-981-16-9680-0_36-1
» https://doi.org/10.1007/978-981-16-9680-0_36-1 -
CHARLES, A., CHUA, C.L., DARNÉ, O. and SUARDI, S., 2021. Oil price shocks, real economic activity and uncertainty. Bulletin of Economic Research, vol. 73, no. 3, pp. 364-392. https://doi.org/10.1111/boer.12252
» https://doi.org/10.1111/boer.12252 - COLOMBO, V., 2019. Opening the Red Budget Box: nonlinear effects of a tax shock in the UK. Bologna: University of Bologna, Department of Economics. Working Paper DSE, no. 1142.
-
DAHL, R.E., OGLEND, A. and YAHYA, M., 2020. Dynamics of volatility spillover in commodity markets: linking crude oil to agriculture. Journal of Commodity Markets, vol. 20, pp. 100111. https://doi.org/10.1016/j.jcomm.2019.100111
» https://doi.org/10.1016/j.jcomm.2019.100111 -
DEMARTINO, G., GRABEL, I. and SCOONES, I., 2024. Economics for an uncertain world. World Development, vol. 173, pp. 106426. https://doi.org/10.1016/j.worlddev.2023.106426
» https://doi.org/10.1016/j.worlddev.2023.106426 -
EBONG, F., OGWUMIKE, F., UDONGWO, U. and AYODELE, O., 2016. Impact of government expenditure on economic growth in Nigeria: a disaggregated analysis. Asian Journal of Economics and Empirical Research, vol. 3, no. 1, pp. 113-121. https://doi.org/10.20448/journal.501/2016.3.1/501.1.113.121
» https://doi.org/10.20448/journal.501/2016.3.1/501.1.113.121 -
ELLEBY, C., DOMÍNGUEZ, I.P., ADENAUER, M. and GENOVESE, G., 2020. Impacts of the COVID-19 pandemic on the global agricultural markets. Environmental and Resource Economics, vol. 76, no. 4, pp. 1067-1079. https://doi.org/10.1007/s10640-020-00473-6 PMid:32836856.
» https://doi.org/10.1007/s10640-020-00473-6 - HANSON, K., 1991.Sectoral effects of a world oil price shock: economywide linkages to the Agricultural Sector Washington, DC: US Department of Agriculture, Economic Research Service, Agriculture and Rural Economy Division.
-
HANSON, K., ROBINSON, S. and SCHLUTER, G., 1993. Sectoral effects of a world oil price shock: economywide linkages to the agricultural sector. Journal of Agricultural and Resource Economics, vol. 18, no. 1, pp. 96-116. https://doi.org/10.22004/ag.econ.30818
» https://doi.org/10.22004/ag.econ.30818 - HERRERA, S., 2007. Public expenditure and growth. Washington, DC: World Bank. World Bank Policy Research Working Paper, no. 4372.
-
MANSFELD, Y. and WINCKLER, O., 2007. The tourism industry as an alternative for the GCC oil-based rentier economies. Tourism Economics, vol. 13, no. 3, pp. 333-360. https://doi.org/10.5367/000000007781497728
» https://doi.org/10.5367/000000007781497728 - MEENAGH, D., MINFORD, P. and OYEKOLA, O., 2015.Oil prices and the dynamics of output and real exchange rate. Wales: Cardiff University. Cardiff Economics Working Papers, no. E2015/18.
- MOZUMDAR, L., 2012. Agricultural productivity and food security in the developing world. Bangladesh Journal of Agricultural Economics, vol. 35, pp. 53-69.
-
NWUDE, C., NWAEZE, C. and NWUDE, C.A., 2023. Government expenditure and economic growth: evidence from the critical sectors in an emerging economy.Qeios ID In press. https://doi.org/10.32388/CBTRTL
» https://doi.org/10.32388/CBTRTL -
NYASHA, S. and ODHIAMBO, N.M., 2019. The impact of public expenditure on economic growth: a review of international literature. Folia Oeconomica Stetinensia, vol. 19, no. 2, pp. 81-101. https://doi.org/10.2478/foli-2019-0015
» https://doi.org/10.2478/foli-2019-0015 -
OLADUNNI, S., 2020. Oil price shocks and macroeconomic dynamics in an oil-exporting emerging economy: A New Keynesian DSGE approach. CBN Journal of Applied Statistics, vol. 11, no. 1, pp. 1-34. https://doi.org/10.33429/Cjas.11120.1/5
» https://doi.org/10.33429/Cjas.11120.1/5 -
PANT, R., BARKER, K. and ZOBEL, C.W., 2014. Static and dynamic metrics of economic resilience for interdependent infrastructure and industry sectors. Reliability Engineering and System Safety, vol. 125, pp. 92-102. https://doi.org/10.1016/j.ress.2013.09.007
» https://doi.org/10.1016/j.ress.2013.09.007 -
PASSARELLI, M., BONGIORNO, G., CUCINO, V. and CARIOLA, A., 2023. Adopting new technologies during the crisis: an empirical analysis of agricultural sector. Technological Forecasting and Social Change, vol. 186, pp. 122106. https://doi.org/10.1016/j.techfore.2022.122106
» https://doi.org/10.1016/j.techfore.2022.122106 - PATEL, C. and SANDNES, N.M., 2020.What are the impacts of government spending on the Norwegian economy? Oslo: Handelshøyskolen BI. Master's thesis.
- PERMEH, Z., GHORBANI, M., TAVAKOLIAN, H. and SHAHNOSHI, N., 2017. Effects of oil price shocks on agricultural sector using dynamic stochastic general equilibrium model. Journal of Agricultural Science and Technology, vol. 19, no. 6, pp. 1211-1226.
-
RAOUF, E., 2021. Oil prices shocks and government expenditure. International Journal of Energy Economics and Policy, vol. 11, no. 5, pp. 78-84. https://doi.org/10.32479/ijeep.11172
» https://doi.org/10.32479/ijeep.11172 -
SAYADI, M., and BAHRAMI, J., 2015. Assessing the effects of oil revenue investment policies on macroeconomics variables in Iran: the stochastic dynamic general equilibrium approach. Iranian Journal of Energy Economics, vol. 4, no. 16, pp. 85-135. https://doi.org/10.22054/JIEE.2015.1895
» https://doi.org/10.22054/JIEE.2015.1895 - SAYADI, M., SHAKERI, A., MOHAMMADI, T. and BAHRAMI, J., 2016. Stochastic shocks and oil revenue management in Iran: a Dynamic Stochastic General Equilibrium approach. Economic Research Journal, vol. 16, no. 61, pp. 33-80.
-
SUN, H., LU, S. and SOLAYMANI, S., 2021. Impacts of oil price uncertainty on energy efficiency, economy, and environment of Malaysia: stochastic approach and CGE model. Energy Efficiency, vol. 14, no. 2, pp. 21. https://doi.org/10.1007/s12053-020-09924-x
» https://doi.org/10.1007/s12053-020-09924-x - TORRES, J.L., 2020.Introduction to dynamic macroeconomic general equilibrium models Malaga: Vernon Press.
- USMAN, A., MOBOLAJI, H.I., KILISHI, A.A., YARU, M.A. and YAKUBU, T.A., 2011. Public expenditure and economic growth in Nigeria. Asian Economic and Financial Review, vol. 1, no. 3, pp. 104.
-
WANG, J., SHAO, W. and KIM, J., 2020. Analysis of the impact of COVID-19 on the correlations between crude oil and agricultural futures. Chaos, Solitons, and Fractals, vol. 136, pp. 109896. https://doi.org/10.1016/j.chaos.2020.109896 PMid:32421108.
» https://doi.org/10.1016/j.chaos.2020.109896 -
ZHANG, B., AI, X., FANG, X. and CHEN, S., 2022. The transmission mechanisms and impacts of oil price fluctuations: evidence from DSGE model. Energies, vol. 15, no. 16, pp. 6038. https://doi.org/10.3390/en15166038
» https://doi.org/10.3390/en15166038
Edited by
-
Editor:
Takako Matsumura Tundisi
The research data analyzed in this study are not publicly available by any means.