
 Optimizing the Efficiency of The Soybean Exportation: Impact of Economies of Scale in Location and Network Design
RESUMO
Este estudo é motivado pelos desafios logísticos enfrentados pela cadeia de exportação da soja do Brasil (BSEC) e propõe um modelo de programação linear inteira mista (MILP) para otimizar a cadeia de suprimentos (SCND). O modelo determina a localização ótima de armazéns e terminais de transbordo (hubs), a fim de apoiar o planejamento estratégico e projetar um BSEC competitivo. O modelo considera as diferentes funções e tamanhos de instalações de armazenagem, rotas e volume transportado, avaliando uma rede logística dinâmica. Três cenários foram testados (real, base e aperfeiçoado) para analisar o impacto econômico e as mudanças no projeto da rede. O cenário aperfeiçoado apresentou os melhores resultados em termos de custos e foi influenciado pela melhor eficiência operacional dos portos da região Norte, uma vez que o Porto de Santos apresentou uma capacidade operacional limitada. Esta pesquisa pode subsidiar a tomada de decisões estratégicas quanto à escolha de rotas de transporte, melhorando o processo de exportação, além de direcionar o investimento público em infraestrutura logística.
Palavras-chave:
desenho da cadeia de suprimentos; localização-alocação; armazenagem; infraestrutura de transporte; logística do agronegócio
ABSTRACT
This study is motivated by the logistics challenges faced by the Brazilian soybean exportation chain (BSEC). This study proposes a mixed integer linear programming (MILP) model to optimize supply chain network design (SCND). The model determines the optimal location of hubs that encompass the requirements of strategic and tactical planning to design a competitive BSEC. The model considers different functions and sizes of storage facilities, routes, and transported volume, evaluating a dynamic logistics network. Three scenarios were tested (real, based, and improved) to analyze the economic impact and changes in the network design. The Improved Case presents the best cost results that are influenced by the operational efficiency of the Northern region ports, once the port of Santos has operational capacity limited. The findings can support strategic decision-making regarding the choice of routes, improving the exportation process, as well as directing public investment in logistics infrastructure.
Keywords:
supply chain network design; location-allocation; intermediate facilities; transport infrastructure; agribusiness logistics
1. INTRODUCTION
In the last decade, Brazil has set records in several agricultural chains, both in production and exports, with soybean complex (grain, meal, and oil), coffee, cane sugar, orange juice standing out. Brazil is the world's largest producer and exporter of soybeans and in 2023 the soybean complex was responsible for 40.4% of Brazil's agricultural exports (Brasil, 2024a).
However, the Brazilian soybean exportation chain (BSEC) is exposed to several logistical problems due to long distances between producing areas and seaports, in which the production flow is carried out mainly by highways, unimodal, as a consequence of a lack of planning and investment in infrastructure. As a result, producers are burdened by additional logistics costs, which affect the competitiveness of the Brazilian soybean chain (Oliveira & Alvim, 2017). The cost of exporting soybeans from Brazil can be 40% higher than from the USA, Brazil's main competitor in soybean exportation (Salin, 2020).
In the operation of the BSEC, soybeans are loaded onto several trucks in producing areas, routed to an intermediate facility, and then destined for final consumers located in Central and North America, Europe, and Asia. A route can include one or several types of intermediate facilities, such as warehouses/consolidation hubs, transshipment hubs (especially seaports, which are mandatory), and several modes of transport (road, river, rail, and maritime) even though the road mode is currently predominant and intermodality is little explored.
The BSEC requires the most significant logistics infrastructure in the world (IMEA, 2019) and the main reasons stand out:
(i) Large-scale production and exports: Brazil has become the world’s largest grain producer and exporter since the 2013 harvest (Salin, 2020).
(ii) Seasonal production and demand: the peak of Brazilian soybean exports occurs from April to July, almost two-thirds of the year’s soybeans are exported in this post-harvest period (Salin, 2020). In these periods, there are pronounced logistical shortcomings.
(iii) Long distances between the main producing areas and the main exporting seaports: soybean production is concentrated in the Midwest of Brazil, mainly in Mato Grosso, which is very far from the seaports, with distances ranging from 1,000km to 2,500km. The predominance of road transportation, poor condition, the inefficient railway system, and the disorganization and excessive bureaucracy of seaports have been indicated as the main sources of the reduced profitability of agricultural production (Oliveira et al., 2021). Brazil is advancing slowly to solve its logistical problems, an essential condition for maintaining the competitiveness of the Brazilian soybean (Fliehr et al., 2019; Salin, 2020). The most recent improvement was the paving of the BR 163 highway. Soybeans exported via the BR 163 highway to the Northern Arc seaports reduce the time to complete the trip, along with the costs of fuel and truck maintenance (Salin, 2020).
(iv) Lack of storage capacity on or next to farms and operational capacity in transshipment hubs, especially in seaports: the lack of storage facilities, including on-farm storage, forces immediate trade after harvesting, leading to the loss of the opportunity to negotiate under more advantageous conditions. The lack of operational capacity in transshipment hubs causes road and train congestion, delays, and demurrage costs for trucks, trains, and ships at seaports (Filippi et al., 2020; Fliehr et al., 2019). The Miritituba (PA) transshipment hub is an improvement to overcome limited inland waterway infrastructure capacity (Salin, 2020).
Salin (2014, 2018, 2020) shows that Brazil has not overcome the problem of incompatibility in the production-export matrix. The author points out that the country maintains its competitive advantage due to the large volume produced, their high quality soybeans, and their low production costs. However, the country is moving slowly to solve its logistical problems, an essential condition for maintaining the competitiveness of Brazilian soybeans.
After two decades, the 80s and 90s, of absolute absence in the transport sector and the lack of a strategic planning system, the rescue of logistics projects with a medium and long-term vision took place between 2007-2011, through the Growth Acceleration Plan (PAC) (Oliveira, 2014). However, this initiative was not enough to ensure that investments in railroads and waterways continued in order to address the imbalance in the transportation matrix and promote intermodality.
In recent years, most of the studies that addressed Supply Chain Network Design (SCND) problems have emphasized location-allocation problems with multiple periods and capacity expansion (Eskandarpour et al., 2015; Farahani et al., 2014; Melo et al., 2009) which fall under a sequential approach, where a solution obtained from one level is imposed to the next one in a hierarchy of decisions. This means that each type of hub (warehouses/consolidation hubs, transshipment hubs, different levels) is optimized independently, not integrated and optimized together, which is a limitation. In common they do not realistically describe the network using static models (Darvish & Coelho, 2018).
The novelty of this study is to propose a dynamic model in the BSEC problem that considers realistic features and a multi-period network in a non-sequential approach. This paper proposes a study to design a competitive BSEC using a mixed-integer linear programming (MILP) model to optimize a SCND. The model determines the optimal location of hubs that encompasses the requirements of strategic and tactical planning. In addition, the MILP determines the optimal location of facilities with different functions and sizes, routes, and volumes transported by route, in a dynamic network considering the effects of economies of scale.
2. THEORETICAL FRAMEWORK
In the last decade, the research on facility location models in the context of SCND has been to reduce the gap between SCND models and the real requirements of SC (Campbell & O’Kelly, 2012; Guastaroba et al., 2016; Melo et al., 2009). In this regard, four features have received more attention: multi-layer facilities, which imply the existence of different types of facilities (each one playing a specific role), multiple commodities, single/multiple periods, and deterministic/stochastic parameters.
We presented hub location problems that blend network design and location decisions. The problem involves the location of hub facilities through which flows are routed from origins to destinations. Hubs are intermediate facilities whose functions are switching, sorting, or connecting flows from different origin/destination points and consolidating/break-bulking flows that need to be aggregated/disaggregated to take advantage of economies of scale (Alumur & Kara, 2008; Campbell & O’Kelly, 2012; Guastaroba et al., 2016). In the network design context, the term routing indicates the paths that are used to send flows between pairs of nodes (Contreras & Fernández, 2012). In hub location problems, the objective function depends on the location of hubs in addition to flow routing, which is influenced by economies of scale in transport between hubs. Guastaroba et al. (2016) presented a review of a class of problems closely related to hub location problems. The reviewed papers are considered hub locations due to the blend decisions of location and network design, the role of the intermediate facilities, and the objective function that depends on the location of hubs.
We highlight papers in which at least two of the following criteria are met: (i) the papers must include decision variables modeling the location-allocation facilities in two-echelon or more; (ii) they must include two or more tactical features; (iii) economies of scale or consolidation are considered.
Table 1 summarizes relevant and recent studies. Five main decisions of the models were observed. The first is Location, which is considered a single layer if the facilities are playing the same role, or multiple layers if facilities are playing specific roles.
Network Design is concerned with identifying if the flows can be routed from the origin to a single facility (single allocation) or can be routed to multiple facilities (multiple allocations). Intra-flow shows whether routing is allowed between facilities that play the same role. Capacity expansion identifies capacitated problems and if it is possible to expand capacity in all layers or specific layers. Managing Inventory decisions look for models concerned with determining the number of stocking points (warehouses). None of the reviewed papers considered the level of inventory at each stocking point. Period decision identifies if the problem was modeled as a single period or multiple periods. The last model decision identifies how the problems were formulated and the construction of the objective function. The objective function of all studies is cost minimization. However, in Zhang et al. (2017) and Ge et al. (2018), the facility location and route of flows are influenced by economies of scale. Correia et al. (2013) determined a minimum amount of flow for the delivery of products from a facility installed in an echelon. According to the authors, this restriction has the effect of achieving an economy of scale. However, this economy is not considered in the objective function. We also identify the solution method utilized and the case studied.
Ge et al. (2018) proposed a SCND applied to fresh food regional distribution in the US. A facility location problem is formulated as mixed-integer linear programming and the problem explores economies of scale to determine the optimal number of facility locations, their size, and the design of the distribution network. The problem is modeled with piecewise linear concave costs.
Mogale et al. (2018) proposed a multi-objective and multi-period mathematical model for a grain silo location-allocation problem with dwell time in India. The problem consists of the acquisition of grains in procurement centers that are stored in silos established in procuring (regional silos). From regional silos, the grains are transported to silos established in consuming states to be then transported to demand points.
Naderi et al. (2019) proposed a SCND applied to the wheat distribution network in Iran. The problem consists in moving wheat from production regions to consumption areas, where there should be location distribution centers, designing a distribution network, and defining the number of transporters needed to carry the wheat. The authors proposed a logic-based Benders decomposition algorithm (LBBDA) as a solution methodology.
3. METHODOLOGY
This paper proposes a model to design the BSEC to improve infrastructure conditions, considering the characteristics of the chain as pointed out in section 1. Agricultural commodity chains have a cycle of production, harvest - storage - exportation, or industrial processing, that takes around 12 months (an annual crop cycle). The soybeans harvest in Brazil occurs from January to April, followed by the peak of exports from April to June. From July to December, soybeans are planted and then a new cycle begins. Therefore, Brazilian soybean is negotiated at futures exchanges, which establishes the delivery of a certain amount of flow in a period at an agreed price. Consequently, soybeans exported in the current crop cycle were negotiated in the previous crop cycle. Trading in the futures market avoids price and demand fluctuations, allowing the infrastructure improvement to be measured by cost-benefit analysis.
The period considered was 12 months, the annual crop cycle. Production data were from the Brazilian Institute of Geography and Statistics (IBGE, 2021a). Exportation data were from Brazilian Foreign Trade Statistics (Brasil, 2022) and international demand from the Department of Agriculture of the United States (Salin, 2020; USDA, 2020). The freight from road, rail, waterway, and maritime modes was based on the Freight Information System SIFRECA (2021) and Salin (2020). The capacities available to be opened in producing areas are based on the current capacities from the National Supply Company (Conab, 2021). One million tons are available to transshipment hubs. The installation cost is related to the capacity level opened, US$100.00/ton opened (Vieira & Dalchiavon, 2018).
The levels of capacity were determined based on the current storage capacity and the current need for storage in the State. The current need for storage was calculated based on the United Nations Food and Agriculture Organization methodology, which considers an ideal static capacity greater than 20% of the total produced (IMEA, 2019). For producing areas/transshipment hubs to reach the ideal storage/operational capacity level, we allow the blending of the levels of capacity. As mentioned in Section 1, capacity expansion is a real need for the network to avoid disruptions and high logistics costs.
The holding cost is the same for all producing areas inside the state, US$6.00/ton (IMEA, 2019). A large variation in the holding cost per area has a great influence on the network design. However, there is no room for great variation in holding costs and the same costs highlight the main routes and locations.
We tested three scenarios and in all of them, we consider that economies of scale and seaport capacity have a huge influence on network design. Thus, we analyze the physical space limitations to expand the port of Santos capacity and the recent access improvement capacity expansion carried out in the Northern Arc ports and the Itaqui port.
I-) Real Case - the first scenario is analyzed through the BSEC-SLACK model. The goal is to represent the soybean export chain of MT in 2019, under the following conditions: there is no consolidation inside the state, no infrastructure investments, and poor efficiency at transshipment hubs (α=1.0); also, the capacity of nodes is limited (available for operation only in the first level of capacity), representing capacity restrictions. In particular, this scenario highlights the capacity restrictions of seaports. Currently, in seaport operations, these capacity restrictions are revealed by long truck lines to load and unload at seaports and shipping delays, which result in additional costs, as described in Section 1. In this scenario, seaport capacity restriction is represented by an additional flow beyond the capacity, received and handled at seaports. The additional cost by a unit of flow that exceeds the capacity is considered as the greater land transportation cost between the producing areas of the network. This scenario is the reference for analyzing the contributions of the model presented in the following cases.
II-) Base Case - in the second scenario, the discount factor of economies of scale is not applied (𝛼=1.0), and the port of Santos (SP) has only the first level of the capacity set available, representing the low feasibility of expanding it. This case analyzes which seaports, except the port of Santos, should expand their operational capacity to improve soybeans exportation. We use the BSEC model to analyze the Base Case and the Improved Case scenario.
III-) Improved Case - improvements in the transport between hubs are assumed - infrastructure investments, resulting in economies of scale, and the port of Santos (SP) has only the first level of the capacity set available. In this context, a discount factor of 20% is applied (𝛼=0.8).
We analyze the state of Mato Grosso (MT), the largest Brazilian producer and exporter of soybeans. MT is located in the Midwest region of Brazil, very far from the seaports, and demands higher logistic infrastructure to export its production. The state of MT is divided into 22 producing areas, i.e., AR 01, AR 02…, and AR 22 (Figure 1). In this way, it was possible to consolidate data from the quantity of soybean production and storage capacity of each producing area (Conab, 2021; IBGE, 2021a, 2021b). Our analyses cover the year 2019, divided into periods of 12 months, and the initial stock of the first period is discounted from initial hub’s capacity
We considered the seven seaports that export the most soybeans from MT (Brasil, 2022). In the North region, the ports of Manaus (AM) (14.6%) and Santarém (PA) (8.16%) (the Northern Arc ports); in the Northeast region, the port of Itaqui (MA) (11.31%); in the Southeast, the ports of Vitória (ES) (5.24%) and Santos (SP) (53.92%); and in the South, the ports of Paranaguá (PR) (5.86%) and São Francisco do Sul (SC) (0.91%) (Figure 1). We considered nine transshipment hubs, three of them are river terminals and six are railroad terminals (Figure 1).
The largest consumer of soybeans from MT is China (Brasil, 2022) and the exportation takes place through the Northern Arc ports and the port of Santos (SP), because of their equipment and access infrastructure. In 2019, the Northern Arc ports became one of the leading export routes because of the transshipment hub’s construction in Miritituba (PA) (Salin, 2020). The Brazilian soybeans final consumers, organized by economic blocs and ordered by demand size, are the Asiatic Bloc (79.1%), the European Union (18.1%), and Central and North America (2.9%) (Brasil, 2022).
There are several routes to transport soybeans from MT to seaports, using roads, rails, and rivers. From any producing area, it is possible to access other producing areas by road. Inside MT, most of the roads are one-lane, be they paved or unpaved. Also, intermodal transport is not fully developed, most of the intermodal infrastructure is used by only four of the largest trading companies operating in Brazil, and most of the production is transported directly by trucks.
These four trading companies dominate agricultural commodity exports in Brazil: Archer Daniels Midland (ADM), Bunge, Cargill and Louis Dreyfus Company are known as the ABCD group. They control the world soybean market and, in Brazil, are responsible for 84% of soybean exports (Medina, 2021).
Furthermore, more than half of the roads are in poor condition, including paved ones, influencing transportation costs and causing longer travel time which, consequently, increases losses and damage to cargo (Fliehr et al., 2019; Salin, 2020). There are six transshipment hubs in operation (Figure 1). To access the North seaports, the transshipment hubs are the Miritituba (PA) and Porto Velho (RO) river terminals. To access the Northeast seaports, the transshipment hub is the Porto Nacional (TO) railroad terminal. To access the Southeast, the transshipment hubs are the Araguari (MG) railroad terminal and São Simão (GO)/Anhembi (SP) river terminal. To access the South, the transshipment hub is the Londrina (PR) railroad terminal. Inside the state of MT, there is an additional transshipment hub called Alto Araguaia road-rail terminal, located in the southeast of the state (Figure 1).

In this paper, a transshipment hub is an intermediate facility where it is possible to achieve economies of scale by transporting flows between transshipment hubs using different modes of transport. The transshipment hubs are located outside of MT, except for Alto Araguaia, located in AR 03 (Figure 1).
It is also possible to achieve an economy of scale by transporting flows between different intermediate facilities located in a producing area, inside MT (Figure 2), or from an intermediate facility in a producing area to a transshipment hub (Figure 2). In this case, it is considered improvements in the existing network, for example, transforming unpaved roads into paved roads. Intermediate facilities located in producing areas are called distribution hubs. Distribution hubs can also act as warehouses, i.e., they also work as a collective (or regional) storage facility utilized by many producing areas, as defined by the model.

An intermediate facility can be established in all nodes of the network, except in final consumers (Figure 2). Then, a node is a candidate to be a distribution hub/warehouse or transshipment hub, depending on its function and location. Afterwards, the soybean goes to the export ports where it is loaded on ships and then transported to the international consumer market.
As described in Section 1, the current storage and operational capacity are not able to support an efficient chain. Thus, based on the current capacity (Conab, 2021), each node is associated with a capacity set, and each element of the capacity set is associated with an establishment cost. The capacity set represents the levels of capacity available to be opened in each node (capacity expansion). The capacity includes operational and/or storage capacity and it is an upper limit to its incoming and distribution flow.
Our model aims (1) to establish the optimal hub locations within MT, (2) to determine the required capacity for each hub to support the network design, (3) to assess the feasibility of routes, (4) to identify the needed improvements between transshipment hubs, and (5) to determine the amount of flow transported along each route. A node can be assigned to multiple hubs, i.e., multiple allocations
The term economies of scale describe the advantages of consolidating flows or investing in infrastructure between hubs. We consider a factor of the discount applied to transportation costs between hubs represents the economy of scale. The factor of discount is independent of the transported flows. Thus, we propose a simplified model where the discount is proportional to the transportation cost (or distance) between hubs. In a more realistic approach, transportation costs would depend on the flow of the arcs, but this would result in a more complex model. Moreover, the model designs the network from producing areas to final consumers to explore the complete route
The soybean exporter chain is characterized by a graph G = (N, A) where node set N = {1, …, n} and A = N × N is the set of arcs. The set of periods is T = {1, …, p} and the set of capacity available for expansion is represented by S = {1, …, w}.
Let be the cost of transportation of a unit of flow between nodes i and j in period p:
-
is the cost to open a hub at node k with capacity w;
-
is the cost of storage of a unit of flow at node k in period p;
-
is the total amount of available flow at node i in period p;
-
is the amount of flow demanded by node j in period p;
-
is the size of a hub at node k with capacity level w.
-
is considered a large number that does not restrict flow;
-
is the discount factor for transport flow between hubs ().
To model the BSEC, the following decision variables are considered:
-
, amount of collection flow from node i to hub k in period p;
-
, amount of flow traversing arcs at hub (m, k) and (k, l) in period p;
-
, amount of distribution flow from hub l to node j in period p;
-
, amount of flow storage at hub k in period p.
-
is equal to 1 if a hub is opening at node k with capacity level w, and is equal to 0 otherwise.
Figure 3 represents the hub establishment at nodes 1, 4, 5, 6, and 8 ( 𝐻 1𝑤 , 𝐻 4𝑤 , 𝐻 5?? , 𝐻 6𝑤 , and 𝐻 8𝑤 ), the level of capacity of each hub (w) was not defined. The hubs located at nodes 1 and 4 are called distribution hubs/warehouses and they are called transshipment hubs at nodes 5, 6, and 8. The flow is collected from nodes in producing areas for any hub, as represented by 𝑋 34 𝑝 and 𝑋 38 𝑝 (Figure 3 (a)). The transport of flow between hubs can be done between hubs of the same or different functions, as represented by 𝑌 15 𝑝4 and 𝑌 58 𝑝6 (Figure 3 (b)). 𝑌 46 𝑝4 represents that it is not necessary to transport flow through three hubs. The flow is sent to final consumers through a hub (in this case, a seaport), as represented by 𝑍 8 10 𝑝 , 𝑍 8 11 𝑝 , and 𝑍 8 12 𝑝 (Figure 3(c)). Economies of scale cannot be achieved by transporting flow from producing areas to hubs and from seaports to final consumers.
In BSEC formulation, the objective function (1) evaluates the overall cost, which considers the costs of collection, transfer between hubs, distribution, holding, and hub establishment.
Subject to the following constraints: Constraint (2) establishes that all the available flow is collected by the hubs in each period p;
Constraint (3) guarantees that all the demand in period p is attended by a hub;
Constraint (4) guarantees the hub node balance; this constraint is the storage dynamic equation - the storage level at the end of the previous period (p -1) plus all the incoming flow minus the flow that leaves the hub;
To ensure that the input flow plus all incoming flows is less than or equal to the capacity of the hub, Constraint (5) is used.
Constraints (6)-(9) guarantee that all the flows are transported via hubs; and,
Constraints (10) and (11) define the continuous and binary decision variables, respectively.
Constraint (4) allows hubs to act as a warehouse in a manner that they connect decisions through time. For example, the flow from some areas in a period 𝑝 1 could be stored until a period 𝑝 2 , 𝑝 1 ≠ 𝑝 2 , and then demand in this period is partially fulfilled. Constraints (7), (8), and (9) guarantee that the nodes represented by m, l, and k in 𝑌 𝑙𝑘 𝑝𝑚 are hubs. For example, suppose the model without constraint (8), with no restrictions on l, the flow could be transported through 𝑌 36 𝑝4 (Figure 3 (b)), in which node 3 is not a hub. Consequently, it will be considered an efficient transport in routes 4-3 and 3-6, which is not viable.
Moreover, to highlight the problems of capacity restriction presented previously in Section 1, we considered a variation of the BSEC model, the BSEC-SLACK model, in which a slack variable was added in a subset of node set (N) in the constraint (5). We selected a 𝑁 1 ⊂𝑁, 𝑁 1 representing the seaports nodes, i.e., the addition of the slack variable means that the capacity of the seaports can be exceeded. A cost over the additional flow in each seaport is also determined as the additional cost.
Therefore, let 𝑉 𝑘 𝑝 be the amount of flow that exceeds the capacity of k in the period p, 𝛽 𝑘 𝑝 is the additional cost of a unit of flow that exceeds the capacity at node k in period p and 𝑁 2 =𝑁− 𝑁 1 .

In BSEC-SLACK formulation, the objective function (12) evaluates the overall cost mentioned in (1) plus the additional cost of flows that exceed the capacity at nodes.
Subject to the following constraints. (2)-(4), (6)-(9), and (11) explained above; Constraint (13) is equal to constraint (5), but it is valid to 𝑁 2 ⊂𝑁;
Constraint (14) is similar to constraints (5) and (13), but it is valid to 𝑁 1 ⊂𝑁 and it is possible to exceed the capacity at nodes, considering the subtraction of the additional flow variable; and,
Constraint (15) defines the continuous decision variables.
4. RESULTS AND DISCUSSION
The Improved Case presents the best cost results (Table 2), and we will show all proposed network improvements. The results of the Improved Case are compared to the Real Case. Base Case analysis shows limited improvements when investments are only in seaport capacities.
The general results are presented in Table 2. The first column represents the number of hubs installed that encompass distribution hubs/warehouses and transshipment hubs (H). The second column shows the total costs (TC), and the subsequent columns present the collecting costs (CC), distribution costs (DC), transfer costs (TRC), hub establishment costs (EC), and additional costs (AC) for the BSEC-SLACK model. The holding costs (HC) of all scenarios are the same, since the same holding cost is considered for all areas, and thus are not presented. The two last columns display the CPU time in seconds and the GAP (value provided by CPLEX 12.6).
Some results are presented in the per-unit system, the expression of the use of the hub as a fraction of the hub capacity. A per-unit system was adopted due to the large difference between a hub capacity and the use of the hub. For example, a hub has 10,000 tons of capacity and its use for two periods is 9,000 tons and 1,000 tons. In the per-unit system (p.u.), these values are represented as: hub capacity of 1.0 p.u.; 9,000 tons is 0.9 p.u.; and, 1,000 tons is 0.1 p.u.
4.1 Seaport Operation
The operational conditions of seaports are influenced by ocean freight rates, transportation costs, and available capacity. Therefore, for each scenario, the model determines the best seaport capacity and export shares (Table 3). Real Export Share shows the real export share of each seaport in 2019 (Brasil, 2022), and these values are used as a reference to analyze the results obtained (Table 3).
The Real Case scenario roughly recreates (considering that these results are optimized compared to current operations) the seaports share in 2019, especially for the port of Santos and North ports (Table 3). They are the main seaports and are intensively used for soybean exportation. The higher amount of flow shipping by the North ports is the result of the improvements of the network, considering the infrastructure improvements made through public and private agents of the BR163, Miritituba (PA) transshipment hub, and the operational capacity of the seaports, 1.5 times greater than the port of Santos capacity.
Figure 4 (a) presents the seaport operation in the Real Case and Figure 5 presents the amount of flow shipping that exceeds the capacity of seaports. To achieve 24.4% of the export share, the capacity of the the port of Santos is exceeded in periods 2 and 3 (Figure 5); in the peak of exportation, the capacity is exceeded in 1.8 million tons, approximately. The North ports and Itaqui port also exceed their capacity by 0.8 million tons and 0.7 million tons, respectively. The operational capacity of Itaqui port is 1.25 times greater than the port of Santos (Figure 5).
In the Base Case, the North ports and Paranaguá port have expanded their operational capacity (Table 3). They are the leading seaports used for export. Despite the port of Santos's limited capacity, it exported at full capacity from 2 to 6 periods, highlighting its importance in meeting the demand of the Asiatic Bloc. The establishment of the São Francisco do Sul port occurs to support the Paranaguá port in the pick of exportation (Table 3 and Figure 4 (b)).
In the Improved Case, there are variations in the export share and changes in land transport driven by economies of scale. Furthermore, the transportation costs impact seaport capacity expansion as the Paranaguá port (Table 3 and Figure 4 (c)). As the port of Santos capacity is limited, Paranaguá port is responsible for meeting the demand of the Asiatic Bloc. This expansion occurs because the costs to meet demand from the Asian bloc have a greater impact on network costs. Therefore, maritime costs are cheaper when exporting through Southeast and South ports.

The analysis of the scenarios highlights the role of the so-called Northern Arcs seaports that have become the main export seaports from central and north production areas from MT (Salin, 2020). Despite the investment in infrastructure that allowed the consolidation of the flow and the establishment of strategic warehouses/distribution hubs inside MT, the limited capacity of the port of Santos hinders its exportation share. Thus, the results regarding seaport operation show that even with the improvements in land transport and infrastructure, the port of Santos cannot be the main route of exportation, even when Paranaguá port operates to support the port of Santos with the highest level of capacity.

4.2 Transshipment and Distribution Hubs, and cargo-handling capacity in MT
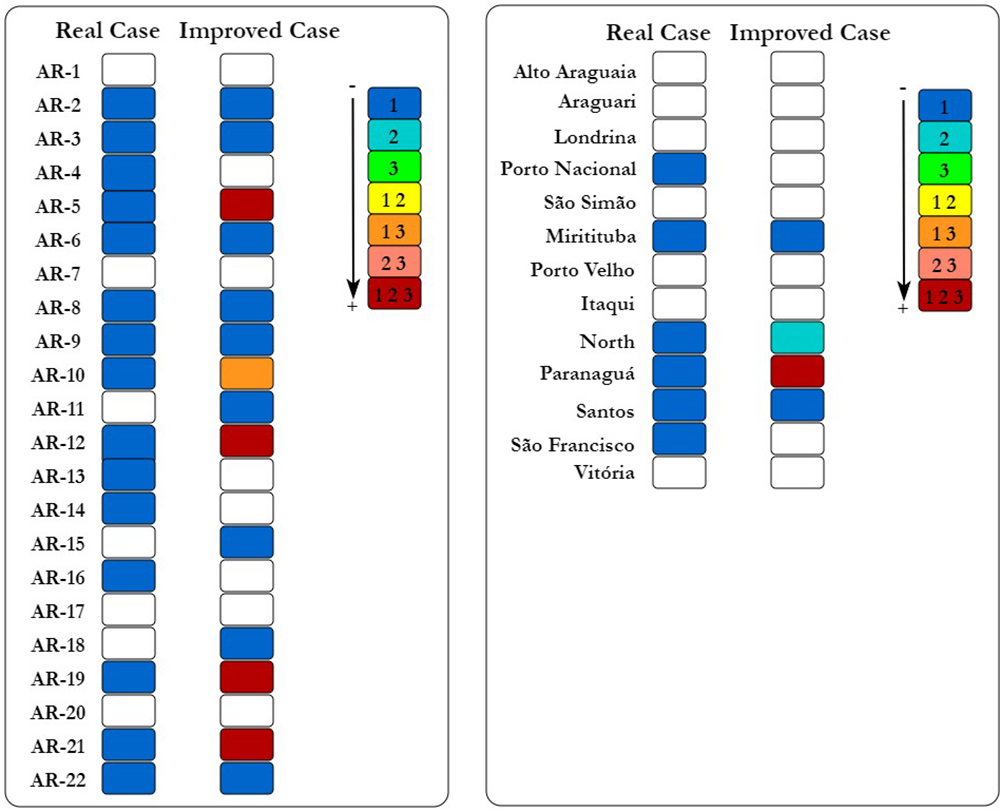
To access the seaports, some transshipment hubs are used to transport the soybeans (Figure 6 and Table 4). The establishment of a transshipment hub is related to the amount of flow exported by seaports and the transportation costs from the origin to the destination.
In Real Case, the Miritituba (PA) and Porto Nacional (TO) transshipment hubs are established to access the North ports and Itaqui port, respectively. Both transshipment hubs operate at the first level of capacity, indicating no need for improvements. Table 4 indicates that all the flow exported through the port of Santos is transported by trucks using direct transport, or the distribution hubs, even in poor conditions of consolidation (𝛼=1.0). Despite being third in the rank of the export share, the flow export through Santos does not justify the investment in transshipment hubs (Figure 6, Figure 7, and Table 4). The analysis performed is similar to transshipment hubs used to access Paranaguá port.

In the Improved Case, the improvements in roads and consolidation (𝛼=0.8) influence operations on transshipment and warehouses/distribution hubs inside the state of MT (Figure 6, Figure 7, and Table 4). Miritituba (PA) transshipment hub is established (the first level of capacity) and operates at total capacity during the main period of exportation. Miritituba (PA) is the only transshipment hub established since exports went through the North ports, Paranaguá port, and the port of Santos.
To support the network exportation, the Real Case scenario establishes 16 distribution hubs/warehouses inside MT. Since only the first level of capacity is available, stocks are spread across the state (Figure 7). This scenario provides insight into the current location of stocks in MT. The state spreads stocks in a scenario with poor transportation, storage infrastructure, and no efficient flow consolidation. In the Improved Case, 14 distribution hubs/warehouses are established. Some distribution hubs/warehouses are common in both scenarios, Real and Improvement Case. However, distribution hubs/warehouses located at AR 5, AR 10, AR 19, and AR 21 have their capacity expanded in the best-result scenario, indicating the need of infrastructure improvements. These distribution hubs/warehouses are next to BR 163 and BR 364, accessing the main seaports exportation, North ports, Paranaguá port, and the port of Santos (Figure 1 and Figure 7).

5. CONCLUSIONS
Motivated by a real-world application for the BSEC, a SCND design has been developed. The model encompasses requirements of strategic and tactical planning allowing simultaneous determination of hubs, capacity, and routes in a dynamic network exploring economies of scale. The BSEC shows that it is still necessary to equate the mismatch between production and export, which implies long distances traveled and high transport costs.
The proposed model can be used as a location and transportation planning tool for companies that operate dry bulk cargo, as a strategic planning tool for future infrastructure investments, or as a base model, in which specific requirements can be included.
To equate this dynamic, it is necessary to create new intermodal routes and to make investments in the seaports to improve their efficiency, especially in the North region where the distances between the producing regions and the export ports are shorter and consequently less costly.
In this context, we analyzed more efficient transport in the network and different operational capacities for all seaports selected in this study. In particular, we highlight the impact of different operational capacities of the considered seaports and the limited capacity in the port of Santos, the most representative seaport for the soybean exportation chain.
The main scientific contribution of this research is to emphasize the importance of intermediate facilities acting as hubs, necessary to achieve economies of scale, and the importance of the flow to be consolidated from the storage points, hubs acting as warehouses. These results indicate to decision-makers in each production area where to invest in hub location and what the storage and operational capacity of these hubs should be made.
These become evident once we present the results for the best scenario (Improved Case), in which the results are influenced by the operational efficiency of the North ports, once the port of Santos has an operational capacity limited.
The New PAC (Growth Acceleration Plan), launched in 2023, is an investment program coordinated by the Brazilian government in partnership with the private sector. The New PAC resumes investments in the logistics sector - roads, railroads, waterways, ports and airports - with the aim of reducing the costs of national production (Brasil, 2024). The program seeks to reduce logistical bottlenecks, diversify and integrate the transport network through intermodality, making it more sustainable and efficient (Brasil, 2024b). In this context, the conclusions of this research corroborate the guidelines of the New PAC, since it indicates that the BSEC can be more efficient through intermodal export routes and diversification of destination ports, especially in the North.
Note that the design network obtained in our analysis is influenced by the following factors: (1) China, which is the largest oversea consumer, if Europe becomes the largest consumer of Brazilian soybeans, the exportation would be via the North and Northeast ports due to less expensive ocean freight rates. Consequently, distribution hubs and transshipment hubs would favor these seaports. (2) The demand represents only soybean exportation. If the domestic market is considered, then the hub configuration inside the country will be different. (3) Only one product, soybean, was considered and can be considered a limitation of this research. One facility typically handles more than one product, for example, a facility can handle both soybeans and corn. (4) The set of capacity available and the costs. The analysis of different sets of capacity and/or different costs can change the network design. In addition to the factors considered above, several extensions of the proposed model can be made, e.g., including a minimum level of use for each intermediate facility, considering a different discount factor for each arc, and considering production and/or demand uncertainty.
REFERENCES
-
Alumur, S., & Kara, B. Y. (2008). A hub covering network design problem for cargo applications in Turkey. Journal of the Operational Research Society, 60(10), 1349-1359. https://doi.org/10.1057/jors.2008.92
» https://doi.org/10.1057/jors.2008.92 -
BRASIL - Ministério do Desenvolvimento, Indústria, Comércio e Serviços. (2022). Comex Stat - Brazilian Foreign Trade Statistics. General Exports and Imports. http://comexstat.mdic.gov.br/en/geral
» http://comexstat.mdic.gov.br/en/geral -
BRASIL - Ministério do Desenvolvimento, Indústria, Comércio e Serviços. (2024a). Comex Stat - Brazilian Foreign Trade Statistics. General Exports and Imports. http://comexstat.mdic.gov.br/en/geral
» http://comexstat.mdic.gov.br/en/geral -
BRASIL - Casa Civil. (2024b). Novo PAC. https://www.gov.br/casacivil/pt-br/novopac
» https://www.gov.br/casacivil/pt-br/novopac -
Campbell, J. F., & O’Kelly, M. E. (2012). Twenty-Five Years of Hub Location Research. Transportation Science, 46(2), 153-169. https://doi.org/10.1287/trsc.1120.0410
» https://doi.org/10.1287/trsc.1120.0410 -
CONAB - Companhia Nacional de Abastecimento e Pecuária (2021). Dados de armazéns no Brasil. http://www.conab.gov.br
» http://www.conab.gov.br -
Contreras, I., & Fernández, E. (2012). General network design: A unified view of combined location and network design problems. European Journal of Operational Research, 219(3), 680-697. https://doi.org/10.1016/j.ejor.2011.11.009
» https://doi.org/10.1016/j.ejor.2011.11.009 -
Correia, I., Melo, T., & Saldanha-Da-Gama, F. (2013). Comparing classical performance measures for a multi-period, two-echelon supply chain network design problem with sizing decisions. Computers and Industrial Engineering, 64(1), 366-380. https://doi.org/10.1016/j.cie.2012.11.001
» https://doi.org/10.1016/j.cie.2012.11.001 -
Darvish, M., & Coelho, L. C. (2018). Sequential versus integrated optimization: Production, location, inventory control, and distribution. European Journal of Operational Research, 268(1), 203-214. https://doi.org/10.1016/j.ejor.2018.01.028
» https://doi.org/10.1016/j.ejor.2018.01.028 -
Eskandarpour, M., Dejax, P., Miemczyk, J., & Péton, O. (2015). Sustainable supply chain network design: An optimization-oriented review. Omega, 54, 11-32. https://doi.org/10.1016/j.omega.2015.01.006
» https://doi.org/10.1016/j.omega.2015.01.006 -
Farahani, R. Z., Rezapour, S., Drezner, T., & Fallah, S. (2014). Competitive supply chain network design: An overview of classifications, models, solution techniques and applications. Omega, 45, 92-118. https://doi.org/10.1016/j.omega.2013.08.006
» https://doi.org/10.1016/j.omega.2013.08.006 -
Filippi, A. C. G., Guarnieri, P., Carvalho, J. M., Reis, S. A., & da Cunha, C. A. (2020). New configurations in Brazilian agribusiness: rural warehouse condominiums. Journal of Agribusiness in Developing and Emerging Economies, 10(1), 41-63. https://doi.org/10.1108/JADEE-12-2018-0178
» https://doi.org/10.1108/JADEE-12-2018-0178 -
Fliehr, O., Zimmer, Y., & Smith, L. H. (2019). Impacts of transportation and logistics on Brazilian soybean prices and exports. Transportation Journal, 58(1), 65-77. https://doi.org/10.5325/transportationj.58.1.0065
» https://doi.org/10.5325/transportationj.58.1.0065 -
Ge, H., Goetz, S., Canning, P., & Perez, A. (2018). Optimal locations of fresh produce aggregation facilities in the United States with scale economies. International Journal of Production Economics, 197, 143-157. https://doi.org/10.1016/j.ijpe.2018.01.007
» https://doi.org/10.1016/j.ijpe.2018.01.007 -
Guastaroba, G., Speranza, M. G., & Vigo, D. (2016). Intermediate Facilities in Freight Transportation Planning: A Survey. Transportation Science, 50(3), 763-789. https://doi.org/10.1287/trsc.2015.0631
» https://doi.org/10.1287/trsc.2015.0631 -
IBGE - Instituto Brasileiro de Goegrafia e Estatística (2021a). Produção Agrícola Municipal (PAM). https://sidra.ibge.gov.br/pesquisa/pam/tabelas
» https://sidra.ibge.gov.br/pesquisa/pam/tabelas -
IBGE - Instituto Brasileiro de Goegrafia e Estatística (2021b). Divisão Regional do Brasil. https://www.ibge.gov.br/geociencias/cartas-e-mapas/redes-geograficas/15778-divisoes-regionais-do-brasil.html
» https://www.ibge.gov.br/geociencias/cartas-e-mapas/redes-geograficas/15778-divisoes-regionais-do-brasil.html -
IMEA - Instituto Mato-Grossense de Economia Agropecuária (2019). Análise Do Déficit de Armazenagem de Grãos em MT. http://www.imea.com.br/imea-site/relatorios-mercado
» http://www.imea.com.br/imea-site/relatorios-mercado -
Medina, G. S. (2021). Economia do agronegócio no Brasil: participação brasileira na cadeia produtiva da soja entre 2015 e 2020. Novos Cadernos NAEA, 24(1), 231-254. https://periodicos.ufpa.br/index.php/ncn/article/view/8521
» https://periodicos.ufpa.br/index.php/ncn/article/view/8521 -
Melo, M. T., Nickel, S., & Saldanha-da-Gama, F. (2009). Facility location and supply chain management - A review. European Journal of Operational Research, 196(2), 401-412. https://doi.org/10.1016/j.ejor.2008.05.007
» https://doi.org/10.1016/j.ejor.2008.05.007 -
Mogale, D. G., Kumar, M., Kumar, S. K., & Tiwari, M. K. (2018). Grain silo location-allocation problem with dwell time for optimization of food grain supply chain network. Transportation Research Part E: Logistics and Transportation Review, 111, 40-69. https://doi.org/10.1016/j.tre.2018.01.004
» https://doi.org/10.1016/j.tre.2018.01.004 -
Naderi, B., Govindan, K., & Soleimani, H. (2019). A Benders decomposition approach for a real case supply chain network design with capacity acquisition and transporter planning: wheat distribution network. Annals of Operations Research, https://doi.org/10.1007/s10479-019-03137-x
» https://doi.org/10.1007/s10479-019-03137-x -
Oliveira, A. L. R., & Alvim, A. M. (2017). The supply chain of Brazilian maize and soybeans: The effects of segregation on logistics and competitiveness. International Food and Agribusiness Management Review, 20(1), 45-61. https://doi.org/10.22434/IFAMR2016.0084
» https://doi.org/10.22434/IFAMR2016.0084 -
Salin, D. (2020). Soybean Transportation Guide: Brazil 2019. https://doi.org/10.9752/TS048.08-2020
» https://doi.org/10.9752/TS048.08-2020 -
Salin, D. (2014). Soybean Transportation Guide: Brazil 2013. https://doi.org/10.9752/TS048.06-2014
» https://doi.org/10.9752/TS048.06-2014 -
Salin, D. (2018). Soybean Transportation Guide: Brazil 2017. https://doi.org/http://dx.doi.org/10.9752/TS048.09-2018
» https://doi.org/http://dx.doi.org/10.9752/TS048.09-2018 -
SIFRECA - Sistema de Informações de Fretes. (2021). Fretes Soja. https://sifreca.esalq.usp.br/
» https://sifreca.esalq.usp.br/ -
USDA - United States Department of Agriculture. (2020). World Production, Markets, and Trade Report. https://www.fas.usda.gov/data
» https://www.fas.usda.gov/data -
Vieira, R. A., & Dalchiavon, F. C. (2018). Custos e viabilidade da implantação de uma unidade armazenadora de grãos no Mato Grosso. Revista IPecege, 4(2), 7-15. https://doi.org/10.22167/r.ipecege.2018.2.7
» https://doi.org/10.22167/r.ipecege.2018.2.7 -
Zhang, D., Zou, F., Li, S., & Zhou, L. (2017). Green supply chain network design with economies of scale and environmental concerns. Journal of Advanced Transportation, 2017. https://doi.org/10.1155/2017/6350562
» https://doi.org/10.1155/2017/6350562
Edited by
-
EDITOR-IN-CHIEF
Marcia Juliana d’Angelo https://orcid.org/0000-0003-1436-5812
-
ASSOCIATE EDITOR
Verônica de Fátima Santana https://orcid.org/0000-0002-9105-7488
The datasets related to this article will be available upon request to the author.

 Source: Author’s own elaboration based on
  Source: Author’s own elaboration
 Source: Author’s own elaboration
 Source: Author’s own elaboration
 Source: Author’s own elaboration
 Source: Author’s own elaboration
 Source: Author’s own elaboration