 Optimized Brain Tumor Segmentation Using Chimp Optimization Algorithm and Type-2 Intuitionistic Fuzzy C-Means Clustering
Abstract
Medical image segmentation plays a vital role in diagnostic imaging, particularly for measuring brain tumor morphology in MRI scans, which directly influences treatment planning, prognosis, and radiological interpretation. However, traditional segmentation techniques often struggle with low contrast, bias-field distortion, and tumor regions that azimuthally encircle healthy tissue. To address these challenges, a Chimp Optimization Algorithm-based Type-2 Intuitionistic Fuzzy C-Means Clustering (COA-T2FCM) framework is proposed. This method integrates Type-2 Intuitionistic Fuzzy C-Means (T2IFCM) clustering with a novel oppositional perturbation mechanism that simultaneously optimizes partition centroids and the fuzzification exponent. The Chimp Optimization Algorithm (COA) efficiently explores the parameter hyperspace, enhancing convergence to the global minima. By employing intuitionistic set theory applied to MRI histograms, the approach adapts to electromagnetic interference, noise, and bias-field distortions, while capturing classificatory ambiguity and pixel classification hesitancy. These measures are embedded into MRI reformulated functional calculations to quantitatively account for intuitionistic noise. The COA-T2FCM framework was implemented in MATLAB and evaluated using publicly available datasets. Performance assessment employed global segmentation accuracy, true positive rate (sensitivity), and Dice similarity coefficient. Experimental results demonstrated a Dice coefficient of 0.95, accuracy of 96%, sensitivity of 98%, and specificity of 97%. Comparative analysis against classical fuzzy c-means (FCM) and centroid-based k-means clustering revealed that the proposed method consistently outperformed these conventional approaches across all metrics. The findings confirm that COA-T2FCM delivers superior segmentation accuracy, robustness, and adaptability for brain tumor MRI analysis, making it a promising tool for clinical applications requiring precise tumor delineation under challenging imaging conditions.
Keywords:
Brain Tumor Segmentation; Chimp Optimization Algorithm; Type-2 Intuitionistic Fuzzy C-Means; MRI (Magnetic Resonance Imaging) Image Analysis; Medical Image Processing.
HIGHLIGHTS
COA-T2FCM: Hybrid Chimp Optimization with Type-2 Fuzzy C-Means for MRI Segmentation.
Optimized Clusters and Fuzzifier Parameters Improve MRI Brain Tumor Accuracy.
Proposed COA-T2FCM Outperforms Existing Methods in Robust MRI Tumor Segmentation.
INTRODUCTION
Tumours are caused as a result of abnormal cell proliferation, which can impair cell function and result in potentially fatal disorders. Unpredictable cell formation in the brain results in a brain tumour. The most well-known sensory system disorders, including mortality and impairment to many people's well-being, are thought to be cerebral tumours. Glioma is the most well-known adult brain tumour in this instance [1]. These tumours can be categorised into the following groups based on their rating:High Grade Gliomas (HGG)will be damaging, which will trigger the memory of the most depressed patient, but Low-Grade Gliomas (LGG)would display favourable patterns and provide a better understanding attitude [2].The development of infection is evaluated by the clinical appearance of tumours during therapy [3]. Brain tumours have been studied using images generated by various medical modalities including MRI(Magnetic Resonance Imaging)/CT(Computed Tomography scans, spectroscopy, SPECT/PET scans [4].
The advantages of contrast resolution, dynamic range, spatial resolution, and non-invasive nature of MRI makes it the most important imaging tool for diagnosis and treatment of gliomas, with MRI scans being the most powerful imaging technique which produces various types of scans such as T1-weighted images, T1ce images, T2-weighted images and FLAIR[5][6]. Each of these types contributes important and complementary information for the evaluation of various conditions within the brain.The reliance of accurate classification of brain tumors with these imaging modalities within medicine means that accurate and effective treatment can be determined, and as such, MRI imaging works by visualizing the tumor boundaries, and differentiating tumor tissue from normal brain structures with clear accuracy thereby increasing the precision with which the clinical procedures can be performed as well as the brain tumor clinical management in general[7].
In this study, meticulous orchestration, image-guided suggestions, and image segmentation are utilized to organize the illness or to gather pixels that can be used to identify a tumour. The intricacy of various segmentation processes with varying levels of accuracy and precision was created and established in the absurdly late years and years. Another fuzzy level set calculation for the automated medical image segment uses the fuzzy ensemble as the fundamental level synthesizer. With this method, limit leakage may be avoided while spatial data can be roughly mapped to the maneuver's region. Potential regions of interest can be modified in fuzzy clusters [8]. Thus, it completes the potential benefits of pre-level learning. Tumour division is seen as a particular difficulty in the unique projected tumour division approach for MRI images. The method divided voxels into several classes using sequencing algorithms autonomously [9].
The approach for segmentation based on the branching of clusters formed with Fuzzy C-Means (FCM) on MRI images is usually aligned with the threshold values which aid in the identification of brain tumors [10]. Moreover, the formed segmentation regions can also be processed by K-Means Clustering (KMC) which can provide optimal, though at times vague, cluster benchmarks in the regions for enhanced accuracy [11].The adaptively controlled MRI slices of the cerebral tumor segments possess some benefits, in particular local tailoring, which is at a greater level of difficulty in interpretation and is often more useful than the conventional C-marker boxing techniques [12]. While striving to reduce the complexity of the image, enhance the definition of the borders, and minimize the computational workload, these techniques fail to provide the required accuracy or precision with the segmentation of MRI images [13].
Due to these gaps, more recent studies have been looking into the application of Artificial Intelligence (AI) and optimization methods for the segmentation of MRI images.
In this paper, optimal brain tumour segmentation method is developed to optimal classification of the brain tumour diseases. The main contribution of the work is presented as follows,
-
In this research, segmentation is accomplished using Chimp Optimization Algorithm-based Type-2 Intuitionistic Fuzzy C-Means Clustering (COA-T2FCM). The suggested segmentation method combines oppositional function and T2FCM clustering.
-
Chimp optimizations help in selecting effective cluster Centre’s in T2FCM clustering.
-
Goal functions initially examining T2FCM clustering consider fuzzy data of MRI images.
-
After that, the cluster center and fuzzifier from the clustering approach are optimized using a chimp optimization process.
-
The proposed approach is simulated in MATLAB, and its effectiveness is validated. The suggested method is benchmarked for comparisons with other methods including FCM and KMC.
The remainder of the article is set out as follows: Section 2 lists relevant studies on brain tumour segmentation, and Section 3 gives a detailed explanation of the clustering technique that has been suggested for brain tumour segmentation. The suggested technique's findings are shown in Section 4, which validates the performance of the approach. The paper's conclusion is then stated in section 5.
LITERATURE REVIEW
Two lightweight CNN models (LBTS-NET 16 and LPDS-NET 19) for the cerebral tumor segment. The proposed models are based on minimizing sizes of repeating channels in main layers using VGG design and attaining deeper learning from system's fundamental layers (layers two to four). Transfer learning quantified radical divisions in this work. The test results showed that the introduced technique completely reduced the company's computational problem, while VGG had a comparative presentation as opposed to the engineering method. Similarly, the test results showed that the introduced model fulfilled the promising presentation of overcoming comparison strategies [14].
The multimodal mind appealing MRI imaging to introduce manufacturing and computerized calculations of brain structures on the equator's sides for tumour segmentations. For calculating severity-based ulceration variabilities on the equator's sides, equilibriums are unavoidable. To distinguish between benign and malignant tissue, as well as to improve segmentation speed and accuracy, a reliable approach was created. Similar movements are characterized for viewing by characteristics separated from both sides of the cerebellum when equilibrium planes first diverge. Using comparative evaluation, the oncology district was eliminated, and a post-processing step increased accuracy. BRATS datasets include high/low-grade glioma brain tumours are compared to the estimate. Records for the exhibition were found, and a neighborhood inquiry was done [15].
An Intelligent Fuzzy Level Set Method with IQPSO (Improved Quantum PSO) for general Inquiry capability for the image segment Improves quality and speed of opening capacity. The introduced calculation enhances the initial shapes with the virgin fluffy punch technique using the IQPSO strategy, and separates the image using the Advanced Positioning System (LSM) approved standard team leader using IQPSO’s long-distance travel gradients. The duration of the cycle will similarly provide a pre-interest form, which was close to the regional interest (ROI). Implementing the introduced work for the separation of mental tissues with MRI images gives a streamlined effect, which is 15% higher than the first FLSM calculation. Forms produced in this work were secure when compared to FLSM’s security. The suggested work significantly improves film unit activity [16].
A Weighted Bee Swarm Intelligence, and multiple tumour segmented groups in MRI images. The segments were in the form of matrices. This procedure's effectiveness stemmed from combinations of divisions and advancements, which mixed image data with innovations to create clear and accurate image inquiries. Divisions of matrices reduced computations and complexity. Segment boundaries were advanced utilizing weighted bee swarm optimization to accomplish the harshest execution. The proposed calculation was utilized to split many educational sections, including CSF fluid, pale matter, and white matter, which are frequently valuable in considering and depicting the tumour. According to experimental data, the proposed technique improved injuries and specific investigations. The demonstration of this method resulted in a 1.5% rise [17].
A 3D CNN and U-Net segmentation technique proposed the yields better and more accurate predictions in an essential and understandable strategy. In the BRATS-19 test database, the two models were separately created and assessed to produce segment diagrams that differ up to one another's construction subdivisions and are variable to meet the ultimate forecast. The suggested collection performs better than the already available cutting-edge for upgrading tumour, entire tumour, and tumour centre with dice scores of 0.750, 0.906, and 0.846 individually, separately in the approved package [18].
The Deep learning algorithms were proposed the classification of different kinds of brain tumours using publicly available datasets. BTs are classified as benign or malignant in these databases. The datasets for testing consist of 696 images on T1-weighted images. The proposed arrangement performed admirably, with accuracy of 99.04% illustrating the capabilities of the proposed algorithm in classifying brain cancers [19].
The comparison of the current strategies is shown in Table 1.
METHODOLOGY
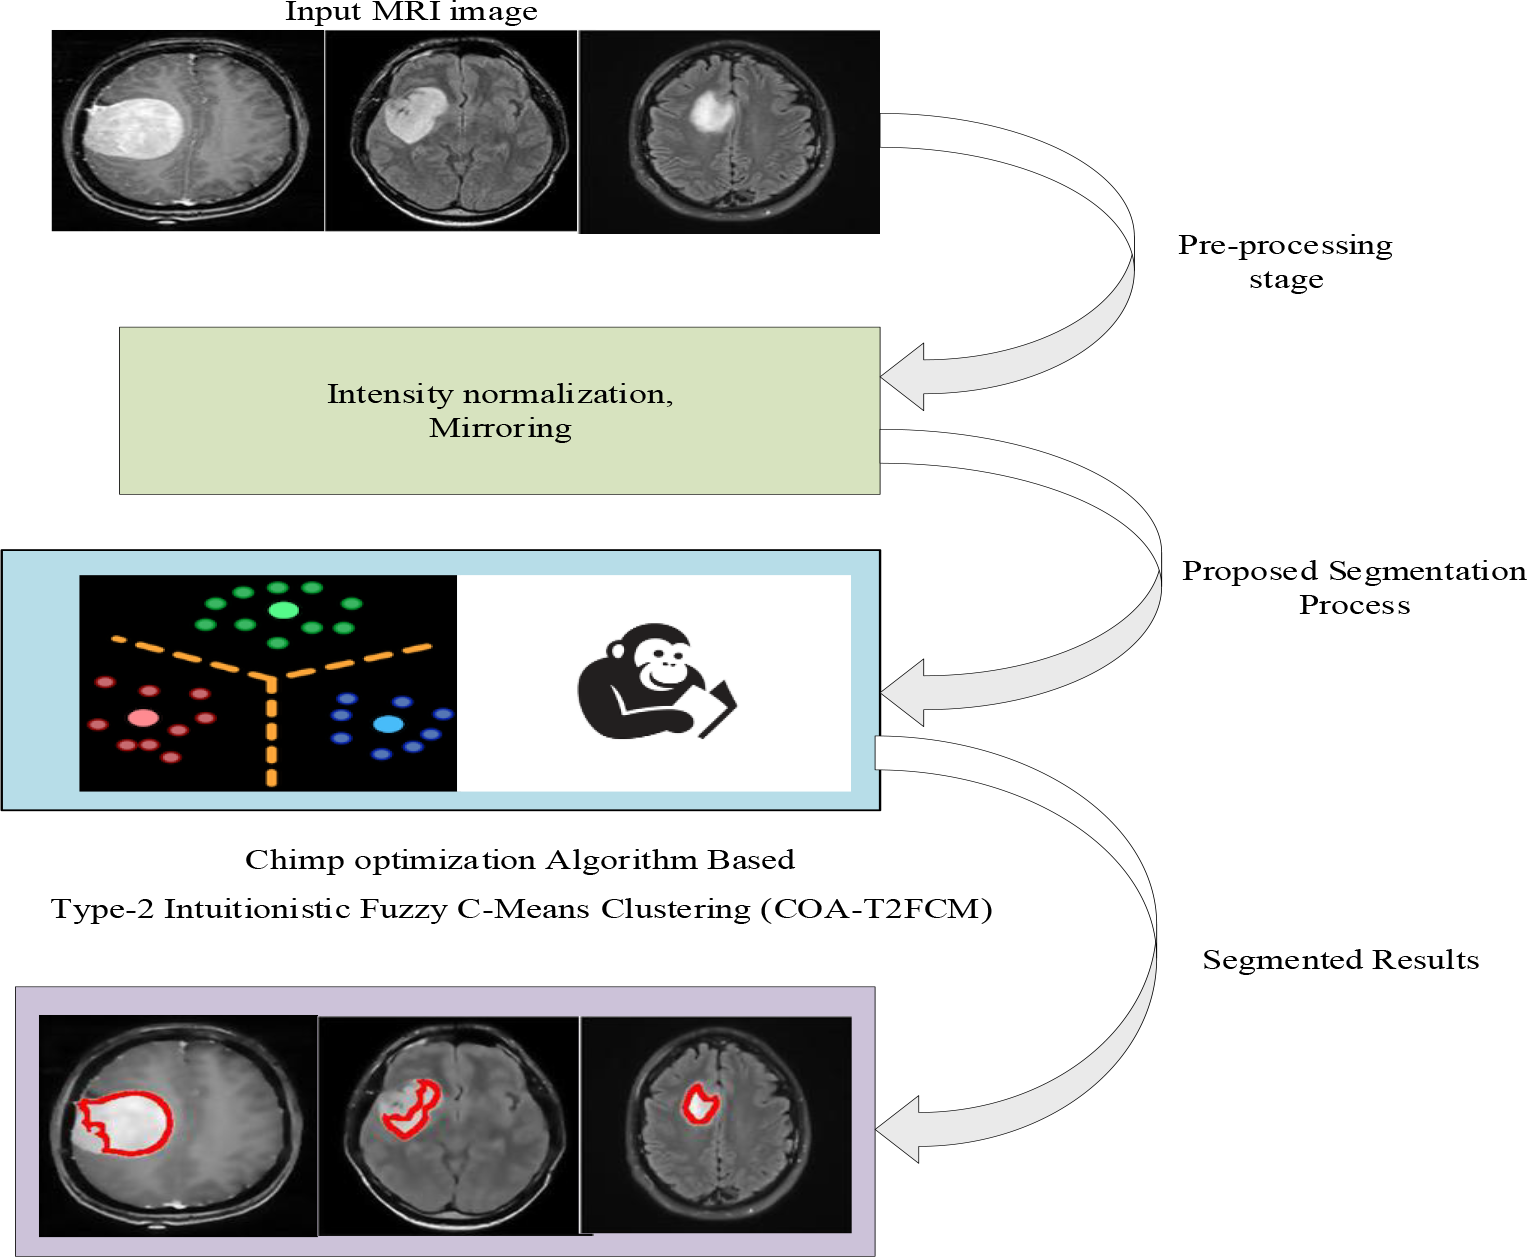
Due to the brain tumor's complicated structure and uneven form, segmenting it from an MRI image has become more challenging in recent years. Therefore, COA-T2FCM is created in this study to accomplish the best brain tumour segmentations where pre-processes and segmentations were used. Initial pre-processes removed undesirable noises from the images through the use of intensity normalizations, corrections of orientations, and mirroring. Segmentations to separate cancers from MRI images were the second phase. Figure 1 depicts the whole architecture of the suggested technique.

The dataset used is an open source on which pre-processes were executed to clean images from undesirable noises. The pre-processed images are sent for segmentations, which isolate brain tumours from MRI images. These stages are detailed in subsequent sections.
Pre-Processing Stage
To improve image quality, unnecessary information is removed from MRI images during pre-processing. The following pre-processing techniques are employed in the proposed methodology:
(a) Normalization of intensities
The primary downside of images with the same types of tissues in brain MRIs is that they lack a consistent intensity. Even inside comparable objects, different MRI sequences offer varied intensities for the same tissue types. The process of image analysis and segmentation is complicated as a result of these modifications. Because of this, the intensity normalization is a necessary component of MRI analysis [20]. In this case, global linear scaling is used to rescale the intensity data using gaussian intensity normalization. The principal intensities used in this technique are split by intensity’s standard deviation values.
Where, σ implies standard deviations of scans and I stands for primary intensities. MRI image segmentations are achieved in ranges of [0,1024], without much information losses.
(b) Mirroring
Images are flipped vertically for mirror image versions when after correcting offsets and rotations [21]. The left and right hemispheres are compared using mirrored and reference images. The MRI image pre-processing stages remove any extraneous data from the image.
Intuitionistic Type-2 Clustering with FCM
Brain tumours are separated from MRI images using clustering. The suggested clustering approach is an improvement over FCM, which is able to handle higher data uncertainty [22]. Two distinct fuzzifiers, each of which is specified as a fuzzy degree, are used in the suggested technique. The mathematical formulation of this suggested fuzzy degree is as follows:
Where, is Euclidean distances amongst cluster centers and ith patterns, are membership functions of ith patterns related to jth clusters, C implies cluster counts and N represents data . The lower and higher membership functions in the proposed clustering are mathematically stated as follows,
Karnik mendal iterative algorithms calculate minimum and maximum values for jth cluster centers. Right and left memberships of features are determined in iterations as shown below.
Where, M implies pattern’s features counts, are minimum values of jth cluster centers, maximum values of jth cluster centers, stand for right membership functions and depicts the left side computations. Membership matrices with centroids can be obtained by considering defuzzification and type reduction approaches.
The brain tumour is segmented from the MRI images using the suggested clustering approaches. The cluster centre is a critical element in achieving the optimal segmentation cluster. The COA procedure is used to identify the best cluster centre. To enhance the exploration features of the optimization process, a novel method has been suggested which uses an oppositional function. This function looks at the search space of the candidate solution and the candidate’s opposite. This enhances the chances of obtaining the global optimum in the initial phases of the search. In the case of brain tumor segmentation, such a strategy assists the Chimp Optimization Algorithm (COA) in circumventing local minima, leading to more accurate cluster center identification and better segmentation. This oppositional mechanism, thus, improves the speed and dependability of convergence, especially in MRI data, which has a high dimensional feature space.The next section provides a detailed overview of the proposed COA-based cluster centre selection.
COA
The COA applied in this work can be formulated as:
Inspiration
Fission-fusion reactions are frequent amongst chimps. In their society members have distinct roles and talents and susceptible too changes. The objective of separate concepts is produced through contemplations and groups of chimps make distinct efforts aimed at a certain goal and explore search regions with distinctive traits. Typically, four types of chimps are displayed: attackers, chasers, barricades, and drivers. The chimps' hunting behavior are changed depending on these categories for optimal hunt operation. The drivers in the chimpanzees' strategy accumulate prey without actively participating in the hunt. Natural barriers, like plants, act as traps to prevent prey from escaping, while chasers swiftly seize their targets. Attackers meticulously track their prey, ultimately capturing them as they descend into the lower canopy. To improve hunting success, attackers must sharpen their ability to predict the prey's next movements. A successful hunt not only results in securing the prey but also rewards the attackers with a larger share of the catch. The strategy for hunting is strongly linked to factors such as intelligence, skill, and age in the context of chimpanzee behavior. Moreover, tactics can evolve mid-hunt or be adjusted over time. Chimpanzees sometimes grant permission for specific individuals to hunt in exchange for social benefits like food preparation or mutual support. This dynamic adds complexity and mutual advantages to their social interactions, influencing future hunts. Chimpanzees leverage social incentives much like humans do, giving them a unique advantage over other social predators. They display heightened tension during the final moments of a chase, which may be influenced by reproductive instincts. Efficient hunting practices, such as securing resources in bulk, help avoid inefficiencies like acquiring prey piecemeal. Their social behavior is generally categorized into two main stages: confrontational (abuses) and exploratory (investigations).During exploratory behavior, chimpanzees employ methods for tracking, cornering, and driving prey. Confrontational actions, on the other hand, are straightforward predator attacks. The following analysis highlights data on these two distinct stages: abuse and investigation
Driving and Chasing Preys
Preys in COA are hunted during exploitations and explorations where chasing as well as driving preys can be depicted mathematically as:
Where are position vectors of chimps and stand for position vectors of chimps, T represents current iteration counts, coefficient vectors are represented as A,M, and C. The location vectors of the COA are determined using:
Whereas, F may be defined as a non-linear coefficient that went from 2.5 to 0 using iteration approaches in explorations and exploitations, while R1 and R2 can be described as random parameters that fall between [0,1]. The variable M represents chaotic parameters derived from various chaotic maps. These parameters influence the chimps' behavior, particularly reflecting their sexual drive within their hunting patterns. The corresponding vector encapsulates this aspect of their behavior, offering insights into their strategic decision-making. The next section provides a detailed exploration of the vector's values and their implications.
Exploration Phase
Mathematically, chimpanzee’s assaults are in a way that point’s prey's positions for orbits. Attackers typically maintain predators while chasers, barrier, and drivers also get involved. Since, understanding optimal circumstances of preys is complex initially; attackers’ statuses are used to update statuses of chasers, blockers, and drivers. Other chimps freeze to update positions pertaining to locations of best chimps, and four optimal solutions can be preserved. These operations can be depicted mathematically as:
The positions of search agents are updated within the search space based on the relative position of other chimps. Consequently, the chimpanzee's final position is randomly selected from the locations of drivers, chasers, barriers, and attackers within the orbit.
Phase of Exploitation
As previously said, chimpanzees will chase their prey by attacking as soon as they stop moving. Chimpanzees linearly minimize the value of f during the attacking phase. In a similar way to the f vector, the vector of a was likewise decreased. Furthermore, the variable an is arbitrary and is in the range [-2f,2f]. A local minima trapping state may still exist despite COA pursuing, obstructing, and driving expanded exploratory capabilities of systems. As a consequence, investigation is an essential component for achieving the greatest outcomes. Chimps divert to attack and converge on preys in COA. Mathematically, vectors create these features for computing inequality parameters. To avoid being trapped in local optima, chimps were forced to diverge from preys (|a|>1) and for attaining global optimum, chimpanzees were converged on preys ().
Exploitation Phase using the Social Incentive
COA describes the social incentives and chimp communities associated with meat hunting. Chimps may choose to quit hunting during the last hunting steps/procedures. Hence, they obtain hunting meats randomly. Certain chaotic maps are used to produce certain chaotic map characteristics, which are stated as follows:
Where μ stands for arbitrary numbers between [0,1]. They begin by producing a colony of chimps at random. Second, numerous groups of chimps are arbitrarily constructed from all of them, including the drivers, chasers, barriers, and attackers. Subsequently, each chimp's position adjusts the \(f \) coefficients while considering the approach of its respective group. During iterations, the optimal prey positions are determined based on the locations of drivers, chasers, barriers, and attackers. These positions are then updated in conjunction with the prey's distance [23], ensuring a rapid convergence rate through the optimal tuning of \( m \) and \( c \), enabling faster adaptations. Additionally, the value of \( f \) can be adjusted from 2.5 to 0, enhancing exploitation capabilities. Finally, iterations and divergence conditions are evaluated to identify the best outcomes.
RESULTS AND DISCUSSION
In this part, the suggested approach’s efficacy in separating brain tumours from MRI images is assessed. The proposed technique performances are verified by comparative analysis of the existing techniques. MATLAB R2016b is the programme used to accomplish this approach. The datasets are taken from [24], which has 253 photos, to verify the effectiveness of the suggested technique. Table 2 lists this work’s implementation parameters where performance indicators like Dice Similarity Coefficient (DSC), Jaccard Similarity Index (JSI), accuracy, sensitivity and specificity.
The confusion matrices were computed based on constraints described below,
-
Brain tumours categorized as present are True Positives (TP).
-
Brain tumours not segmented are True Negatives (TN).
-
Brain tumours not segmented are False Positives (FP).
-
Brain tumours classified as absent are False Negatives (FN)..
The suggested technique is assessed using performance metrics based on the progression of confusion matrix words, which are as follows:
Accuracy: Accuracy is defined as the proportion of accurately segmented data instances in relation to the total number of instances. The following is the accuracy formula:
Sensitivity: Sensitivity is defined as the ratio of accurately segmented positive samples to total positive occurrences, Sensitivity, or the True Positive Rate, quantifies the actual tumor pixels proportion that are correctly segmented. Greater sensitivity demonstrates the method works in recognizing the majority of the tumor region while avoiding a large number of false negatives. Which may be expressed as follows:
Specificity: Specificity is defined as the ratio of correctly segmented negative instances to total negative instances, which may be expressed as follows:
The Dice Coefficient is a metric that quantifies the degree of similarity between the predicted segmentation and the actual segmentation. It takes on values between 0 and 1, where 1 signifies absolute similarity between the two. This metric is especially important in surgical image segmentation for assessing the performance of region-based predictive models.
DSC: Indices of similarity index computed using equation below.,
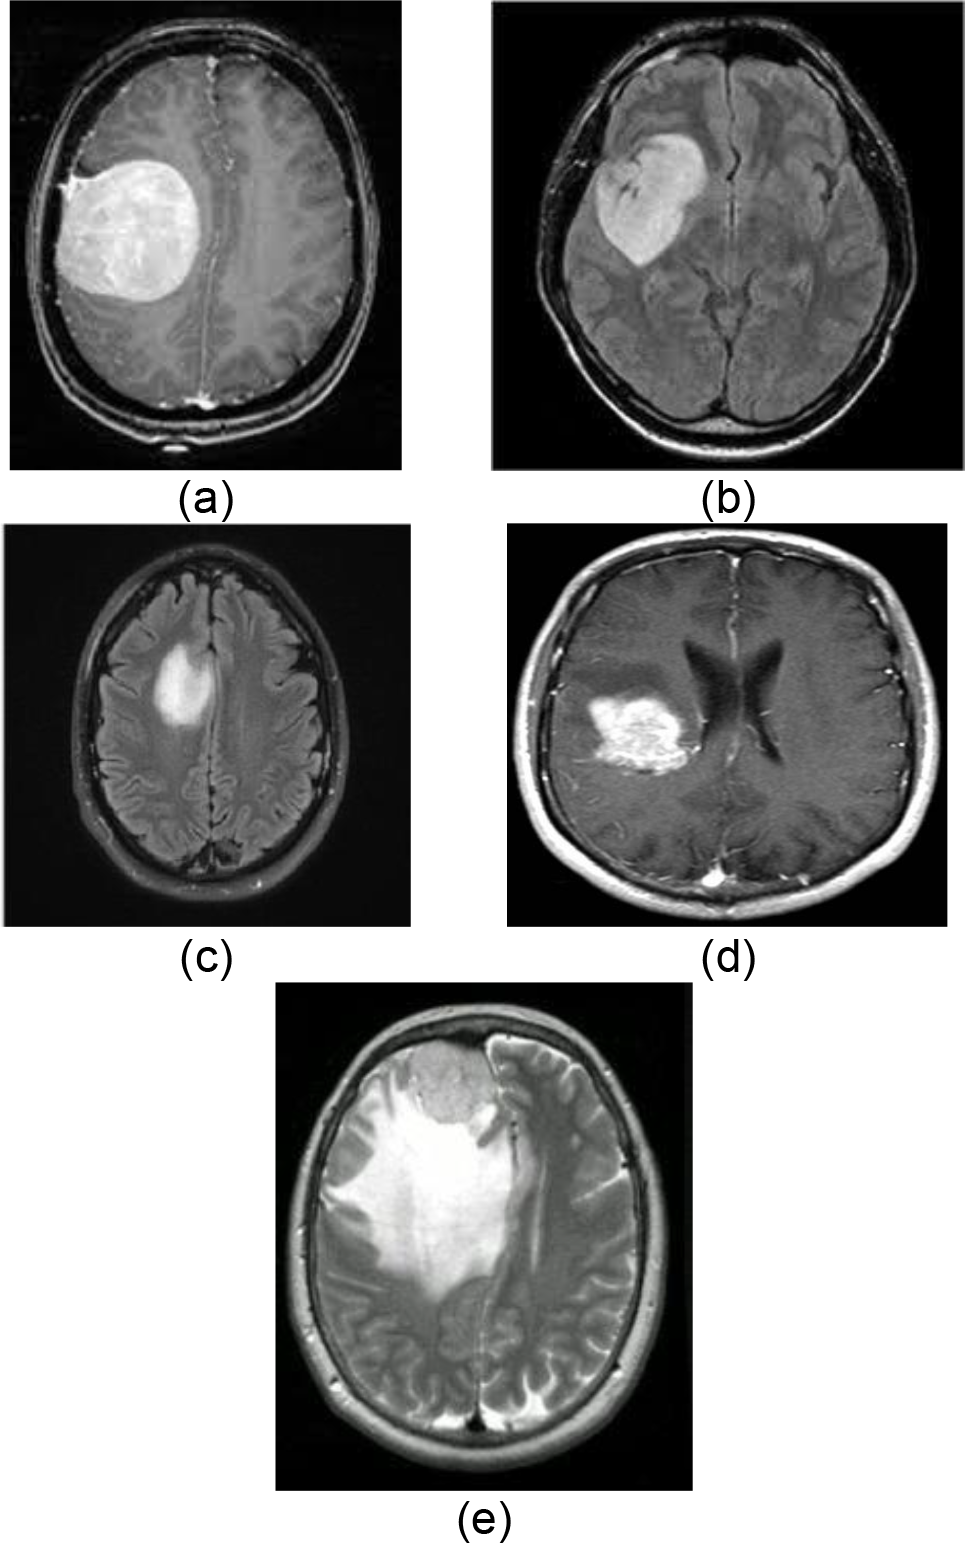
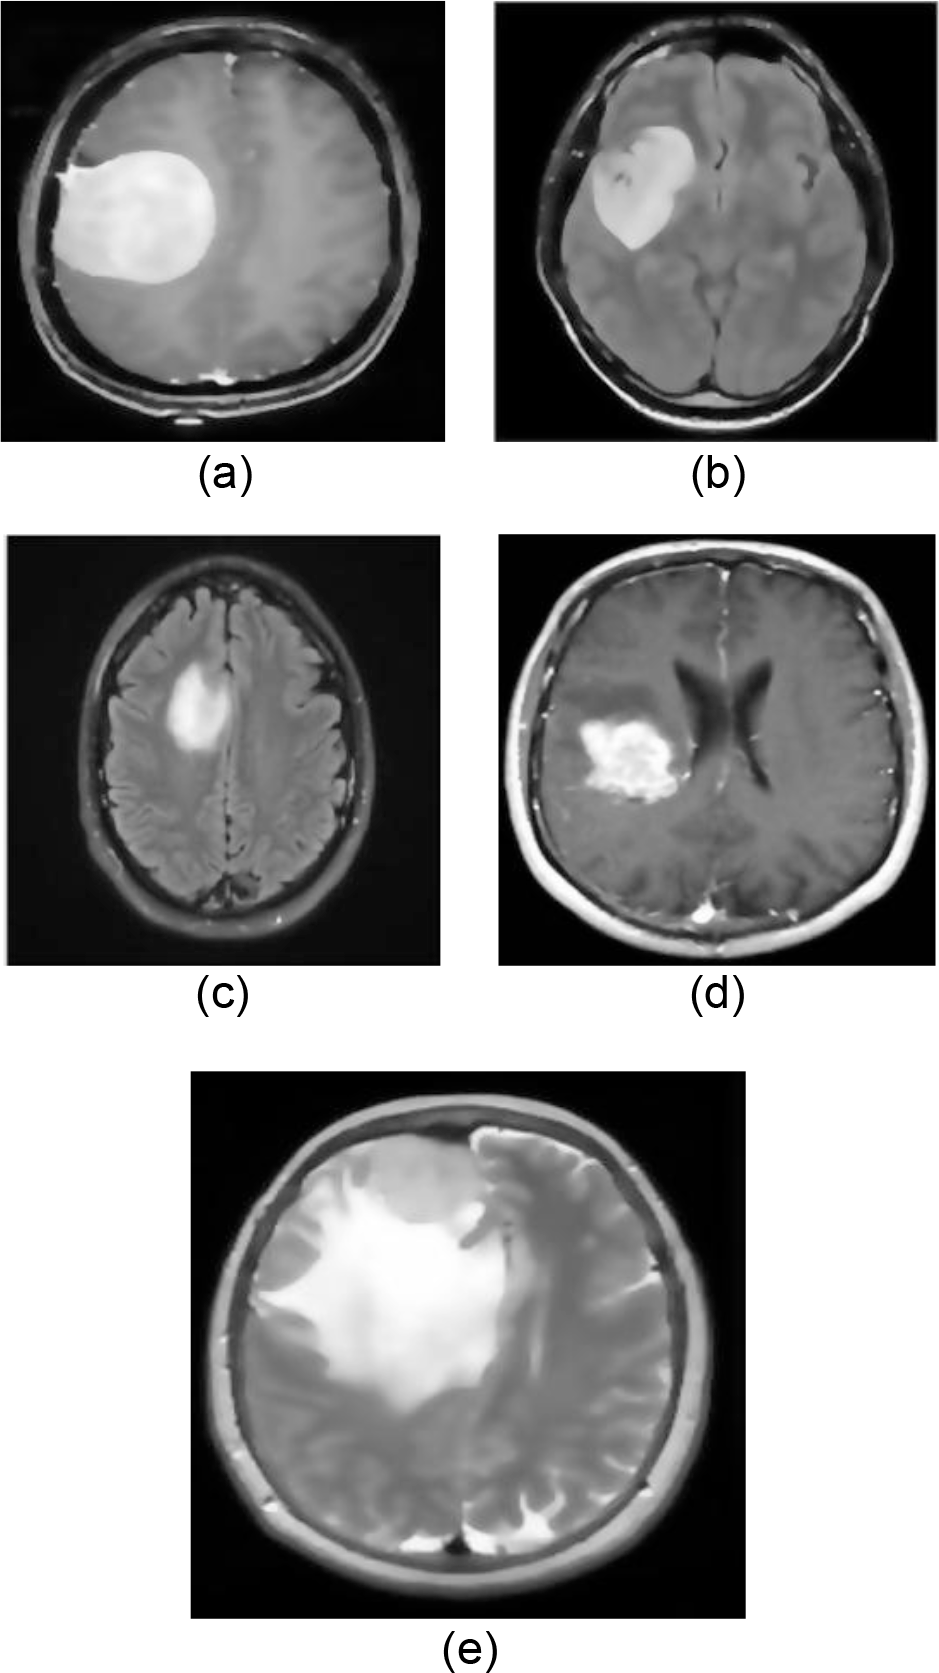
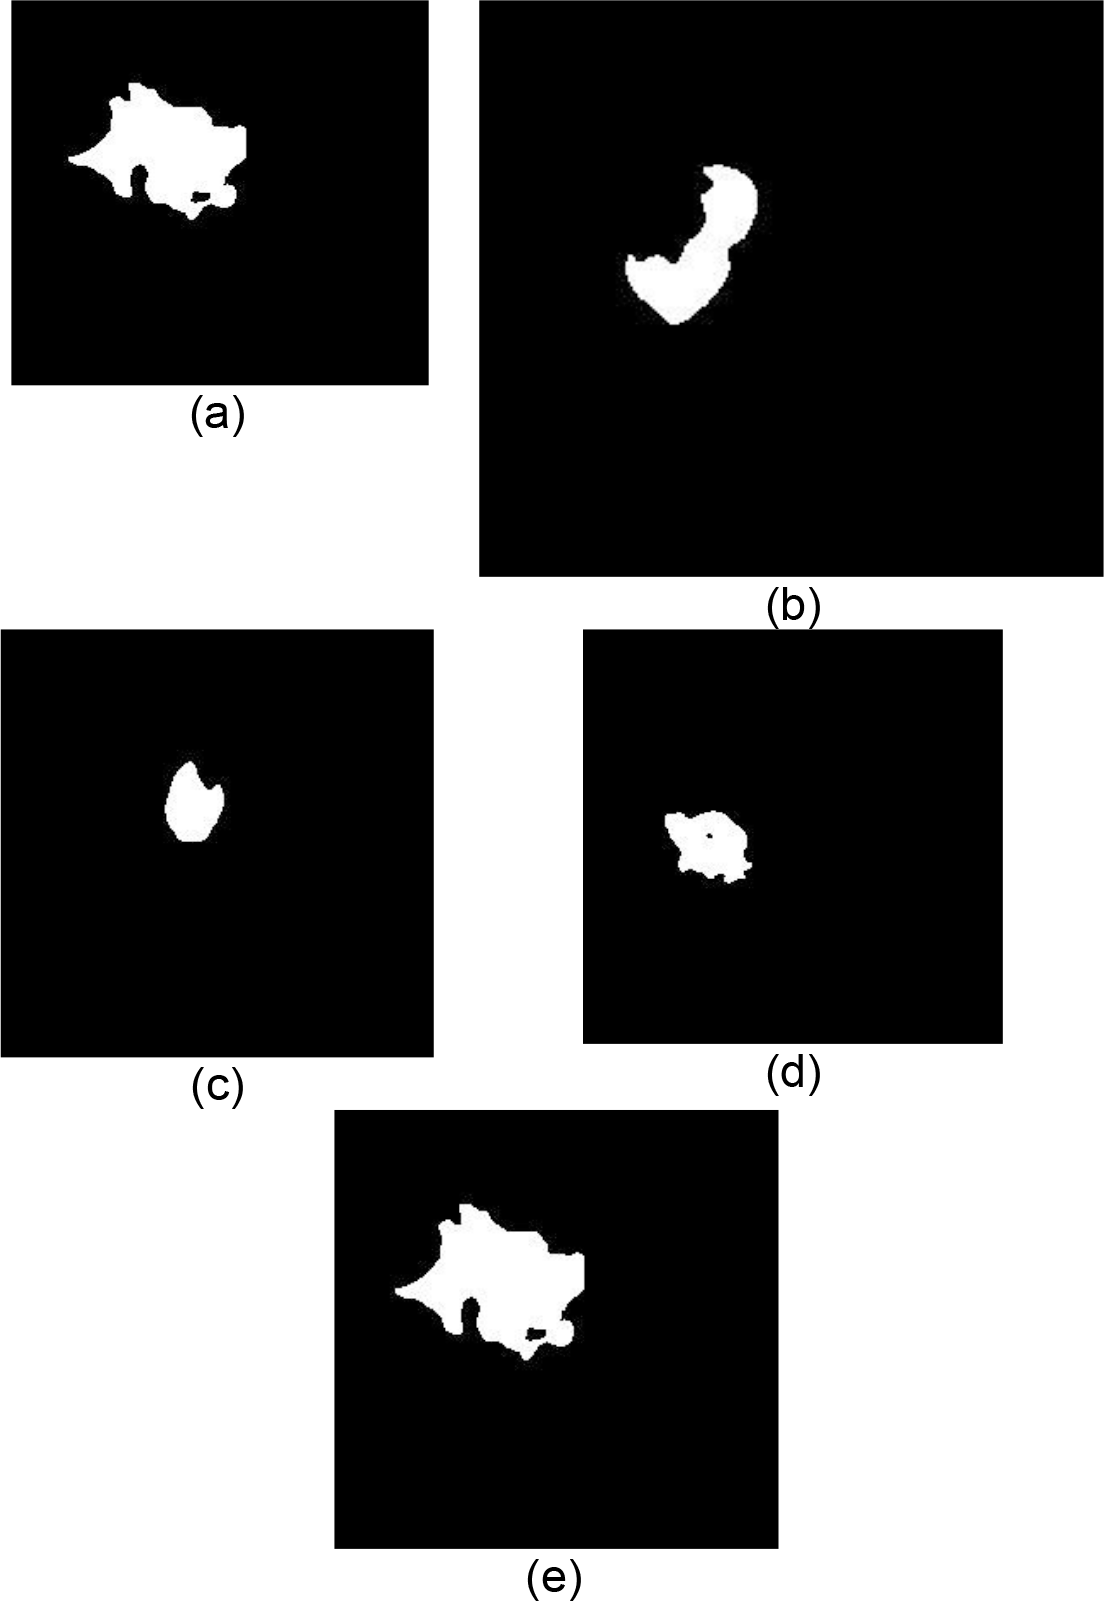
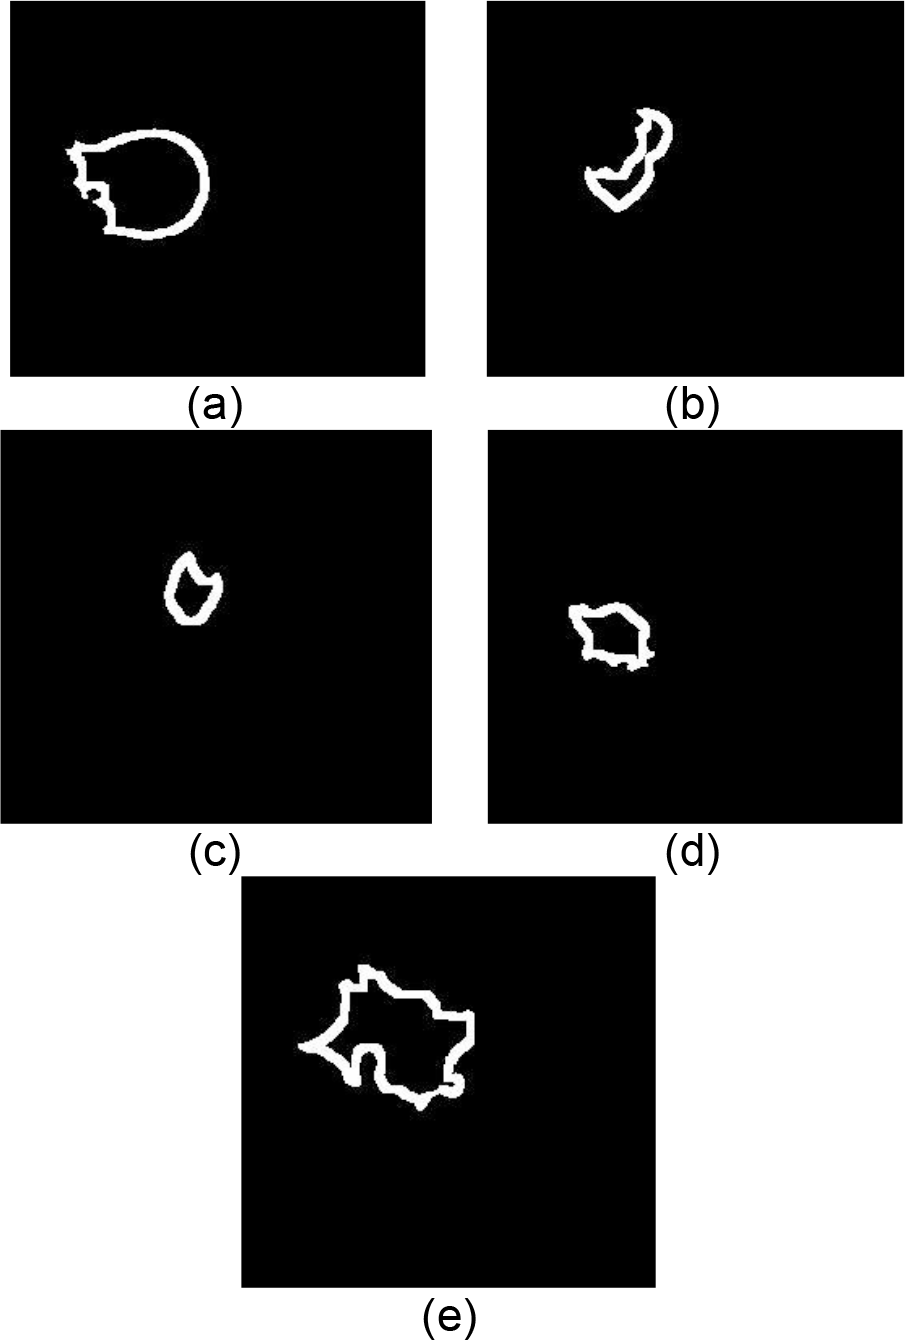
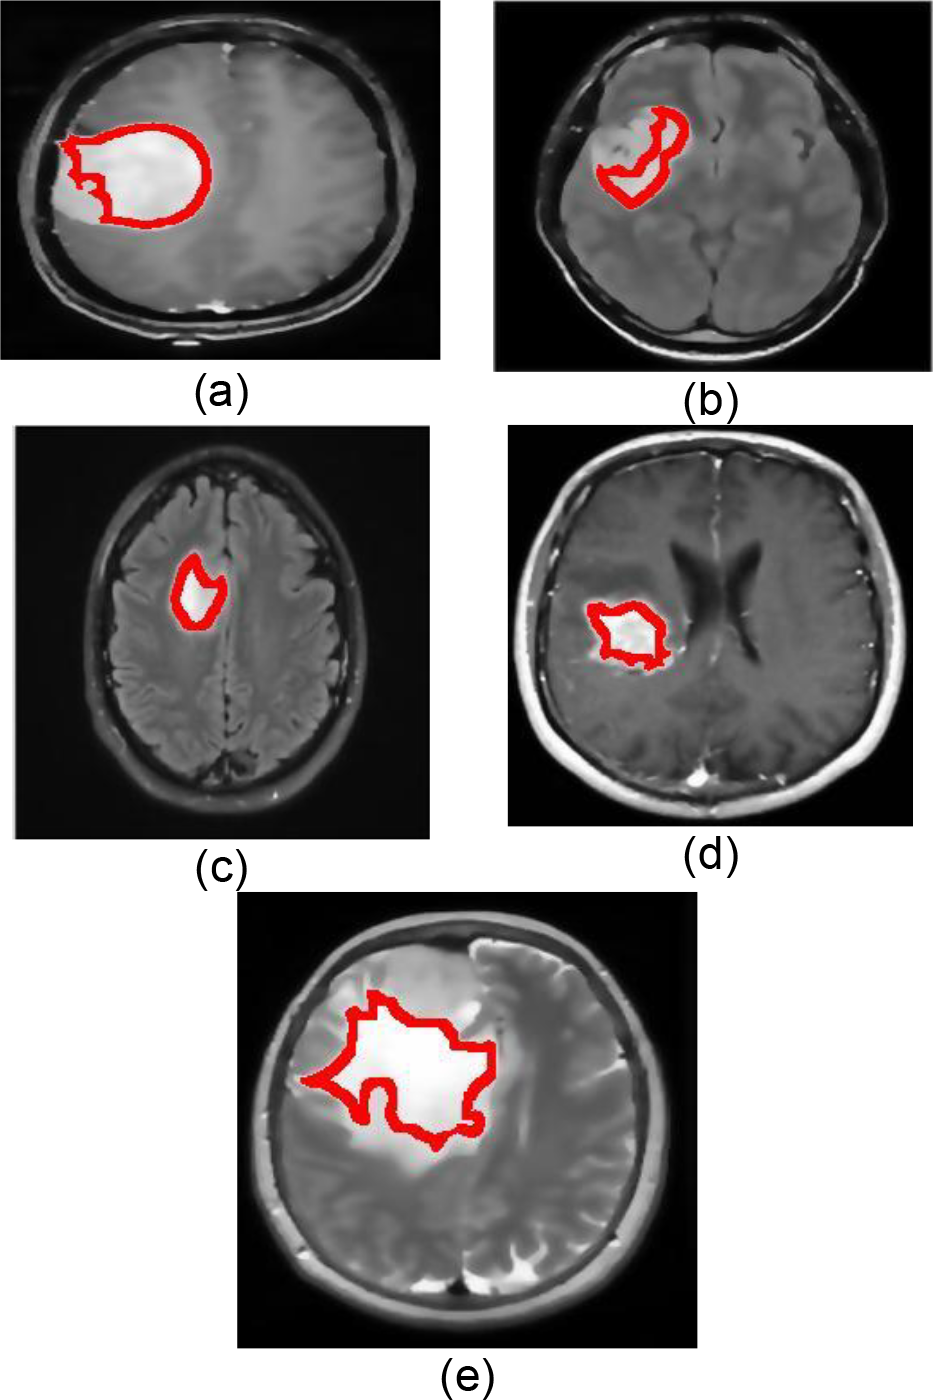
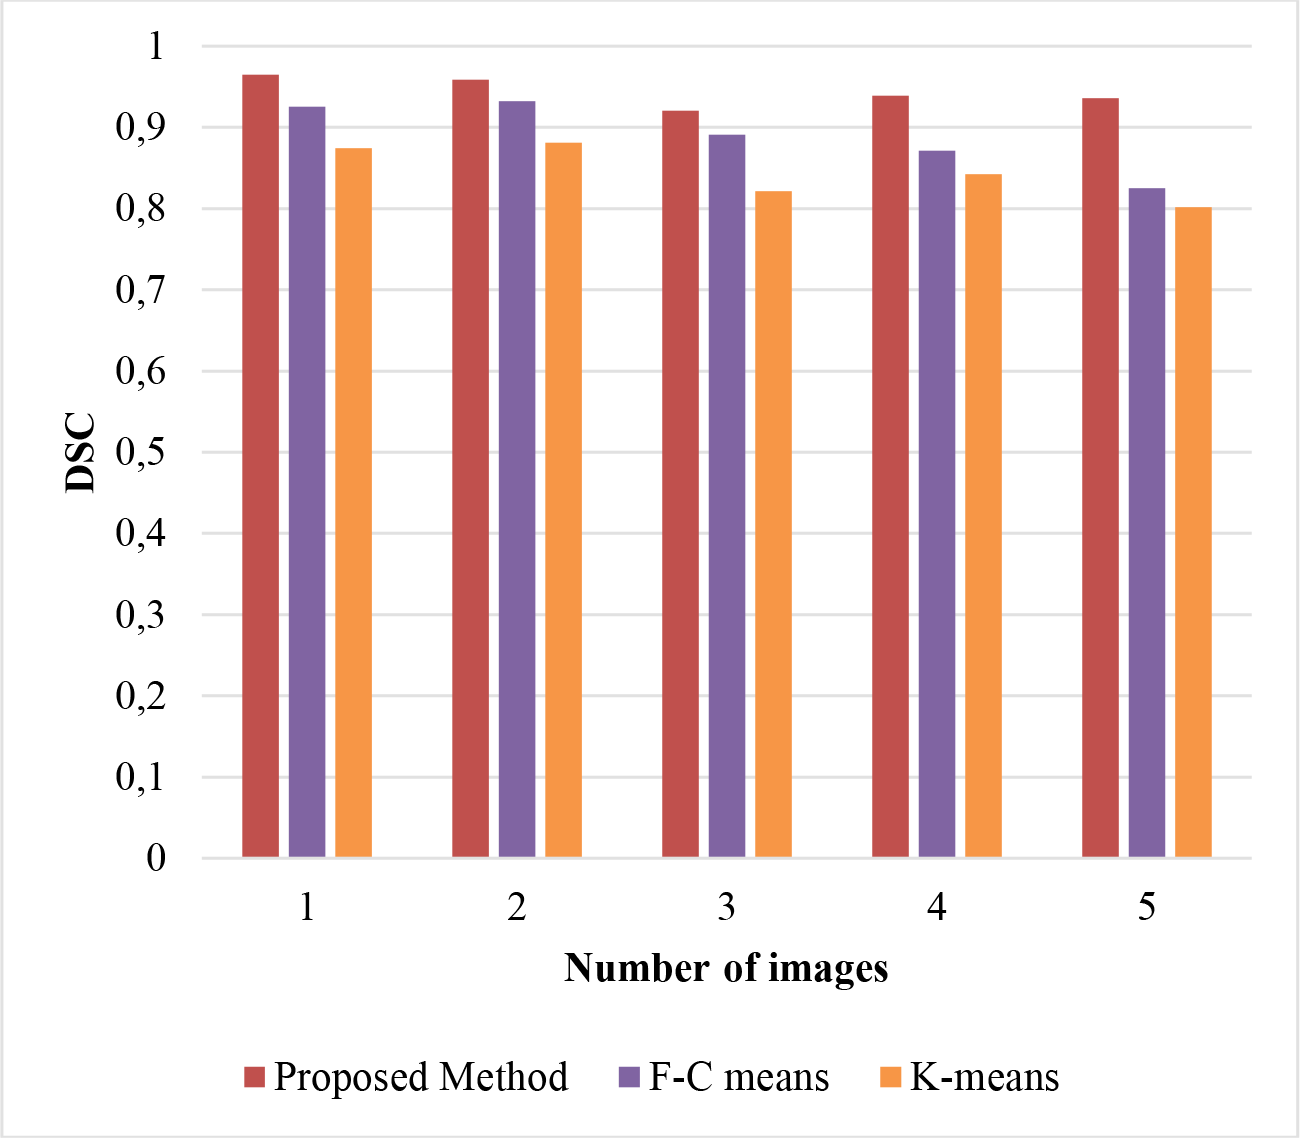
Figure 2-6 shows the input image, pre-processing image, segmented image, and tumour outline images. By comparing similarity measures from DSC and JDC, the suggested approach is verified. Figure 7 shows the DSC of the suggested technique. The proposed approach achieves the DSC similarity score of 0.95% from Figure 7. The results of the traditional F-C mean and K means clustering techniques are 0.85 and 0.82, respectively. According to the comparison study, the suggested approach has a high similarity value.
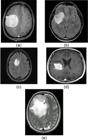
MRI Input Images (a) Image 1, (b) Image 2, (c) Image 3, (d) Image 4, (e) Image 5 and (f) Image 6
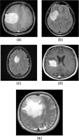
Pre-Processed Images(a) Image 1, (b) Image 2, (c) Image 3, (d) Image 4, (e) Image 5 and (f) Image 6
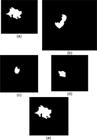
Segmented Images (a) Image 1, (b) Image 2, (c) Image 3, (d) Image 4, (e) Image 5 and (f) Image 6
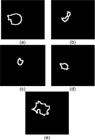
Images Outlines with Tumours (a) Image 1, (b) Image 2, (c) Image 3, (d) Image 4, (e) Image 5 and (f) Image 6
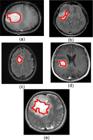
Tumors Outlining in Images (a) Image 1, (b) Image 2, (c) Image 3, (d) Image 4, (e) Image 5 and (f) Image 6
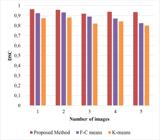
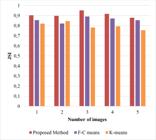
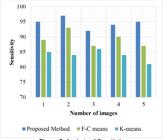
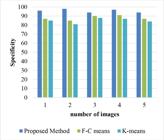
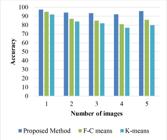
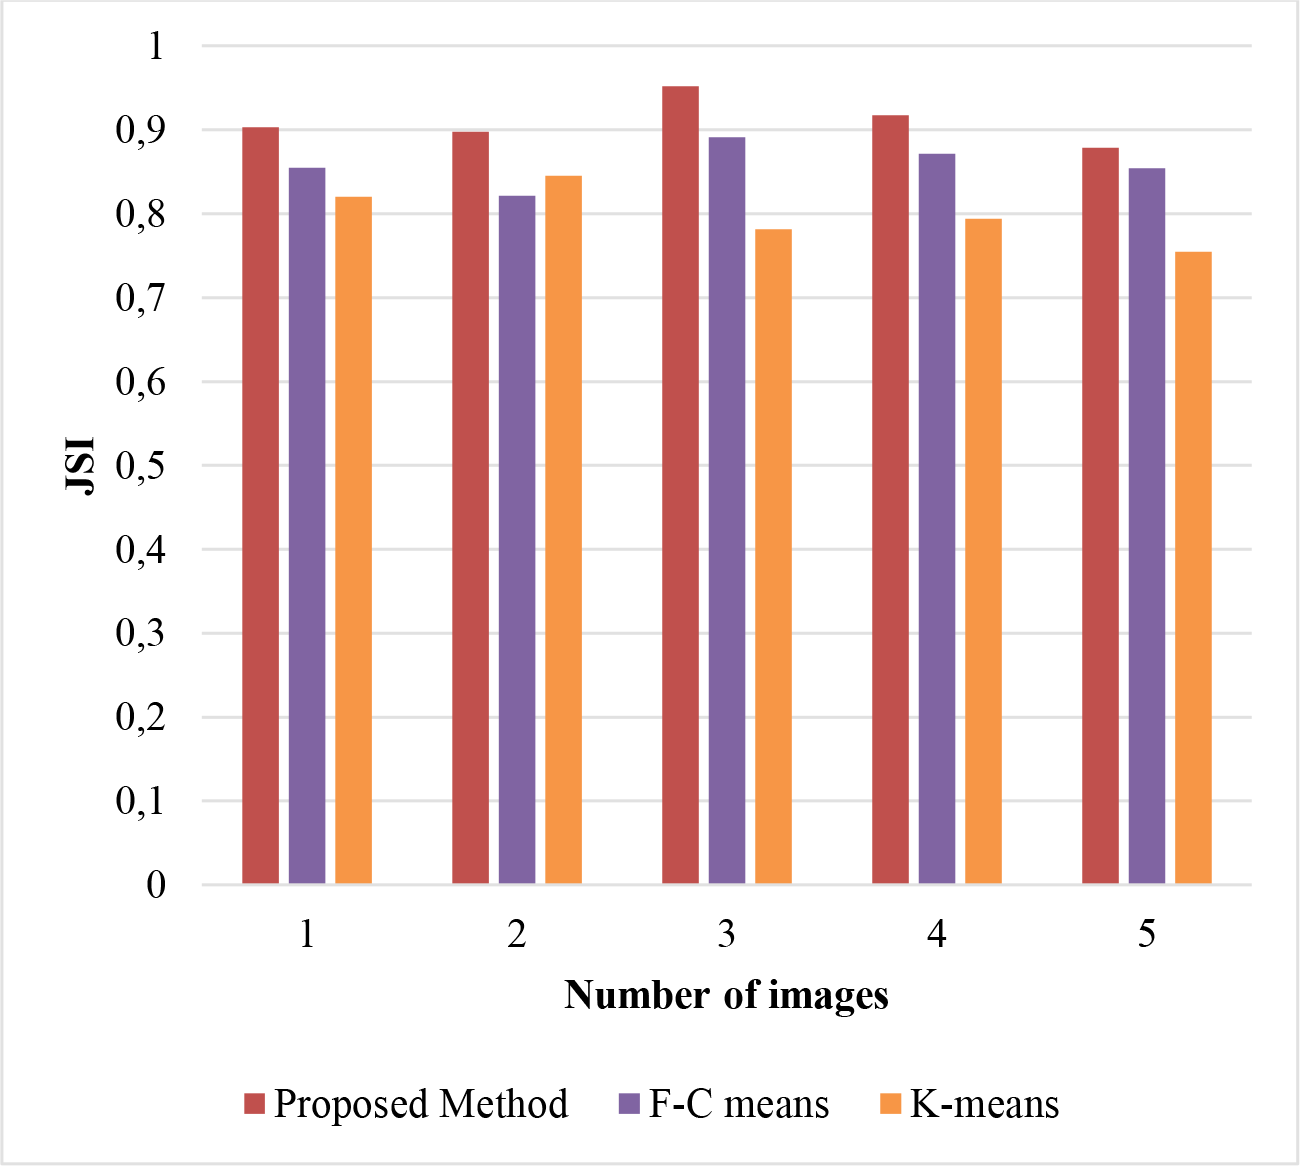
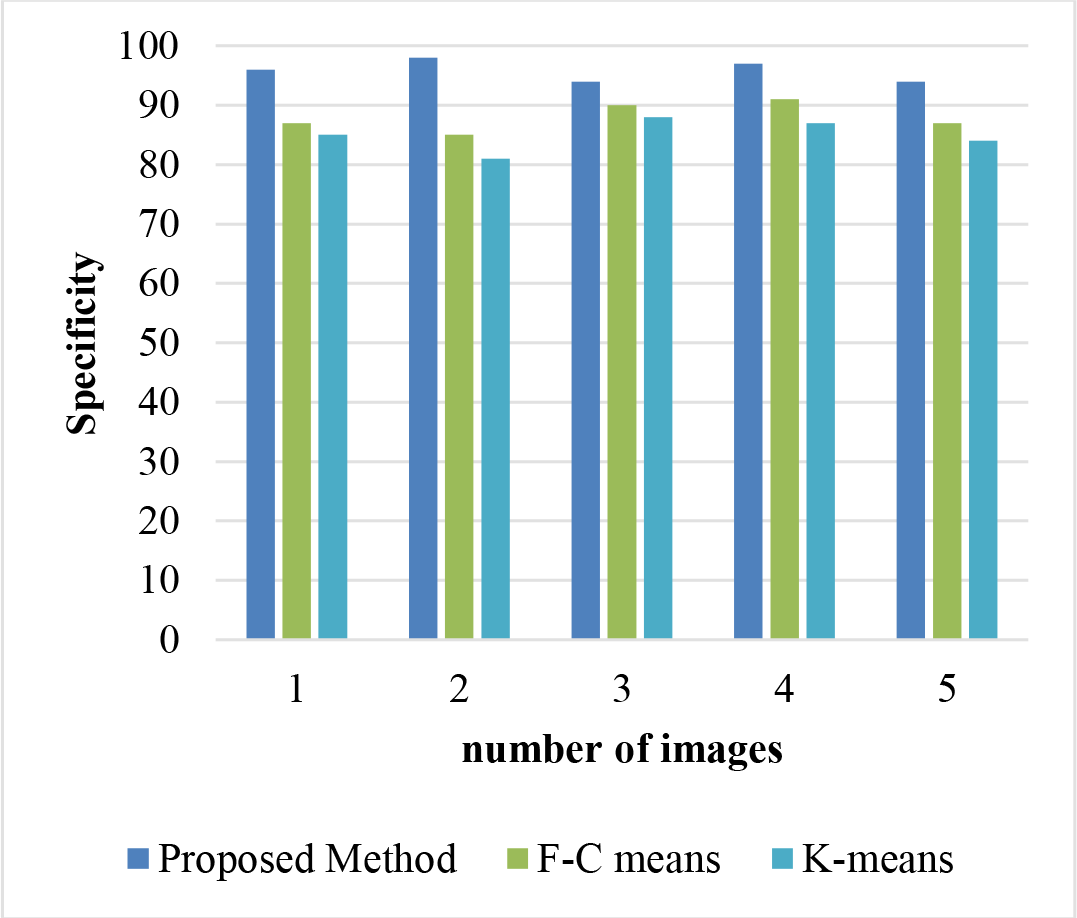
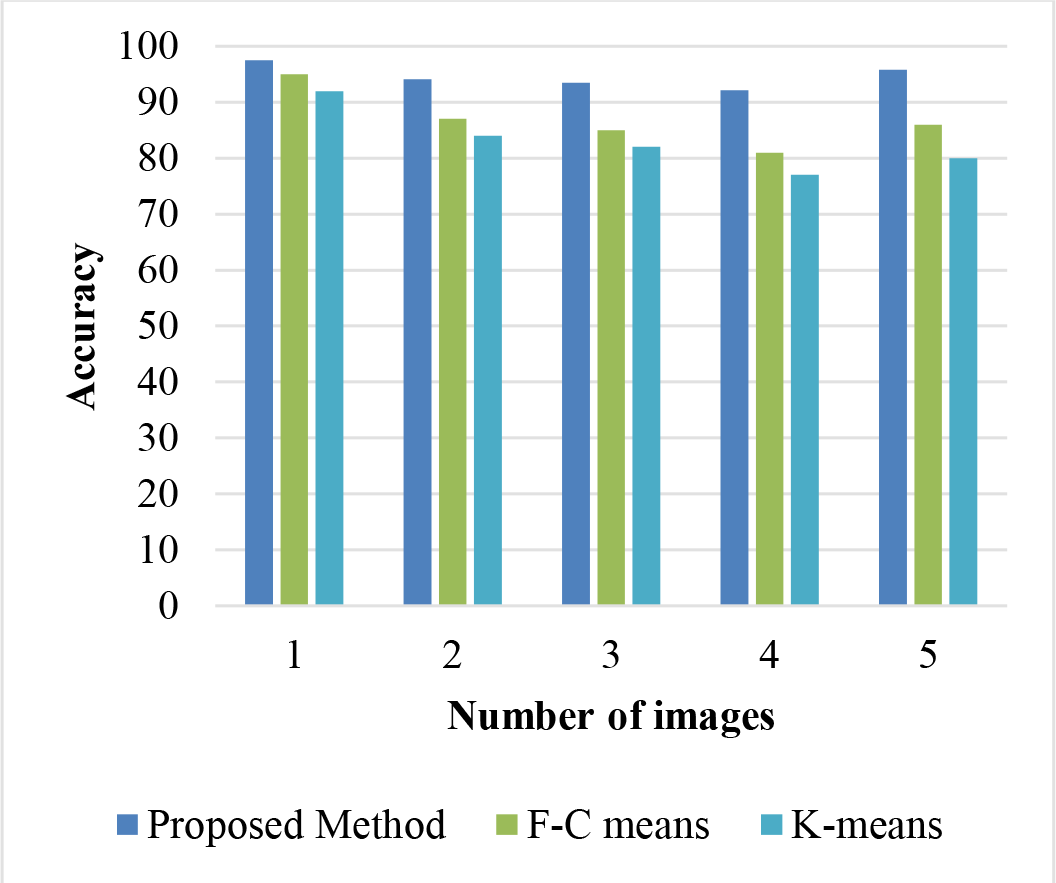
Figure 8 shows the JSI of the suggested technique. The proposed technique achieves the 0.97% JSI similarity score based on Figure 8. Clustering results using the traditional approaches of F-C mean and K means are 0.87 and 0.89, respectively. According to the comparison study, the suggested approach has a high similarity value. Figure 9 provides an illustration of the suggested methodology's sensitivity. The proposed approach achieves the 0.98% sensitivity in Figure 9. The 0.89 and 0.78 results for the traditional F-C mean and K means clustering approaches, respectively. The suggested technique has obtained high sensitivity, according to the comparative analysis. Figure 10 provides an illustration of the suggested methodology's specificity. According to Figure 9, the suggested approach achieves a specificity of 0.97%. The 0.79 and 0.75 success rates for the traditional F-C mean and K means clustering approaches, respectively. The suggested technique has obtained good specificity, according to the comparison analysis. Figure 11 provides an illustration of the suggested methodology's correctness. The proposed approach has a 0.96% accuracy according to Figure 11. The 0.89 and 0.85 success rates for the traditional F-C mean and K means clustering approaches, respectively. According to the comparative study, the proposed technique has produced very accurate results.
CONCLUSION
This research presented a complete framework for brain tumour segmentation, COA-T2FCM, which combines the Chimp Optimization Algorithm (COA) with Type-2 Intuitionistic Fuzzy C-Means (T2IFCM) clustering. It was shown that the proposed methodology overcomes significant problems in medical image segmentation, including noise, intensity inhomogeneity, and overlapping tissues, by using an oppositional perturbation based adaptive parameter mechanism. The COA algorithm was shown to be very useful in enhancing the global search, while the T2IFCM framework was helpful in the better representation of uncertainty and hesitance in the classification of MRI pixels. Both of these together have better convergence and significantly accurate segmentation. The method was empirically evaluated using publicly available MRI datasets and was validated by achieving the reported performance, securing a Dice coefficient of 0.95 together with 96% accuracy, 98% sensitivity, and 97% specificity. COA-T2FCM is shown to be significantly better than traditional segmentation techniques based on fuzzy c-means and k-means clustering; these results were consistent for all major evaluation metrics. The framework outlined above has considerable promise for incorporation into clinical systems, assisting radiologists with the rapid and accurate delineation of brain tumours. Furthermore, the application of intuitionistic fuzzy logic makes the system MRI scan noise and intensity variation, which are often encountered in practical MRI scans, more tolerant. The application of this framework in other imaging modalities, like CT or PET scans, may enhance its versatility. Also, developing deep learning-based refinement modules and cloud-based strategies for on-the-spot, large scale radiological diagnostics will be addressed in the future.
-
Funding:
No funding
Data Availability Statement:
Research data are not Available
REFERENCES
-
1 Prastawa M, Bullitt E, Ho S, Gerig G. A brain tumor segmentation framework based on outlier detection. Med Image Anal. 2004;8(3):275-83. https://doi.org/10.1016/j.media.2004.06.003
» https://doi.org/10.1016/j.media.2004.06.003 -
2 Soltaninejad M, Yang G, Lambrou T, Allinson N, Jones TL, Barrick TR, et al. Supervised learning-based multimodal MRI brain tumour segmentation using texture features from supervoxels. Comput Methods Programs Biomed. 2018;157:69-84. https://doi.org/10.1016/j.cmpb.2018.01.016
» https://doi.org/10.1016/j.cmpb.2018.01.016 -
3 Kermi A, Andjouh K, Zidane F. Fully automated brain tumour segmentation system in 3D-MRI using symmetry analysis of brain and level sets. IET Image Process. 2018;12(11):1964-71. https://doi.org/10.1049/iet-ipr.2018.5185
» https://doi.org/10.1049/iet-ipr.2018.5185 -
4 Angulakshmi M, Lakshmi Priya GG. Brain tumour segmentation from MRI using superpixels based spectral clustering. J King Saud Univ Comput Inf Sci. 2018. https://doi.org/10.1016/j.jksuci.2018.03.001
» https://doi.org/10.1016/j.jksuci.2018.03.001 -
5 Rehman ZU, Naqvi SS, Khan TM, Rehman AU, Rehman IU, Choi KN. Fully automated multi-parametric brain tumour segmentation using superpixel-based classification. Expert Syst Appl. 2019;118:598-613. https://doi.org/10.1016/j.eswa.2018.09.053
» https://doi.org/10.1016/j.eswa.2018.09.053 -
6 Bonte S, Goethals I, Van Holen R. Machine learning-based brain tumour segmentation on limited data using local texture and abnormality. Comput Biol Med. 2018;98:39-47. https://doi.org/10.1016/j.compbiomed.2018.05.018
» https://doi.org/10.1016/j.compbiomed.2018.05.018 -
7 Chen G, Li Q, Shi F, Rekik I, Pan Z. RFDCR: Automated brain lesion segmentation using cascaded random forests with dense conditional random fields. NeuroImage. 2020;211:116620. https://doi.org/10.1016/j.neuroimage.2020.116620
» https://doi.org/10.1016/j.neuroimage.2020.116620 -
8 Alagarsamy P, Sridharan B, Kalimuthu VK. A convolutional deep neural network based brain tumor diagnoses using clustered image and feature-supported classifier (CIFC) technique. Braz Arch Biol Technol. 2023;66:e23230012. https://doi.org/10.1590/1678-4324-2023230012
» https://doi.org/10.1590/1678-4324-2023230012 -
9 Pinto A, Pereira S, Rasteiro D, Silva CA. Hierarchical brain tumour segmentation using extremely randomized trees. Pattern Recognit. 2018;82:105-17. https://doi.org/10.1016/j.patcog.2018.04.004
» https://doi.org/10.1016/j.patcog.2018.04.004 -
10 Fidon L, Li W, Garcia-Peraza-Herrera LC, Ekanayake J, Kitchen N, Ourselin S, Vercauteren T. Scalable multimodal convolutional networks for brain tumour segmentation. In: International Conference on Medical Image Computing and Computer-Assisted Intervention. Cham: Springer; 2017. p. 285-93. https://doi.org/10.1007/978-3-319-66179-7_33
» https://doi.org/10.1007/978-3-319-66179-7_33 -
11 Sriramakrishnan P, Kalaiselvi T, Rajeswaran R. Modified local ternary patterns technique for brain tumour segmentation and volume estimation from MRI multi-sequence scans with GPU CUDA machine. Biocybern Biomed Eng. 2019;39(2):470-87. https://doi.org/10.1016/j.bbe.2019.01.002
» https://doi.org/10.1016/j.bbe.2019.01.002 -
12 Tong J, Zhao Y, Zhang P, Chen L, Jiang L. MRI brain tumor segmentation based on texture features and kernel sparse coding. Biomed Signal Process Control. 2019;47:387-92. https://doi.org/10.1016/j.bspc.2018.09.024
» https://doi.org/10.1016/j.bspc.2018.09.024 -
13 Arunkumar N, Mohammed MA, Mostafa SA, Ibrahim DA, Rodrigues JJ, Albuquerque VHC. Fully automatic model-based segmentation and classification approach for MRI brain tumor using artificial neural networks. Concurr Comput Pract Exp. 2020;32(1):e4962. https://doi.org/10.1002/cpe.4962
» https://doi.org/10.1002/cpe.4962 -
14 Abdullah S, Jebur B, Chambers J. LBTS-Net: A fast and accurate CNN model for brain tumour segmentation. Healthc Technol Lett. 2020. https://doi.org/10.1049/htl.2019.0102
» https://doi.org/10.1049/htl.2019.0102 -
15 Alagarsamy P, Kalimuthu VK, Sridharan B. Detection and segmentation of glioma tumors using an improved visual geometry group (IVGG) deep learning structure. Braz Arch Biol Technol. 2025;68:e25240120. https://doi.org/10.1590/1678-4324-2025240120
» https://doi.org/10.1590/1678-4324-2025240120 -
16 Radha R, Gopalakrishnan R. A medical analytical system using intelligent fuzzy level set brain image segmentation based on improved quantum particle swarm optimization. Microprocess Microsyst. 2020;79:103283. https://doi.org/10.1016/j.micpro.2020.103283
» https://doi.org/10.1016/j.micpro.2020.103283 -
17 Mano A, Anand S. Method of multi-region tumour segmentation in brain MRI images using grid-based segmentation and weighted bee swarm optimization. IET Image Process. 2020;14(12):2901-10. https://doi.org/10.1049/iet-ipr.2020.0557
» https://doi.org/10.1049/iet-ipr.2020.0557 -
18 Ali M, Gilani SO, Waris A, Jamil M, Khan MA, Shad SA, et al. Brain tumour image segmentation using deep networks. IEEE Access. 2020;8:153589-98. https://doi.org/10.1109/ACCESS.2020.3017626
» https://doi.org/10.1109/ACCESS.2020.3017626 -
19 Mehrotra R, Ansari MA, Agrawal R, Anand RS. A transfer learning approach for AI-based classification of brain tumors. Mach Learn Appl. 2020;2:100003. https://doi.org/10.1016/j.mlwa.2020.100003
» https://doi.org/10.1016/j.mlwa.2020.100003 -
20 Park JE, Ham S, Kim HS, Kim N, Goh MJ, Kim SJ. Diffusion and perfusion MRI radiomics obtained from deep learning segmentation provides reproducible and comparable diagnostic model to human in post-treatment glioblastoma. Eur Radiol. 2020. https://doi.org/10.1007/s00330-020-07186-2
» https://doi.org/10.1007/s00330-020-07186-2 -
21 Díaz-Pernas FJ, Martínez-Zarzuela M, Antón-Rodríguez M, González-Ortega D. A deep learning approach for brain tumor classification and segmentation using a multiscale convolutional neural network. Healthcare (Basel). 2021;9(2):153. https://doi.org/10.3390/healthcare9020153
» https://doi.org/10.3390/healthcare9020153 -
22 Alagarsamy P, Sridharan B, Kalimuthu VK. A deep learning based glioma tumour detection using efficient visual geometry group convolutional neural networks architecture. Braz Arch Biol Technol. 2024;67:e24230705. https://doi.org/10.1590/1678-4324-2024230705
» https://doi.org/10.1590/1678-4324-2024230705 -
23 Kaur M, Kaur R, Singh N, Dhiman G. SChoA: A newly fusion of sine and cosine with chimp optimization algorithm for HLS of datapaths in digital filters and engineering applications. Eng Comput. 2021. https://doi.org/10.1007/s00366-021-01332-2
» https://doi.org/10.1007/s00366-021-01332-2 -
24 Saeedi S, Rezayi S, Keshavarz H, Niakan Kalhori SR. MRI-based brain tumor detection using convolutional deep learning methods and chosen machine learning techniques. BMC Med Inform Decis Mak. 2023;23(1):6. https://doi.org/10.1186/s12911-022-02080-y
» https://doi.org/10.1186/s12911-022-02080-y
-
Editor-in-Chief:
Alexandre Rasi Aoki
-
Associate Editor:
Alexandre Rasi Aoki