 Factors Affecting the Capacity of Millennial Farmers to Maintaining Business Existence in the Agricultural Sector, East Java Indonesian
Abstract
Millennial farmers are the main actors in Indonesia's future agricultural development. Therefore, these millennial farmers need to increase their capacity to survive in doing agriculture business. This study aims to describe the characteristics of millennial farmers; describe the capacity level of millennial farmers in maintaining their existence in the agriculture business; analyse factors that influence the capacity of millennial farmers in maintaining the existence in the agriculture business; and developing a Millennial Farmer Capacity Building model. The method used is the sector research method. The study results show that millennial farmers can identify opportunities in farming. They could be more vital to access quality assurance, such as certification of agricultural products to increase the added value and competitiveness. Factors significantly affecting millennial farmers' capacity are the sociocultural environment, support from private institutions, and personal characteristics. The capacity of millennial farmers also substantially affects the existence of their businesses in agriculture. The role of extension agents only significantly influences the presence of millennial farmer businesses. The capacity of millennial farmers to maintain the existence of businesses in the agricultural sector can be increased through the sociocultural environment, support from private institutions, and personal characteristics.
Keywords:
Capacity Building; Millennial Farmers; Farm Business
Resumo
Os agricultores milenares são os principais atores no futuro desenvolvimento agrícola da Indonésia. Portanto, esses agricultores milenares precisam aumentar sua capacidade de sobreviver fazendo negócios agrícolas. Este estudo visa descrever as características dos agricultores milenares; descrever o nível de capacidade dos agricultores milenares em manter sua existência no negócio agrícola; analisar os fatores que influenciam a capacidade dos agricultores milenares em manter a existência no agronegócio; e desenvolvimento de um modelo de Capacitação do Agricultor da Geração Y. O método utilizado é o método de pesquisa setorial. Os resultados do estudo mostram que os agricultores milenares têm a capacidade de identificar oportunidades na agricultura. Eles podem ser mais vitais para acessar a garantia de qualidade, como a certificação de produtos agrícolas para aumentar o valor agregado e a competitividade. Os fatores que afetam significativamente a capacidade dos agricultores milenares são o ambiente sociocultural, o apoio de instituições privadas e as características pessoais. A capacidade dos agricultores milenares também afeta substancialmente a existência de seus negócios na agricultura. O papel dos agentes de extensão influencia significativamente apenas a presença de negócios agrícolas milenares. A capacidade dos agricultores milenares de manter a existência de negócios no setor agrícola pode ser aumentada por meio do ambiente sociocultural, do apoio de instituições privadas e das características pessoais.
Palavras-chave:
Capacitação; Agricultores Millennials; Negócios Agrícolas
1 Introduction
Currently, agricultural development in Indonesia has entered an era of modernization. The development of information technology which is increasingly expanding to remote areas, is a challenge that must be addressed positively. In the modernization of information technology, there are conditions of social change, namely the declining interest of the younger generation to work in agriculture. They prefer to try or work in other sectors such as tourism, trade, industry, or other businesses outside the agricultural sector. Based on Indonesian National Central Bureau of Statistics (BPS) data for East Java Province (Indonesian National Centre Bureau of Statistic 2019), the number of workers working in the agricultural sector has decreased by 2.69% from 2018 and continues to decline in 2020. This decrease is due to a crisis of farmer regeneration from old farmers to the younger generation (Ruswendi et al. 2020).
The crisis of regeneration of young farmers and the dominance of old farmers has consequences for the development of the agricultural sector, especially in agricultural productivity, market competitiveness, and rural economic capacity. It will ultimately threaten food security and the sustainability of the agrarian sector (Rachmawati & Gunawan 2020). The low number of young farmers is seen as a problem because of the loss of potential to create efficient, competitive, innovative, more profitable, and sustainable farming (May et al. 2019; Zagata & Sutherland 2015). Young farmers are often more motivated to develop their farms than older farmers. Young farmers are more open to new ideas, dare to take risks, and are more agile in accessing capital (Hamilton, Bosworth & Ruto 2015).
Barriers to entering the agricultural sector led to a decrease in young farmers, including high land prices, difficulty accessing credit for capital assistance, and a lack of policy support (Katchova & Ahearn 2016). Young farmers' perceptions of agriculture have also led to a decrease in young farmers. (Hounsome et al. 2012) reported that a career in agriculture is not considered attractive because it involves heavy physical work, unstable economic conditions, and weather uncertainty. The declining number of farmers from year to year and the notion that agriculture is dirty and economically unpromising according to millennials needs to be anticipated immediately to maintain the existence of farmers and the progress of Indonesian agriculture (Rachmawati & Gunawan, 2020).
Most of the youth have a negative perception of agriculture. Many youths choose not to get involved in agriculture, believing that agricultural production is not profitable enough or generates quick income compared to non-agrarian businesses. They also seek better opportunities in urban areas, ignoring agriculture (Martinson, Yuansheng & Monica 2019). Some factors contributing to the lack of youth interest in agriculture include deskilling or the lack of agricultural knowledge and skills being taught to rural youth, the declining status of agriculture as a profession, and the lack of government attention to small-scale farming and rural infrastructure. In addition, rural youth often experience difficulties in accessing land for gardening or farming, even if they are interested in becoming farmers (White 2012). There are various perceptions of youth toward agriculture. However, some narratives reflect negative perceptions and a lack of interest in agriculture. There is a stigma against this sector, such as high-risk work with little reward and that agriculture is considered uncool. However, a positive perception of and interest in a career in the agricultural sector exists. Some youth see a productive future in farming (Metelerkamp, Drimie & Biggs 2019).
However, the opportunities for the younger generation's involvement in the agricultural sector are significant, considering that Indonesia has experienced a demographic bonus since 2015. The demographic dividend is characterized by the dominance of the productive age population compared to the non-productive age population. Moreover, the abundant age population is also dominated by millennials, who are starting to get more involved in marketing agricultural products (Yofa, Syahyuti & Adawiyah 2020).
Currently, many young people are participating in the agricultural sector, and this group is known as Millennial Farmers. Millennial farmers are critical because they are the future and the main actors in advancing Indonesia's agricultural development today and in the future. These millennial farmers need to be facilitated so that their capacity increases and continues to exist and can motivate more young people to join the agricultural sector.
Therefore, this study aims to examine what factors influence the strengthening of the capacity of millennial farmers to maintain the existence of the agricultural sector in East Java. After knowing the factors that influence the strengthening of millennial farmers' capacity to maintain the agricultural sector's existence, it is hoped that the results of this research can be used as material for consideration in making decisions to regenerate farmers.
2 Research Methods
This study describes the characteristics of millennial farmers in East Java Province, the capacity level, and the factors that affect the capacity of millennial farmers to maintain business in the agricultural sector with the output model of capacity building for millennial farmers. This research is quantitative and uses a survey research method. Survey designs can be used for descriptive, explanatory, and exploratory purposes. Survey research quantitatively describes the tendencies of attitudes or opinions of a particular population (Silalahi 2015).
This research was conducted in August - September 2022 in East Java Province. East Java Province recorded a significant growth in young farmers, reaching 40.42 ℅. This figure exceeds the percentage of millennial farmers nationally, which is only 29%. The population of this study is millennial farmers in East Java Province. The total population of millennial farmers (members of the Millennial Farmer Ambassadors by the Ministry of Agriculture) in East Java Province is 190 person (Decree of the Minister of Agriculture No. 434/KPTS/SM.020/M/8/2021). The number of samples in this study was 65 person, determined by the Random Sampling Technique using the Slovin formula. Data collection techniques used are questionnaires, semi-structured interviews, and literature studies.
The variables in this study are the dependent variables (personal characteristics, digitization of farming, government business support, support from private institutions, the cultural environment, and the role of extension workers), while the independent variables (capacity of millennial farmers and the existence of businesses in agriculture).
The data analysis used in this study is Structural Equation Modeling (SEM). It is an appropriate analytical tool for simultaneously testing multiple exogenous and endogenous variables with many indicators. Among the most widely known Structural Equation Modeling (SEM) techniques are Covariance-Based SEM, represented by AMOS, EQS, LISREL, and Mplus software. However, for social science researchers, the CB-SEM procedure requires many complex requirements. As an alternative, generalized structured component analysis (GSCA) offers capabilities for researchers for SEM analysis. GSCA Is a 3rd generation Structural Equation Model analysis developed by Heungsun Hwang, Hec Montreal, and Yhoshio Takane in 2004. The aim is to replace factors with linear indicators (manifest variables) combinations in SEM analysis.
3 Results And Discussion
3.1 The Characteristics of Millennial Farmers
In this study, the primary data collected was in the form of distributing questionnaires to the research sample, namely 65 respondents. The respondent's data presented in this descriptive analysis is explained through a single table. Respondent data in this study is needed to determine the respondents' background, which can be used as input to describe the results obtained from the research. The identity of the research respondents includes age, formal education, and farming experience, which can be seen in Table 1 below.
Table 1 shows that based on age, respondents aged between 20-50 years. The average age of respondents is 32 years. Period reflects various experiences that have been lived to lead to success with a measure of competence, happiness, a healthy soul, and work. The middle age group still has the potential to develop themselves and develop farming. Therefore, the age suitable for self-development in running and managing businesses in agriculture in the current era is in the middle age range. It is also hoped that the work of these millennial farmers can attract more other young farmers to overcome the shortage of young workers in the agricultural sector because they can set an example of success in running a farming business (Haryanto, Effendy & Tri Yunandar 2021).
Based on the education level, most millennial farmers have a higher education level, which is above nine years (high school graduates and graduates), 96.6%. This result distinguishes it from farmers in general; millennial farmers possess a high education, so they have relatively good knowledge in managing to farm. The high formal education of millennial farmers can reduce concerns about the lack of response of farmers in dealing with market demands for farming products. These millennial farmers can think rationally and be broad-minded to produce and maintain the quality of their products. They can see market opportunities, try innovations that suit their needs, and be able to transmit them to their partner farmers.
Based on the length of time they have been farming, the average millennial farmer has more than seven years of farming experience. Most respondents are engaged in farming between 0-5 years (62.1%). Research (Haryanto, Effendy & Tri Yunandar 2021) states that the length of farming experience will impact how decisions are made to solve farming problems. The longer a millennial farmer has farming experience, the more experience millennials farmer have can be a consideration in decision-making and other valuable benefits for farming development.
3.2 Characteristics of Millennial Farmer
The attributes of millennial farmer respondents in East Java from the research results can be seen in Table 2.
Table 2 shows that the highest achievement is in the cosmopolitan indicator, which is 90.52%. At the same time, the lowest achievement on the learning experience indicator is equal to 74.35%. This result proves that millennial farmers, in maintaining their existence in farming, still have an open mindset and can accept differences.
3.3 Millennial Farmer Capacity in East Java
The capacity of millennial farmers in East Java from various indicators for achieving the percentage can be seen in Table 3.
Table 3 shows that the capacity of millennial farmers in East Java, based on indicators, has the highest percentage of achievement in identifying opportunities, namely 84.91%. At the same time, the lowest achievement rate is on the ability indicator to access quality assurance. So, to increase millennial farmers' capacity, it is necessary to increase the ability to access quality assurance. Local potentials and farmers' capacities must be optimally utilized while applying various appropriate innovations/technology according to the capabilities and needs of farmers. An approach that emphasizes the self-capacity of farmers and the capacity of the resources owned by farmers will ensure the continued adoption of innovations (agricultural technology) and can also increase the capacity of farmers to run farming. The capacity possessed by farmers to carry out agrarian business must constantly be improved and developed so that they can face global competition. The farmer's capacity is the power owned by the farmer personally to set the right farming goals and achieve the goals that have been placed in the right way. Every individual (person) naturally always has the capacity inherent in him. The ability of farmers to meet their needs following their potential is a farmer's capacity that cannot be ignored if the success of an agricultural business is to be sustainable.
3.4 The Existence of Millennial Farmers in East Java
Based on the research results, the existence of millennial farmers in East Java can be seen in Table 4.
Table 4 shows that the sustainability of millennial farmer businesses, from business development, development of production technology, management of agricultural products, management of farming, and marketing of farm products, has a reasonably high achievement, above 80%. This result proves that the sustainability/existence of millennial farmer businesses in East Java is excellent. Several factors influence the success of a business, including previous business experience, sources of capital, business networks, use of resources, and marketing (Eschker, Gold & Lane 2017). However, the business sustainability of these millennial farmers needs to be maintained and improved, one of which is increasing the capacity of millennial farmers. Capacity is a person's ability to manage a business and make the right decisions to achieve its goals. In contrast, the existence of a company is the continuity and presence of a business within a certain period. In the case of millennial farmers, capacity plays a vital role in determining the existence of their business. Millennial farmers with sound finance, marketing, and business management capacity will be better able to survive and develop their businesses. However, if they lack this capacity, they may find it challenging to manage and make the right business decisions, so their existence can be threatened. In short, capacity influences millennial farmer businesses by helping them manage their businesses and make the right business decisions to ensure their business continuity. Many farmers are poised to improve their productivity and competitiveness while also delivering social and environmental benefits. However, these farmers are faced with various limitations, including limited capital and human resources, as well as low commodity prices. Some of the factors affecting farmers' capacity include capital and human resources, commodity prices, education and training, and government policies and programs (Lockie & Higgins 2007).
3.5. Factors that Influence Millennial Farmer Capacity
3.5.1. Structural Equation Model
Structural equation model or Structural Equation Modeling (SEM) is an appropriate analytical tool for simultaneously testing multiple exogenous and endogenous variables with many indicators. Among the most widely known Structural Equation Modeling (SEM) techniques are Covariance-Based SEM, represented by AMOS, EQS, LISREL, and MPlus software. However, for social science researchers, the CB-SEM procedure requires many complex requirements. As an alternative, Generalized structured component analysis (GSCA) offers capabilities for researchers for SEM analysis. GSCA Is a 3rd generation Structural Equation Model analysis developed by Heungsun Hwang, Hec Montreal, and Yhoshio Takane in 2004. The aim is to replace factors with linear indicators (manifest variables) combinations in SEM analysis. This analytical approach uses the least squares method in the parameter estimation process. GSCA was developed to avoid the drawbacks of PLS (Partial Least Square), which is equipped with global optimization procedures, such as procedures in SEM, while also maintaining local optimization procedures (such as in PLS) to be decisive for theory confirmation. The GSCA method can also be applied to complex relationships between variables (can be recursive and reciprocal) involving higher-order components (factors) and multi-group comparisons.
(Tenenhaus 2008) said that GSCA is a new component-based SEM method, essential and can be used for calculating scores (not scales) and can also be applied to tiny samples. In addition, GSCA can be used in structural models involving variables with reflexive or formative indicators.
Singularity and multicollinearity often become severe obstacles in structural model analysis using covariance-based SEM. (Hwang 2009) said that, in practice, GSCA allows for multicollinearity; that is, there is a strong correlation between exogenous variables. An adequately specified structural model (based on theory and research results) is better analyzed with covariance-based SEM (e.g., with AMOS or LISREL software). On the other hand, if the specified model is inaccurate (theoretical basis or research results do not yet exist), then component-based SEM analysis is better used and is more recommended. GSCA component-based SEM analysis is a better alternative than PLS, which has better recovery parameters (Hwang, Ho & Lee 2010). However, GSCA can also be applied to structural models whose theoretical basis is already strong, or in other words, as a confirmatory analysis method.
3.5.2. Outer Model (Measurement Model)
The measurement model has calculation results based on the GSCA program. The method used is Confirmatory Factor Analysis, whereby utilizing this tool, it will be known that the existing indicators can explain a construct. The purpose of the measurement model is to describe how well the indicators in this study can be used as instruments for measuring latent variables.
Evaluation of the validity of the measurement model can be done by looking at the results of the estimation of the factor loads. A variable is said to have good validity against the construct or latent variable if the t-value of the factor loading is greater than the critical value (≥ 1.96) and the standard factor load is ≥ 0.50. Meanwhile, evaluation of the reliability of the measurement model in GSCA can use Construct Reliability (CR ≥ 0.70) and Average Variance Extracted (AVE ≥ 0.50). The recapitulation of the results of the evaluation of validity and reliability can be seen in Table 5.
Bolded values in Table 5 shows the most representative key indicator in forming latent variables.
Based on Table 5, it can be seen that all loading factor values are ≥ 0.50 (Valid), except for indicator X1.3. Even though this indicator is partially invalid, OVERALL validity states that it can still be maintained because the extraction value forms a complete construct declared GOOD and DECENT, with an AVE value of 0.825 > 0.05 (VALID) so that the X1.3 indicator is still accommodated. On the other hand, all variables have an AVE value ≥ 0.50 (Valid), while the results of the reliability calculation show that all Composite Reliability (CR) values ≥ 0.70 (Reliable). Thus it can be concluded that all of these latent variables have excellent and proper indicators. Bolded values in Table 5 shows the most representative key indicator in forming latent variables.
In detail, to determine which hands are most dominant in contributing to exogenous latent constructs, they are explained as follows.
-
The most representative key indicator in forming a Personal Characteristics (X1) is X1.4 (Inovativnees) with the highest loading factor of 0.894, so if the policymakers want to improve the value of Personal Characteristics (X1), then recommendations statistically it is prioritizing improving scores on indicator X1.4 (Inovativnees).
-
The most representative key indicator in forming Digitizing Farming (X2) is X2.2 (Digitalization of Farming on Access to Technology), with the highest loading factor of 0.891. So that if policymakers want to improve the value of the Digitalization Farming Business (X2), then the recommendation is to prioritize improving the value of indicator X2.2 (Digitalization of Farming on access to technology).
-
The most representative key indicator in forming Government Institution Support (X3) is X3.3 (Post-harvest facility support), with the highest loading factor of 0.959. If policymakers want to improve the value of Government Institution Support (X3), they must prioritize improving indicator X3.3 (post-harvest facility support).
-
The most representative key indicator in forming Support for Private Institutions (X4) is X4.2 (Support for production facilities) with the highest loading factor of 0.979, so if the policymakers want to improve the value of Private Institutions Support ( X4). The recommendation statistically is to prioritize improving the value of indicator X4.2 (Production facilities support).
-
The most representative key indicator in forming a Sociocultural Environment (X5 is X5.2 (Business group environment), with the highest loading factor of 0.959. If the policymakers want to improve the Sociocultural Environment value (X5), then the recommendation statistically is to prioritize improving the value of indicator X5.2 (Business group environment).
-
The most representative key indicator in establishing the role of extension agents (X6) is X6.3 (assistance for post-harvest handling), with the highest loading factor of 0.976. If policymakers wish to improve the value of the role of extension agents (X6), then the recommendation statistically is to prioritize improving the value of indicator X6.3 (post-harvest handling assistance).
-
The most representative key indicator in forming the Capacity of Millennial Farmers (Y1) is Y1.4 (Capacity to maintain business continuity), with the highest loading factor of 0.883. If policymakers wish to improve the value of Millennial Farmer Capacity (Y1), then the recommendation is to prioritize improving the value of indicator Y1.4 (Capacity to maintain business continuity).
-
The most representative key indicator in establishing a Business Existence (Y2) is Y2.3 (Existence in developing production technology), with the highest loading factor of 0.975. If the policymakers want to improve the Business Existence value (Y2), then the recommendation statistically is to prioritize improving the value of indicator Y2.3 (Existence in developing production technology).
3.5.3. Structural Models
This section deals with evaluating the coefficients or parameters that indicate a causal relationship or the influence of one latent variable on another latent variable. A causal relationship is declared insignificant if the critical ratio (CR) is between -1.96 and 1.96, with a significance level of 0.05. With the help of the GSCA program application, the estimated value of the structural model's critical ratio is obtained. In summary, the results of calculating these coefficients are presented in Table 6 .
The personal characteristic variable (X1) has a positive influence on Millennial Farmer Capacity (Y1), meaning that the higher the individual characteristics (X1), the result will be an increase in the Millennial Farmer Capacity variable (Y1), where the Path coefficient obtained is 0.369 with a CR value of 2.321. Because the CR value is greater than the critical value (2.321 > 1.96), it means that the personal characteristics variable (X1) has a significant influence on the Millennial Farmer Capacity variable (Y1).
The variable Farming Digitization (X2) has a negative influence on Millennial Farmer Capacity (Y1), meaning that the higher the Farming Digitization (X2), the result will decrease the Millennial Farmer Capacity variable (Y1), where the Path coefficient obtained is -0.128 with a value CR of -0.81. Because the CR value is greater than the critical value (-0.81 > -1.96), the variable Farming Digitalization (X2) has a non-significant effect on the Millennial Farmer Capacity variable (Y1).
The Government Support variable (X3) positively influences Millennial Farmer Capacity (Y1). But it has a non-significant effect on the Millennial Farmer Capacity (Y1) because the Path coefficient obtained is 0.153 with a CR value of 1.417. (CR value is smaller than the critical value (1.417 <1.96)).
The variable Private Institution Support (X4) positively influences Millennial Farmer Capacity (Y1). The higher the Private Institution Support (X4), the increase in the Millennial Farmer Capacity variable (Y1), where the Path coefficient obtained is 0.374 with a CR value of 2.615. Because the CR value is greater than the critical value (2.615 > 1.96), the Private Institution Support variable (X4) has a significant influence on the Millennial Farmer Capacity variable (Y1).
The Sociocultural Environment variable (X5) has a positive influence on Millennial Farmer Capacity (Y1), meaning that the higher the Cultural Environment (X5), the result will be an increase in the Millennial Farmer Capacity variable (Y1), where the Path coefficient obtained is 0.463 with a CR value of 3.617. Because the CR value is greater than the critical value (3.617 > 1.96), the sociocultural Environment variable (X5) has a significant influence on the Millennial Farmer Capacity variable (Y1).
The Role of Extension Workers (X6) has a negative influence on the Capacity of Millennial Farmers (Y1), which means that the higher the Role of Extension Workers (X6), it will decrease the Capacity variable of Millennial Farmers (Y1). The Path coefficient obtained is -0.105 with a CR value of -0.673. Because the CR value is greater than the critical value (-0.673 > -1.96), the variable Role of Extension Workers (X6) has a non-significant effect on the variable Millennial Farmer Capacity (Y1).
The personal characteristics variable (X1) has a positive influence on the existence of businesses in agriculture (Y2), which means that the higher the individual characteristics (X1), the resulting increase in the existence of businesses in agriculture (Y2). The path coefficient value obtained is 0.242, with a CR value of 1.222. Because the CR value is smaller than the critical value (1.222 <1.96), the personal characteristics variable (X1) has a non-significant influence on the existence of businesses in agriculture (Y2).
Farming Digitization (X2) has a positive influence on the existence of businesses in the agricultural sector (Y2), meaning that the higher the Digitization of Farming Business (X2), the result will increase in the business existence variable in the agriculture sector (Y2), the Path coefficient obtained is 0.195 with a CR value of 1.121 because the CR value is less than the critical value (1.121 <1.96), So, Digitalization of Farming Variable (X2) has a non-significant effect on the Business Existence variable in Agriculture (Y2).
The Government Institution Support variable (X3) has a positive influence on the existence of businesses in the agricultural sector (Y2), meaning that the higher the support of Government Institutions (X3), the result will be increase in the existence of businesses in the agricultural sector (Y2), where the path coefficient obtained is 0.057 with a CR value of 0.594 because the CR value is smaller than the critical value (0.594 <1.96). The Government Institution Support variable (X3) has a non-significant influence on the existence of businesses in the agricultural sector (Y2).
Submission of the variable Private Institution Support (X4) has a positive influence on the existence of businesses in the agricultural sector (Y2), meaning that the higher the support of private institutions (X4), the result will be an increase in the existence of businesses in the agricultural sector (Y2), where the path coefficient obtained is 0.26 with a CR value of 1.806. Because the CR value is less than the critical value (1.806 <1.96), the statistical hypothesis states that H10 is rejected, meaning that the Private Institution Support variable (X4) has a non-significant influence on the existence of businesses in agriculture (Y2).
The Cultural Environment Award Variable (X5) has a negative influence on the existence of businesses in the agricultural sector (Y2), meaning that the higher the Cultural Environment (X5), the result will decrease in the existence of businesses in the agricultural sector (Y2), where the path coefficient obtained is -0.065 with a CR value of -0.361. Because the CR value is greater than the critical value (-0.361 > -1.96), the statistical hypothesis states that H11 is rejected, meaning that the Cultural Environment variable (X5) has a non-significant influence on the Business Existence variable in Agriculture (Y2).
The achievement variable for the role of extension workers (X6) has a negative influence on the existence of businesses in agriculture (Y2), meaning that the higher the role of extension workers (X6), the result will decrease in the variable existence of businesses in agriculture (Y2), where the path coefficient obtained is -0 .29 with a CR value of -2.437. Because the CR value is smaller than the critical value (-2.437 <-1.96), the statistical hypothesis states that H12 is accepted, meaning that the variable Role of Extension Workers (X6) has a significant influence on the variable Business Existence in Agriculture (Y2).
The Millennial Farmer Capacity variable (Y1) has a positive influence on the existence of businesses in the agriculture sector (Y2), meaning that the higher the Millennial Farmer Capacity (Y1), the result will be increasing in the existence of businesses in the agriculture sector (Y2). The path coefficient value obtained is 0.488, with a CR value of 2.958. Because the CR value is greater than the critical value (2.958 > 1.96), It can be concluded that the Millennial Farmer Capacity variable (Y1) has a significant influence on the existence of businesses in agriculture (Y2).
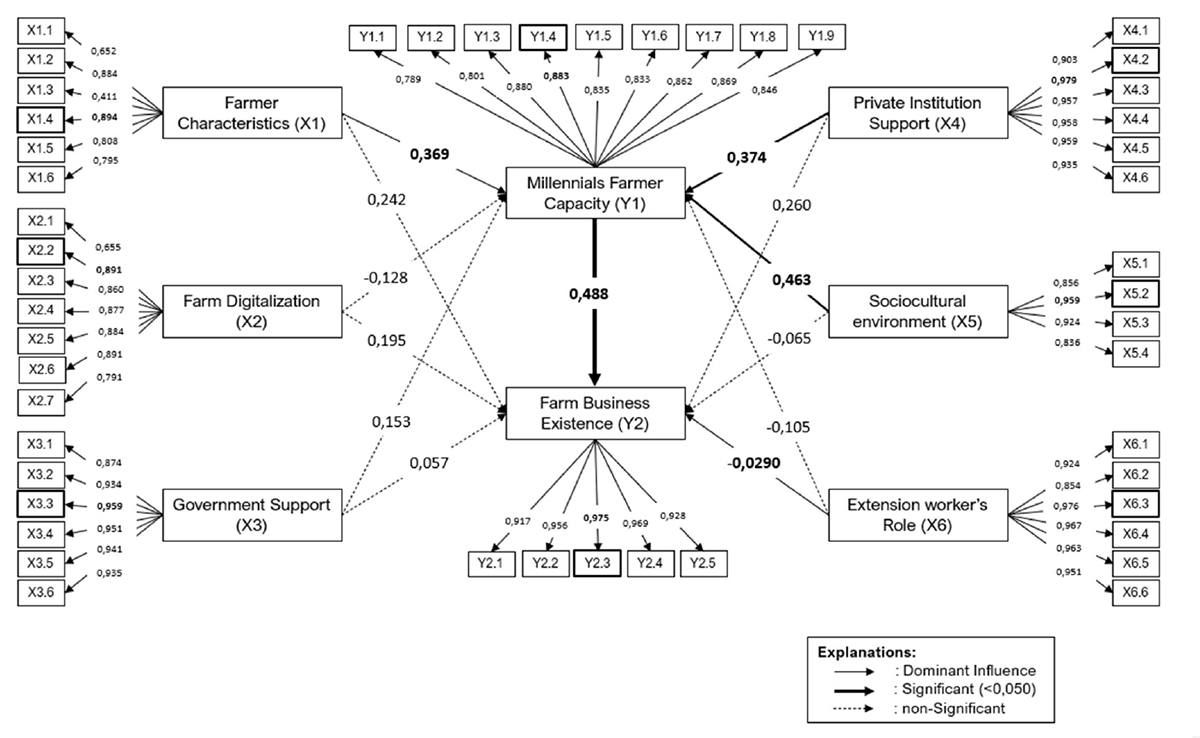
The path coefficients in the structural model and the weight factor values of the manifest variables in the measurement model can be illustrated through the following path diagrams of the measurement model and structural model (Figure 1).

Figure 1 shows the relationship between exogenous and endogenous latent constructs. From Figure 1, it can be seen that the Business Existence variable (Y2) is more dominantly influenced by the latent variable Millennial Farmer Capacity (Y1), with the highest influence value of 0.488. Whereas Millennial Farmer Capacity (Y1) turns out to be more dominantly influenced by the Sociocultural Environment variable (X5), where the indicator (manifest variable) that is the best in forming the Sociocultural Environment variable (X5) is X5.2 (Business group environment) with the loading factor the highest is 0.959, so that if the policymakers want to improve the value of the Sociocultural Environment (X5), then the recommendation statistically is to prioritize improving the value of indicator X5.2 (Environment of business groups).
After knowing the factors that have a significant and insignificant effect on endogenous variables in each sub-structure, then in the following Table 7, the results of the calculation of indirect effects between variables are presented.
Based on the Table 7 above, it is known that there is an indirect effect between latent variables. The indirect impact of the personal characteristics variable (X1) on the existence of businesses in agriculture (Y2) through Millennial Farmer Capacity (Y1) is 0.18 with a t-statistics of 1.826 (not significant). The indirect effect of the variable Farming Digitization (X2) on the existence of businesses in Agriculture (Y2) through Millennial Farmer Capacity (Y1) is -0.062 with t-statistics of 0.781 (Not Significant). The indirect effect of the Government Institution Support variable (X3) on the existence of businesses in agriculture (Y2) through Millennial Farmer Capacity (Y1) is 0.075 with t-statistics of 1.278 (Not Significant). The indirect effect of the variable Private Institution Support (X4) on the existence of businesses in agriculture (Y2) through Millennial Farmer Capacity (Y1) is 0.183 with t-statistics of 1.959 (Not Significant). The indirect effect of the Cultural Environment variable (X5) on the existence of businesses in agriculture (Y2) through Millennial Farmer Capacity (Y1) is 0.226 with a t-statistic of 2.29 (Significant). The indirect effect of the variable Role of Extension Workers (X6) on the existence of businesses in agriculture (Y2) through Millennial Farmer Capacity (Y1) is -0.051 with t-statistics of 0.656 (Not Significant).
3.5.4. Goodness of Fit
This fit test is intended to evaluate the degree of fit or Goodness of Fit (GOF) between the data and the model. The structural equation does not have the best statistical test to explain the model's predictive power. Instead, several GOF or Goodness of Fit Indices (GOFI) measures can be used together or in combination. None of the GOF or GOFI measures can be used exclusively for evaluating the model's overall fit. The best guide in assessing model fit is sound substantive theory. If the model only shows or represents a substantive theory that is not strong, and even though the model has a perfect model fit, it is not easy to judge the model.
The overall fit test of the model relates to the analysis of the statistical GOF generated by the program, in this case, the GSCA. By using the guidelines for GOF measures and the results of the GOF statistics, an analysis of the overall fit of the model can be carried out as follows (Table 8).
FIT = 0,702
FIT shows the total variance of all variables a particular model can explain. FIT values range from 0 to 1. So, the model formed can explain all the variables that are 0.702. Exogenous variables that the model can explain are 70.2%, and other variables can explain the rest (29.8%). This model explains the phenomenon studied.
AFIT = 0,689
Adjusted from FIT is almost the same as FIT. However, because more than one exogenous variable affects endogenous variables, it would be better to interpret the model's accuracy using the corrected FIT or AFIT. Because the more variables that influence the FIT value will be even more significant because the proportion of diversity will also increase, we can use the corrected FIT to adjust to the existing variables. If seen from the AFIT value of 0.689, the model that the model can explain is 68.9%, and other variables can explain the rest (31.1%).
The Goodness of Fit Indices (GFI) = 0,964
The Goodness of Fit Indices (GFI) measures the model's accuracy in producing the observed covariance matrix. This GFI value must range from 0 to 1. Although, in theory, GFI may have a negative value, this should not happen because a model with a negative value is the worst. A GFI value greater than or equal to 0.9 (0.964 > 0.900) indicates the fit of a model (Diamantopaulus, 2000 at Ghozali, 2005).
SRMR (Standardized Root Mean Square Residual) = 0,088
Standardized RMR represents the average value of all standardized residuals and ranges from 0 to 1. A model that has a good fit will have a Standardized RMR value of less than 0.08.
The model proposed in this study has an SRMR value of 0.088; because the SRMR value is more significant than 0.08, it can be concluded that the model is declared a Marginal fit.
Based on the results of the model accuracy test above, it is known that three of the four criteria for Model Fit and Quality Indices are declared Good / Good fit / Ideal. Thus, it can be concluded that the results of synthesizing several theories combined to form a structural construct in the Path Diagram holistically (whole) can be validated / appropriate as new scientific findings or a Grand Theory that applies today.
3.6. Capacity Building of Millennial Farmers
Capacity can be interpreted as empowerment, which is something that enables farmers to survive and to be able to utilize economic and social resources optimally. Empowerment is also an accumulation of increased knowledge, experience, and behavior, while the environment is a stimulus (stimulus) in developing the self-ability of farmers. Capacity means changes in behavior in the form of (1) increasing individual abilities in knowledge, skills, and attitudes, (2) increasing institutional capabilities in organization and management, finance, and culture, (3) increasing the community's ability to be independent, self-sufficient, and anticipate change (Saleh & Suherman 2021). The ability of farmers to seek out new opportunities is an important one. Some farmers, especially those who are economically successful, adapt by seeking out new opportunities and capitalizing on product gaps. They also form producer groups or adapt their production methods to local natural conditions (Szumelda 2019). The main problems faced by young farmers are access to markets, financial issues, and difficulties in production. Some young farmers take advantage of support programs, while others do not, either because they do not know about the programs or because they feel the programs are not suitable for their needs (Phiboon, Cochetel & Faysse 2019). The diversity of characteristics among young farmers requires different approaches in their capacity-building efforts. Support programs need to be better at providing tailored solutions for the capacity building of young farmers.
Factors that significantly influence the capacity of millennial farmers in East Java are the sociocultural environment, support from private institutions, and personal characteristics so that the capacity of millennial farmers to maintain the existence of businesses in the agricultural sector can be increased through the support of the sociocultural environment, support from private institutions and growing learning experiences, cosmopolitan nature, altruism, innovativeness, ability to take risks and access information. While the digitalization of agriculture, support from the government and the role of agricultural extension workers do not significantly affect the capacity of millennial farmers. The results of this study differ from Kashina et al. (2022) where digitalization can increase a farmer's capacity, both in terms of increased production efficiency and professional skills development. Agricultural digitalization significantly impacts business existence, such as economic, environmental, social, and operational efficiency, and better business planning. The adoption of digitalization in agriculture can allow farmers to focus on aspects of their business, making better decision-making and increasing their competitiveness in the market (Kashina et al. 2022).
The capacity of young farmers can be improved in several ways: (1) Training: In addition to knowledge on agricultural production, support programs need to provide additional training in business management, market understanding, and sustainable farming practices; (2) Access to capital: Many young farmers face challenges in accessing the initial capital needed to start and run their farms. Therefore, support programs are needed to help them access loans or grant funds; (3) Support Networking: Helping young farmers network with other farmers and the wider community can help them socially and economically (Phiboon, Cochetel & Faysse 2019).
Some factors affecting farmers' business existence include: (1). Education and Training: Farmers with better agricultural education and training have a higher probability of success; (2). Resource Management: Resource management, such as land, water, and labor, is an essential factor in determining the sustainability of farming enterprises; (3). Technology and Innovation: Modern and innovative agricultural technologies can increase productivity and efficiency, affecting farming operations' sustainability; (4). Market Conditions: Market conditions for farm products, including demand and prices, also significantly influence farmers' success; (5). Policy Support: Government policies like subsidies and training programs can help farmers survive in a competitive market. (Phiboon, Cochetel & Faysse 2019; Unay-Gailhard & Bojnec, 2021).
The capacity of millennial farmers has a significant effect on the existence of businesses in agriculture. The role of extension workers has a significant impact on the existence of millennial farmer businesses. Extension agents are parties who can interact directly with millennial farmers in the field. The role of extension workers as facilitators, communicators, motivators, and consultants for farmers can increase the existence/sustainability of the business of millennial farmers. Capacity is an essential factor for maintaining the sustainability of farmers' businesses. This capacity includes farmers' ability to generate and implement farm innovations, adjust to changing climate or market conditions, and improve productivity and efficiency. Improving farmers' innovation capacity is an important part of the strategy to support farmer and agricultural business sustainability (Tambo & Wünscher 2018).
4 Conclusion
The conclusion of research on the capacity building of millennial farmers in maintaining the existence of the agricultural sector in East Java is that the capacity of millennial farmers has a capacity building in identifying opportunities in farming. Meanwhile, they are slightly weak in their capacity to access quality assurance, such as certification of agricultural products to increase the added value and competitiveness of agricultural products. Factors significantly affecting millennial farmers' capacity in East Java are the sociocultural environment, support from private institutions, and personal characteristics. The capacity of millennial farmers also substantially affects the existence of their businesses in agriculture. Meanwhile, extension workers' role significantly affects millennial farmer businesses' existence. The capacity of millennial farmers to maintain the existence of businesses in the agricultural sector can be increased through the sociocultural environment, support from private institutions, and the personal characteristics of millennial farmers. Meanwhile, extension workers can also increase their role in assisting millennial farmers.
5 Suggestions
Based on the results of the study, it is recommended to increase the capacity of young farmers to be more empowered in maintaining their business existence. The role of the government needs to be increased through the provision of education and training, as well as encouraging the role of extension workers.
References
-
Eschker, E., Gold, G. & Lane, M.D. 2017, 'Rural entrepreneurs: what are the best indicators of their success?', Journal of Small Business and Enterprise Development, vol. 24, no. 2, pp. 278-96, DOI:10.1108/JSBED-07-2016-0112.
» https://doi.org/10.1108/JSBED-07-2016-0112 -
Hamilton, W., Bosworth, G. & Ruto, E. 2015, ' Entrepreneurial Younger Farmers and the “Young Farmer Problem” in England', The Journal “Agriculture and Forestry”vol. 61, no. 4, pp. 61-9, DOI:10.17707/agricultforest.61.4.05.
» https://doi.org/10.17707/agricultforest.61.4.05 -
Haryanto, Y., Effendy, L. & Tri Yunandar, D. 2021, 'Karakteristik Petani Milenial pada Kawasan Sentra Padi di Jawa Barat', Journal Penyuluhan, vol. 18, no. 01, pp. 25-35, DOI:10.25015/18202236982.
» https://doi.org/10.25015/18202236982 -
Hounsome, B., Edwards, R.T., Hounsome, N. & Edwards-Jones, G. 2012, ' Psychological morbidity of farmers and non-farming population: Results from a uk survey', Community Mental Health Journal, vol. 48, no. 4, pp. 503-10, DOI:10.1007/s10597-011-9415-8.
» https://doi.org/10.1007/s10597-011-9415-8 -
Hwang, H. 2009, ' Regularized generalized structured component analysis', Psychometrika, vol. 70, no. 3, pp. 517-30, DOI:10.1007/s11336-009-9119-y.
» https://doi.org/10.1007/s11336-009-9119-y -
Hwang, H., Ho, M.R. & Lee, J. 2010, 'Generalized structured component analysis with latent interactions', Psychometrika, vol. 75, no. 2, pp. 228-42, DOI:10.1007/s11336-010-9157-5.
» https://doi.org/10.1007/s11336-010-9157-5 -
Indonesian National Centre Bureau of Statistic 2019, Provinsi Jawa Timur dalam Angka, JATIM, viewed 12 December 2022, <Indonesian National Centre Bureau of Statistic 2019, Provinsi Jawa Timur dalam Angka, JATIM, viewed 12 December 2022, https://jatim.bps.go.id/publication/2019/08/16/f668b9b7ca53a7998bc81453/provinsi-jawa-timur-dalam-angka-2019.html >.
» https://jatim.bps.go.id/publication/2019/08/16/f668b9b7ca53a7998bc81453/provinsi-jawa-timur-dalam-angka-2019.html -
Kashina, E., Yanovskaya, G., Fedotkina, E., Tesalovsky, A. & Vetrova, E. 2022, 'Impact of digital farming on sustainable development and planning in agriculture and increasing the competitiveness of the agricultural business', International Journal of Sustainable Development and Planning, vol. 17, no. 8, pp. 2413-20, DOI:10.18280/ijsdp.170808.
» https://doi.org/10.18280/ijsdp.170808 -
Katchova, A.L. & Ahearn, M.C. 2016, ' Dynamics of farmland ownership and leasing: Implications for young and beginning farmers', Applied Economic Perspectives and Policy, vol. 38, no. 2, pp. 334-50, DOI:10.1093/aepp/ppv024.
» https://doi.org/10.1093/aepp/ppv024 -
Lockie, S. & Higgins, V. 2007, 'Roll-out neoliberalism and hybrid practices of regulation in Australian agri-environmental governance', Journal of Rural Studies, vol. 23, no. 1, pp. 1-11, DOI:10.1016/j.jrurstud.2006.09.011.
» https://doi.org/10.1016/j.jrurstud.2006.09.011 -
Martinson, A.T., Yuansheng, J. & Monica, O.A. 2019, 'Determinants of agriculture participation among tertiary institution youths in Ghana', Journal of Agricultural Extension and Rural Development, vol. 11, no. 3, pp. 56-66, DOI:10.5897/jaerd2018.1011.
» https://doi.org/10.5897/jaerd2018.1011 -
May, D., Arancibia, S., Behrendt, K. & Adams, J. 2019, 'Preventing young farmers from leaving the farm: Investigating the effectiveness of the young farmer payment using a behavioural approach', Land Use Policy, vol. 82, pp. 317-27, DOI:10.1016/j.landusepol.2018.12.019.
» https://doi.org/10.1016/j.landusepol.2018.12.019 -
Metelerkamp, L., Drimie, S. & Biggs, R. 2019, 'We’re ready, the system’s not-youth perspectives on agricultural careers in South Africa', Agrekon, vol. 58, no. 2, pp. 154-79, DOI:10.1080/03031853.2018.1564680.
» https://doi.org/10.1080/03031853.2018.1564680 -
Phiboon, K., Cochetel, C. & Faysse, N. 2019, 'Support programmes and the diversity of young farmers in Thailand: A good match?', Outlook on Agriculture, vol. 48, no. 4, pp. 300-8, DOI:10.1177/0030727019880559.
» https://doi.org/10.1177/0030727019880559 -
Rachmawati, R.R. & Gunawan, E. 2020, 'Peranan Petani Milenial mendukung Ekspor Hasil Pertanian di Indonesia', Forum Penelitian Agro Ekonomi, vol. 38, no. 1, e67, DOI:10.21082/fae.v38n1.2020.67-87.
» https://doi.org/10.21082/fae.v38n1.2020.67-87 - Ruswendi, R., Sastro, Y., Ishak, A., & Hutapea, N. 2020, 'Kajian Karakteristik Petani Millenial di Provinsi Bengkulu', Buletin Agritek, vol. 1, no. 2, pp. 47-58.
-
Saleh, K. & Suherman, S. 2021, ' Model Capacity the Paddi Sawah of Farmers to Support Sustainable Food Security inTangerang District', Jurnal Penyuluhan, vol. 17, no. 1, pp. 41-51, DOI:10.25015/17202132887.
» https://doi.org/10.25015/17202132887 - Silalahi, U. 2015, Metode Penelitian Sosial Kuantitatif . PT. Refika Aditama.
-
Szumelda, A.U. 2019, ' Agriculture and everyday realities on small farms - An entrepreneurial challenge to farmers between the desire for autonomy and a secure existence. Two examples from east and south-east Poland', Journal of Rural Studies, vol. 67, pp. 57-68, DOI:10.1016/j.jrurstud.2019.02.008.
» https://doi.org/10.1016/j.jrurstud.2019.02.008 -
Tambo, J.A. & Wünscher, T. 2018, 'Building farmers’ capacity for innovation generation: Insights from rural Ghana', Renewable Agriculture and Food Systems, vol. 33, no. 2, pp. 116-30, DOI:10.1017/S1742170516000521.
» https://doi.org/10.1017/S1742170516000521 -
Tenenhaus, M. 2008, 'Component-based structural equation modelling', Total Quality Management and Business Excellence, vol. 19, no. 7-8, pp. 871-86, DOI:10.1080/14783360802159543.
» https://doi.org/10.1080/14783360802159543 -
Unay-Gailhard, İ. & Bojnec, Š. 2021, ' Gender and the environmental concerns of young farmers: Do young women farmers make a difference on family farms?', Journal of Rural Studies, vol. 88, pp. 71-82, DOI:10.1016/j.jrurstud.2021.09.027.
» https://doi.org/10.1016/j.jrurstud.2021.09.027 -
White, B. 2012, 'Agriculture and the Generation Problem: Rural Youth, Employment and The Future of Farming', IDS Bulletin, vol. 43, no. 6, DOI:10.1111/j.1759-5436.2012.00375.x.
» https://doi.org/10.1111/j.1759-5436.2012.00375.x - Yofa, R., Syahyuti,-. & Adawiyah, C. 2020, 'Peran Kaum Milenial di Sektor Pertanian pada Era Covid-19', Dampak Pandemi Covid-19: Perspektif Adaptasi Dan Resiliensi Sosial Ekonomi Pertanian, vol. 3, pp. 572-90.
-
Zagata, L. & Sutherland, L.A. 2015, 'Deconstructing the “young farmer problem in Europe”: Towards a research agenda', Journal of Rural Studies, vol. 38, no. 2015, pp. 39-51, DOI:10.1016/j.jrurstud.2015.01.003.
» https://doi.org/10.1016/j.jrurstud.2015.01.003
All data included in this study are publicly available in the literature.