 Effects of thyroid-stimulating hormone and sensitivity to thyroid hormones on the risk of hyperuricemia in euthyroid adults
Abstract
Objective: The current study was conducted to investigate whether thyroid-stimulating hormone (TSH) and thyroid hormone sensitivity are associated with hyperuricemia probability in euthyroid population.
Materials and methods: The observational analysis was based on a Chinese community-based cohort (n = 1,972). The prospective associations of TSH levels, TSH index (TSHI), thyrotrophic thyroxine resistance index (TT4RI), thyroid feedback quantile-based index (TFQI) and free triiodothyronine to free thyroxine (FT3/FT4) ratio with the risk of hyperuricemia were examined. Two-sample Mendelian randomization (MR) analysis was then used to test the causal effects of TSH on serum uric acid (SUA) levels and gout.
Results: Among 1,972 participants with normal thyroid function, 244 new hyperuricemia cases were identified during follow-up. The results suggested that the higher levels of TSH (HR = 1.87, 95% CI: 1.28-2.73, p-value < 0.01), TSHI (HR = 2.02, 95% CI: 1.38-2.95, p-value < 0.01), TFQI (HR = 1.92, 95% CI: 1.33-2.76, p-value < 0.01) and TT4RI (HR = 1.93, 95% CI: 1.34-2.80, p-value < 0.01) were significantly associated with hyperuricemia incidence. The MR results further indicated causal effects of TSH on SUA levels (inverse variance weighting [IVW] β = 0.037, 95% CI: 0.017-0.057) and gout (IVW OR = 1.0018, 95% CI: 1.0004-1.0032).
Conclusion: The higher levels of TSH, TSHI, TFQI and TT4RI are significantly associated with the risk of hyperuricemia in euthyroid population. The MR analysis supports the causal effects of TSH on SUA levels and gout.
Keywords:
Thyroid-stimulating hormone; thyroid hormone sensitivity; hyperuricemia; gout; Mendelian randomization
INTRODUCTION
Hyperuricemia, a major metabolic disorder, develops when uric acid levels rise above a threshold due to either excessive uric acid synthesis or insufficient uric acid excretion. Over the past decades, the increasing incidence of hyperuricemia has become a serious public health concern worldwide. In China, the prevalence of hyperuricemia increased from 11.1% to 14.0% between 2015 and 2019 (1). A number of previous epidemiologic studies have confirmed that hyperuricemia is a significant risk factor for several major chronic diseases, including gout, hypertension, cardiovascular disease, kidney disease, type 2 diabetes, and others (2-5). However, the pathogenesis of hyperuricemia is complex and not yet fully understood. Existing research has suggested several risk factors for the development of hyperuricemia, such as obesity, smoking, drinking, and dyslipidemia (6,7).
Thyroid-stimulating hormone (TSH) is produced and secreted by thyrotropic cells in the pituitary gland and is primarily responsible for regulating the activity of the thyroid gland. Under physiological conditions, the hypothalamic-pituitary-thyroid feedback loop maintains a constant level of TSH in the bloodstream. The pituitary gland is sensitive to small changes in serum thyroid hormone levels. When serum thyroid hormones levels fall below the set point, the pituitary gland releases TSH. The association between abnormal thyroid function and hyperuricemia and gout is certainly not new and has been discussed for several years. For example, results from a Chinese cross-sectional study reported that male participants with mild hypothyroidism had a 1.49-fold increased risk of hyperuricemia (8). In addition, See and cols. reported that hypothyroid and hyperthyroid status were associated with a 1.47-fold and 1.37-fold increased risk of gout, respectively (9). However, the issue of direct causality between TSH and hyperuricemia is still debated, especially in adults with normal thyroid function. In a Chinese cross-sectional study involving 19,013 participants, Yang and cols. suggested that men with elevated TSH levels might be at greater risk of hyperuricemia (10). However, the results of another Chinese cohort study did not reveal a significant association between TSH levels and the incidence of hyperuricemia in men and women (11).
The secretion of TSH is not only modulated by thyroid hormone levels but is also significantly influenced by pituitary and peripheral sensitivity to thyroid hormones. It has been reported that in cases of thyroid hormone resistance, elevated thyroid hormone levels may coexist with high TSH concentrations (12). Thyroid hormone resistance can be assessed by pituitary thyroid hormone sensitivity indices, such as the TSH index (TSHI), the thyrotrophic thyroxine resistance index (TT4RI), the thyroid feedback quantile-based index (TFQI), and the peripheral thyroid hormone sensitivity index, which is specifically calculated as the free triiodothyronine to free thyroxine (FT3/FT4) ratio (12-14). Elevated pituitary sensitivity indices in euthyroid individuals generally indicate pituitary resistance to thyroid hormones, meaning that even a slight decrease in thyroid hormone levels will trigger the secretion of TSH. In addition, pituitary resistance to thyroid hormones is usually accompanied by peripheral resistance to thyroid hormones, as manifested by decreased conversion efficiency of FT4 to FT3. This may represent a compensatory mechanism of the thyroid system and TSH secretion (15).
Using a Chinese community-based prospective cohort, the present study was conducted to assess the associations between TSH levels, thyroid hormone sensitivity indices (TSHI, TT4RI, TFQI, and FT3/FT4 ratio), and the risk of hyperuricemia in the euthyroid population. Furthermore, a two-sample Mendelian randomization (MR) analysis was conducted to investigate the potential association between genetic predisposition to TSH levels and serum uric acid (SUA) levels and gout, given that MR analysis can overcome limitations such as residual confounding and reverse causation seen in traditional observational studies (16).
MATERIALS AND METHODS
Cohort study
Study populations
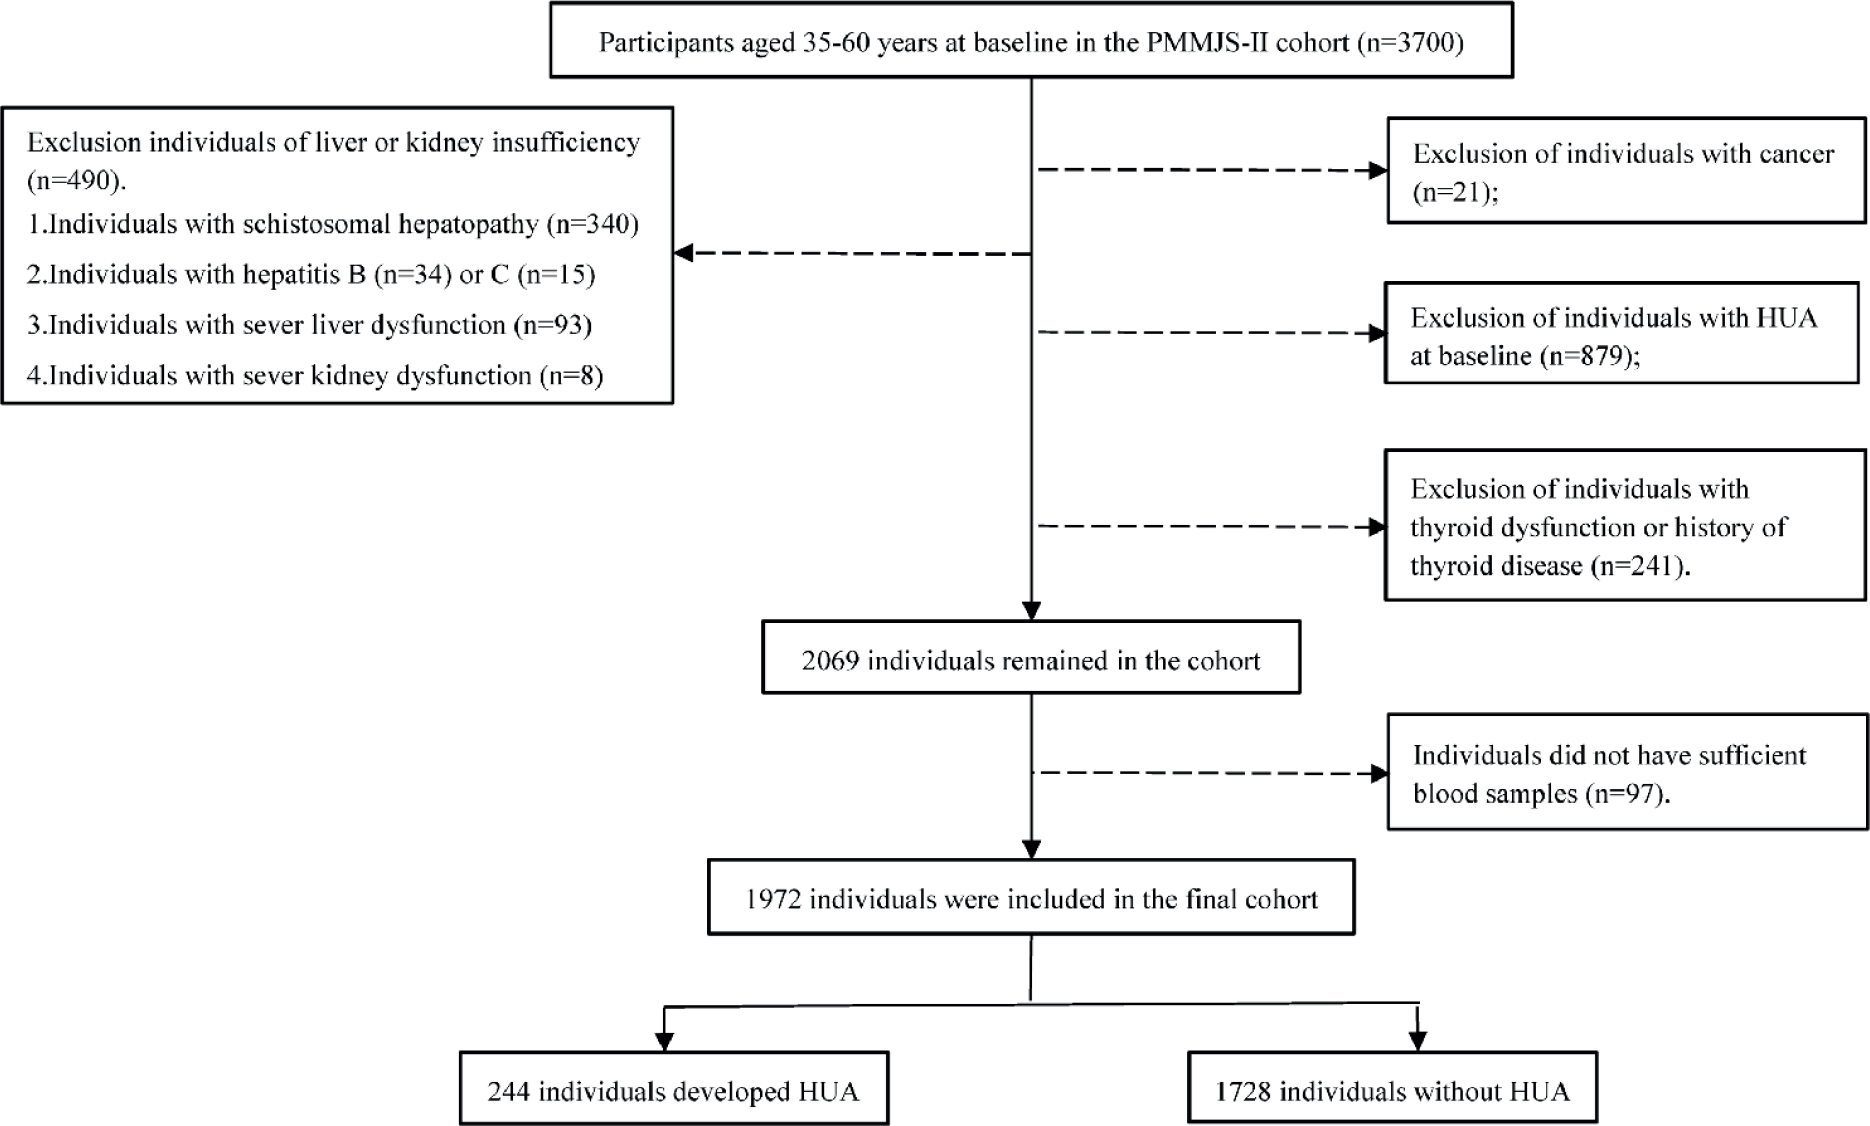
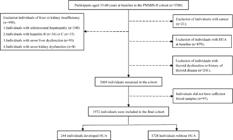
This study was derived from “The Prevention of Metabolic Syndrome and Multi-metabolic Disorders in Jiangsu Province of China II (PMMJS-II)”, an ongoing community-based cohort study conducted in Soochow, China. Detailed baseline profiles of this cohort study have been reported before (17). Briefly, a total of 3,700 participants aged 35 to 60 years were recruited from June 2014 to May 2015. Follow-up surveys were carried out every two years thereafter until December 31, 2022. As shown in Figure S1, we excluded individuals with the following characteristics at baseline: hyperuricemia, severe liver or kidney insufficiency, cancer, thyroid dysfunction or history of thyroid disease, and insufficient blood samples. Eventually, 1,972 individuals were eligible for inclusion in the analysis. All participants provided written informed consent. The study protocol was approved by the Ethics Committee of Suzhou Industrial Park Center for Disease Control and Prevention (Soochow, China), and conducted in accordance with the ethical standards stated in the Declaration of Helsinki.
Data collection
Information on socio-demographics, lifestyle factors, health status, and medical history was collected from each participant using standard questionnaires. Standing height, body weight, waist circumference, and hip circumference were measured with participants wearing light indoor clothing and without shoes. Current smoking was defined as having smoked at least one cigarette a day for more than six months. Heavy drinking was defined as consuming alcohol > 40 g/day in males and > 30 g/day in females (18). Body mass index (BMI) was calculated as weight in kilograms divided by height in meters squared. Hypertension was defined as systolic blood pressure ≥ 140 mmHg or diastolic blood pressure ≥ 90 mmHg or self-reported diagnosis history of hypertension, or use of any anti-hypertensive medication.
Serum TSH, FT3, and FT4 levels were measured using electrochemiluminescence immunoassay (ECLIA) on an autoanalyzer MAGLUMI X8 (Snibe, China). The assay-specific reference ranges for TSH, FT3, and FT4 were 0.30-4.50 mIU/L, 3.08-6.47 pmol/L, and 11.45-22.14 pmol/L, respectively. Thyroid dysfunction was considered if the TSH, FT3 or FT4 were outside the reference range (19). Thyroid hormone sensitivity indices were calculated as follows: TFQI was calculated as the empirical cumulative distribution function cdf FT4-(1-cdf TSH), and the value of TFQI ranged from -1 to 1 (12). TT4RI was calculated as FT4 (pmol/L) × TSH (mIU/L) (13). TSHI was calculated as Ln TSH (mIU/L) + 0.1345 × FT4 (pmol/L) (14). The higher values of TFQI, TT4RI, and TSHI indices indicate lower pituitary sensitivity to thyroid hormone. Additionally, the FT3/FT4 ratio was calculated by dividing FT3 by FT4. A high FT3/FT4 ratio indicates higher peripheral sensitivity to thyroid hormones (20).
Biochemical tests, including SUA, creatinine, cholesterol (TC), triglycerides (TG), high-density lipoprotein cholesterol (HDL-C), low-density lipoprotein cholesterol (LDL-C), fasting plasma glucose (FPG), aspartate aminotransferase (AST), and alanine transaminase (ALT) were measured using an AU5800 analyzer (Beckman Coulter K.K.). Diabetes was defined as FPG ≥ 7.0 mmol/L, random glucose ≥ 11.1 mmol/L, self-reported diagnosis history of diabetes, or use of any glucose-lowering medication (21). Dyslipidemia was defined as TG ≥ 2.26 mmol/L and/or TC ≥ 6.22 mmol/L and/or LDL-C ≥ 4.14 mmol/L and/or HDL-C ≤ 1.04 mmol/L, or using of any lipid-lowering medication (22). The estimated glomerular filtration rate (eGFR) levels were calculated according to the 2021 Chronic Kidney Disease Epidemiology Collaboration (CKD-EPI) (23).
Assessment of hyperuricemia
Hyperuricemia was defined based on any of the following criteria: SUA levels ≥ 420 μmol/L in males, or SUA levels ≥ 360 μmol/L in females, self-reported physician-diagnosed gout, taking anti-gout medication (24).
Two-sample MR study
Data sources
Two-sample MR analyses were conducted using publicly released genome-wide association study (GWAS) summary statistics. The GWAS summary statistics for reference range TSH were obtained from the ThyroidOmics Consortium (25). The GWAS summary statistics for SUA levels and gout were collected from the United Kingdom Biobank datasets (26,27). Detailed information on the data sources contributing to our MR analyses is described in Table S1. We carefully selected summary statistics from the largest available GWAS meta-analyses and data with minimal sample overlap to ensure accurate and unbiased results. The MR analysis was based on summary-level data and thus required no ethical approval or informed consent.
Selection of genetic instruments
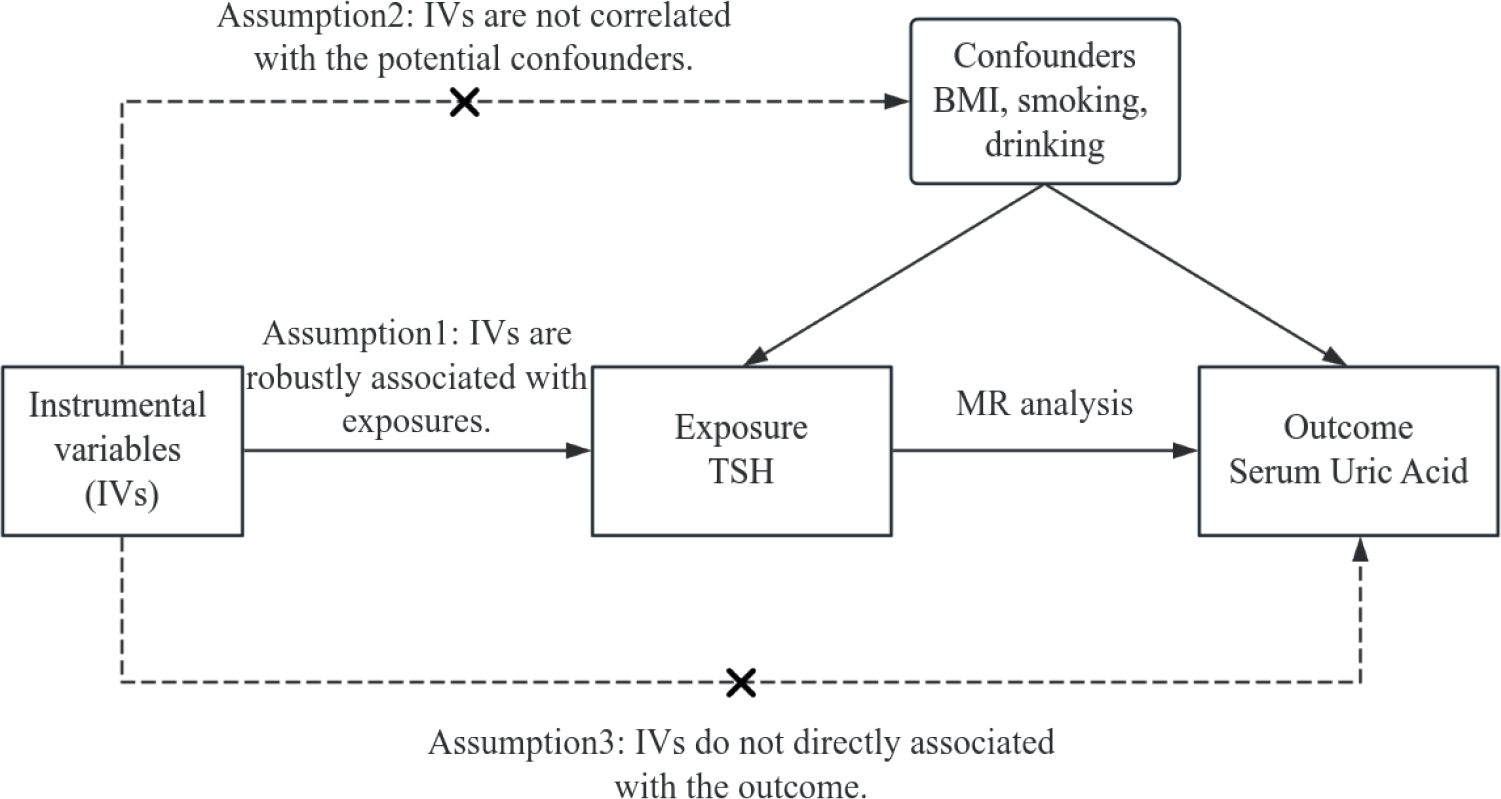
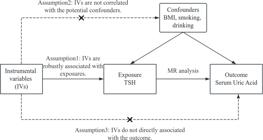
In the two-sample MR, we filtered instrumental variables (IVs) based on the three core MR assumptions (Figure S2). Assumption 1 is that IVs should be strongly associated with the exposure (p-value < 5 × 10⁻⁸). Assumption 2 is that IVs should not directly influence confounders between exposures and outcomes; therefore, Phenoscanner V2 was used to exclude significant single nucleotide polymorphisms (SNPs) that influence known confounders such as BMI, alcohol consumption, and smoking (28). Assumption 3 specifies that IVs should not directly affect outcomes other than via the exposures, so we excluded SNPs that might be outcome-related and used MR Egger regression to detect the bias caused by horizontal pleiotropy (29). All the selected SNPs were confirmed to be independently distributed without linkage disequilibrium (r2 < 0.001 within a distance of 10,000). Furthermore, the strength of each SNP was measured by F-statistics: R2/(1-R2) × [(N-K-1)/K], where R2 was the proportion of the exposure explained by the genetic variants, K was the number of included SNPs, and N was the sample size, to avoid weak-instrument bias (F > 10 suggested a low probability of weak-instrument bias) (30). The F-statistics of all the included SNPs were above the threshold of 10 (Table S2). Harmonization was performed to exclude palindromic and incompatible SNPs. The MR-PRESSO test was used to detect and exclude any outlier SNPs.
Statistical analysis
For the cohort study, continuous variables are reported as mean ± standard deviation (SD) or median (interquartile range). Normality was tested using the Shapiro-Wilk test. Categorical variables are presented as cases (n) and percentages (%). Differences between the TSH quartiles (Q1-Q4) were tested using the chi-square test for categorical variables, the one-way ANOVA test for normally distributed variables, or the Kruskal-Wallis test for skewed distributions. Linear regression analyses were performed to assess the relationships between TSH, thyroid hormone sensitivity, and eGFR and SUA levels. Restricted cubic spline (RCS) models were also used to assess the dose-response associations, with knots placed at the 10th, 50th, and 90th percentiles. Cox proportional hazard models were used to calculate the hazard ratios (HRs) and 95% confidence intervals (CIs) for the associations between TSH or thyroid hormone sensitivity indices and hyperuricemia, adjusted for possible confounding factors such as age, sex, BMI, current smoking, heavy drinking, hypertension, diabetes, dyslipidemia, ALT, AST, and eGFR. Sensitivity analyses were performed to test the robustness of the results. Subgroup analyses were conducted according to age, sex, BMI, current smoking, heavy drinking, hypertension, diabetes, and dyslipidemia (31-33). The interactions between TSH levels and thyroid hormone sensitivity indices and the subgroup variables were assessed using the likelihood ratio test.
In the two-sample MR analysis, the inverse variance weighted (IVW) method was applied as the main MR analysis. Before that, Cochran’s Q test was performed, combined with I2 statistics, to measure the heterogeneity across IVs. If there was strong evidence of heterogeneity, the random-effects IVW method was used as an alternative approach. To enhance the reliability of the causal inference, we also conducted several complementary analyses, including the weighted median, MR Egger, maximum likelihood, and robust adjusted profile score (MR RAPS) methods. This MR study was reported according to the STROBE-MR checklist (34).
Statistical analyses were performed using Statistical Analysis Software (SAS) version 9.4 (SAS Institute Inc., Cary, NC) and R version 4.3.2 (http://www.R-project.org). The RCS models were generated using the R package “rms”. In addition, the R package “mice” was used for multiple imputation of missing data. Two-sample MR analyses were performed using the “TwoSampleMR” package. p-values were two-tailed, and a p-value <0.05 was considered statistically significant.
RESULTS
Cohort study
Table 1 describes the baseline characteristics of the participants. Among the 1,972 included participants, the median age was 50 (46, 55) years, and 64.1% were females. Individuals with lower TSH levels were more likely to be males (p-value < 0.01), with a higher proportion of smokers (p-value < 0.01) and heavy drinkers (p-value < 0.01), and had lower levels of TG (p-value = 0.03) and HDL-C (p-value = 0.02). As expected, serum FT4 and FT3 levels decreased with increasing TSH levels. After adjustment for age and sex, the FT3/FT4 ratio was negatively correlated with SUA levels. However, TSH, TFQI, TT4RI, and TSHI were not only negatively correlated with eGFR but also positively correlated with SUA levels (Table S3).
During 8.6 years of follow-up, 244 cases of hyperuricemia were identified. The dose-response relationships between TSH, thyroid hormone sensitivity indices, and hyperuricemia risk are shown in Figure 1. After adjusting for potential confounding factors, the results of the RCS analysis indicated that the risk of hyperuricemia increased with TSH, TFQI, TT4RI, and TSHI but decreased with an increasing FT3/FT4 ratio; the p-values for the nonlinear test were 0.62, 0.43, 0.70, 0.50, and 0.08, respectively.
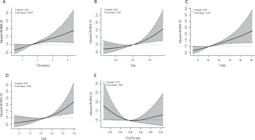
RCS analysis between TSH, TFQI, TT4RI, TSHI and FT3/FT4 ratio and the risk of hyperuricemia.
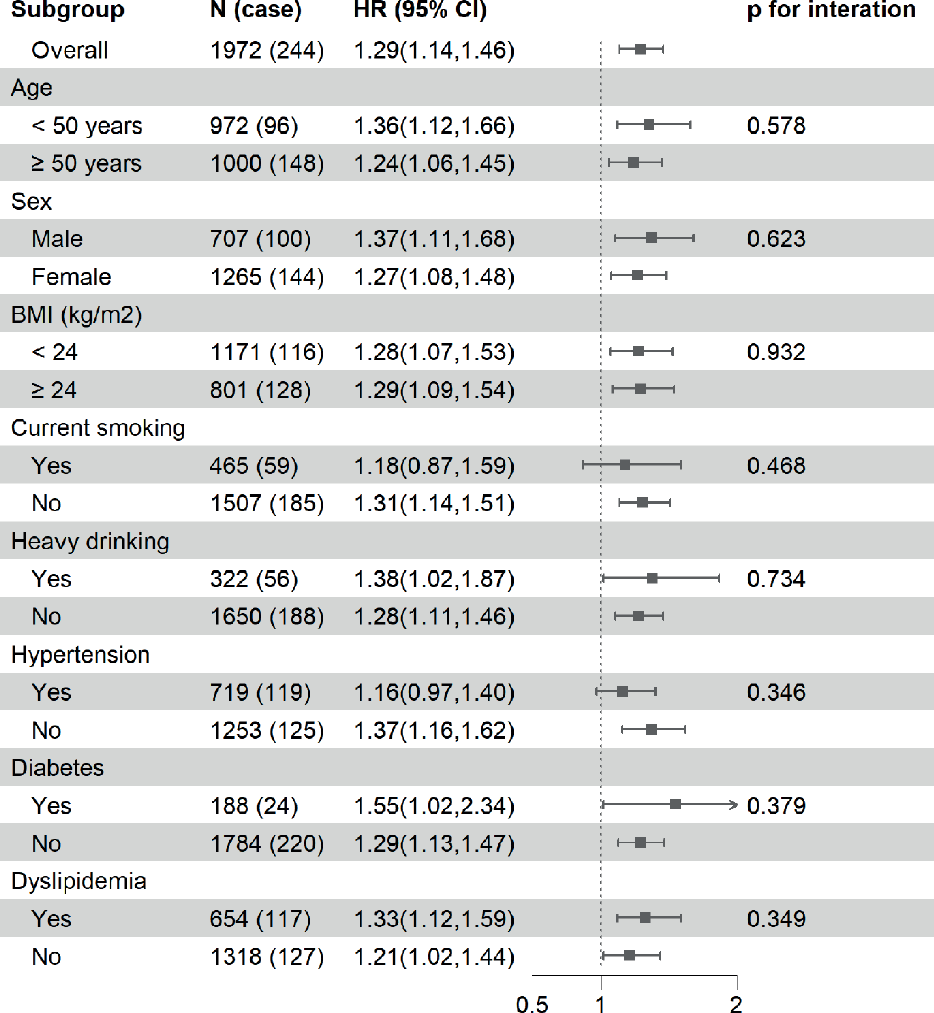
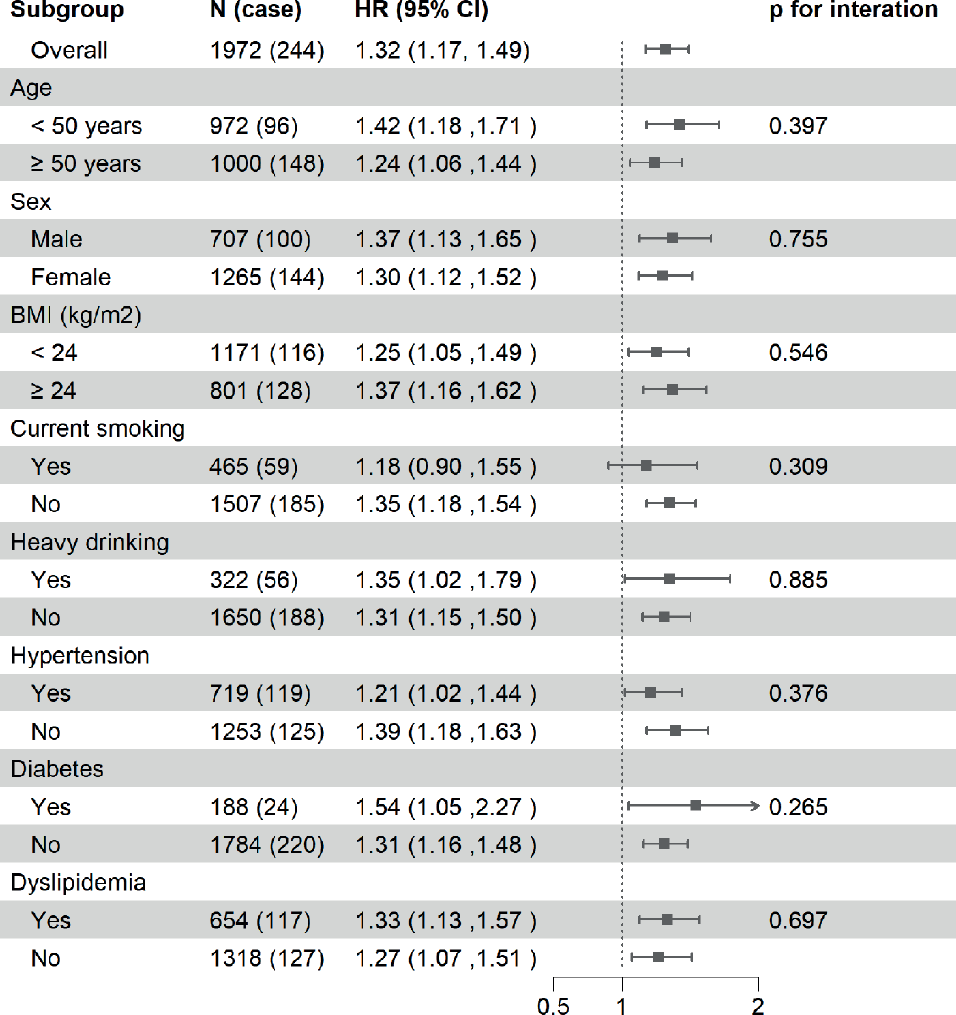
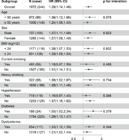
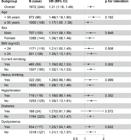
As shown in Table 2, the HR (95% CI) for hyperuricemia associated with a 1 SD higher level of TSH was 1.25 (1.11, 1.41). After adjusting for age, sex, BMI, current smoking, heavy drinking, hypertension, diabetes, dyslipidemia, ALT, AST, and eGFR, the HRs (95% CIs) for hyperuricemia were 1.26 (0.85, 1.88) in Q2, 1.62 (1.11, 2.36) in Q3, and 1.87 (1.28, 2.73) in Q4, with Q1 as the reference. As shown in Table S4, the association between TSH and the risk of hyperuricemia remained stable even after further adjustment for baseline eGFR and baseline SUA levels, changing the adjustment variable from BMI to waist-to-hip ratio (WHR), or using a new dataset with multiple imputation for missing data. In addition, the results of the subgroup analysis did not show any significant interaction between the subgroup variables and TSH in the development of hyperuricemia (Figure S3; all p-values for interaction > 0.05).
Association between TSH, thyroid hormone sensitivity indices and the risk of hyperuricemia in euthyroid population
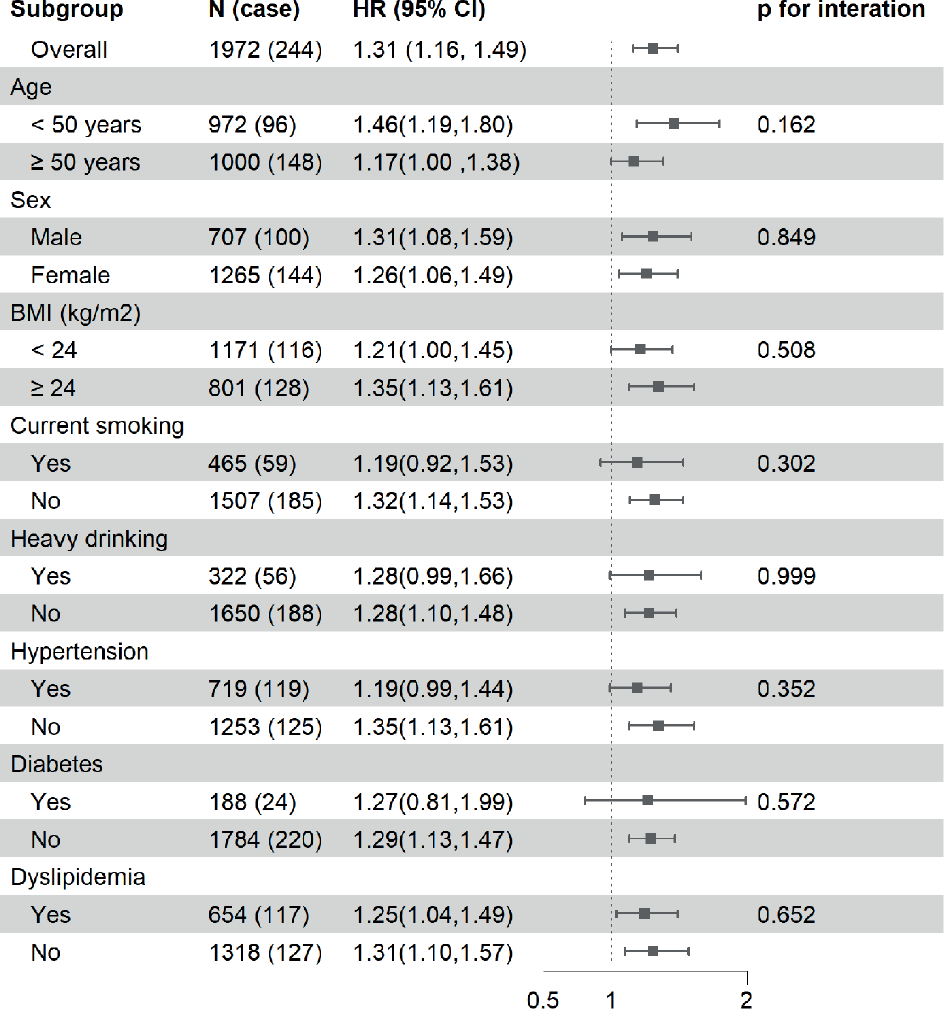
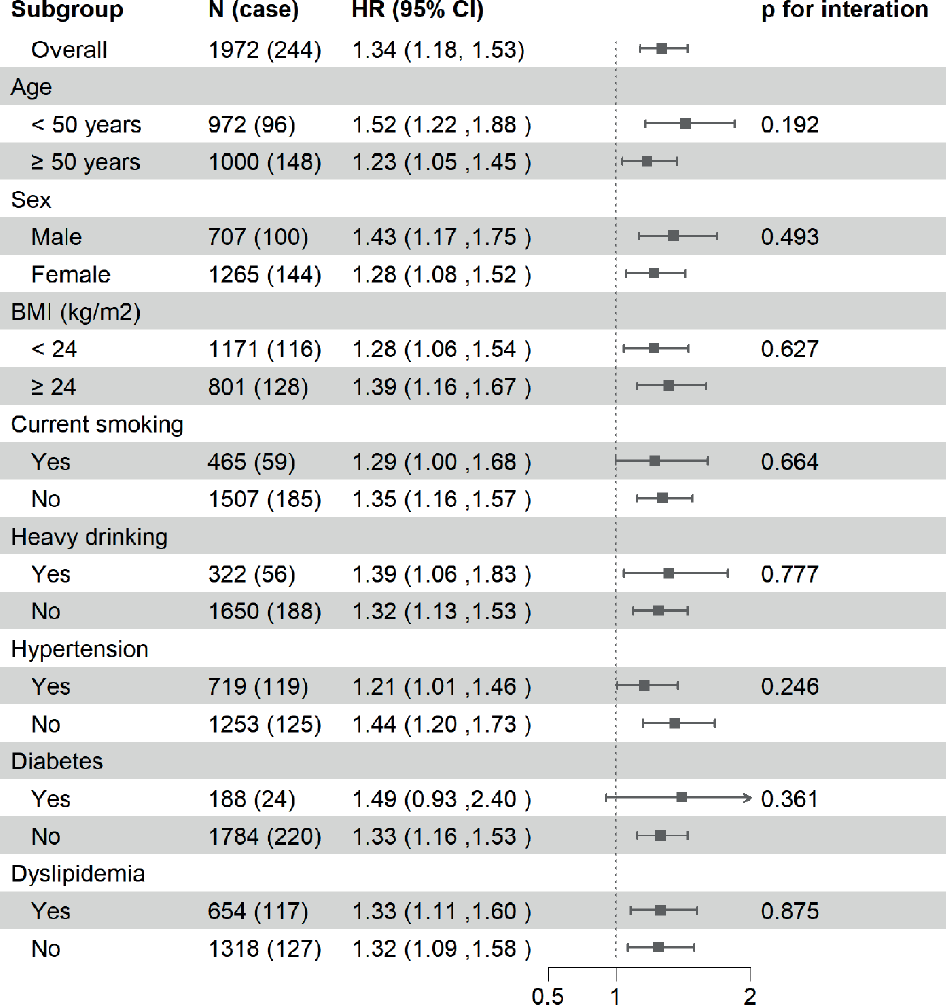
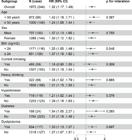
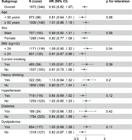
Similarly, the HRs with 95% CIs for hyperuricemia associated with a 1 SD higher level of TFQI, TT4RI, and TSHI were 1.31 (1.16, 1.49), 1.32 (1.17, 1.49), and 1.34 (1.18, 1.53), respectively. In addition, compared with those in the lowest quartile groups, the risk of hyperuricemia was 1.92-fold (95% CI: 1.33, 2.76), 1.93-fold (95% CI: 1.34, 2.80), and 2.02-fold (95% CI: 1.38, 2.95) higher among those in the highest quartile of TFQI, TT4RI, and TSHI, respectively (Table 2). Further sensitivity analyses showed consistent results (Tables S5-S7). The subgroup analysis also did not indicate any significant interaction between the subgroup variables and TFQI, TT4RI, or TSHI on the risk of hyperuricemia (Figure S4-S6; all p-values for interaction > 0.05). However, FT3/FT4, which is an indirect reflection of peripheral thyroid hormone sensitivity, was not associated with the development of hyperuricemia in the present analysis (HR: 0.84; 95% CI: 0.59, 1.19). Subgroup analysis of the FT3/FT4 and hyperuricemia association is shown in Figure S7.
Two-sample MR analysis
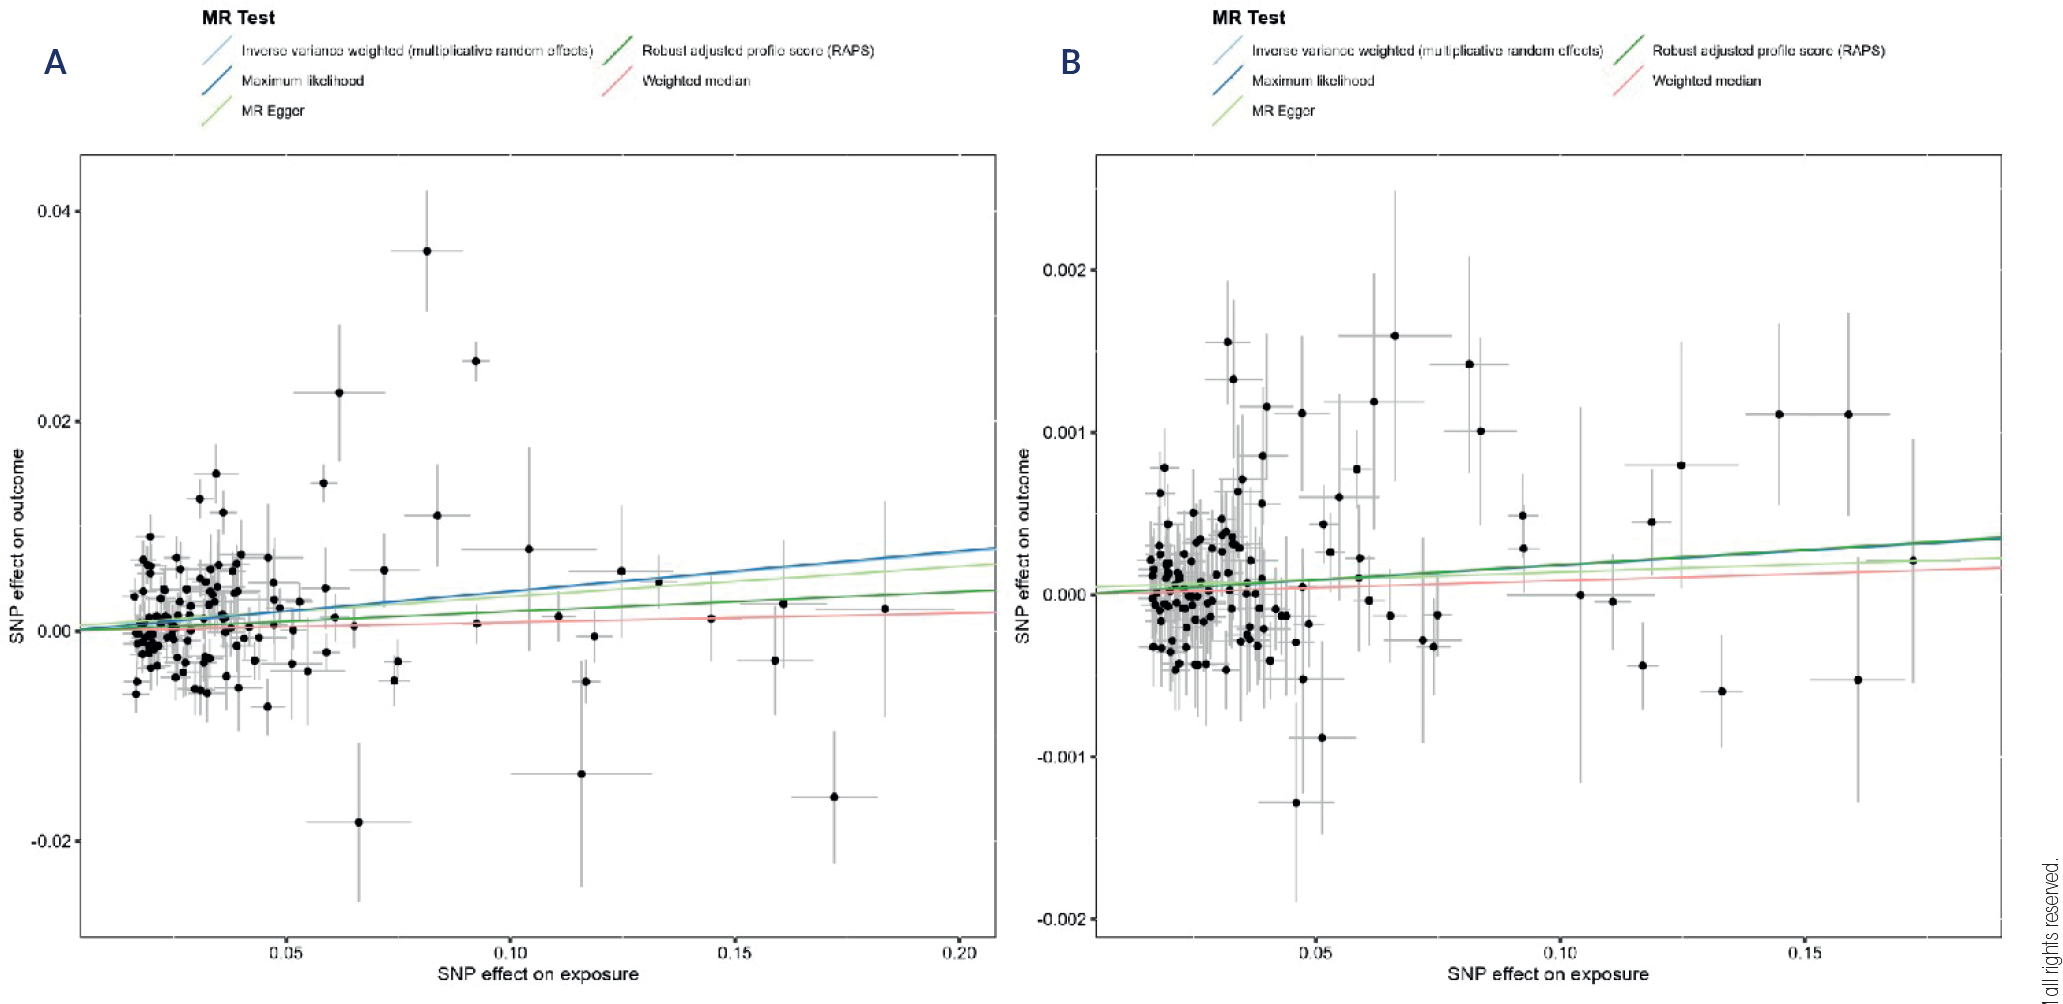
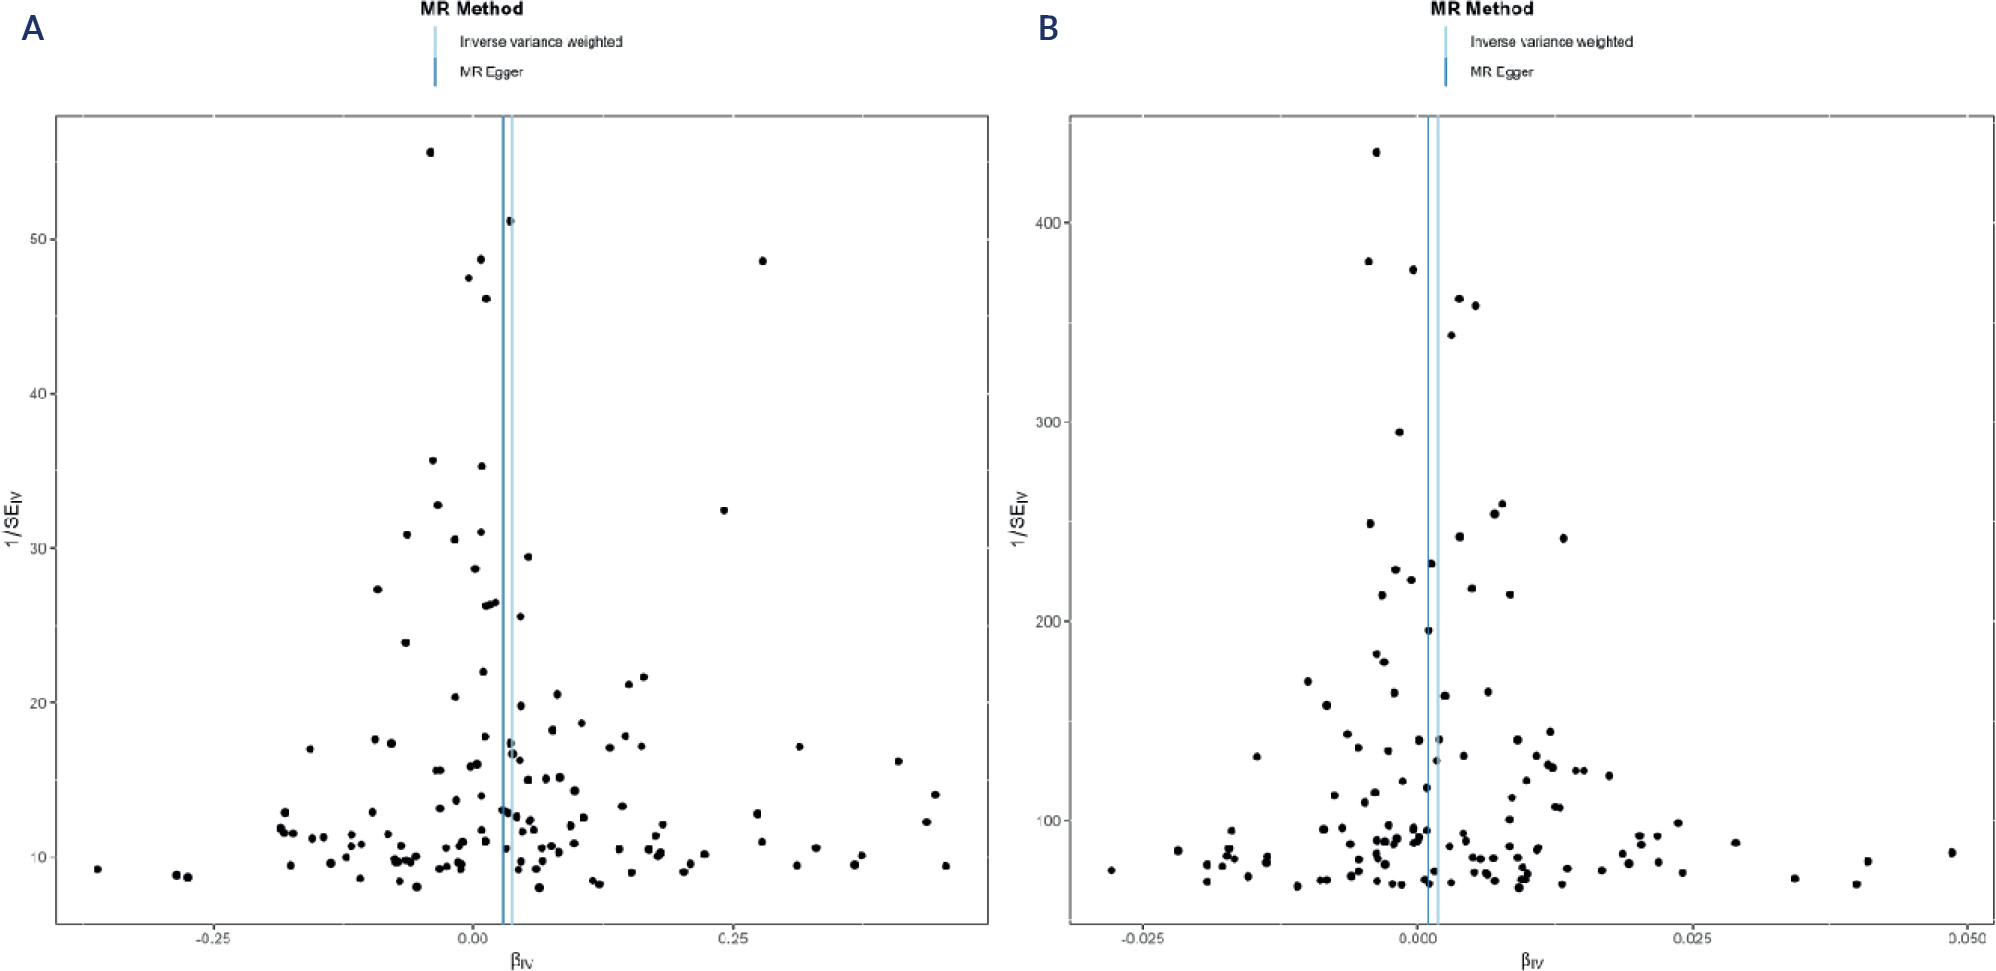
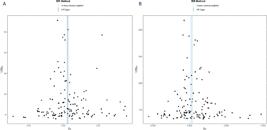
As shown in Table S2, 130 SNPs associated with TSH were included in the two-sample MR analysis. Notably, all F statistics were greater than 10, indicating a relatively low risk of weak instrument bias in the conducted MR analyses. The estimated effects and standard errors of the IVs on TSH and SUA levels or gout are presented in the scatter plots (Figure S8). Table 3 shows the causal effects of TSH on SUA levels and gout. Substantial heterogeneity was detected, as indicated by Cochran’s Q test (p-value < 0.01), and the main analyses were performed using the IVW approach with the random effects model. The estimate from the IVW method indicated that genetically predicted TSH was significantly associated with SUA levels (β = 0.037; 95% CI: 0.017, 0.057) and gout (odds ratio [OR] = 1.0018; 95% CI: 1.0004, 1.0032). The MR RAPS and maximum likelihood methods confirmed the causality. The MR-PRESSO test was then performed, and the outlier-corrected results after removal of outlier SNPs were consistent with the IVW results. None of the Egger regression results were statistically significant, indicating the absence of horizontal pleiotropy in the study. The funnel plots and leave-one-out plots are shown in Figures S9-S10. Removal of any single SNP did not significantly change the observed association in the leave-one-out analysis.
DISCUSSION
In the present study, the results suggested that even among the euthyroid population, higher TSH levels and impaired central sensitivity to thyroid hormone were significantly associated with the risk of hyperuricemia. In addition, the results from the MR analysis provided evidence for the causal effects of TSH on SUA levels and gout. Given that the increasing prevalence of hyperuricemia has become an important disease burden worldwide, our findings are likely to have important clinical and public health implications.
The results from previous studies may partially support the current findings. It is well known that SUA levels are primarily determined by synthesis and excretion, with renal excretion of urate accounting for 60%-70% of total uric acid excretion from the body (35). The results from a Japanese study suggested that in the euthyroid population, TSH could increase vascular resistance at the afferent arteriole, decrease renal plasma flow, and subsequently reduce the glomerular filtration rate (36). In addition, Arora and cols. found that thyroid hormones could regulate renal hemodynamics, and hypothyroidism could cause reversible impairment of renal function (37). Furthermore, results from a clinically based study reported that thyroid hormones regulated urate metabolism by enhancing insulin sensitivity in individuals with subclinical hypothyroidism (38). This is because insulin increases the expression of the urate transporter urate anion transporter 1 and decreases the expression of ATP-binding cassette subfamily G member 2, resulting in increased reabsorption of urate in the body.
Several previous studies have reported that the TT4RI, TSHI, and TFQI are significantly associated with metabolic disorders, including obesity, metabolic syndrome, diabetes, and diabetes-related mortality (12). Results from a cross-sectional survey reported that, compared with individuals in the lowest group of thyroid hormone sensitivity indices, those in the highest group had a significantly increased prevalence of hyperuricemia (TFQI: OR = 1.18, 95% CI = 1.04-1.35; TT4RI: OR = 1.17, 95% CI = 1.08-1.27; TSHI: OR = 1.12, 95% CI = 1.04-1.21) (39). Additional cross-sectional studies have yielded comparable outcomes (40-42). In the present study, our findings also revealed that elevated pituitary thyroid hormone sensitivity indices (TFQI, TT4RI, and TSHI) could significantly increase the risk of hyperuricemia. However, the results from this study did not support a prospective association between the peripheral thyroid hormone sensitivity index (FT3/FT4 ratio) and the development of hyperuricemia. Recently, in a large cross-sectional study, Lu and cols. reported that each 1 SD increase in the FT3/FT4 ratio was negatively associated with hyperuricemia in euthyroid participants (males: OR = 0.11, 95% CI: 0.03-0.37; females: OR = 0.03, 95% CI = 0.01-0.21) (42). Given that both pituitary and peripheral thyroid hormone sensitivity are associated with the secretion of TSH, more studies are needed to further explore the prospective association between peripheral thyroid hormone sensitivity and the risk of hyperuricemia.
In recent years, two-sample MR analysis has been widely used to take SNP-exposure and SNP-outcome associations from independent GWASs and combine them into a single causal estimate (43). With the rapid increase in the number of GWASs investigating both TSH levels and disease outcomes, large-scale summary statistics have become widely accessible. However, the evidence for a causal relationship between serum TSH and SUA levels remains limited. Recently, Song and cols. reported a causal association between thyroid diseases (autoimmune hypothyroidism, autoimmune hyperthyroidism, thyroid nodules, and thyroid cancer) and gout using two-sample MR analysis. The results suggested that autoimmune hypothyroidism and hyperthyroidism have a causal effect on gout (IVW results: OR = 1.13, 95% CI = 1.03-1.21 for hypothyroidism; OR = 1.07, 95% CI = 1.01-1.12 for hyperthyroidism) (44). As expected, we also observed a causal association between TSH and SUA levels or gout in the present analysis. Therefore, the previous and present results suggest that TSH elevation is an important mechanism involved in the development of hyperuricemia.
There are several strengths in the present study, including a prospective design, long-term follow-up, and information on various covariates. Moreover, the results of two-sample MR analyses are less affected by confounders compared to traditional observational epidemiological studies, since genetic variation is stable throughout a person’s lifetime. However, several limitations should be acknowledged. First, although we have sufficiently adjusted for measured confounders, the results might still be biased due to unmeasured residual confounding (e.g., diet or medications like diuretics may alter SUA levels). However, given the relatively homogeneous dietary habits among the residents of Soochow, the potential impact of dietary factors may be limited. Second, in this study, we opted to use ECLIA to measure thyroid hormones. While LC-MS/MS is considered the gold standard in clinical chemistry, ECLIA has been shown to produce results that are highly comparable to those of LC-MS/MS. For example, analysis by Kunisue and cols. reported significant correlations for T3 (r = 0.876) and T4 (r = 0.852) measurements when comparing ECLIA with LC-MS/MS (45). Therefore, ECLIA has been widely used for measuring thyroid hormones in both clinical and epidemiological studies, as it offers a reliable alternative (46,47). Third, we selected a higher cutoff value for defining alcohol consumption in this analysis. One reason for this choice is that over 70% of the study participants have a customary consumption of yellow rice wine, a common practice in our population. In addition, several previous studies have shown that moderate alcohol intake is not associated with the risk of hyperuricemia or gout (48-50). For example, Li and cols. reported that moderate alcohol consumption, defined as >30 g/day for males and >15 g/day for females, did not increase the risk of hyperuricemia in Chinese adults (males: OR = 1.23, 95% CI = 0.95-1.60; females: OR = 0.90, 95% CI = 0.12-6.86) (50). However, the potential effects of lower levels of alcohol consumption on the association between thyroid function and hyperuricemia/gout should be further investigated in the future. Fourth, the cohort study is not a nationally representative sample, and all participants are 35-60 years of age, which limits the interpretation of results in younger, older, and other ethnic populations. Fifth, the estimates from other MR approaches (weighted median, MR Egger) were statistically insignificant, which can be ascribed to lower statistical power, indicating weak evidence for the causal relationship. In addition, the MR analyses were restricted to individuals of European ancestry, as GWAS databases for individuals of East Asian ancestry were not available.
In conclusion, the present study indicated that, even among individuals with normal thyroid function, TSH elevation and impaired central sensitivity to thyroid hormones were significantly associated with the risk of hyperuricemia. Moreover, the two-sample MR analysis provided additional evidence for the causal effects of TSH on SUA levels and gout. These findings may provide novel insight into identifying individuals at high risk of hyperuricemia and gout.
Data Availability Statement:
the original contributions presented in this study are included in the article/Supplementary material, further inquiries can be directed to the corresponding authors.
Acknowledgments:
the authors thank all the participants, their relatives, and the members of the survey teams of the study for their contribution.
-
Funding:
this work was supported by the National Natural Science Foundation of China (No. 81773507, 82173594), the Key University Science Research Project of Jiangsu Province (21KJA330003), Jiangsu Key Laboratory of Preventive and Translational Medicine for Geriatric Diseases Project (KJS2317), Suzhou science and technology development plan project (SKYD2023081), Suzhou health personnel training project (Gwzx202103), Suzhou Youth Science and Technology Project of “Promoting Health through Science and Education” (KJXW2022085) and Suzhou science and technology plan project (SKY2022095).
-
Disclosure:
no potential conflict of interest relevant to this article was reported.
Data Availability Statement:
the original contributions presented in this study are included in the article/Supplementary material, further inquiries can be directed to the corresponding authors.
REFERENCES
-
1 Zhang M, Zhu X, Wu J, Huang Z, Zhao Z, Zhang X, et al. Prevalence of hyperuricemia among Chinese adults: findings from two nationally representative cross-sectional surveys in 2015-16 and 2018-19. Front Immunol. 2021;12:791983. doi: 10.3389/fimmu.2021.791983
» https://doi.org/10.3389/fimmu.2021.791983 -
2 Borghi C, Agnoletti D, Cicero AFG, Lurbe E, Virdis A. Uric acid and hypertension: a review of evidence and future perspectives for the management of cardiovascular risk. Hypertension. 2022;79(9):1927-36. doi: 10.1161/hypertensionaha.122.17956
» https://doi.org/10.1161/hypertensionaha.122.17956 -
3 Ndrepepa G. Uric acid and cardiovascular disease. Clin Chim Acta. 2018;484:150-63. doi: 10.1016/j.cca.2018.05.046
» https://doi.org/10.1016/j.cca.2018.05.046 -
4 Chonchol M, Shlipak MG, Katz R, Sarnak MJ, Newman AB, Siscovick DS, et al. Relationship of uric acid with progression of kidney disease. Am J Kidney Dis. 2007;50(2):239-47. doi: 10.1053/j.ajkd.2007.05.013
» https://doi.org/10.1053/j.ajkd.2007.05.013 -
5 Jiang J, Zhang T, Liu Y, Chang Q, Zhao Y, Guo C, et al. Prevalence of diabetes in patients with hyperuricemia and gout: a systematic review and meta-analysis. Curr Diab Rep. 2023;23(6):103-17. doi: 10.1007/s11892-023-01506-2
» https://doi.org/10.1007/s11892-023-01506-2 -
6 He H, Pan L, Ren X, Wang D, Du J, Cui Z, et al. The effect of body adiposity and alcohol consumption on serum uric acid: a quantile regression analysis based on the China national health survey. Front Nutr. 2021;8:724497. doi: 10.3389/fnut.2021.724497
» https://doi.org/10.3389/fnut.2021.724497 -
7 Choi HK, McCormick N, Lu N, Rai SK, Yokose C, Zhang Y. Population impact attributable to modifiable risk factors for hyperuricemia. Arthritis Rheumatol. 2020;72(1):157-65. doi: 10.1002/art.41067
» https://doi.org/10.1002/art.41067 -
8 Zhang J, Meng Z, Zhang Q, Liu L, Song K, Tan J, et al. Gender impact on the correlations between subclinical thyroid dysfunction and hyperuricemia in Chinese. Clin Rheumatol. 2016;35(1):143-9. doi: 10.1007/s10067-015-2867-4
» https://doi.org/10.1007/s10067-015-2867-4 -
9 See LC, Kuo CF, Yu KH, Luo SF, Chou IJ, Ko YS, et al. Hyperthyroid and hypothyroid status was strongly associated with gout and weakly associated with hyperuricaemia. PLoS One. 2014;9(12):e114579. doi: 10.1371/journal.pone.0114579
» https://doi.org/10.1371/journal.pone.0114579 -
10 Yang M, Cao S. Gender and age-specific differences in the association of thyroid function and hyperuricemia in Chinese: a cross-sectional study. Int J Endocrinol. 2022;2022:2168039. doi: 10.1155/2022/2168039
» https://doi.org/10.1155/2022/2168039 -
11 Gu Y, Meng G, Zhang Q, Liu L, Wu H, Zhang S, et al. Predictive value of thyroid hormones for incident hyperuricemia in euthyroid subjects: the tianjin chronic low-grade systemic inflammation and health cohort study. Endocr Pract. 2021;27(4):291-7. doi: 10.1016/j.eprac.2020.10.009
» https://doi.org/10.1016/j.eprac.2020.10.009 -
12 Laclaustra M, Moreno-Franco B, Lou-Bonafonte JM, Mateo-Gallego R, Casasnovas JA, Guallar-Castillon P, et al. Impaired sensitivity to thyroid hormones is associated with diabetes and metabolic syndrome. Diabetes Care. 2019;42(2):303-10. doi: 10.2337/dc18-1410
» https://doi.org/10.2337/dc18-1410 -
13 Yagi H, Pohlenz J, Hayashi Y, Sakurai A, Refetoff S. Resistance to thyroid hormone caused by two mutant thyroid hormone receptors beta, R243Q and R243W, with marked impairment of function that cannot be explained by altered in vitro 3,5,3’-triiodothyroinine binding affinity. J Clin Endocrinol Metab. 1997;82(5):1608-14. doi: 10.1210/jcem.82.5.3945
» https://doi.org/10.1210/jcem.82.5.3945 -
14 Jostel A, Ryder WDJ, Shalet SM. The use of thyroid function tests in the diagnosis of hypopituitarism: definition and evaluation of the TSH Index. Clin Endocrinol (Oxf). 2009;71(4):529-34. doi: 10.1111/j.1365-2265.2009.03534.x
» https://doi.org/10.1111/j.1365-2265.2009.03534.x -
15 Nie X, Ma X, Xu Y, Shen Y, Wang Y, Bao Y. Increased serum adipocyte fatty acid-binding protein levels are associated with decreased sensitivity to thyroid hormones in the euthyroid population. Thyroid. 2020;30(12):1718-23. doi: 10.1089/thy.2020.0011
» https://doi.org/10.1089/thy.2020.0011 -
16 Smith GD, Ebrahim S. “Mendelian randomization”: can genetic epidemiology contribute to understanding environmental determinants of disease? Int J Epidemiol. 2003;32(1):1-22. doi: 10.1093/ije/dyg070
» https://doi.org/10.1093/ije/dyg070 -
17 Liu F, Zhou H, Cao L, Guo Z, Dong C, Yu L, et al. Risk of reduced platelet counts in patients with nonalcoholic fatty liver disease (NAFLD): a prospective cohort study. Lipids Health Dis. 2018;17(1):221. doi: 10.1186/s12944-018-0865-7
» https://doi.org/10.1186/s12944-018-0865-7 -
18 Ericson U, Sonestedt E, Gullberg B, Hellstrand S, Hindy G, Wirfält E, et al. High intakes of protein and processed meat associate with increased incidence of type 2 diabetes. Br J Nutr. 2013;109:1143-53. doi: 10.1017/s0007114512003017
» https://doi.org/10.1017/s0007114512003017 -
19 Ding X, Wang Y, Liu J, Wang G. Impaired sensitivity to thyroid hormones is associated with elevated homocysteine levels in the euthyroid population. J Clin Endocrinol Metab. 2022;107(9):e3731-7. doi: 10.1210/clinem/dgac371
» https://doi.org/10.1210/clinem/dgac371 -
20 Sun H, Zhu W, Liu J, An Y, Wang Y, Wang G. Reduced sensitivity to thyroid hormones is associated with high remnant cholesterol levels in Chinese euthyroid adults. J Clin Endocrinol Metab. 2022;108(1):166-74. doi: 10.1210/clinem/dgac523
» https://doi.org/10.1210/clinem/dgac523 -
21 NCD Risk Factor Collaboration (NCD-RisC). Effects of diabetes definition on global surveillance of diabetes prevalence and diagnosis: a pooled analysis of 96 population-based studies with 331,288 participants. Lancet Diabetes Endocrinol. 2015;3(8):624-37. doi: 10.1016/s2213-8587(15)00129-1
» https://doi.org/10.1016/s2213-8587(15)00129-1 -
22 Joint committee issued Chinese guideline for the management of dyslipidemia in adults. 2016 Chinese guideline for the management of dyslipidemia in adults. Zhonghua Xin Xue Guan Bing Za Zhi. 2016;44(10):833-53. doi: 10.3760/cma.j.issn.0253-3758.2016.10.005
» https://doi.org/10.3760/cma.j.issn.0253-3758.2016.10.005 -
23 Inker LA, Eneanya ND, Coresh J, Tighiouart H, Wang D, Sang Y, et al. New creatinineand cystatin c-based equations to estimate GFR without race. N Engl J Med. 2021;385(19):1737-49. doi: 10.1056/nejmoa2102953
» https://doi.org/10.1056/nejmoa2102953 -
24 Zhu Y, Pandya BJ, Choi HK. Prevalence of gout and hyperuricemia in the US general population: the National Health and Nutrition Examination Survey 2007-2008. Arthritis Rheum. 2011;63(10):3136-41. doi: 10.1002/art.30520
» https://doi.org/10.1002/art.30520 -
25 Sterenborg RBTM, Steinbrenner I, Li Y, Bujnis MN, Naito T, Marouli E, et al. Multi-trait analysis characterizes the genetics of thyroid function and identifies causal associations with clinical implications. Nat Commun. 2024;15(1):888. doi: 10.1038/s41467-024-44701-9
» https://doi.org/10.1038/s41467-024-44701-9 -
26 Sakaue S, Kanai M, Tanigawa Y, Karjalainen J, Kurki M, Koshiba S, et al. A cross-population atlas of genetic associations for 220 human phenotypes. Nat Genet. 2021;53(10):1415-24. doi: 10.1038/s41588-021-00931-x
» https://doi.org/10.1038/s41588-021-00931-x -
27 Dönertaş HM, Fabian DK, Valenzuela MF, Partridge L, Thornton JM. Common genetic associations between age-related diseases. Nat Aging. 2021;1(4):400-12. doi: 10.1038/s43587-021-00051-5
» https://doi.org/10.1038/s43587-021-00051-5 -
28 Kamat MA, Blackshaw JA, Young R, Surendran P, Burgess S, Danesh J, et al. PhenoScanner V2: an expanded tool for searching human genotype-phenotype associations. Bioinformatics. 2019;35(22):4851-3. doi: 10.1093/bioinformatics/btz469
» https://doi.org/10.1093/bioinformatics/btz469 -
29 Bowden J, Davey Smith G, Burgess S. Mendelian randomization with invalid instruments: effect estimation and bias detection through Egger regression. Int J Epidemiol. 2015;44(2):512-25. doi: 10.1093/ije/dyv080
» https://doi.org/10.1093/ije/dyv080 -
30 Pierce BL, Ahsan H, Vanderweele TJ. Power and instrument strength requirements for Mendelian randomization studies using multiple genetic variants. Int J Epidemiol. 2011;40(3):740-52. doi: 10.1093/ije/dyq151
» https://doi.org/10.1093/ije/dyq151 -
31 Zhang Y, Zhang M, Yu X, Wei F, Chen C, Zhang K, et al. Association of hypertension and hypertriglyceridemia on incident hyperuricemia: an 8-year prospective cohort study. J Transl Med. 2020;18(1):409. doi: 10.1186/s12967-020-02590-8
» https://doi.org/10.1186/s12967-020-02590-8 -
32 Song J, Jin C, Shan Z, Teng W, Li J. Prevalence and risk factors of hyperuricemia and gout: a cross-sectional survey from 31 provinces in mainland China. J Transl Int Med. 2022;10(2):134-45. doi: 10.2478/jtim-2022-0031
» https://doi.org/10.2478/jtim-2022-0031 -
33 Yang T, Zhang Y, Wei J, Zeng C, Li LJ, Xie X, et al. Relationship between cigarette smoking and hyperuricemia in middle-aged and elderly population: a cross-sectional study. Rheumatol Int. 2017;37(1):131-6. doi: 10.1007/s00296-016-3574-4
» https://doi.org/10.1007/s00296-016-3574-4 -
34 Skrivankova VW, Richmond RC, Woolf BAR, Yarmolinsky J, Davies NM, Swanson SA, et al. Strengthening the reporting of observational studies in epidemiology using Mendelian randomization: the STROBE-MR statement. JAMA. 2021;326(16):1614-21. doi: 10.1001/jama.2021.18236
» https://doi.org/10.1001/jama.2021.18236 -
35 Bobulescu IA, Moe OW. Renal transport of uric acid: evolving concepts and uncertainties. Adv Chronic Kidney Dis. 2012;19(6):358-71. doi: 10.1053/j.ackd.2012.07.009
» https://doi.org/10.1053/j.ackd.2012.07.009 -
36 Tsuda A, Inaba M, Ichii M, Ochi A, Ohno Y, Nakatani S, et al. Relationship between serum TSH levels and intrarenal hemodynamic parameters in euthyroid subjects. Eur J Endocrinol. 2013;169(1):45-50. doi: 10.1530/eje-13-0026
» https://doi.org/10.1530/eje-13-0026 -
37 Arora S, Chawla R, Tayal D, Gupta VK, Sohi JS, Mallika V. Biochemical markers of liver and kidney function are influenced by thyroid function-a case-controlled follow up study in Indian hypothyroid subjects. Indian J Clin Biochem. 2009;24(4):370-4. doi: 10.1007/s12291-009-0067-1
» https://doi.org/10.1007/s12291-009-0067-1 -
38 Desideri G, Bocale R, D’Amore AM, Carnassale G, Necozione S, Barini A, et al. Thyroid hormones modulate uric acid metabolism in patients with recent onset subclinical hypothyroidism by improving insulin sensitivity. Intern Emerg Med. 2020;15(1):67-71. doi: 10.1007/s11739-019-02065-9
» https://doi.org/10.1007/s11739-019-02065-9 -
39 Wu Z, Jiang Y, Li P, Wang Y, Zhang H, Li Z, et al. Association of impaired sensitivity to thyroid hormones with hyperuricemia through obesity in the euthyroid population. J Transl Med. 2023;21(1):436. doi: 10.1186/s12967-023-04276-3
» https://doi.org/10.1186/s12967-023-04276-3 -
40 Xie H, Li N, Zhou G, He Z, Xu X, Liu Q, et al. The association between the thyroid feedback quantile-based index and serum uric acid in U.S. adults. Eur J Med Res. 2023;28(1):259. doi: 10.1186/s40001-023-01214-3
» https://doi.org/10.1186/s40001-023-01214-3 -
41 Sun Y, Teng D, Zhao L, Shi X, Li Y, Shan Z, et al. Impaired sensitivity to thyroid hormones is associated with hyperuricemia, obesity, and cardiovascular disease risk in subjects with subclinical hypothyroidism. Thyroid. 2022;32(4):376-84. doi: 10.1089/thy.2021.0500
» https://doi.org/10.1089/thy.2021.0500 -
42 Lu Y, Wang J, An Y, Liu J, Wang Y, Wang G, et al. Impaired sensitivity to thyroid hormones is associated with hyperuricemia in a Chinese euthyroid population. Front Endocrinol (Lausanne). 2023;14:1132543. doi: 10.3389/fendo.2023.1132543
» https://doi.org/10.3389/fendo.2023.1132543 -
43 Emdin CA, Khera AV, Kathiresan S. Mendelian randomization. JAMA. 2017;318(19):1925-6. doi: 10.1001/jama.2017.17219
» https://doi.org/10.1001/jama.2017.17219 -
44 Song S, Jia C, Li C, Ma Y. The causal association between thyroid disease and gout: a Mendelian randomization study. Medicine (Baltimore). 2023;102(44):e35817. doi: 10.1097/md.0000000000035817
» https://doi.org/10.1097/md.0000000000035817 -
45 Kunisue T, Eguchi A, Iwata H, Tanabe S, Kannan K. Analysis of thyroid hormones in serum of Baikal seals and humans by liquid chromatography-tandem mass spectrometry (LC-MS/MS) and immunoassay methods: application of the LC-MS/MS method to wildlife tissues. Environ Sci Technol. 2011:45:10140-7. doi: 10.1021/es203002a
» https://doi.org/10.1021/es203002a -
46 Jin Y, Zhai T, Wang Y, Li J, Wang T, Huang J. Recent advances in liquid chromatography-tandem mass spectrometry for the detection of thyroid hormones and thyroglobulin in clinical samples: A review. J Sep Sci. 2024:47:e2400466. doi: 10.1002/jssc.202400466
» https://doi.org/10.1002/jssc.202400466 -
47 Liu B, Wang Z, Fu J, Guan H, Lyu Z, Wang W. Sensitivity to thyroid hormones and risk of prediabetes: a cross-sectional study. Front Endocrinol. 2021:12:657114. doi: 10.3389/fendo.2021.657114
» https://doi.org/10.3389/fendo.2021.657114 -
48 Choi HK, Curhan G. Beer, liquor, and wine consumption and serum uric acid level: the Third National Health and Nutrition Examination Survey. Arthritis Rheum. 2004;51:1023-9. doi: 10.1002/art.20821
» https://doi.org/10.1002/art.20821 -
49 Choi HK, Atkinson K, Karlson EW, Willett W, Curhan G. Alcohol intake and risk of incident gout in men: a prospective study. Lancet. 2004;363:1277-81. doi: 10.1016/s0140-6736(04)16000-5
» https://doi.org/10.1016/s0140-6736(04)16000-5 -
50 Li Z, Guo X, Liu Y, Chang Y, Sun Y, Zhu G, et al. The relation of moderate alcohol consumption to hyperuricemia in a rural general population. Int J Environ Res Public Health. 2016:13:732. doi: 10.3390/ijerph13070732
» https://doi.org/10.3390/ijerph13070732

 Thumbnail
 Thumbnail
 Thumbnail
 Thumbnail
 Thumbnail
 Thumbnail
 Thumbnail
 Thumbnail
 Thumbnail
 Thumbnail
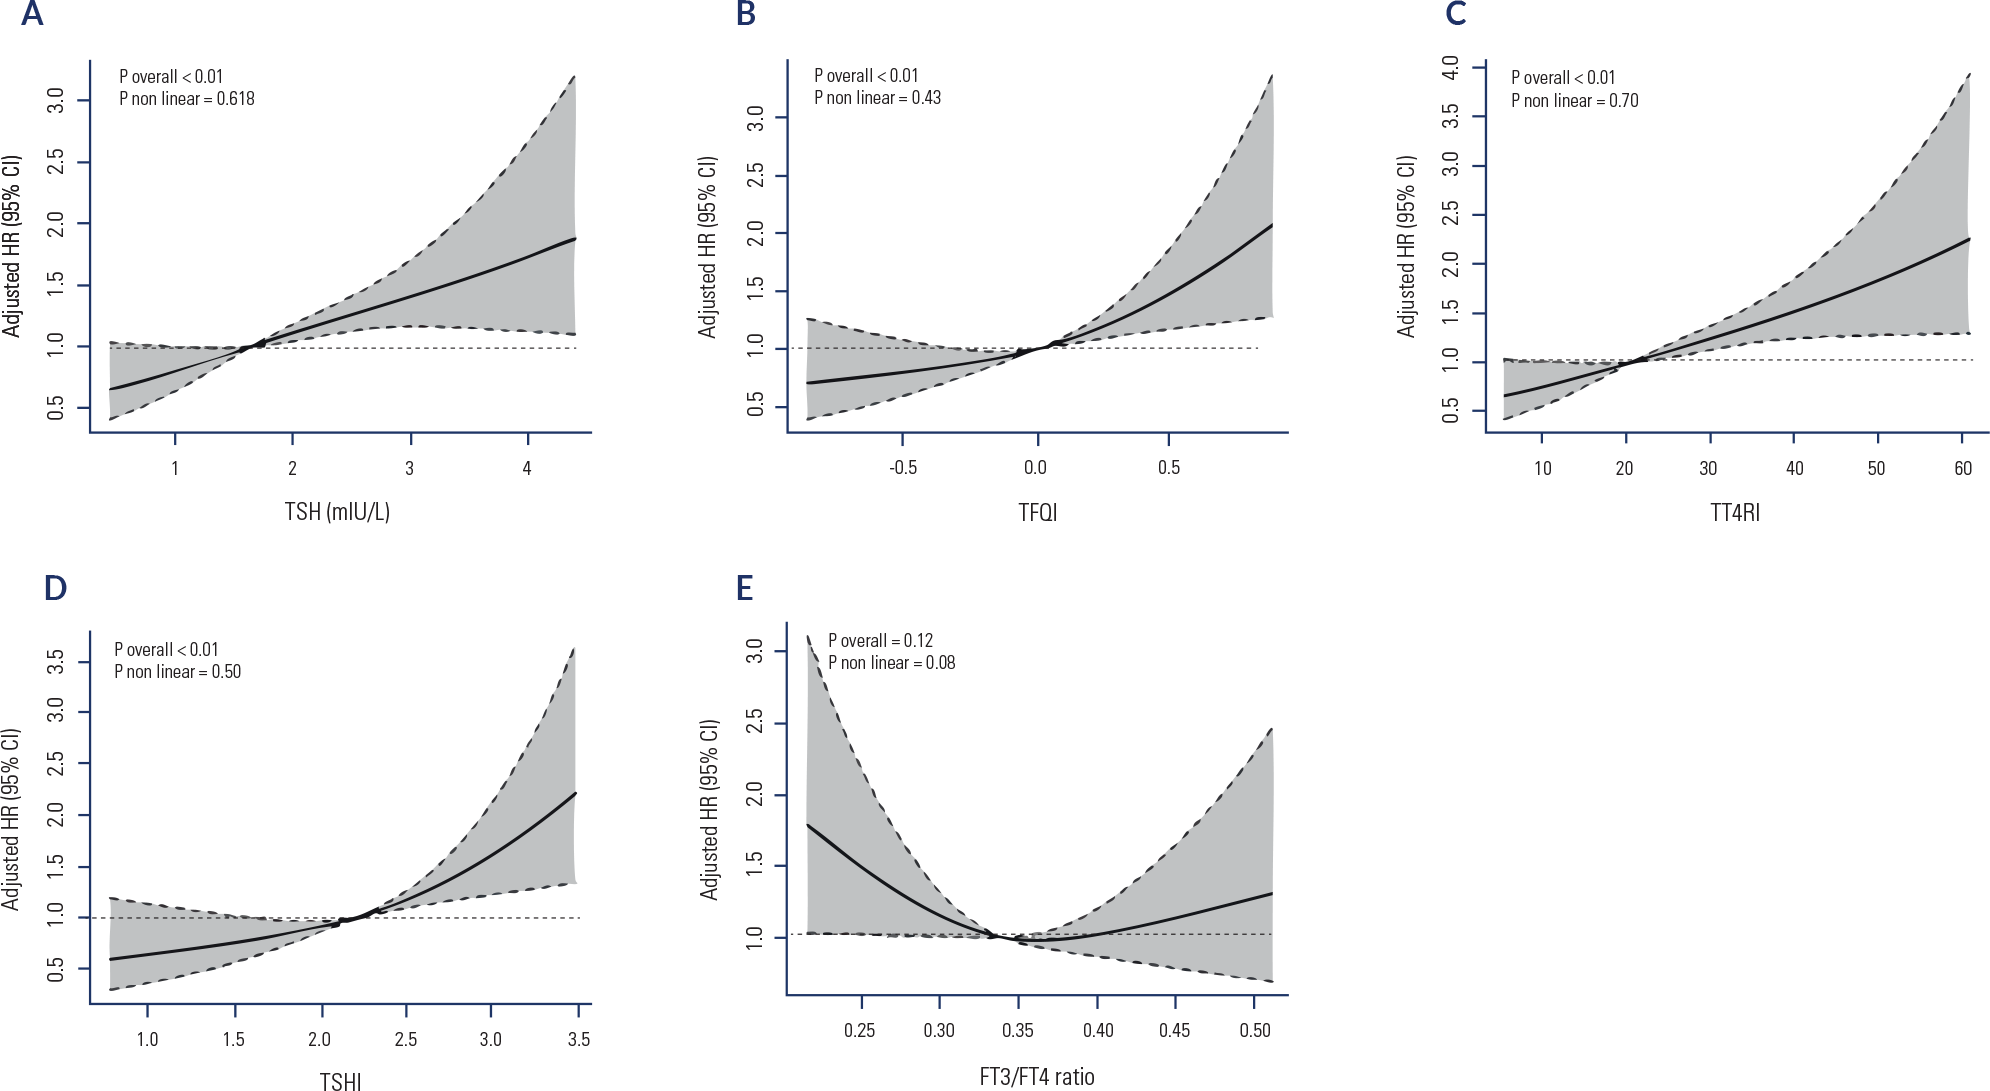 A. The dose-response relationships between TSH and the risk of hyperuricemia; B. The dose-response relationships between TFQI and the risk of hyperuricemia; C. The dose-response relationships between TT4RI and the risk of hyperuricemia; D. The dose-response relationships between TSHI and the risk of hyperuricemia; E. The dose-response relationships between FT3/FT4 ratio and the risk of hyperuricemia. The results were adjusted for age, sex, BMI, current smoking, heavy drinking, hypertension, diabetes, dyslipidemia, ALT, AST, and eGFR.Abbreviations: RCS, restricted cubic spline; TSH, thyroid-stimulating hormone; TFQI, thyroid feedback quantile-based index; TT4RI, thyrotrophic thyroxine resistance index; TSHI, thyroid-stimulating hormone index; FT3/FT4 ratio, free triiodothyronine to free thyroxine ratio.