
 Processing of audio files for the construction of speech recognition tests in portuguese
ABSTRACT
Purpose To develop computational codes for the automated modification of large quantities of sentence recordings, capable of performing format modifications, filtering, simulating sound signal processing in cochlear implants, and adjusting root mean square amplitude to equalize perceived volume between sentences.
Methods Python codes were developed for the intended processes, using the Spyder interface and packages such as pydub, soundfile, os, and numpy. The codes were tested on two sets of previously recorded audio files in Brazilian Portuguese, in .MP3 and .WAV formats.
Results Codes were implemented for 1) file format modification, 2) fade-in and fade-out adjustment, 3) high-pass filtering, 4) optional vocoderization, and 5) adjustment of root mean square amplitude. Testing the developed codes on two sets of sentence recordings available in .WAV and .MP3 formats in Portuguese showed consistent results as expected.
Conclusion Python codes were developed for the automated modification of audio files, available on the GitHub website for further adaptations and improvements by third parties.
Keywords:
Audiology; Signal processing computer-assisted; Hearing tests; Cochlear implantation; Computer simulation
RESUMO
Objetivo desenvolver códigos computacionais para modificação automatizada de grandes quantidades de sentenças gravadas, que realizem modificações de formato, filtragens, simulem o processamento dos sinais sonoros em implantes cocleares e ajustem as médias quadráticas de amplitude, a fim de equalizar o volume sonoro percebido entre sentenças.
Métodos para os diferentes processamentos pretendidos, foram desenvolvidos códigos em Python, usando as interfaces Spyder e pacotes tais como o pydub, soundfile, os e numpy. Os códigos foram testados em dois conjuntos de arquivos de áudio gravados previamente em português brasileiro, nos formatos .MP3 e .WAV.
Resultados foram implementados códigos para modificação do formato dos arquivos, ajuste de fade-in e fade-out, filtragem de passa-alta, vocoderização opcional e ajuste das médias quadráticas das amplitudes. Os testes dos códigos desenvolvidos em dois conjuntos de sentenças disponíveis em .WAV e .MP3 na língua portuguesa demonstraram resultados consistentes com o esperado.
Conclusão desenvolveram-se códigos na linguagem Python para modificação de maneira automatizada de arquivos de áudio, disponíveis no site GitHub para adaptações e aprimoramentos por terceiros.
Palavras-chave:
Audiologia; Processamento de sinais assistido por computador; Testes auditivos; Implante coclear; Simulação por computador
INTRODUCTION
Hearing loss impairs individuals’ communication, social interaction, and quality of life(1). It is estimated that by the year 2050, approximately 2.5 billion people will have hearing loss, of whom 700 million may require some form of treatment(2), which, in turn, requires clinical instruments capable of functionally assessing hearing performance.
Speech recognition assessment plays a central role in audiological practice, allowing for an estimation of an individual’s ability to understand speech in situations resembling everyday demands, taking into account spectrotemporal and linguistic aspects(3). It is applied to different clinical populations, including individuals with hearing loss of varying degrees, users of hearing aids (HA), and cochlear implant (CI) candidates and users(4).
Depending on the target population (adults, children, users of HDA/CI or non-users), there are different ways to assess speech recognition, which may involve not only variations in assessment procedures and speech material (isolated words or sentences), the presence of competitive noise, the number of speakers, phonetic balance, and validation procedures, but also specific methods for preparing speech audio samples(5). For example, in the specific case of assessing speech recognition in CI users, it must be considered that acoustic signal processing in the auditory system with a CI differs from natural acoustic hearing, since, in a CI, the sound stimulus is converted into electrical signals distributed across a limited number of channels, resulting in reduced spectral resolution and significant temporal alterations(6). Due to the degradation intrinsic to electrical processing, CI users may exhibit a ceiling effect when exposed to speech materials with high linguistic predictability, limiting the test’s sensitivity(7). This intrinsic degradation can be simulated using a vocoder(8). In individuals with normal hearing, speech recognition assessment primarily involves the use of competitive noise, without the need to simulate cochlear degradation(5).
In Brazil, according to research, the main tests used include the Hearing in Noise Test (HINT), adapted for the Portuguese language, the Listas de Sentenças em Português and the Listas de Sentenças do Centro de Pesquisas Audiológicas (CPA). Although they represent significant advances in national standardization, each of these instruments has its own characteristics, with specific advantages and limitations(9) .
The Hearing in Noise Test (HINT)(10) was developed to assess the intelligibility of sentences in the presence of competitive noise, allowing for the estimation of recognition thresholds under controlled conditions. Its main advantage lies in the standardization of the procedure and its broad clinical applicability. However, the cost of the material is high for clinical use, and the test was initially validated for people with normal hearing.
The Listas de Sentenças em Português Test(11) is widely used in Brazilian clinical practice, and several studies recognize its applicability and clinical relevance. However, it is available only on compact disc, and its administration requires the audiologist to manually adjust speech and noise levels during the procedure, which can introduce variability in test conditions.
The Listas de Sentenças do Centro de Pesquisas Audiológicas (CPA)(12) are also widely used in national clinical practice, especially in CI services, featuring a structured organization and established use. The material consists of phonetically balanced sentences, but as the literature points out, its administration occurs predominantly in spoken form, with no uniformity in administration procedures across different services(9).
Internationally, various instruments are used to assess speech recognition, including the original version of the HINT, the Bamford-Kowal-Bench Speech-in-Noise Test (BKB-SIN), the Quick Speech-in-Noise (QuickSIN), and the Words-in-Noise (WIN), for evaluating both individuals with normal hearing and those with hearing loss(13). Furthermore, the AzBio Sentence Test (14) was developed for the assessment of individuals with severe to profound hearing loss and CI users. The test uses multiple speakers with unpredictable sentences, organized into statistically equivalent lists. Studies demonstrate greater sensitivity in distinguishing performance levels among cochlear implant recipients compared to the HINT, reducing the occurrence of the ceiling effect(15). Tests already validated and used in various countries with different languages(16) are good options for adaptation to Brazilian Portuguese, offering accurate and reliable assessment and filling a gap in tests validated in Brazil.
In any case, the validity and reliability of speech perception tests in audiological practice depend on the methodological rigor employed in the construction and standardization of the acoustic stimuli used, making it imperative that the recording and manipulation of these stimuli in the process of developing speech recognition tests be carried out meticulously and standardized across large numbers of audio files(14,17) modifications typically include filtering of unwanted frequencies, volume equalization, removal or insertion of pauses, and smoothing of transitions, among others(18). Furthermore, with the aim of developing speech recognition tests for cochlear implant users, a vocoder may also be employed as a tool to simulate the device’s signal processing, replicating the transformation of acoustic signals into electrical stimulation(19).
Given the complexity of the various processing steps required for a large number of audio files, especially during the test development process, it is clear that these processing steps must not only be performed carefully and in a standardized manner but also in an automated way. Such processing is possible using digital signal processing tools, with appropriate process automation.
In light of this need, and to support the development of new speech recognition tests in Brazil, including Brazilian versions of established tests, a set of signal processing codes and computational routines was developed to automate various tasks required for the manipulation of pre-recorded audio material (sentences). Although initially created for the manipulation of sentence recordings from a specific test, the set of codes can be applied to other speech recognition test proposals.
PRINCIPLES OF DIGITAL SIGNAL PROCESSING AIMED AT STANDARDIZING SPEECH STIMULI
With the transition from analog technology to the computational—and thus digital—environment, Digital Signal Processing (DSP) has become a useful and indispensable tool for the analysis and manipulation of a wide variety of signal types, including audio signals and speech signals(20). The fundamental concepts of DSP in the context of this study are presented below.
Audio formats
A digital audio format is, essentially, the method or container used to encode and store the sound signal in digital format, and the different available formats determine both the fidelity of this representation and options such as multiple channels, spatialization, etc. The most common formats for audio signals are currently .WAV and MP3. While the .WAV (Waveform Audio File Format) stores the most accurate digital representation possible of the original sound wave, .MP3 is a “lossy” compression format that employs algorithms to discard spectral information considered inaudible to the human auditory system in order to reduce file size(21).
Digital filtering and the Butterworth high-pass filter
Digital filtering is a (mathematical) operation that modifies the frequency content (spectrum) of a signal, allowing certain frequency bands to pass through while attenuating or blocking others. In the context of audio signal processing, filtering can be used to remove unwanted low-frequency noise, which is very commonly present in recordings due to structural vibrations, the impact of airflow on the microphone, or electrical network interference(22). Depending on the frequency range to be removed and the frequency range to be preserved, different types of filters (low-pass, high-pass, band-reject, or band-reduce filters) can be employed. To remove low-frequency spectral content from audio signals, a "high-pass filter" is used, with the Butterworth filter being the most common type. Characterized by a "maximally flat" frequency response in the passband, it does not create spectral distortions and, therefore, does not alter the timbre in the preserved part of the spectrum. The transition between the rejected frequency range and the preserved frequency range is governed by the filter’s “order,” with filters of higher order resulting in more selective filtering. However, an increase in filter order raises the computational cost of processing and can generate other problems, such as the ringing effect (an audible residual effect in the audio), which occurs due to an overly oscillatory impulse response. Therefore, the choice of order requires an appropriate compromise between the effectiveness of noise removal and the preservation of the stimulus’s temporal characteristics(20).
Transient smoothing - Fade-in and Fade-out
The recording and segmentation of speech signals often introduce small discontinuities in the time domain, specifically at the cut-off points where the signal amplitude, although very small and nearly inaudible, differs from zero. During playback, this imperfect transition from a non-zero value, however small, to zero generates a broadband spectral transient, audible as an unwanted click. To mitigate this artifact, fade-in and fade-out envelopes are applied by multiplying the samples at the signal’s ends by a smooth windowing function, which smoothly modulates the amplitude from zero to the signal’s nominal value (fade-in) and vice versa (fade-out). With time windows in the order of milliseconds, the technique ensures a smooth transition without audible artifacts(23).
Amplitude normalization - RMS (Root Mean Square) adjustment in dBFS (Decibels Full Scale)
For the items (sentences) of a speech test to be clinically comparable, they must also be calibrated to provide the same perceived volume to the listener. For signals with similar spectra, which applies to sentence signals, standardization can be achieved by equalizing the RMS value of the dependent variable, which reflects the signal’s average energy over time(24). Given the use of .WAV or .MP3 digital formats, the RMS value is adjusted on a digital scale called dBFS1 . It should be noted that the playback sound pressure level (SPL), in terms of dB SPL (sound pressure level in decibels), obtained when playing the signal through speakers or headphones will depend on the software and equipment used for playback. However, assuming linearity and time-invariance in this playback system, the fact that sound files exist with the same root-mean-square amplitude expressed on the dBFS scale helps ensure that, during playback, the playback sound pressure level (dB SPL) also exhibits relative consistency across stimuli(17,20).
Vocoder
In the context of acoustic simulation of hearing via cochlear implant (CI), vocoders, such as AngelSim(25), operate fundamentally as spectral degradation models strictly based on successive stages of digital signal processing. Initially, the input signal is subjected to a bank, or set, of bandpass filters, dividing the frequency spectrum into a limited number of analysis channels, which mimics the discrete spectral resolution imposed by the intracochlear electrode array. In each analysis channel, the temporal envelope of the amplitude is extracted — typically through rectification (half-wave or full-wave), followed by low-pass filtering, emulating the pulse stimulation rate transmitted to the electroneural interface. This low-frequency envelope is then used to amplitude-modulate a synthesized carrier signal, which can be narrowband noise or a pure tone. The superposition of all modulated channels synthesizes a final acoustic stimulus, characterized by severe spectral smearing and the loss of fine-structure cues. Consequently, the prioritization of coarse temporal cues forces the listener’s central auditory system to recruit the same top-down neurocognitive mechanisms of perceptual closure required of a CI user for speech extraction and decoding(26).
METHODS
Materials used
The audio material recorded in Brazilian Portuguese available for this study consisted of two distinct sets of sentences, intended for different speech recognition test designs. Since they were recorded by third parties, there was no access to documentation regarding the linguistic criteria used to construct the lists, and there was no direct interaction with the recording participants, eliminating the need for approval by the institution’s Human Research Ethics Committee (CEPSH) and the signing of the Informed Consent Form (ICF). Although they had different origins and purposes, both materials presented typical technical inconsistencies, such as large variations in volume and background noise, and were therefore considered excellent materials to be processed by the signal processing routines developed in this study.
Set A of sentences consisted of 987 sentences recorded in a professional studio by third parties. The material was recorded by four speakers (two male and two female). The first male speaker recorded 248 sentences, while the second recorded 231. Regarding the female speakers, the first recorded 257 sentences and the second, 251. The recordings were made available for this study in .MP3 format, with a sampling rate of 44,100 Hz.
Set B consisted of 106 sentence recordings for the construction of a speech perception assessment for children who speak Brazilian Portuguese, spoken by a single female speaker. These recordings were available in .WAV format, with a sampling rate of 44,100 Hz.
Signal processing applied to the study
Given the large number of existing files, the acoustic processing steps were performed using automated computational routines written in the Python programming language (version 3.10), a high-level language used for scientific and signal processing applications. Development was conducted in the Spyder environment (Anaconda distribution).
Various libraries and packages were used to perform specific functions focused primarily on modifying audio files. Libraries are collections of modules that implement various predefined functions and methods, as well as classes, to efficiently perform specific tasks. They allow the use of existing code, simplifying processes(27).
For example, the soundfile and pydub libraries were used for the proper manipulation of audio files, while the os and numpy libraries were used for managing and manipulating file paths and numeric arrays , respectively. The scipy library was used for statistical functions, aiding in the analysis and processing of the sound data. To facilitate access by other researchers in the field, the source code was made available in its entirety in a public repository on the GitHub platform.
The file processing steps were configured as follows:
-
Format standardization: initially, the .MP3 files were converted to the .WAV format, ensuring that all files had the same initial characteristics in terms of audio format;
-
Temporal smoothing: A fade-in and fade-out ramp, each lasting 1 ms, and half-wave cosine envelopes were applied to eliminate audible artifacts during the transition between sentences in playback;
-
High-pass filtering: To eliminate low-frequency ambient noise that contaminated the recordings, a 5th-order Butterworth filter with a cutoff frequency of 80 Hz was implemented. The 80 Hz cutoff frequency eliminates the most noticeable noise in the recordings, including 60 Hz power line noise, while preserving the lower frequencies of the male voice (fundamental frequency near 110 Hz)(20,28);
-
Cochlear implant simulation (vocoder): to simulate the auditory perception of cochlear implant users, batch processing of a vocoder (AngelSimTM) was used. In this study, the parameters used in AngelSim were: sinusoidal carrier wave; 3 and 5 spectral channels/3 and 5 stimulated channels; Greenwood mapping(29); analysis filter bank 200 Hz to 7000 Hz and 24 dB slope; lower cutoff frequency of the envelopes 160 Hz, high-pass filter with a slope of 24 dB/octave. The synthesis parameters corresponded to the values defined in the analysis stage to ensure consistency between envelope extraction and signal reconstruction;
-
Amplitude equalization: the root mean square (RMS) values of all sentences were normalized to a target value of -20 dBFS. The process of adjusting the RMS values comprises several steps: loading the files, calculating the current RMS, defining the desired RMS value, calculating the scaling factor to adjust the RMS to the desired value, and applying the correction to the signal amplitudes. Although the audio data was already represented in floating-point format at this stage of the processing workflow, conversion to floating-point was performed when necessary, especially for files originally encoded in integer format, in order to ensure greater precision in the mathematical operations involved in the RMS adjustment. After normalization, a standardized silence interval was inserted at the beginning and end of the files. This step was performed after the RMS adjustment to avoid interfering with the normalized level, considering that the original silences, of varying duration, had been previously removed.
Acoustic calibration
Finally, several sound files adjusted by the codes were played back through a sound reproduction system with GENELEC speakers, and their sound pressure levels were measured using an SQuadriga II measurement system with a GRAS 46AQ condenser microphone. The measurement system was previously calibrated with the Larson Davis CAL200 calibrator.
RESULTS
All necessary signal processing steps, achieved using the implemented codes for validation purposes, were organized into different stages, as shown in the schematic in Figure 1. Some of the stages were mandatory, while others were optional, such as vocoderization, which is only necessary if one wishes to simulate the effect of a cochlear implant.
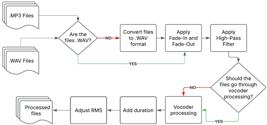
Audio files in .MP3 format were initially converted using code to the .WAV format, even though the information lost during .MP3 compression could not be recovered when converting the file to .WAV.
With regard to the application of fade-in and fade-out, Figure 2, Panel A, shows the time history of a sample file from Set A before and after processing, highlighting the difference between the gray color for the sentence before any modification and the blue color, which represents the sentence after the application of fade-in, fade-out, and the high-pass filter. The observed differences were quite significant, demonstrating that fade-in and fade-out affect the amplitudes at the beginning and end of the audio signal.

Preprocessing of audio signals. (A) Time history of the audio signal before and after the application of fade-in/fade-out, silence removal, and high-pass filtering; (B) Magnitude and phase spectrum of the frequency response of the Butterworth high-pass filter, with a cutoff frequency of 80 Hz
The filtering process using the high-pass filter can best be demonstrated by comparing the magnitude spectrograms of the audio signal before (Figure 3, panel A) and after (Figure 3, panel B) the application of the filter. The magnitude spectrogram in Figure 3, panel A, shows that the original sample file was contaminated with low-frequency energy (<80 Hz), and that this low-frequency energy was present even before and after the speech signal, clearly demonstrating that it was noise unrelated to the speech signal. The section containing the speech is indicated by a red box. The spectrogram in Figure 3, panel B, shows that the filter satisfactorily removed the low-frequency contamination while preserving the frequencies of the speech signal.

Spectrograms of the sound signals at different stages. (A) Spectrogram of the audio signal before applying fade-in/fade-out, silence removal, and high-pass filtering; (B) Spectrogram of the audio signal after applying fade-in/fade-out, silence removal, and high-pass filter; (C) Spectrogram of the audio signal after processing with a five-channel tonal vocoder
Vocoderization, an optional step, was performed using different vocoder settings, as described in the section “Signal processing applied to the study”. It created considerable modifications in the spectrum and temporal definition of the sounds, approximating the way a cochlear implant presents sounds to the user of that device. Figure 4 Panel A and Figure 4 Panel B present, over time, an example signal and its modification after vocoder processing in the file. Figure 3, panel C, shows the spectrogram of the audio signal after passing through the vocoder, with the modifications applied, highlighting the changes in the signal compared to the spectrogram shown in Figure 3, panel B, particularly the loss of frequency resolution typical of signals processed by cochlear implants.

Temporal history of the audio signals. (A) Temporal record of an audio file before the five-channel tonal vocoderization process; (B) Temporal record of the same file after the five-channel tonal vocoderization process
To evaluate the correct functioning of the code that adjusts the root mean square (RMS) of the amplitudes to a target level, in order to ensure that all sentences (audio files) evoked the same sensation of sound volume, the two sets of Brazilian Portuguese sentences available for testing the codes were processed. Set A was processed both without vocoderization and after undergoing the vocoderization process. Set B, on the other hand, was processed only without vocoderization. The root mean square of all sets was adjusted to a target level of -20 dBFS. Figure 5, panel A, shows, in blue, the distribution of the root mean square (RMS) values of the amplitudes of the set of 987 files from set A of sentences before RMS adjustment, using the implemented code. A wide variation in the RMS values of the amplitudes was observed, which would cause significant differences in the perception of sound volume and possibly in the recognition of the different sentences.
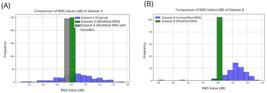
Distribution of Root Mean Square values. (A) Histogram of the distribution of Root Mean Square values for Set A, before and after the processes (Root Mean Square adjustment and vocoder); (B) Histogram of the distribution of Root Mean Square levels for Set B, before and after the processes
Adjusting the mean square amplitudes of the sentences in set A to a target value of -20 dBFS, without applying the vocoder, resulted in mean square amplitudes with a mean and median of -20 dBFS, with a standard deviation of only 0.01 dBFS, as shown in Figure 5, panel A, in green.
However, for the same set of sentences A, after applying the vocoder, the automatic adjustment to a target level of -20 dBFS resulted in a mean and median of the adjusted amplitudes of -20.34 dBFS and -20.31 dBFS, respectively, with a standard deviation of 0.12 dBFS and a maximum difference of 0.8 dBFS, as shown in Figure 5, panel A, in gray. Thus, a slightly greater variation is observed in sentences that passed through the vocoder, although it is less than 1 dB.
Set B of files was also processed by all Python codes, with the exception of the vocoderization step. All sentences in this set also had their root-mean-square amplitude levels adjusted by the codes to a target value of -20 dBFS. Figure 5 panel B shows a histogram of the root mean square amplitude levels of the folder containing 106 audio files from this set before the adjustment was applied, shown in blue, indicating that the root mean square levels ranged from -28 dBFS to -14 dBFS, although most files had root mean square levels between -20 dBFS and -14 dBFS. Figure 5, panel B, in green, shows the root-mean-square levels of the same selection of files after adjusting the root-mean-square levels to the target level of -20 dBFS. The histogram shows that the adjustment was very precise, with the mean RMS at -20 dBFS, the median RMS also at -20 dBFS, and a standard deviation of 0.04 dBFS.
Upon completion of all processing steps, all files had been modified. They were saved in .WAV format with a sampling rate of 44,100 Hz and RMS values very close to or equal to -20 dBFS.
Finally, verification of the sound volume of the sentences, when played back in a controlled environment, showed that the sound pressure levels one meter away from the sound source ranged from 65.4 to 66.4 dB SPL, a variation below the JND (Just Noticeable Difference) measured in practice for sound pressure level.
DISCUSSION
The speech signal processing codes developed in Python were evaluated against different quality aspects, which are fundamental for the validation of speech recognition tests. It was found that the automated application of fade-in and fade-out, illustrated in Figure 2, panel A, and suggested in the literature, provided smooth sound transitions at the ends of the audio signal, minimizing abrupt and audible discontinuities in all processed signals(20,21).
The application of a 5th-order Butterworth high-pass filter with a cutoff frequency of 80 Hz proved effective in removing unwanted low-frequency spectral components, including interference associated with the electrical grid. The choice of cutoff frequency was based on the typical spectral distribution of speech, considering that the average fundamental frequency of the male voice is around 110 Hz, the power grid frequency (60 Hz), and the frequencies of acoustic noise observed in the original recordings, such that attenuation below 80 Hz removes unwanted noise without compromising linguistic content(20,22,29).
Adjusting the RMS values to a target value (-20 dBFS) resulted in high homogeneity of the RMS values of the sentences, with variations of less than 1 dBFS, even after the vocoderization stage. Considering the 1 dB threshold for perceiving changes in loudness(30), the results indicated effective control of the “presentation level” variable, a factor that can potentially influence performance on speech recognition tests. The slight increase in variability after vocoderization was expected, due to the spectral redistribution of energy caused by channel processing, but it did not exceed clinically relevant limits(10,24).
Vocoderization of the sentences, performed using batch processing in external software (AngelSim) with three and five spectral channels, produced spectrotemporal changes consistent with the classic description of cochlear implant simulation, in which a smaller number of channels reduces spectral resolution and increases reliance on temporal cues. Spectral blurring and fine-structure restriction effects, observed in the presented graphs, confirmed what was expected for vocoders(19,26). This controlled simulation allows for investigating the impact of different processing configurations prior to clinical applications.
Free-field acoustic measurement demonstrated a sound pressure level variation of less than 1 dB between stimuli, indicating that digital standardization was consistently reflected in the physical environment(10,24).
In addition to its technical rigor, the system’s operational feasibility stands out, with 987 sentences processed in approximately 40 minutes. This automation reduces human errors inherent in manual audio editing and promotes methodological reproducibility. In the future, we intend to develop a graphical user interface (GUI) to facilitate the use of the codes by researchers unfamiliar with the Python programming language, thereby expanding access to evidence-based speech processing tools.
CONCLUSION
Given the need for a computational tool for the rapid automated modification of large quantities of audio files, particularly sentence recordings, codes were developed in the Python programming language. These codes do not need to be used exclusively as presented in this study but can be adapted for use according to the needs of each application.
These codes are available on the GitHub website, with open access to the scientific community and the possibility of improving the techniques presented, named Codigos_Processamento_Sinal_de_Fala.
-
1
The term dBFS is not usually translated into Portuguese and is used in its original form (decibels relative to full scale). The most accurate technical translation would be “decibels relative to full scale (digital).” In instrumentation, “full scale” corresponds to the maximum value that a system or scale can represent before saturation (clipping) occurs. Unlike scales such as dB SPL, dBFS uses the maximum digital level as a reference, defined as 0 dBFS; all other values are expressed as negative numbers (for example, −18 dBFS).
-
Study carried out at Laboratory of Vibrations and Acoustics – LVA, Universidade Federal de Santa Catarina – UFSC – Florianópolis (SC), Brasil.
-
Data Availability Statement:
Research data is not available.
-
Funding:
Cochlear Latinoamerica S.A.
References
-
1 Força MT, Cal RVR, Santos SR, Pereira LC, Boas GPV, Zell RGA, et al. Análise comparativa da percepção da perda auditiva com o resultado da audiometria em pacientes adultos e idosos do Hospital Bettina Ferro de Souza/PA. BJHR. 2020;3(6):17457-73. https://doi.org/10.34119/bjhrv3n6-162
» https://doi.org/10.34119/bjhrv3n6-162 -
2 WHO: World Health Organization. World report on hearing [Internet]. Geneva: WHO; 2021 [citado em 2025 junho 25]. Disponível em: https://www.who.int/publications/i/item/9789240020481
» https://www.who.int/publications/i/item/9789240020481 -
3 Costa LD, Vaucher AVA, Pagliarin KC, Costa MJ. Teste de palavras no ruído: desenvolvimento, validação e valores de referência. CoDAS. 2024;36(3):e20230091. https://doi.org/10.1590/2317-1782/20242023091en PMid:38836822.
» https://doi.org/10.1590/2317-1782/20242023091en -
4 Campos Salvato C, Araújo SRS, Muller R, Soares AD, Chiari BM. Correlação entre reconhecimento de fala, tempo de privação auditiva e tempo de uso de Implante Coclear em usuários com surdez pós-lingual. Distúrb Comun. 2020;32(3):396-405. https://doi.org/10.23925/2176-2724.2020v32i3p396-405
» https://doi.org/10.23925/2176-2724.2020v32i3p396-405 -
5 Ferreira MC, Zamberlan-Amorim NE, Wolf AE, Reis ACMB. Influence of different types of noise on sentence recognition in normally hearing adults. Rev CEFAC. 2021;23(5):e2121. https://doi.org/10.1590/1982-0216/20212352121
» https://doi.org/10.1590/1982-0216/20212352121 -
6 Wilson BS, Dorman MF. Cochlear implants: current designs and future possibilities. JRRD. 2008;45(5):695-730. https://doi.org/10.1682/JRRD.2007.10.0173 PMid:18816422.
» https://doi.org/10.1682/JRRD.2007.10.0173 -
7 Gifford RH, Shallop JK, Peterson AM. Speech recognition materials and ceiling effects: considerations for cochlear implant programs. Audiol Neurootol. 2008;13(3):193-205. https://doi.org/10.1159/000113510 PMid:18212519.
» https://doi.org/10.1159/000113510 - 8 Johnson PA, McNamara DM, Ziarani AK. A novel VOCODER for cochlear implants. In: 30th Annual International Conference of the IEEE Engineering in Medicine and Biology Society; 2008; Vancouver, BC. New York: IEEE; 2008. p. 4732-5.
-
9 Pinheiro MMC, Vieira MG, Vieira LM, Koerich I, Rosseto I, Lazzarotto-Volcão C, et al. Adaptação de listas de sentenças para avaliação da percepção da fala. CoDAS. 2022;34(1):e20200301. https://doi.org/10.1590/2317-1782/20202020301 PMid:35019063.
» https://doi.org/10.1590/2317-1782/20202020301 -
10 Sbompato AF, Corteletti LCBJ, Moret ADLM, Jacob RTDS. Hearing in Noise Test Brazil: standardization for young adults with normal hearing. Braz J Otorhinolaryngol. 2015;81(4):384-8. https://doi.org/10.1016/j.bjorl.2014.07.018 PMid:26130593.
» https://doi.org/10.1016/j.bjorl.2014.07.018 - 11 Costa MJ. Listas de sentenças do português. Santa Maria: Pallotti; 1998. 48 p.
- 12 Valente SLO. Elaboração de listas de sentenças construídas na língua portuguesa [dissertação]. São Paulo: Pontifícia Universidade Católica; 1998.
-
13 Wilson RH, McArdle RA, Smith SL. An evaluation of the BKB-SIN, HINT, QuickSIN, and WIN materials on listeners with normal hearing and listeners with hearing loss. J Speech Lang Hear Res. 2007;50(4):844-56. https://doi.org/10.1044/1092-4388(2007/059) PMid:17675590.
» https://doi.org/10.1044/1092-4388(2007/059) -
14 Spahr AJ, Dorman MF, Litvak LM, Van Wie S, Gifford RH, Loizou PC, et al. Development and validation of the AzBio sentence lists. Ear Hear. 2012;33(1):112-7. https://doi.org/10.1097/AUD.0b013e31822c2549 PMid:21829134.
» https://doi.org/10.1097/AUD.0b013e31822c2549 -
15 Massa ST, Ruckenstein MJ. Comparing the performance plateau in adult cochlear implant patients using HINT and AzBio. Otol Neurotol. 2014;35(4):598-604. https://doi.org/10.1097/MAO.0000000000000264 PMid:24557031.
» https://doi.org/10.1097/MAO.0000000000000264 -
16 Jung C, Shah KV, Ferraro T, Bigelow DC, Ruckenstein MJ, Peng-Hwa T. Non-english validation of the azbio sentence test: a systematic review of current applications and early adoption patterns. Otol Neurotol. 2026;47(1):e8391. https://doi.org/10.1097/MAO.0000000000004663 PMid:41145396.
» https://doi.org/10.1097/MAO.0000000000004663 -
17 Nilsson M, Soli SD, Sullivan JA. Development of the Hearing In Noise Test for the measurement of speech reception thresholds in quiet and in noise. J Acoust Soc Am. 1994;95(2):1085-99. https://doi.org/10.1121/1.408469 PMid:8132902.
» https://doi.org/10.1121/1.408469 -
18 Upadhyay N, Karmakar A. A multi-band speech enhancement algorithm exploiting iterative processing for enhancement of single channel speech. J Signal Inf Process. 2013;4(2):197-211. https://doi.org/10.4236/jsip.2013.42027
» https://doi.org/10.4236/jsip.2013.42027 -
19 Karoui C, James C, Barone P, Bakhos D, Marx M, Macherey O. Searching for the sound of a cochlear implant: evaluation of different vocoder parameters by cochlear implant users with single-sided deafness. Trends Hear. 2019;23:2331216519866029. https://doi.org/10.1177/2331216519866029 PMid:31533581.
» https://doi.org/10.1177/2331216519866029 -
20 Välimäki V, Reiss J. All about audio equalization: solutions and frontiers. Appl Sci. 2016;6(5):129. https://doi.org/10.3390/app6050129 ]
» https://doi.org/10.3390/app6050129 - 21 Raj VA, Dhas MDK. Analysis of audio signal using various transforms for enhanced audio processing. Int J Health Sci. 2022;6(2):8890-7.
-
22 Berglund B, Hassmén P, Job RFS. Sources and effects of low-frequency noise. J Acoust Soc Am. 1996;99(5):2985-3002. https://doi.org/10.1121/1.414863 PMid:8642114.
» https://doi.org/10.1121/1.414863 -
23 Lupşa-Tătaru L. Customizing audio fades with a view to real-time processing. Applied Computer Science. 2019;15(4):16-26. https://doi.org/10.35784/acs-2019-27
» https://doi.org/10.35784/acs-2019-27 -
24 Ricketts TA, Bentler RA. The effect of test signal type and bandwidth on the categorical scaling of loudness. J Acoust Soc Am. 1996;99(4):2281-7. https://doi.org/10.1121/1.415415 PMid:8730074.
» https://doi.org/10.1121/1.415415 -
25 Emily Shannon Fu Foundation. AngelSim (TigerCIS): Cochlear Implant and Hearing Loss Simulator [Internet]. 2013 [citado em 2025 junho 25]. Disponível em: http://angelsim.emilyfufoundation.org/
» http://angelsim.emilyfufoundation.org/ -
26 Cychosz M, Winn MB, Goupell MJ. How to vocode: uing channel vocoders for cochlear-implant research. J Acoust Soc Am. 2024;155(4):2407-37. https://doi.org/10.1121/10.0025274 PMid:38568143.
» https://doi.org/10.1121/10.0025274 -
27 The Python Standard Library [Internet]. 2001 [citado em 2025 junho 25]. Disponível em: https://docs.python.org/3/library/index.html
» https://docs.python.org/3/library/index.html - 28 Kent RD, Read C. Acoustic analysis of speech. 2nd ed. San Diego: Singular Publishing Group; 2002.
-
29 Greenwood DD. Auditory masking and the critical band. J Acoust Soc Am. 1961;33(4):484-502. https://doi.org/10.1121/1.1908699
» https://doi.org/10.1121/1.1908699 -
30 Forinash K, Christian W. Sound: an interactive ebook [Internet]. 2012 [citado em 2025 junho 25]. Disponível em: https://www.compadre.org/books/SoundBook
» https://www.compadre.org/books/SoundBook
Edited by
-
Editor-in-Chief:
Maria Cecilia Martinelli Iorio.
-
Associate Editor:
Liliane Desgualdo Pereira.
Research data is not available.

 Subtitle: RMS = Root Mean Square. Source: Prepared by the author, 2023
 Source: Prepared by the author, 2023-2024
 Source: Prepared by the author, 2023
 Source: Prepared by the author, 2023
 Subtitle: RMS = Root Mean Square; dB = decibel. Source: Prepared by the author, 2023