My Approach to Differentiating Pericardial Effusion with and without Hemodynamic Repercussions
Abstract
Pericardial effusion is a common finding in cardiology practice. It is frequently identified in outpatient and inpatient follow-up examinations, especially during the postoperative period of heart surgery. In clinically stable patients, proper assessment can allow for early detection of signs of clinical deterioration. In patients in shock, careful analysis of pericardial effusion can confirm or rule out this condition as the main cause of hemodynamic instability. Precise identification of the location, anatomical characterization of severity, and analysis of hemodynamic repercussions by means of Doppler are essential elements to guide medical management. In addition to technical assessment, precautions when describing findings in imaging reports are equally important. This is because the hemodynamic repercussions observed on echocardiography do not always correspond to the patient's clinical severity.
Keywords
Pericardial Effusion; Echocardiography; Inferior Vena Cava; Cardiac Tamponade
Resumo
O derrame pericárdico é um achado comum na prática cardiológica, sendo frequentemente identificado em exames de acompanhamento ambulatorial, hospitalar e, sobretudo, no período pós-operatório de cirurgias cardíacas. Em pacientes clinicamente estáveis, sua avaliação adequada pode permitir a detecção precoce de sinais de deterioração clínica. Já em pacientes em estado de choque, a análise criteriosa do derrame pericárdico pode confirmar ou excluir essa condição como causa principal da instabilidade hemodinâmica. A identificação precisa da localização, a caracterização anatômica da gravidade e a análise da repercussão hemodinâmica por meio do Doppler são elementos essenciais para orientar a conduta médica. Além da avaliação técnica, é igualmente importante o cuidado na descrição dos achados nos laudos de imagem. Isso porque a repercussão hemodinâmica observada na ecocardiografia nem sempre corresponde à gravidade clínica apresentada pelo paciente.
Palavras-chave
Derrame Pericárdico; Ecocardiografia; Veia Cava Inferior; Tamponamento Cardíaco

Introduction
Pericardial effusion (PE) occurs due to accumulation of fluid in the pericardial sac. The etiologies include inflammatory, infectious, neoplastic, autoimmune, metabolic, traumatic, and iatrogenic causes.1 It is not always simple to assess the repercussions of PE, because factors such as etiology, speed of onset, and hemodynamic conditions can make this assessment a major challenge in clinical practice. Although several methods can assess and quantify PE, given its inherent characteristics, echocardiography is the most widely applied initial method, providing tools for rapid assessment and decision-making, especially in critical patients.
Anatomical and pathophysiological considerations
The pericardium is a sac-like structure that contains the heart and adjacent structures, composed of a fibrous and a serous component. The outer fibrous component is mainly composed of collagen fibers with interspersed short elastic fibrils. The fibrous envelope is continuous superiorly with the adventitia of the great vessels and is attached inferiorly to the diaphragm. The serous component consists of a single layer of mesothelium that forms a parietal layer and a visceral layer, surrounding the pericardial cavity. The parietal layer lines the fibrous pericardium, and together these structures form the parietal pericardium. The visceral layer is also known as the epicardium, which lines the heart.
Between the visceral pericardium and the myocardium, there is a variable amount of epicardial adipose tissue. Epicardial fat is most abundant along the atrioventricular and interventricular sulci and is an important differential diagnosis when assessing PE.
Under physiological conditions, pericardial space normally contains a small amount of fluid, typically ranging from 10 to 50 mL, with an important function related to lubricating the heart, reducing friction during movement between tissues, and allowing the translational and rotational motion of the heart.
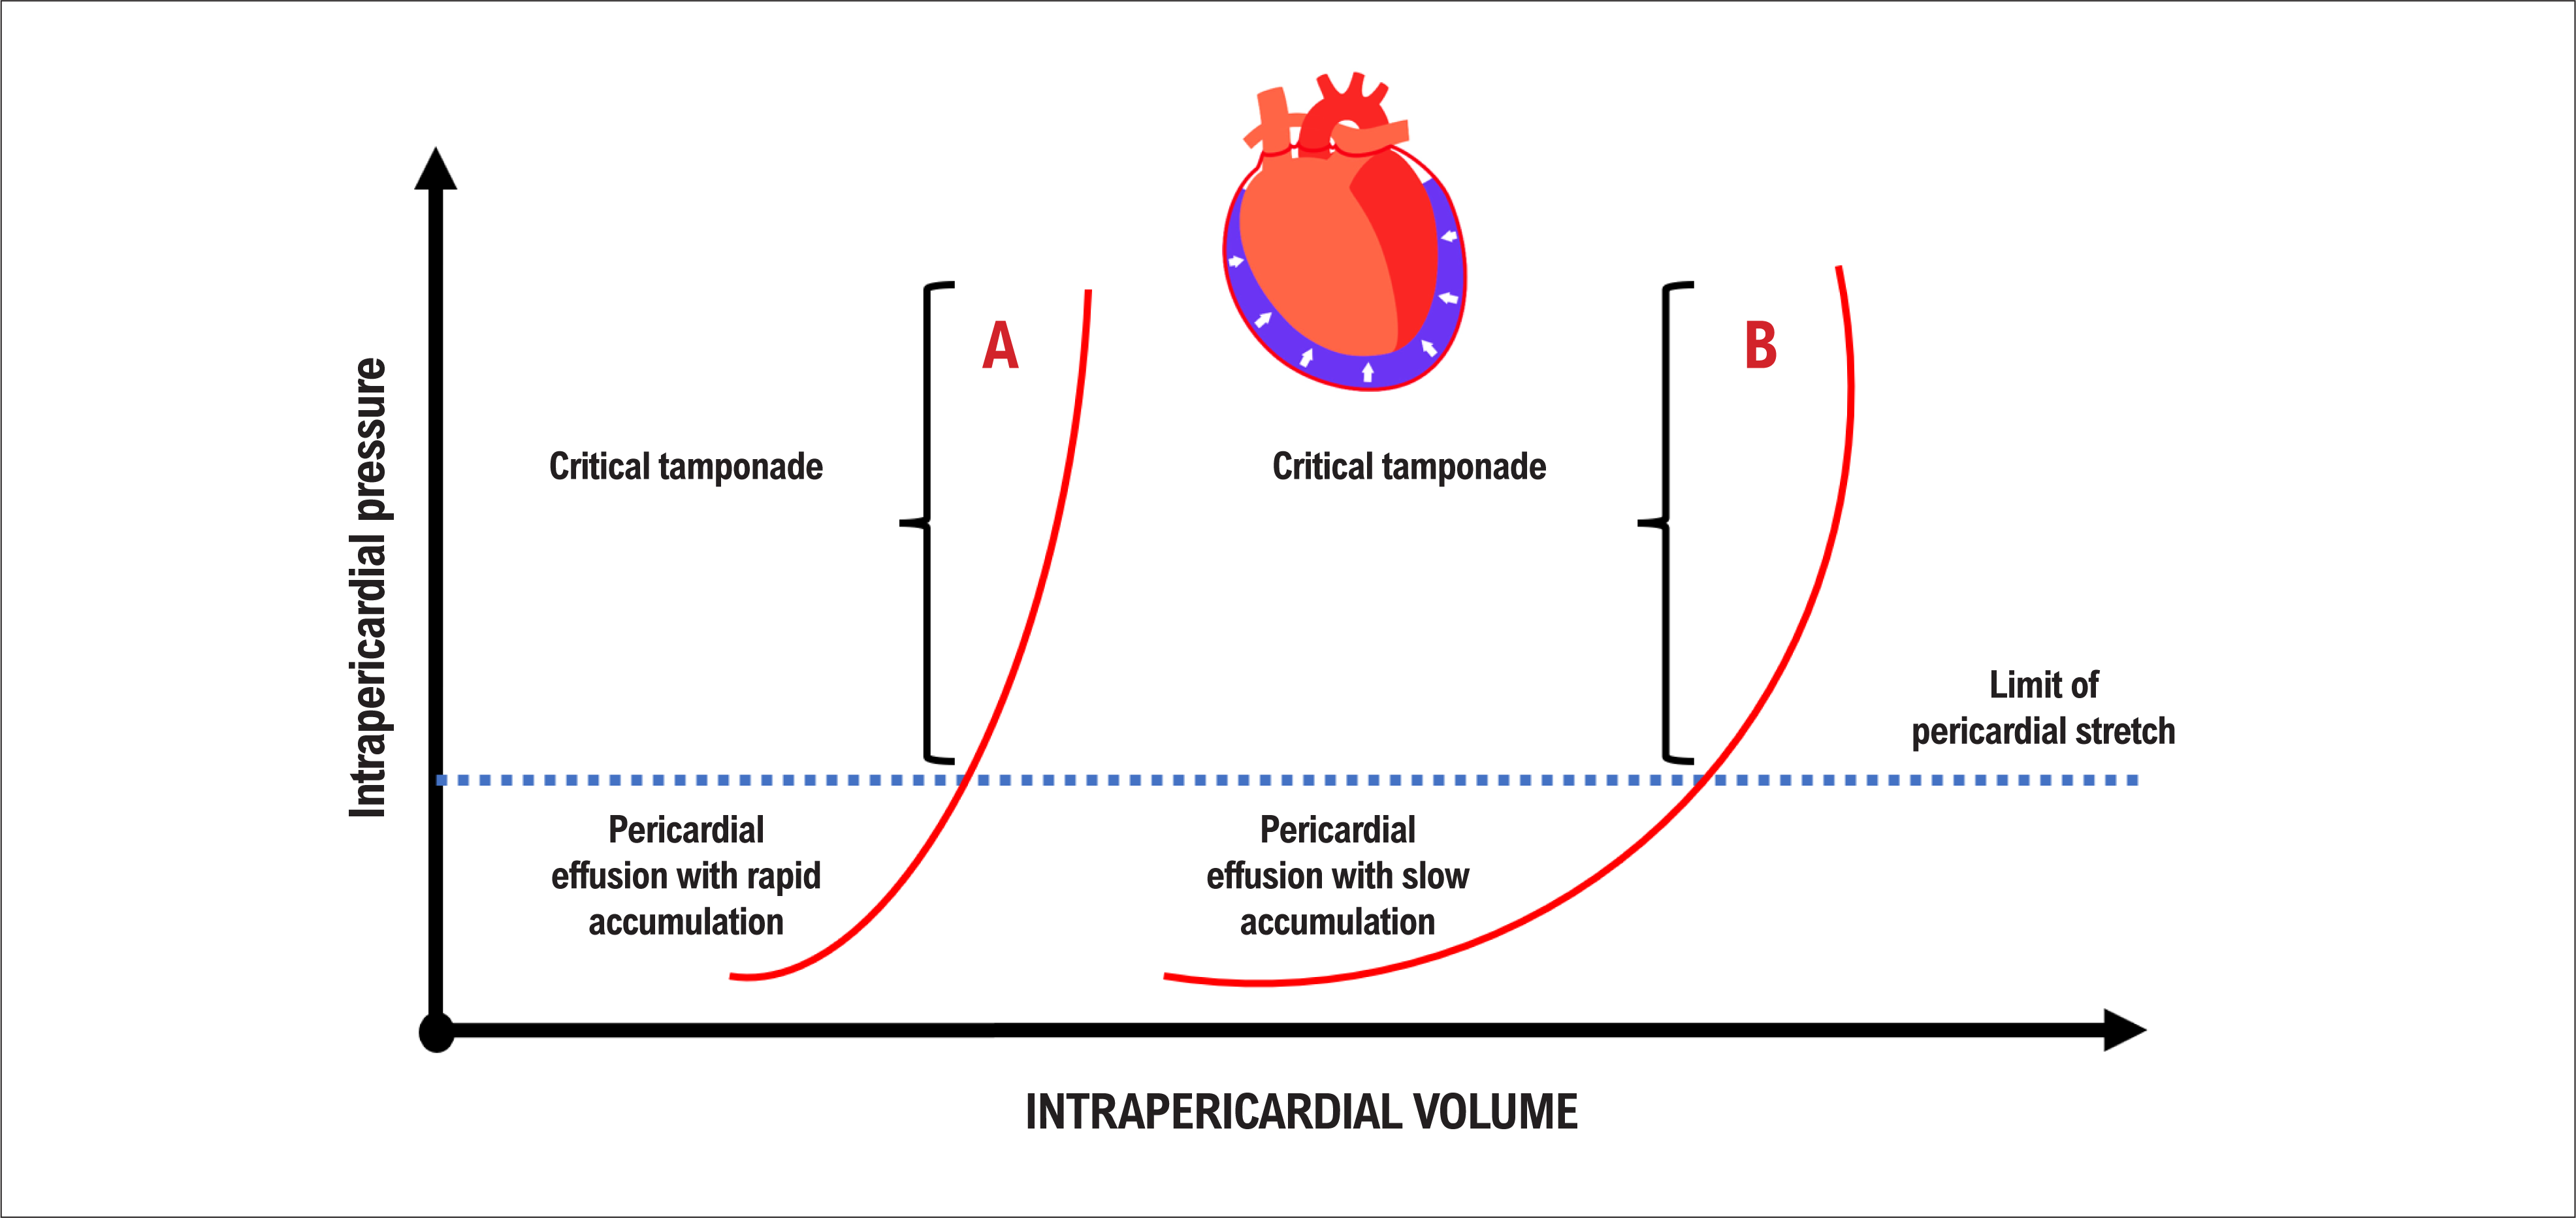
Slow increases in this volume tend to have a smaller impact on pericardial pressure and its transmission to the heart chambers, due to the maintenance of pericardial compliance. In rapid increases, this does not occur, and pericardial pressure shows a progressive and rapid increase that will interfere with cardiac hemodynamics (Figure 1).

Comparative image demonstrating increased pericardial pressures in two possible scenarios. Curve A shows a scenario in which the accumulation of pericardial fluid occurs within a short period of time with a rapid increase in pericardial pressures transmitted to the heart chambers. Curve B shows a scenario in which the accumulation of pericardial fluid occurs over a longer period of time, with a slow and gradual increase in pericardial pressures, and pressure transmission to the heart chambers occurs only after a large accumulation of fluid. Adapted from American Society of Echocardiography guidelines.2
The right ventricle (RV) wall is thinner than that of the left ventricle (LV). Consequently, more than half of the diastolic pressure in the RV, under physiological conditions, is due to the pericardium, making it a particularly important chamber in assessing the impact of PE, because it is one of the earliest affected.
It is essential to understand the phenomenon of ventricular interdependence inherent to cardiac physiology, in order to grasp the changes that guide the diagnosis of PE with hemodynamic repercussions. The RV and LV are pumps that share a wall, the interventricular septum that separates them, and both are contained within the pericardial sac. Therefore, variations in ventricular volumes and filling pressures can lead to bulging of the septum to one side, depending on the pressure conditions. This occurs under normal conditions, including during physiological inspiration and expiration, but it does not have a significant impact on LV filling (Figure 2).

Ventricular interdependence demonstrating how the physiological variation of mitral and tricuspid transvalvular flows behaves during inspiration and expiration. Flow variations below 20% are expected in healthy patients. LV: left ventricle; RV: right ventricle.
When there is an increase in pericardial volume and an increase in pressure throughout the heart, RV filling during inspiration can bulge the septum to the left, limiting the volume that fills the left side (reverse Bernheim effect). During expiration, the opposite occurs.3 In practice, this explains, the paradoxical pulse and the increased variation of mitral and tricuspid flows between inspiration and expiration in extreme cases.
Given that PE can impact cardiac function, leading to low output, it is essential to understand the tools for evaluating PE and its repercussions. Although PE can also be evaluated by magnetic resonance imaging and computed tomography, echocardiography is a fundamental part of this assessment due to its sensitivity for large-volume effusions, portability, and ease of follow-up.
Correct identification of pericardial effusion
The following discussion is based on the fundamental concept that PE must be correctly diagnosed. A simple, yet accurate parameter for analysis is the location of fluid accumulation (anechoic content).
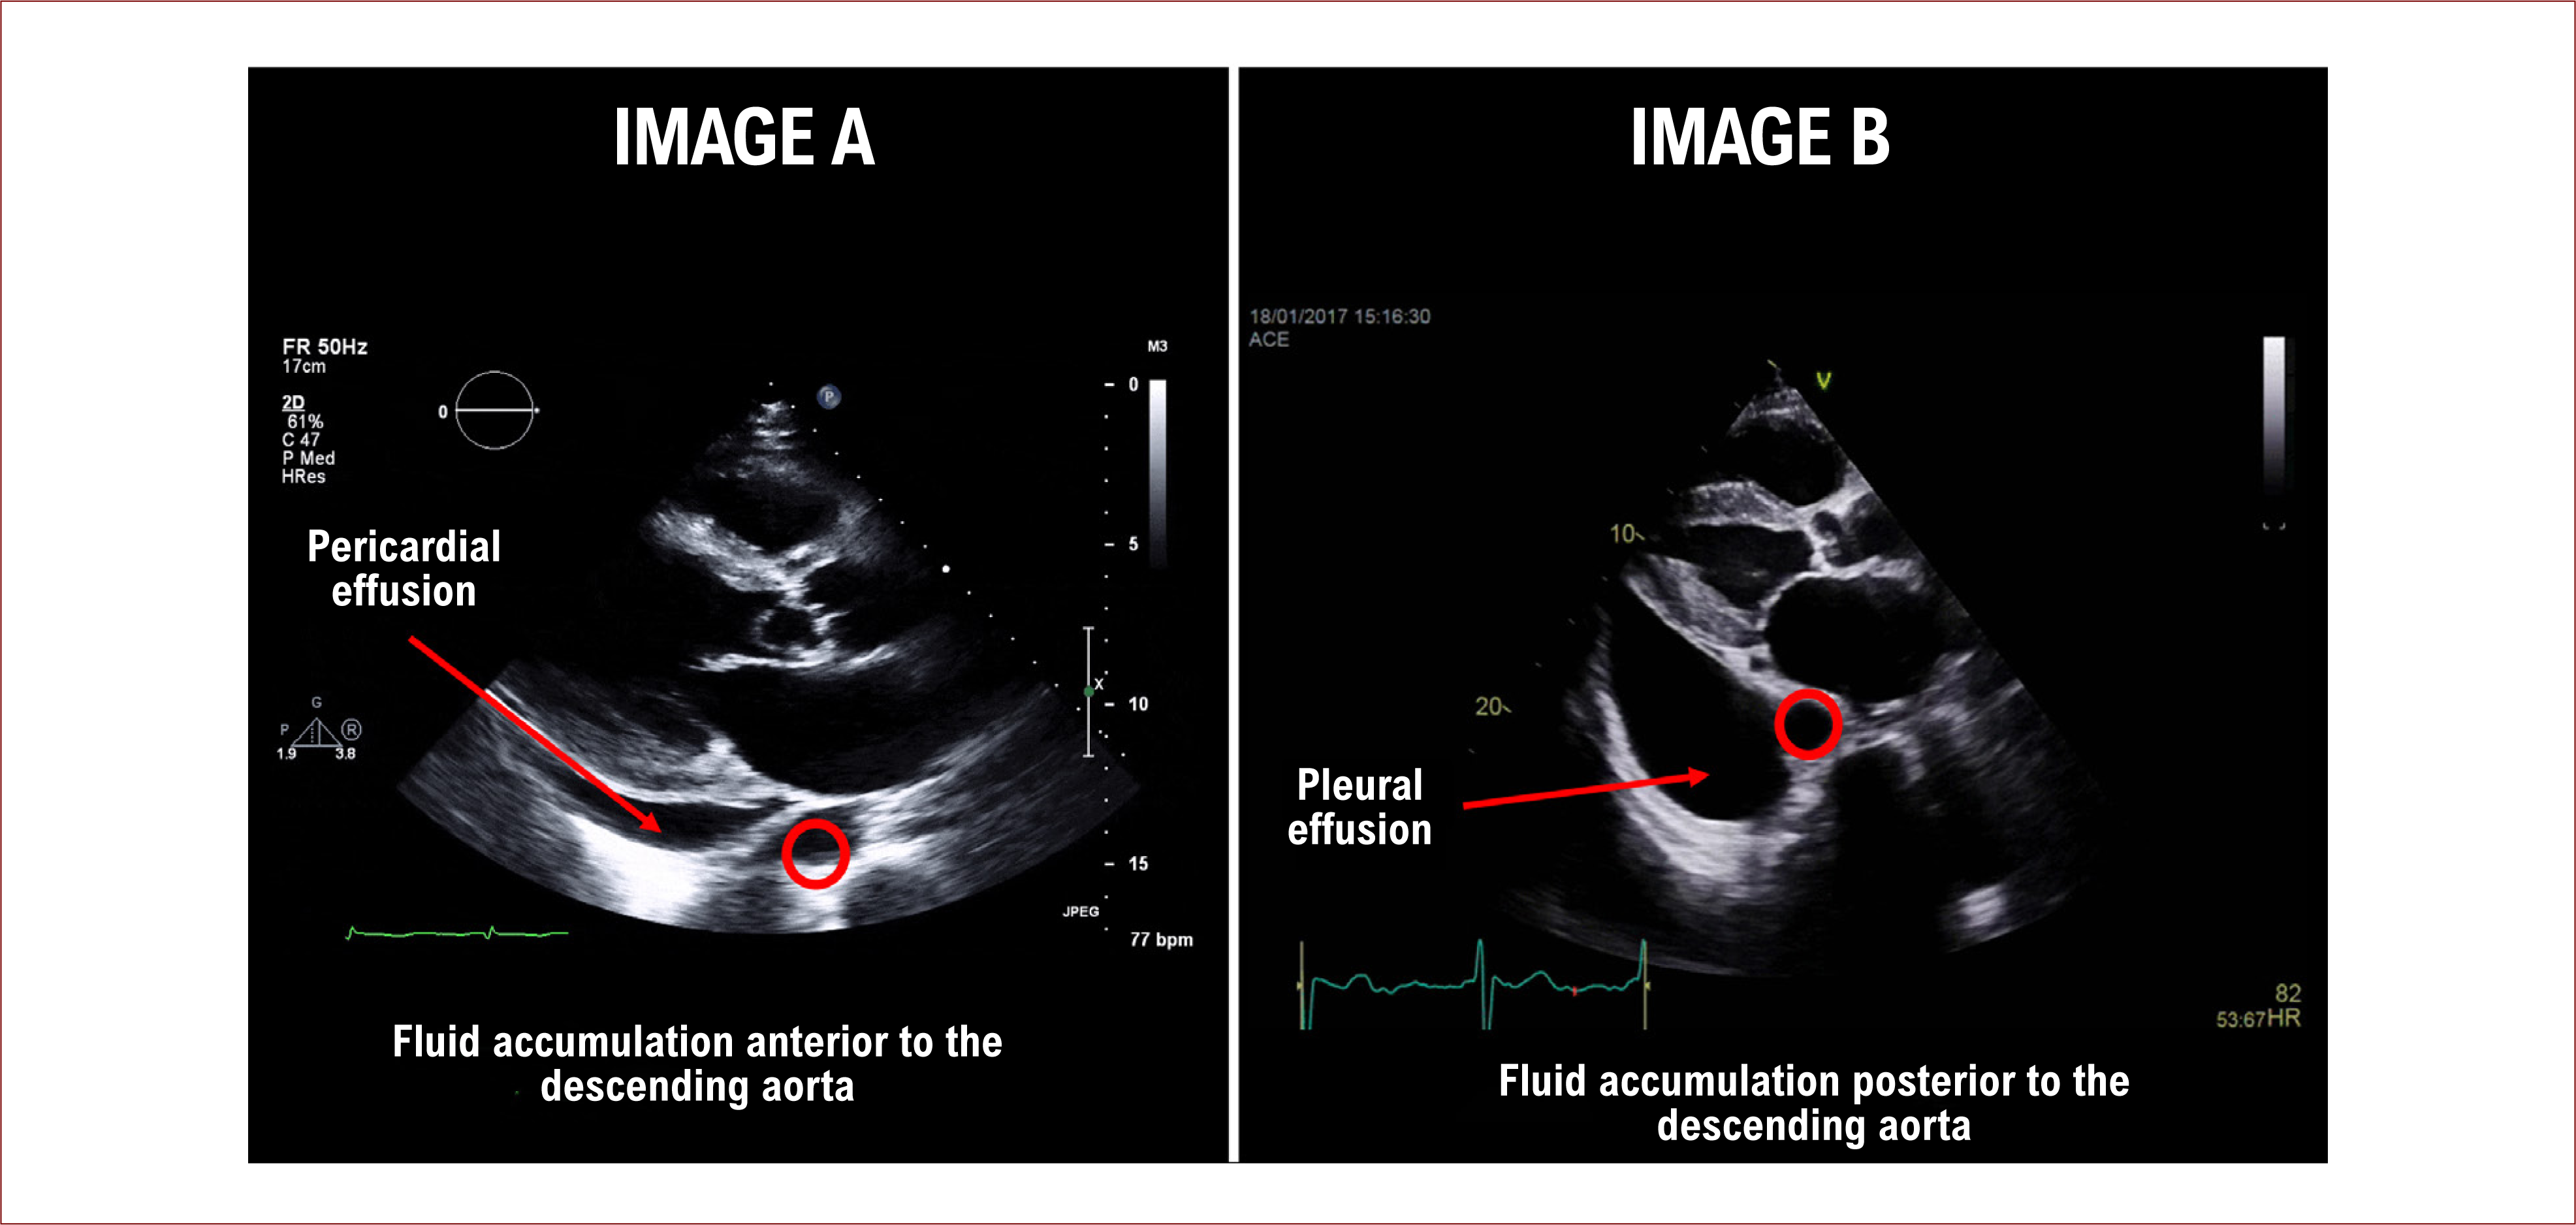
If the fluid is predominantly located anterior to the descending thoracic aorta in longitudinal parasternal view, the most likely diagnosis will be PE. If it is located in retroaortic topography, the diagnosis will be left pleural effusion, considering that the aorta in this segment is anterior and to the left of the vertebral column (Figure 3).
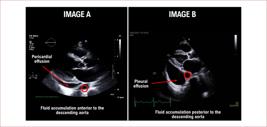
Echocardiographic differences between pericardial effusion (Image A) and pleural effusion (Image B), using the descending thoracic aorta as an anatomical reference parameter.
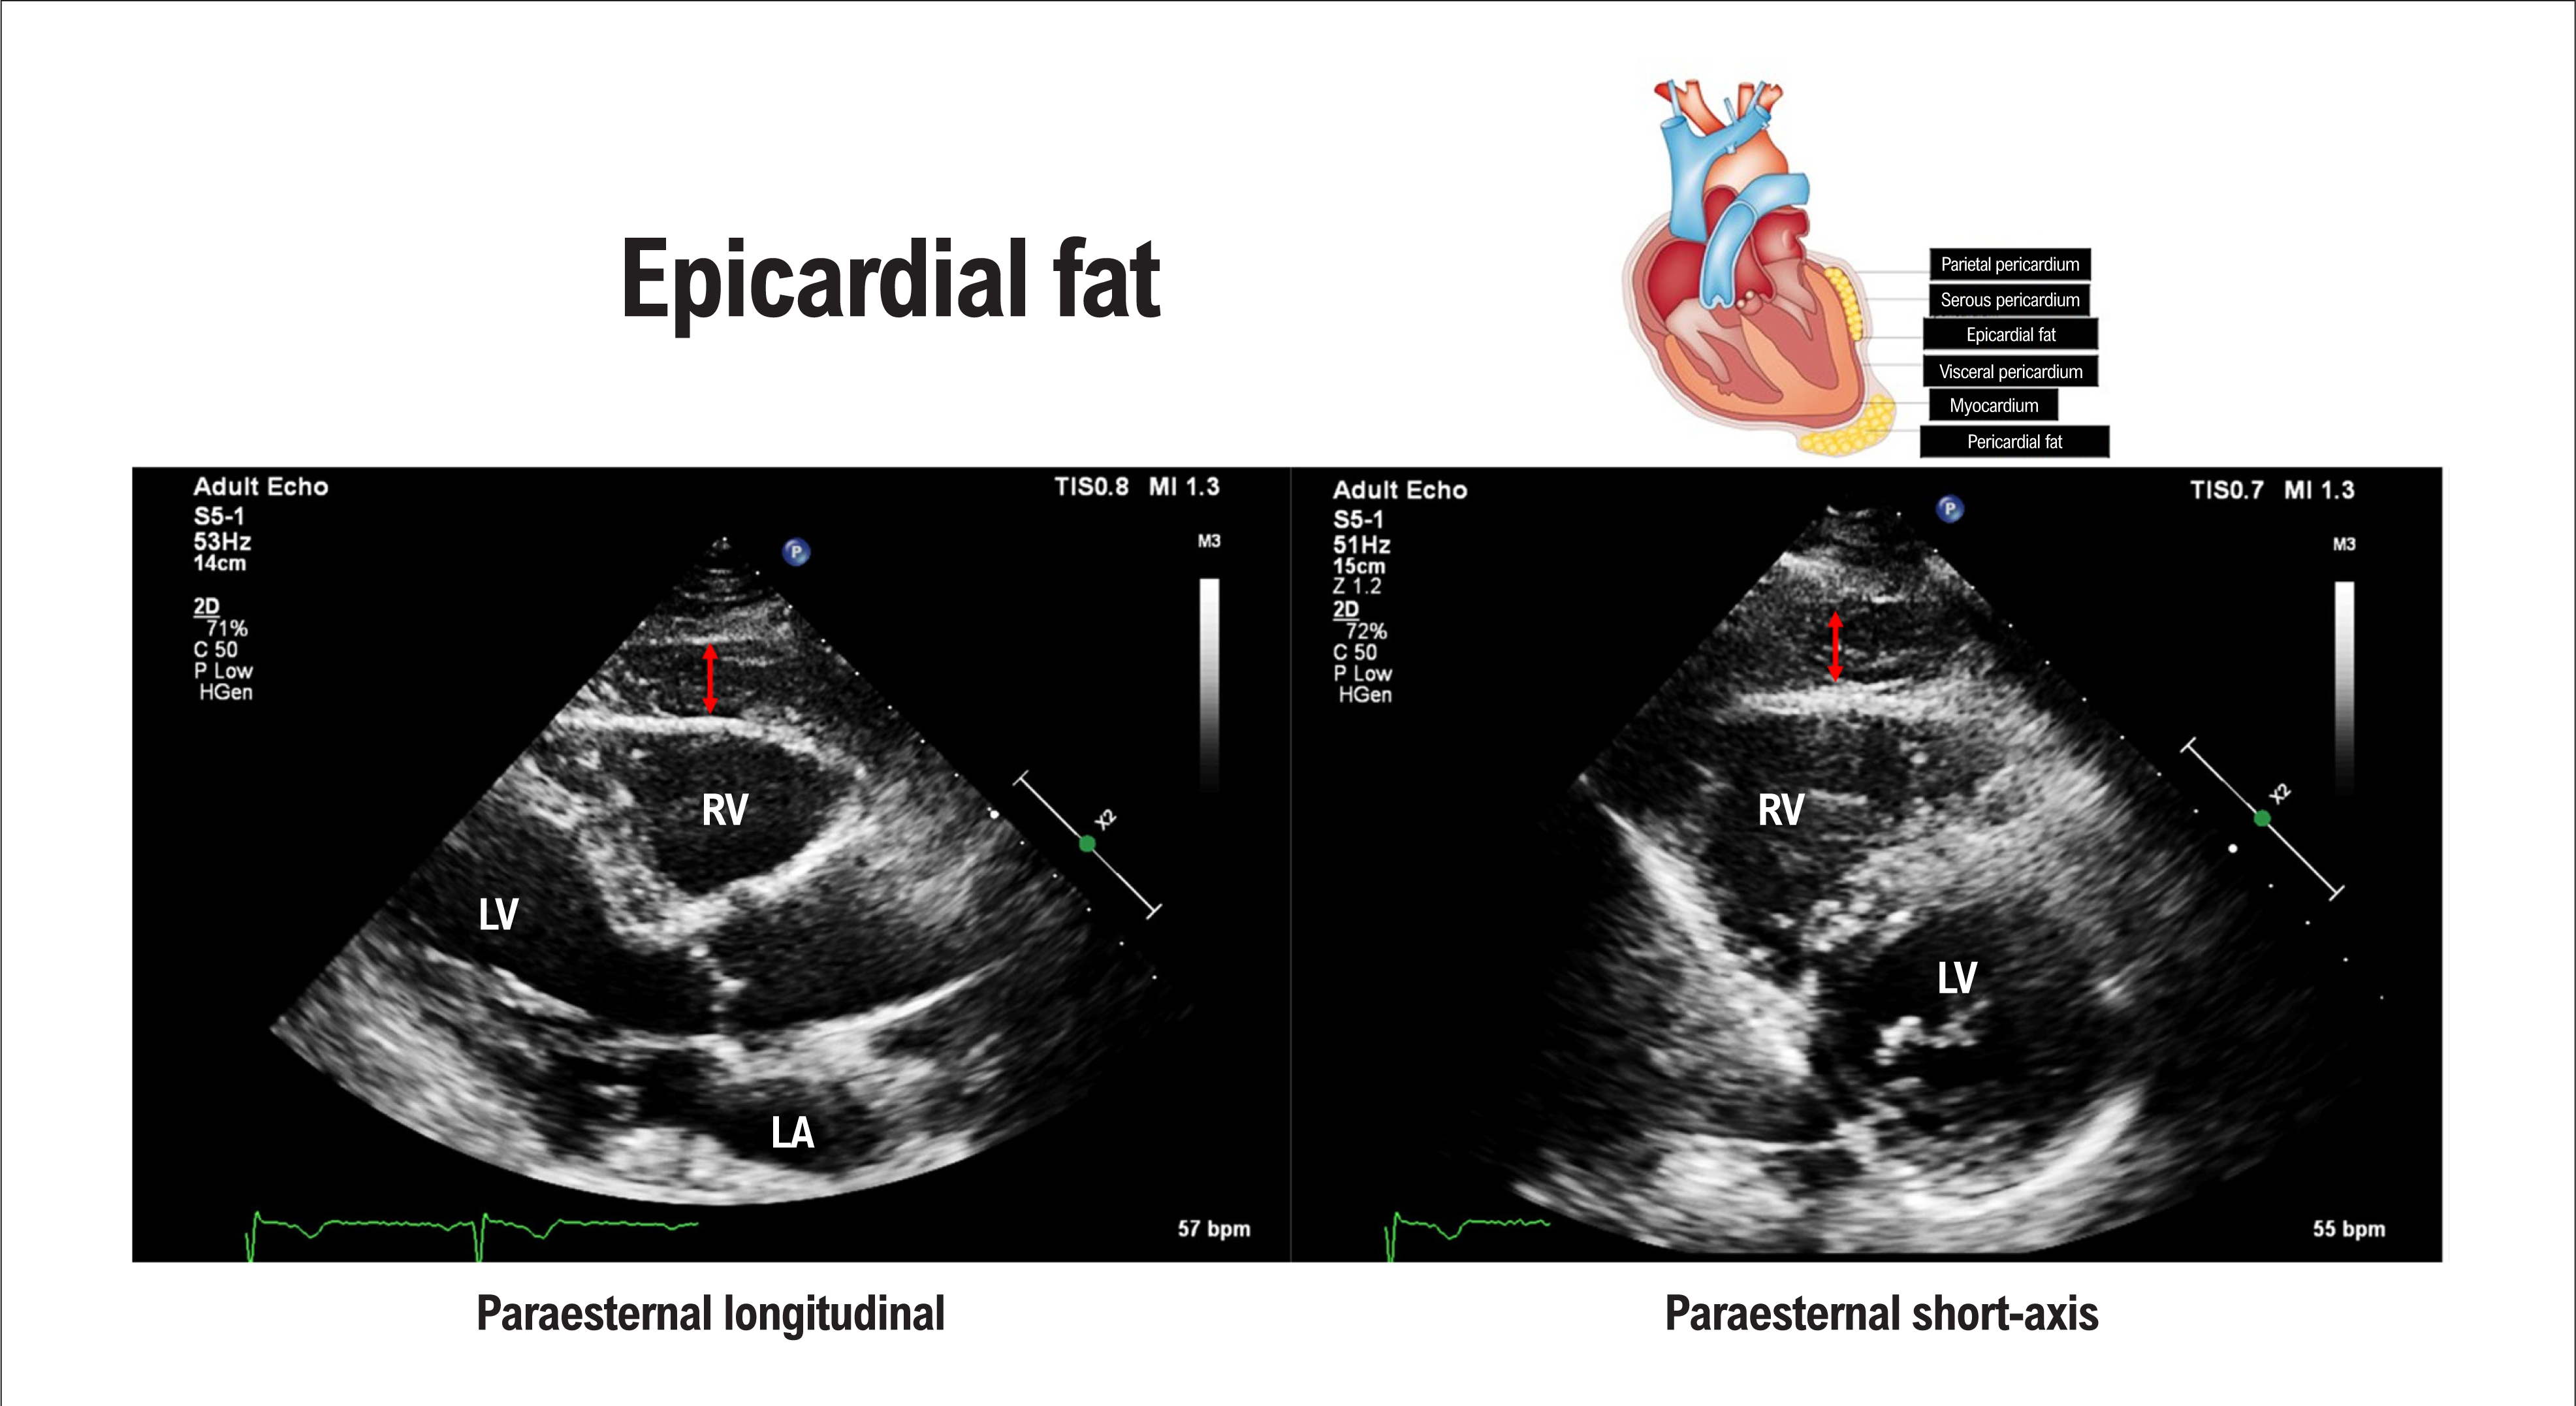
Another finding that can lead to incorrect diagnosis is epicardial fat, which differs from effusion insofar as it is more echogenic than the myocardium, moves along with cardiac motion, and does not naturally generate hemodynamic impact (Figure 4).

Echocardiographic images in the parasternal longitudinal and short-axis window of a patient with metabolic syndrome and extensive epicardial fat layer. Differential diagnosis with pericardial effusion is essential due to the difference in complementary investigation and clinical treatment. LA: left atrium; LV: left ventricle; RV: right ventricle.
Echocardiographic assessment: quantification
By definition, pericardial fluid volume above 50 mL is considered abnormal2 and should, whenever possible, be described in the final report. Echocardiographic quantification can be performed using size or volume parameters; the former is more commonly used in clinical practice and recommended by the American Society of Echocardiography guidelines, according to their most recent publication. This measurement is performed using two-dimensional echocardiography, and the parameter is described in a semi-quantitative manner, based on the size of the echo-free space seen between the parietal and visceral pericardium at end-diastole. Considering this measurement, we can classify PE as mild (< 10 mm), moderate (10 to 20 mm), and severe (> 20 mm), as described in Table 1.
Classification of pericardial effusion according to maximum diastolic diameter and estimated volume
Figure 5 displays a case of PE of inflammatory etiology, with measurements of the largest diastolic diameters. This assessment should always be performed using multiple echocardiographic windows.

Very large pericardial effusion assessed through multiple images (A, B, and C), circumferentially involving the heart, with a maximum diameter of 35.5 mm shown in Image C. PE: pericardial effusion; RV: right ventricle.
Another parameter described is the volumetric estimate, considering the correlation between diameters and volumes measured on two-dimensional echocardiography. It is inferred that a mild effusion (< 10 mm) would have between 50 and 100 mL of pericardial fluid, a moderate effusion (10 to 20 mm) between 100 and 500 mL, and a significant effusion (> 20 mm) more than 500 mL2. There is limited accuracy between this measurement and the actual volume of surgically drained pericardial fluid. Volumetric assessment measured using Simpson's method, preferably in the subcostal window, as published by DeMaria et al. in the Journal of the American Society of Echocardiography in 2019,4 appears to be of greater value. Figure 6 provides an example of how this quantification could be performed in a real-world case.

Volumetric quantification using Simpson's method. Initially, the pericardium is measured in its outermost component, encompassing all the fluid present, as shown in Image A. In Image B, the cardiac volume is measured during the phase of the cycle in which it presents its largest dimensions and volumes. To obtain the pericardial fluid volume, the simple difference between these two measurements is calculated.
Uniform and homogeneous effusion suggests the possibility of transudate, whereas findings of asymmetrical distribution and heterogeneous content suggest exudate. Clots and effusions during the postoperative period can be a diagnostic challenge, sometimes requiring assessment using other methods.
During onset of effusion, hemodynamic repercussions occur when pericardial pressure compresses the cardiac chambers, especially those with lower pressure, and limits chamber filling. To assess the repercussions of effusion, analysis seeks signs of pressure overload in the pericardial space.
Although it is the first-line examination in the assessment of fluid in the pericardial space, it is necessary to take the following limitations into consideration:
-
Patients with limited acoustic windows (chronic obstructive pulmonary disease, obesity, postoperative cardiac surgery
-
Operator-dependent
-
Low signal-to-noise ratio in pericardial space
-
Limited tissue characterization
-
Limited assessment in loculated effusions
Echocardiographic assessment: severity (hemodynamic repercussions)
One-dimensional assessment: M mode
Due to its high temporal resolution, this method is still widely used for determining the greatest pericardial fluid diameter, provided that the assessment axis is not oblique in relation to the line of analysis.
-
Quantification should be performed following the previously described classification.
-
The method more accurately identifies the temporality of right atrial (RA) and RV collapse in relation to the cardiac cycle (Figure 7).
-
It allows identification of septal bounce related to increased ventricular interdependence; however, it is necessary to rule out other pathologies that may present the same sign, such as chronic obstructive pulmonary disease.

Diastolic collapse of the right ventricular free wall assessed by M mode, with easy identification of the systolic and diastolic components. In this case, the one-dimensional slice passing through the aortic valve helped to correlate each period with the electrocardiogram, which showed low voltage due to significant pericardial effusion. Ao: aorta; LA: left atrium; RV: right ventricle.
Two-dimensional assessment: 2D mode
Two-dimensional assessment involves analysis of dynamic anatomical parameters, such as inferior vena cava (IVC) distensibility, and RA and RV collapsibility. It also includes study of cavity flows in order to identify early changes related to hemodynamic repercussions.
Dynamic anatomical assessment of the inferior vena cava and hepatic veins
In PE, right heart chamber pressures are increased due to compression by the effusion. When there are hemodynamic repercussions, IVC plethora is practically a mandatory parameter; diameter greater than 21 mm and variation less than 50% are expected findings. IVC plethora was found in 92% of patients who required pericardial drainage.5 When it is not possible to adequately assess the IVC, the presence of plethora can be inferred based on dilation of the hepatic veins.
Hepatic vein flow is also altered in effusion with repercussions. Normal hepatic venous flow is biphasic, with systolic velocity greater than diastolic velocity (generally around 50 cm/s), and interrupted (or with reverse reflux) during atrial systole. Flows tend to increase during inspiration. When hemodynamic repercussions occur, velocities initially reduce to 20 to 40 cm/s, with diastolic flow progressively decreasing until it appears only during inspiration.2 When systolic flow occurs only during inspiration, cardiac arrest is imminent. This finding, when associated with cardiac chamber analysis, has high positive and negative predictive value for clinical tamponade (82% and 88%, respectively),6 as illustrated in Figure 8.

Pulsed-wave Doppler of hepatic venous flow velocity in a normal patient (Image A) and in cardiac tamponade (Image B). Velocities below the zero baseline demonstrate flow towards the heart, and those above the baseline represent reverse flow. Reduced anterograde flow reflects decreased venous return. In Image B, during apnea, anterograde flow is only seen during ventricular systole (S). With inspiration, systolic flow predominates, but diastolic flow (D) also exists. In the first flow analysis after expiration, a reversal of diastolic flow (white arrow) occurs, which indirectly equates to exacerbation of ventricular interdependence. PE: pericardial effusion.
Dynamic anatomical assessment of right heart chambers
With increased pericardial pressure, collapse or indentation of the RA and RV (the heart chambers that are most sensitive to external pressure) reflects the extent to which effusion impacts right chamber filling. This analysis is particularly useful in low-pressure tamponade, a context in which there is no significant IVC plethora.
RA indentation/collapse occurs at the peak of the R wave (atrial diastole). When it lasts for more than one third of the cardiac cycle, it has high sensitivity and specificity for clinical tamponade.7
Similarly, RV indentation/collapse occurs after the T wave (ventricular diastole), and its presence indicates that pericardial pressure already exceeds RV pressure. Initially, it occurs only during inspiration, persisting throughout the respiratory cycle as effusion develops. The longer the duration, the greater the repercussion,8 as illustrated in Figure 9.

Systolic and diastolic collapse of the right ventricle secondary to free wall rupture, a rare mechanical complication associated with extensive anterior wall infarction. AMI: acute myocardial infarction; LV: left ventricle; RV: right ventricle.
Absence of collapse in any chamber has > 90% negative predictive value for effusion with repercussions.6 On the other hand, the absence of RV collapse can occur in clinical contexts of high RV pressures (RV hypertrophy, severe pulmonary hypertension, or coexisting LV dysfunction).9,10
There is a clinical context that deserves even more careful evaluation, namely, when hypovolemia coexists. In these cases, collapse of the right heart chambers and, more rarely, the left chambers occurs earlier due to reduced pressure in the heart chambers. In this scenario, volume expansion and early reassessment of the echocardiographic findings presented are very useful and help guide clinical management, often avoiding surgical intervention.
Hemodynamic assessment: Doppler
In the assessment of transvalvular flows, an increase in the variation of mitral and tricuspid E wave velocities is observed, which is related to exacerbation of ventricular interdependence. The following formula is used to calculate:
Transmitral flow during inspiration tends to decrease, whereas tricuspid flow tends to increase during inspiration. Since both are calculated in the same way, the calculation of the variation through the tricuspid valve should result in a negative value. Values above 30% for the mitral valve and 60% for the tricuspid valve are indicative of hemodynamic repercussions11 (Figures 10 and 11). When analyzing these variations, care should be taken to reduce the spectral Doppler scan rate, which will help to more accurately identify the variations according to the respiratory cycle and, ideally, analyze them together with the respirometer graph.

Echocardiographic formula and parameters for the correct calculation of transvalvular mitral and tricuspid respiratory variation. As demonstrated in the figure, whenever possible and available, it is of fundamental importance to use a respirometer, with correct identification of respiratory phases associated with the parameter of flow variation. If a respirometer is not available, it is considered that the highest velocity of the E wave through the mitral valve occurs during the expiratory phase, whereas, in the tricuspid valve, it occurs during the inspiratory phase. LA: left atrium; LV: left ventricle; PE: pericardial effusion; RA: right atrium; RV: right ventricle.

Respiratory variation above the normal value observed using transvalvular mitral flow in a patient with tamponade secondary to left ventricular free wall rupture. LA: left atrium; LV: left ventricle; RA: right atrium; RV: right ventricle.
Even though it is a useful tool, flow assessment should not be applied in the absence of IVC plethora or collapse of any cardiac chamber, as increased variation can also occur in other clinical contexts (atrial fibrillation, mechanical ventilation).
As with the mitral and tricuspid valves, flow variations occur through the LV outflow tract, and it is possible to document the phenomenon that we clinically recognize as paradoxical pulse on echocardiography. Although useful, it occurs in very late stages, guiding immediate intervention to avoid possible circulatory collapse.
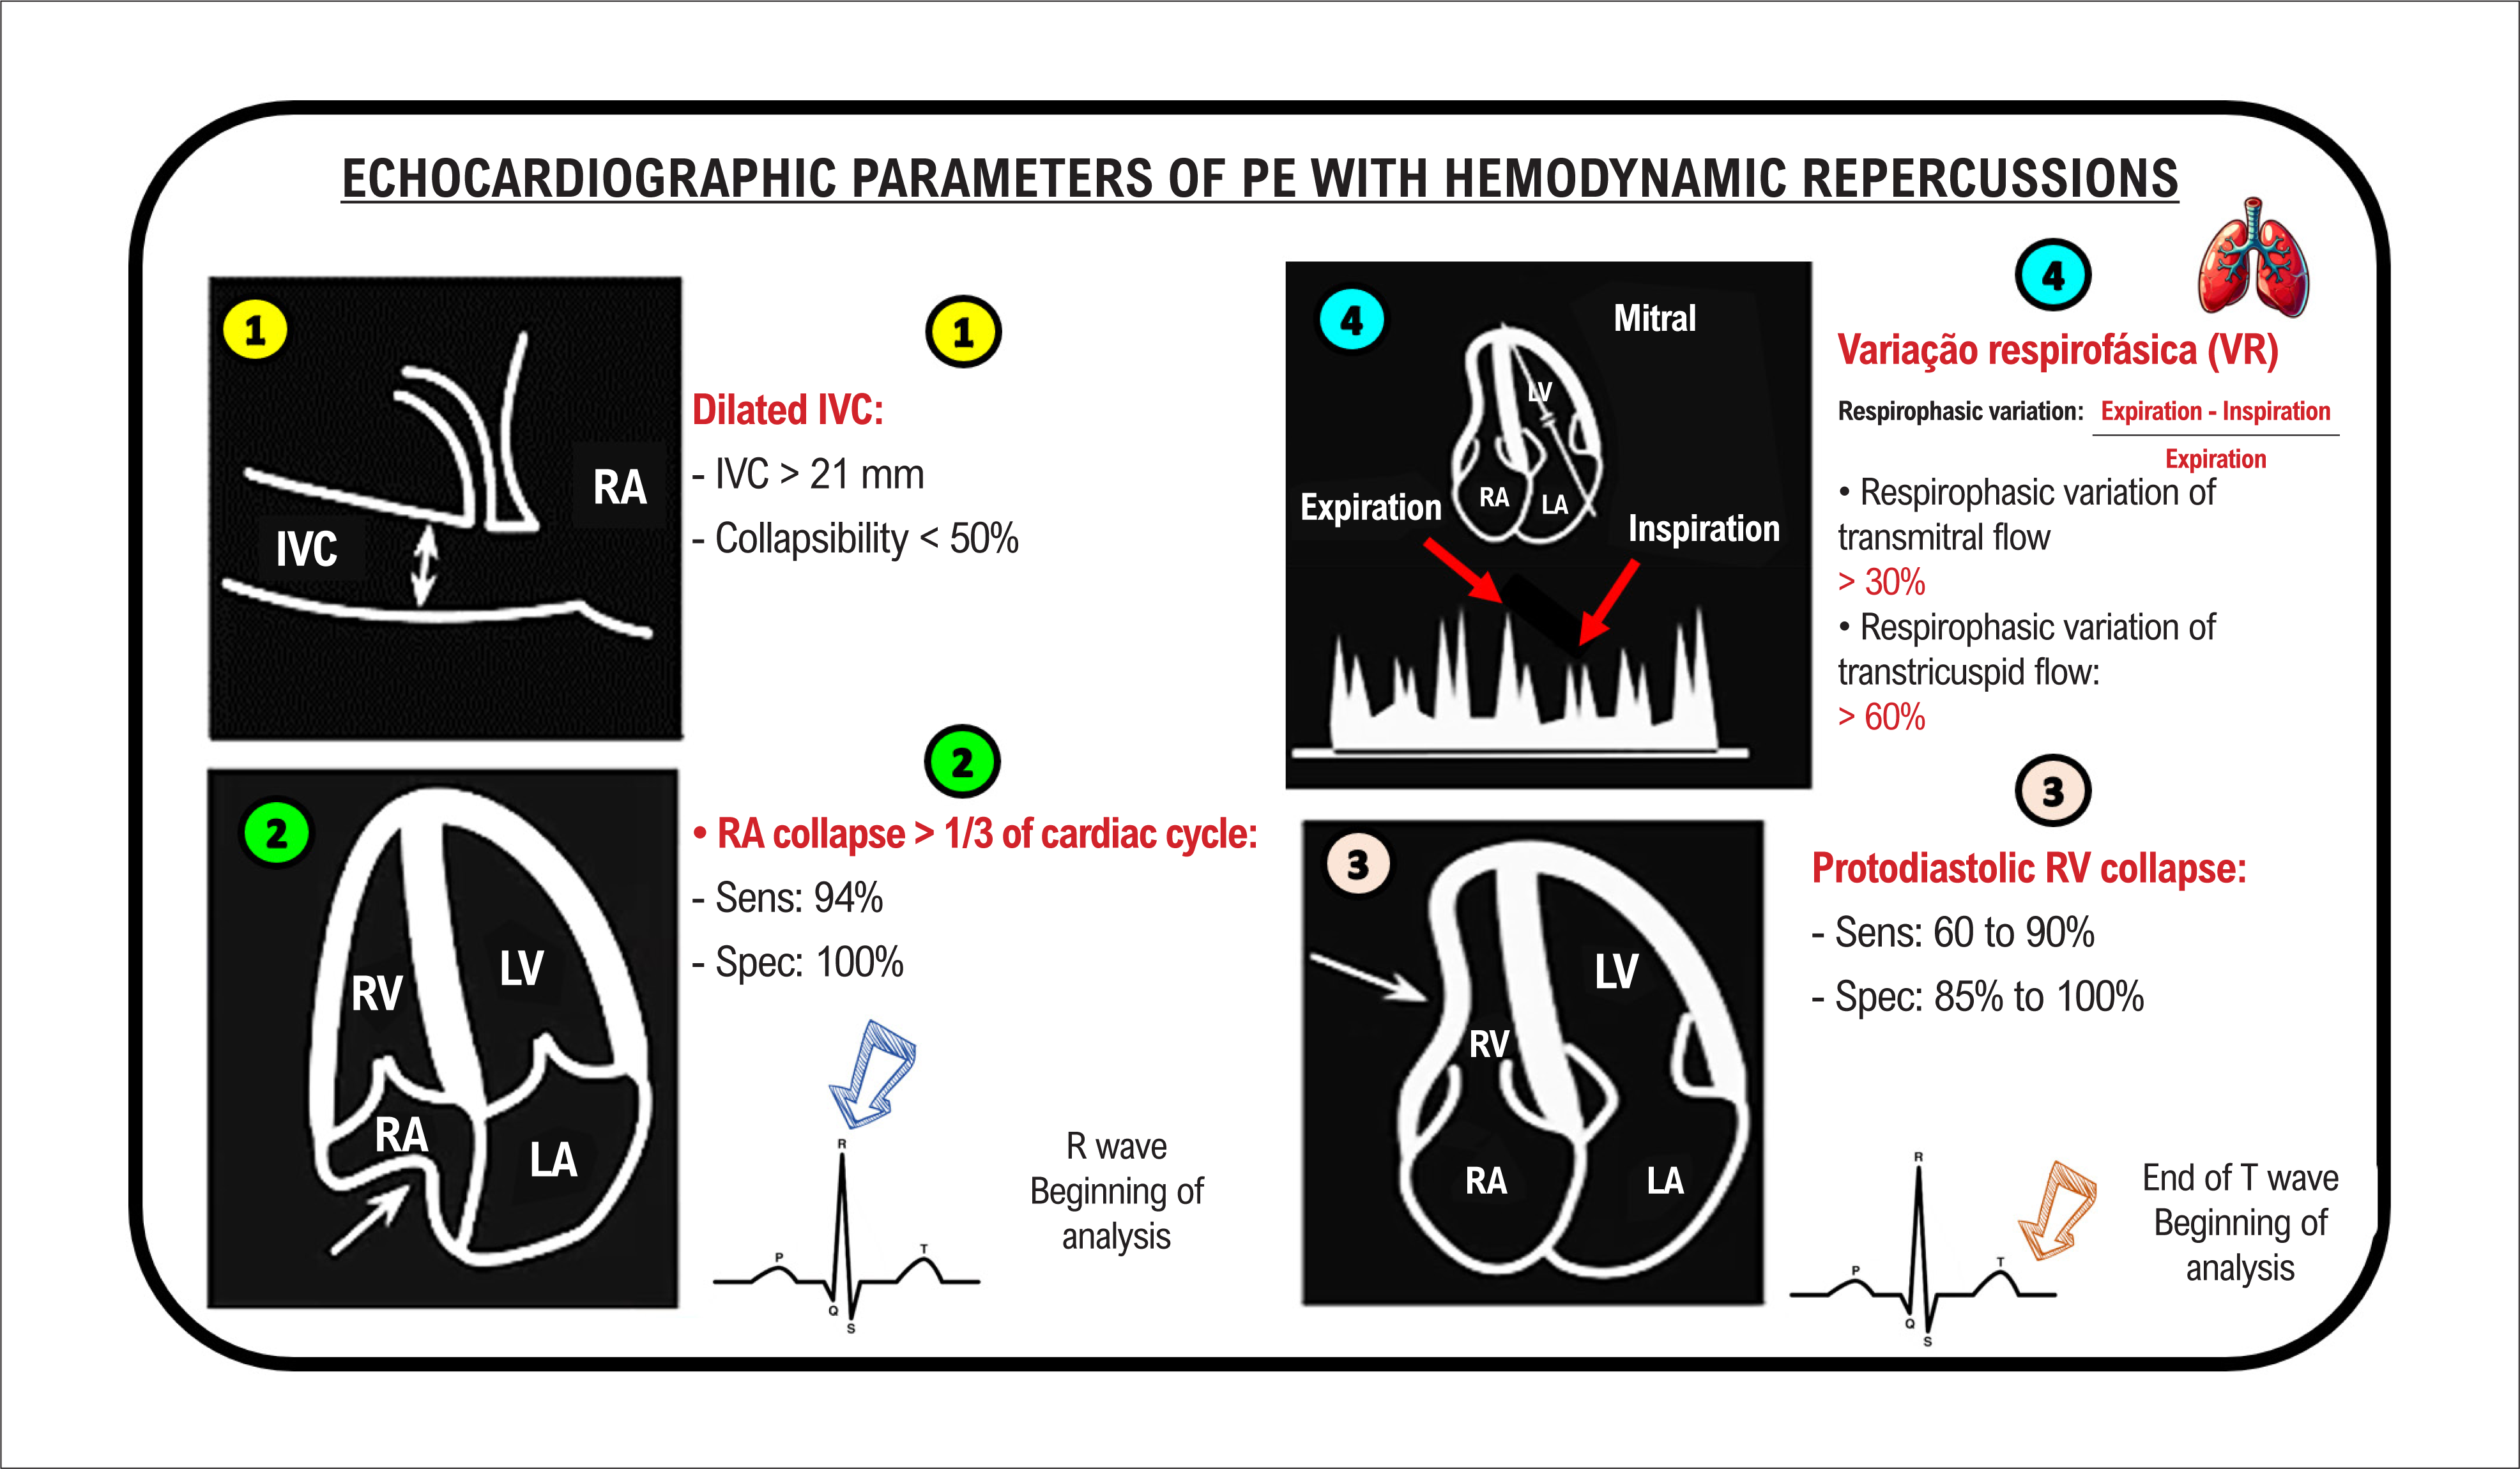
Figure 12 summarizes the main echocardiographic parameters that guide identification of possible hemodynamic repercussions.

Main echocardiographic parameters in the assessment of pericardial effusion with hemodynamic repercussions. IVC: inferior vena cava; LA: left atrium; LV: left ventricle; PE: pericardial effusion; RA: right atrium; RV: right ventricle; Sens: sensitivity; Spec: specificity.
Precautions when reporting pericardial effusion
When reporting findings of PE, it is important to characterize the effusion in terms of appearance, location, size, and signs of hemodynamic repercussion. This characterization is essential, as it allows for comparison over time and identification of hemodynamic repercussions, assisting the care team in decision-making, given that not every case of effusion with echocardiographic signs of hemodynamic repercussions will imply immediate clinical impact. The term "tamponade" should be avoided, because it is, by definition, a clinical diagnosis.
The following provides a suggested description of PE (hypothetical case):
"…Presence of diffuse pericardial effusion, important degree, with a maximum diameter of 27 mm adjacent to the right chambers. Diastolic collapse of the right atrium observed during more than one third of the cardiac cycle, and increased variation of transmitral E wave velocity of 50% identified.
Taken together, these findings are compatible with important pericardial effusion with echocardiographic signs of hemodynamic repercussions."
Conclusion
Assessment of PE and its repercussions is routine, especially in critically ill patients. Characterizing the size, identifying IVC plethora, and analyzing hemodynamic implications, whether by observing chamber collapse or increased variation in transvalvular flows, always considering the limitations of each parameter, require attention, and the findings should be considered together. Thus, because it provides rapid information and can be performed at the bedside, echocardiography is an excellent method for characterizing and assessing the repercussions of PE, making it of fundamental importance to support decision-making by the care team.
-
Sources of Funding
There were no external funding sources for this study.
-
Study Association
This study is not associated with any thesis or dissertation work.
-
Ethics Approval and Consent to Participate
This article does not contain any studies with human participants or animals performed by any of the authors.
-
Use of Artificial Intelligence
The authors did not use any artificial intelligence tools in the development of this work.
Availability of Research Data
The underlying content of the research text is contained within the manuscript.
References
-
1 Adler Y, Charron P, Imazio M, Badano L, Barón-Esquivias G, Bogaert J, et al. 2015 ESC Guidelines for the Diagnosis and Management of Pericardial Diseases: The Task Force for the Diagnosis and Management of Pericardial Diseases of the European Society of Cardiology (ESC)Endorsed by: The European Association for Cardio-Thoracic Surgery (EACTS). Eur Heart J. 2015;36(42):2921-64. doi: 10.1093/eurheartj/ehv318.
» https://doi.org/10.1093/eurheartj/ehv318 -
2 Klein AL, Abbara S, Agler DA, Appleton CP, Asher CR, Hoit B, et al. American Society of Echocardiography Clinical Recommendations for Multimodality Cardiovascular Imaging of Patients with Pericardial Disease: Endorsed by the Society for Cardiovascular Magnetic Resonance and Society of Cardiovascular Computed Tomography. J Am Soc Echocardiogr. 2013;26(9):965-1012.e15. doi: 10.1016/j.echo.2013.06.023.
» https://doi.org/10.1016/j.echo.2013.06.023 -
3 Settle HP, Adolph RJ, Fowler NO, Engel P, Agruss NS, Levenson NI. Echocardiographic Study of Cardiac Tamponade. Circulation. 1977;56(6):951-9. doi: 10.1161/01.cir.56.6.951.
» https://doi.org/10.1161/01.cir.56.6.951 -
4 DeMaria DM, Waring AA, Gregg DE, Litwin SE. Echocardiographic Assessment of Pericardial Effusion Size: Time for a Quantitative Approach. J Am Soc Echocardiogr. 2019;32(12):1615-7.e1. doi: 10.1016/j.echo.2019.08.019.
» https://doi.org/10.1016/j.echo.2019.08.019 -
5 Himelman RB, Kircher B, Rockey DC, Schiller NB. Inferior Vena Cava Plethora with Blunted Respiratory Response: A Sensitive Echocardiographic Sign of Cardiac Tamponade. J Am Coll Cardiol. 1988;12(6):1470-7. doi: 10.1016/s0735-1097(88)80011-1.
» https://doi.org/10.1016/s0735-1097(88)80011-1 -
6 Mercé J, Sagristà-Sauleda J, Permanyer-Miralda G, Evangelista A, Soler-Soler J. Correlation between Clinical and Doppler Echocardiographic Findings in Patients with Moderate and Large Pericardial Effusion: Implications for the Diagnosis of Cardiac Tamponade. Am Heart J. 1999;138(4 Pt 1):759-64. doi: 10.1016/s0002-8703(99)70193-6.
» https://doi.org/10.1016/s0002-8703(99)70193-6 -
7 Gillam LD, Guyer DE, Gibson TC, King ME, Marshall JE, Weyman AE. Hydrodynamic Compression of the Right Atrium: A New Echocardiographic Sign of Cardiac Tamponade. Circulation. 1983;68(2):294-301. doi: 10.1161/01.cir.68.2.294.
» https://doi.org/10.1161/01.cir.68.2.294 -
8 Leimgruber PP, Klopfenstein HS, Wann LS, Brooks HL. The Hemodynamic Derangement Associated with Right Ventricular Diastolic Collapse in Cardiac Tamponade: An Experimental Echocardiographic Study. Circulation. 1983;68(3):612-20. doi: 10.1161/01.cir.68.3.612.
» https://doi.org/10.1161/01.cir.68.3.612 -
9 Hoit BD, Gabel M, Fowler NO. Cardiac Tamponade in Left Ventricular Dysfunction. Circulation. 1990;82(4):1370-6. doi: 10.1161/01.cir.82.4.1370.
» https://doi.org/10.1161/01.cir.82.4.1370 -
10 Hoit BD, Fowler NO. Influence of Acute Right Ventricular Dysfunction on Cardiac Tamponade. J Am Coll Cardiol. 1991;18(7):1787-93. doi: 10.1016/0735-1097(91)90522-b.
» https://doi.org/10.1016/0735-1097(91)90522-b -
11 Appleton CP, Hatle LK, Popp RL. Cardiac Tamponade and Pericardial Effusion: Respiratory Variation in Transvalvular Flow Velocities Studied by Doppler Echocardiography. J Am Coll Cardiol. 1988;11(5):1020-30. doi: 10.1016/s0735-1097(98)90060-2.
» https://doi.org/10.1016/s0735-1097(98)90060-2
Edited by
-
Editor responsible for the review:
Marcelo Tavares