My Approach to VExUS Assessment Using Transesophageal Echocardiography: A Step-by-Step Performance Guide
ABSTRACT
Monitoring systemic venous congestion has become essential in the management of critically ill patients, enabling accurate diagnosis, severity grading, and prognostic stratification. Literature shows that congestion is strongly associated with the development of acute kidney injury and increased mortality when compared with optimized volume states.
In this setting, intraoperative Transesophageal Echocardiography (TEE) has emerged as an advanced and versatile tool. In addition to allowing detailed assessment of cardiac function, TEE is effective in assessing intravascular volume status and predicting fluid responsiveness through dynamic measurement of stroke volume and the degree of systemic congestion. TEE also enables direct visualization of abdominal vessels, such as the hepatic, portal, and intrarenal veins, thereby facilitating the identification of pathological pulsatile flow patterns even in patients with limited transthoracic acoustic windows.
The integration of protocols such as VExUS (or its modified version, mVExUS) allows for a personalized approach focused on "perfusion without congestion." This review outlines the practical application of VExUS assessment using TEE, its technical limitations, and how to use it to guide hemodynamic resuscitation, minimizing organ injury and optimizing clinical outcomes.
Keywords
Transesophageal Echocardiography; Prognosis; Operative Surgical Procedures
Resumo
A monitorização da congestão venosa sistêmica tornou-se essencial no manejo de pacientes críticos, permitindo o diagnóstico preciso, a graduação da severidade e a definição de prognóstico. A literatura demonstra que a presença de congestão está fortemente associada ao desenvolvimento de lesão renal aguda e maior mortalidade, quando comparada a estados de volemia otimizada.
Neste contexto, o uso do Ecocardiograma Transesofágico (ETE) durante o procedimento cirúrgico surge como uma ferramenta avançada e versátil. Além de permitir a avaliação detalhada da função cardíaca, o ETE é eficaz na análise do grau de volemia e na predição de fluido-responsividade através da mensuração dinâmica do volume sistólico e do grau de congestão sistêmica. Também possibilita a visualização direta de vasos abdominais, como as veias hepáticas, porta e intrarrenais, facilitando a identificação de fluxos pulsáteis patológicos mesmo em pacientes com janela transtorácica limitada.
A integração de protocolos como o VExUS (ou sua versão modificada mVExUS) permite uma abordagem personalizada, focando na "perfusão sem congestão". Esta revisão detalha a aplicação prática da avaliação do VExUS pelo ETE, suas limitações técnicas e como utilizá-las para guiar uma ressuscitação hemodinâmica que minimize danos orgânicos e otimize o desfecho clínico.
Palavras-chave
Ecocardiografia Transesofagiana; Prognosis; Procedimentos Cirúrgicos Operatórios
Introduction
For decades, perioperative and critical care hemodynamic monitoring has been centered almost exclusively on macrocirculatory parameters related to forward flow, such as mean arterial pressure, cardiac output, and stroke volume. At the same time, the systemic venous system has remained largely neglected. In this context, central venous pressure was used as the primary — and often the sole — marker of the venous compartment, inappropriately guiding fluid therapy despite consistent evidence of its limited ability to predict fluid responsiveness and its association with systemic venous congestion, target-organ dysfunction, and worse clinical outcomes.1 The contemporary understanding of circulatory pathophysiology integrates the assessment of fluid responsiveness and fluid tolerance, restoring the fundamental role of the venous system in comprehensive hemodynamic monitoring. This paradigm supports personalized interventions informed by microcirculatory markers, such as Capillary Refill Time (CRT) and Near-Infrared Spectroscopy (NIRS), aiming to preserve macro-microcirculatory coherence (hemodynamic coherence) and optimize tissue perfusion.
Evaluation of systemic venous congestion has advanced substantially with the incorporation of ultrasound assessment of visceral vessels, enabling an integrated understanding of the coupling between the venous system and the right heart, including interaction among volume status, right ventricular function, and conditions that impair cardiac filling, such as pericardial disease. In this context, analysis of flow patterns in the inferior vena cava, hepatic veins, portal vein, and intrarenal veins has come to provide direct physiological information regarding the transmission of elevated venous pressure to target organs.2 As early as 2014,3 Transesophageal Echocardiography (TEE) was being used to assess the venous system in hemodynamic instability, and subsequent studies published in 20174 and 20185 demonstrated its relevant prognostic value for cardiovascular surgery outcomes, preceding the formal description of the VExUS score in 2020 (Venous Excess UltraSound) by the Canadian group led by Beaubien-Souligny et al,6 who systematized this evaluation by integrating multiple venous territories into a graded congestion score. Initially intended for patients undergoing cardiac surgery, this tool quickly gained relevance in the management of acute Heart Failure (HF) and in the intensive care setting as a method for quantifying systemic venous congestion, and has been associated with clinically relevant outcomes such as acute kidney injury, need for renal replacement therapy, delirium, prolonged length of stay, and mortality. Operationally, patients with an inferior vena cava diameter < 2 cm are classified as VExUS 0, whereas those with an IVC ≥ 2 cm are stratified as VExUS 1 to 3 according to Doppler patterns of the splanchnic veins. More than a descriptive score, VExUS has been consolidated as a functional tool for assessing fluid tolerance (degree of fluid overload) and for guiding personalized hemodynamic decision-making, supporting the adaptation and systematic application of its criteria through transesophageal echocardiography in the perioperative setting.

In recent years, an expanding body of evidence has reinforced the prognostic impact of VExUS across different clinical scenarios, with initial application in cardiac surgery and rapid expansion to acute heart failure and intensive care settings, including incorporation into contemporary hemodynamic assessment protocols for septic shock. In acute heart failure, VExUS has proven to be a feasible, reproducible, and prognostically relevant tool from the time of admission. Saddi et al. demonstrated that patients hospitalized for acute heart failure who showed improvement in the VExUS score after reassessment at 72 hours had a 58% reduction in in-hospital mortality compared with those who did not respond to diuretic therapy.7 Similarly, Lozano-Jiménez et al. reported that at hospital discharge, approximately 24% of patients deemed clinically compensated still had residual systemic venous congestion (VExUS ≥ 1) and experienced a higher rate of adverse events within six months, including mortality, heart failure readmissions, and emergency visits for decompensation, at a magnitude comparable to patients with clinically evident congestion at discharge.8
The use of Transesophageal Echocardiography (TEE) for systematic assessment of the VExUS score was protocolized beginning in 2024 by the group led by Waldron et al. at the Mayo Clinic, expanding the applicability of the method in the perioperative environment.9 With TEE, image acquisition of the inferior vena cava, hepatic veins, and portal vein is, in most cases, feasible and reproducible, whereas assessment of the intrarenal veins may be technically limited. In this context, a 2025 study validated the modified VExUS, in which exclusion of intrarenal Doppler did not compromise diagnostic accuracy.10 Compared with right heart catheterization, the modified VExUS performed similarly to the traditional score in identifying elevated right atrial pressure (RAP > 12 mmHg), with comparable areas under the curve (AUC 0.85 vs. 0.87) and near-perfect agreement between methods (κ = 0.85), outperforming isolated assessment of inferior vena cava diameter. These findings support the use of abbreviated protocols based on venous territories accessible by TEE to reliably estimate systemic venous congestion in the perioperative setting, enabling personalized hemodynamic evaluation within a multimodal monitoring framework.
Technique for Obtaining VExUS Using TEE
Image 1: Assessment of the IVC (Figure 1)
Left: IVC obtained from the mid-esophageal window with angulation approximately 50–80°, allowing optimal long-axis (LAX) visualization, and 140–170° for the short-axis (SAX) view. The IVC appears plethoric (2.5 cm) and circular on SAX, consistent with systemic congestion (sphericity index 0.88). Right: Progressive improvement in congestion, with IVC diameter: 1.8 cm and an oval shape on SAX (sphericity index: 0,61).
The Inferior Vena Cava (IVC) and the inferior cavoatrial junction can be imaged from either the mid-esophageal or transgastric window, provided that appropriate adjustments in probe rotation, depth, and flexion are made. In practice, the IVC is most often visualized from the mid-esophageal window, using the bicaval view as the starting reference. From there, clockwise rotation of the probe and gradual advancement allow identification of the cavoatrial junction and hepatic veins. At this stage, adjusting the multiplane angle of the bicaval view, typically from 110–120° to approximately 50–80°, provides a more suitable long-axis view of the IVC.
Measurement of the IVC in two orthogonal planes is essential, as its cross-section is typically elliptical and varies throughout the respiratory cycle. Therefore, one-dimensional long-axis measurements often fail to accurately reflect its true morphology or the relationship among vascular geometry, venous compliance, and Central Venous Pressure (CVP). In this context, Seo et al. demonstrated that the sphericity index—defined as the ratio between the minor and major diameters of the IVC in cross-section—best characterized the degree of systemic congestion and showed superior performance for detecting CVP > 10 mmHg, with a reference value of 0.69 and an AUC of 0.98.11 This index appears particularly useful in patients with low body surface area, in whom IVC diameters smaller than 2.0 cm may still reflect elevated venous pressures.
Based on these findings, it is recommended to obtain IVC images approximately 2 cm from the cavoatrial junction to allow reliable diameter assessment and, when feasible, calculation of the sphericity index.
Technical pitfalls: Patients under positive intrathoracic pressure (mechanical ventilation) often have a dilated IVC, which requires cautious interpretation.
Image 2: Assessment of the Hepatic Veins (Figure 2)
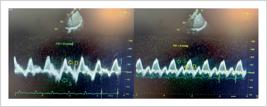
Left: Slight advancement of the probe from the IVC view reveals the left hepatic vein. Significant systemic congestion is evident by S-wave reversal (retrograde) while the D wave remains antegrade (Type 3 flow). The retrograde S wave is easily identified immediately after the QRS complex on the ECG. Right: Clinical improvement in the same patient, with antegrade S wave and S > D pattern (Type 1 flow). S wave: green arrow. D wave: yellow arrow.
In most cases, the IVC image itself already reveals the confluence of the hepatic veins, sometimes requiring only slight advancement of the probe to optimize visualization, typically in the mid-to-distal esophagus or stomach. On TEE, the hepatic vein lies inferior to the IVC, has thin walls, and drains directly into it, with flow directed toward the transducer. Under physiological conditions, systolic and diastolic flows appear in red on color Doppler and above the baseline on pulsed-wave Doppler.
The transgastric window provides an effective alternative for hepatic vein assessment, producing an image similar to the subcostal view in transthoracic echocardiography. In this approach, the hepatic veins appear in the near field, while the IVC is visualized in the far field. Under normal conditions, color Doppler shows systolic and diastolic hepatic flows in blue, indicating flow away from the probe. A key advantage of this approach is the ease of access to the portal vein: by adjusting the imaging plane between 20–60°, its branches can be visualized in long axis, allowing full application of the VExUS protocol in a manner similar to the transhepatic technique.
In the absence of significant systemic congestion, hepatic vein flow demonstrates an S wave larger than the D wave (Type 1 pattern). As venous congestion increases, the S wave progressively decreases, leading to S/D reversal (S < D) while maintaining antegrade flow (Type 2 pattern), until in advanced stages the S wave becomes reversed, defining the Type 3 pattern.
Technical pitfalls: because of low flow velocities, the color Doppler scale should be set between 20–30 cm/s, and the pulsed-wave Doppler sample volume positioned 1–2 cm from the IVC junction. Another common error is failure to use ECG tracing to correctly distinguish S and D waves, which may lead to misinterpretation.
In patients with severe tricuspid regurgitation, portal vein Doppler is the most reliable ultrasound marker for monitoring decongestion, whereas hepatic and renal venous flow assessment may be significantly limited, as shown in a recent study.12
Image 3: Assessment of the Portal Vein (Figure 3)
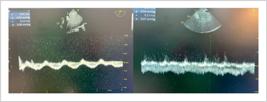
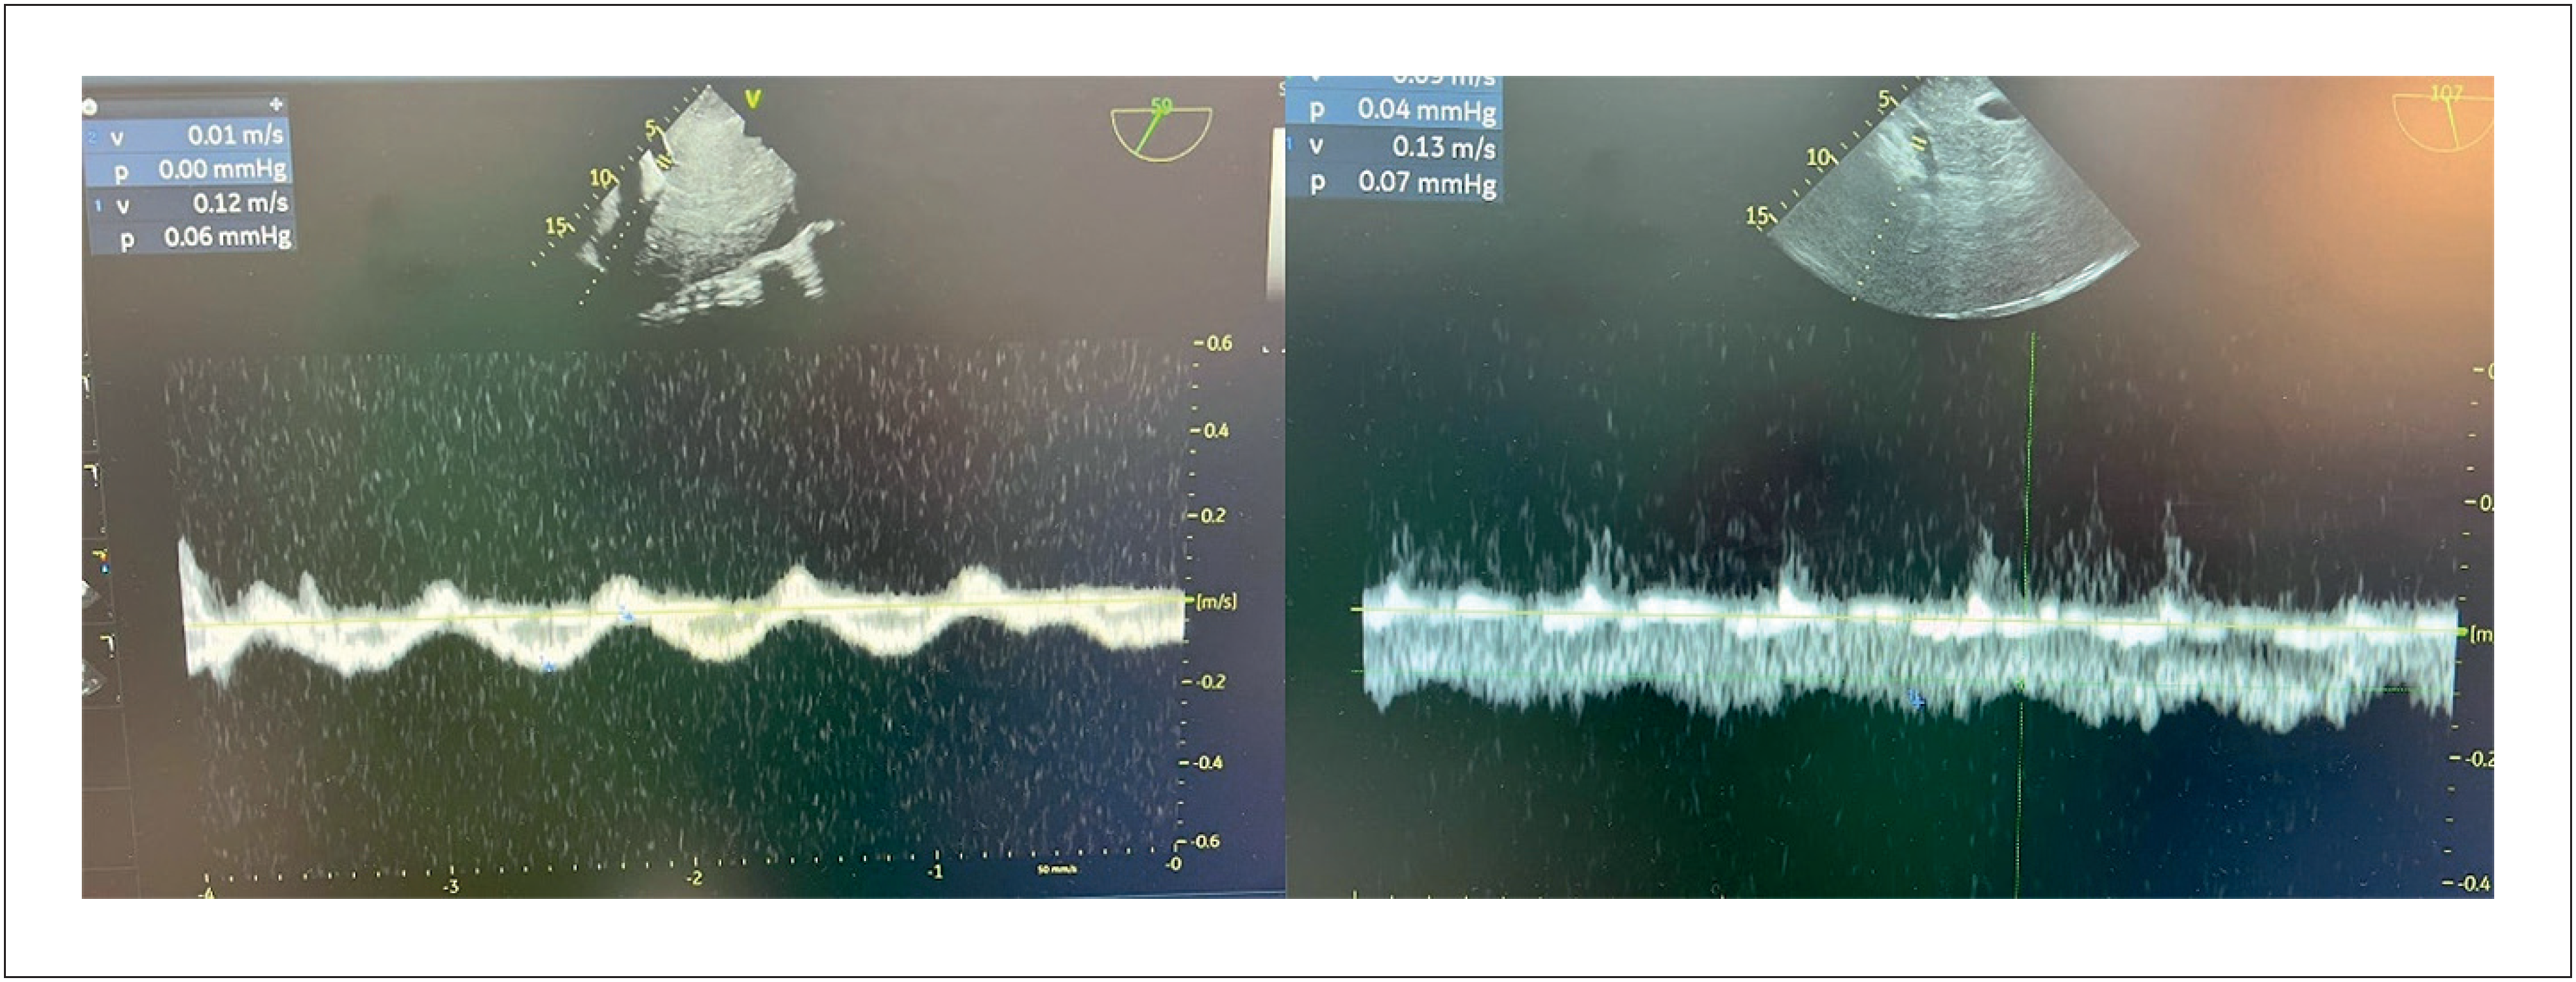
Left: Portal vein with flow variability > 50%, indicating severe congestion (Type 3 flow). Right: Restoration of normal phasicity of the portal vein, indicating resolution of congestion (Type 1 flow).
The portal vein can be evaluated from the mid-distal esophagus or the transgastric window using the same approach employed for hepatic vessel visualization, sometimes requiring small rotational movements or minor advancement/withdrawal of the probe.
The portal vein is characterized by thick walls and flow directed away from the transducer (blue on color Doppler and below the baseline on pulsed Doppler). In the absence of systemic congestion, the pulsatility index [(Vmax − Vmin)/Vmax × 100] is < 30% (Type 1). As congestion develops, this variability increases (30–50%; Type 2) and becomes markedly accentuated in severe congestion (> 50%; Type 3). This occurs because progressive congestion leads to dilation of hepatic sinusoids, which act as a buffer to systemic pulsatility; as this buffering capacity is exceeded, pulsatility becomes more pronounced. The portal vein pulsatility index is among the most reliable parameters for monitoring volume removal, particularly in certain congestion phenotypes such as severe tricuspid regurgitation.
Technical pitfalls: as with hepatic veins, low velocities require color Doppler settings between 20–30 cm/s. Cirrhotic patients may have altered portal flow patterns that complicate interpretation.
Image 4: Assessment of the Renal Interlobar Vein (Figure 4)
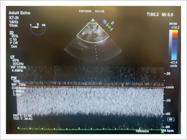
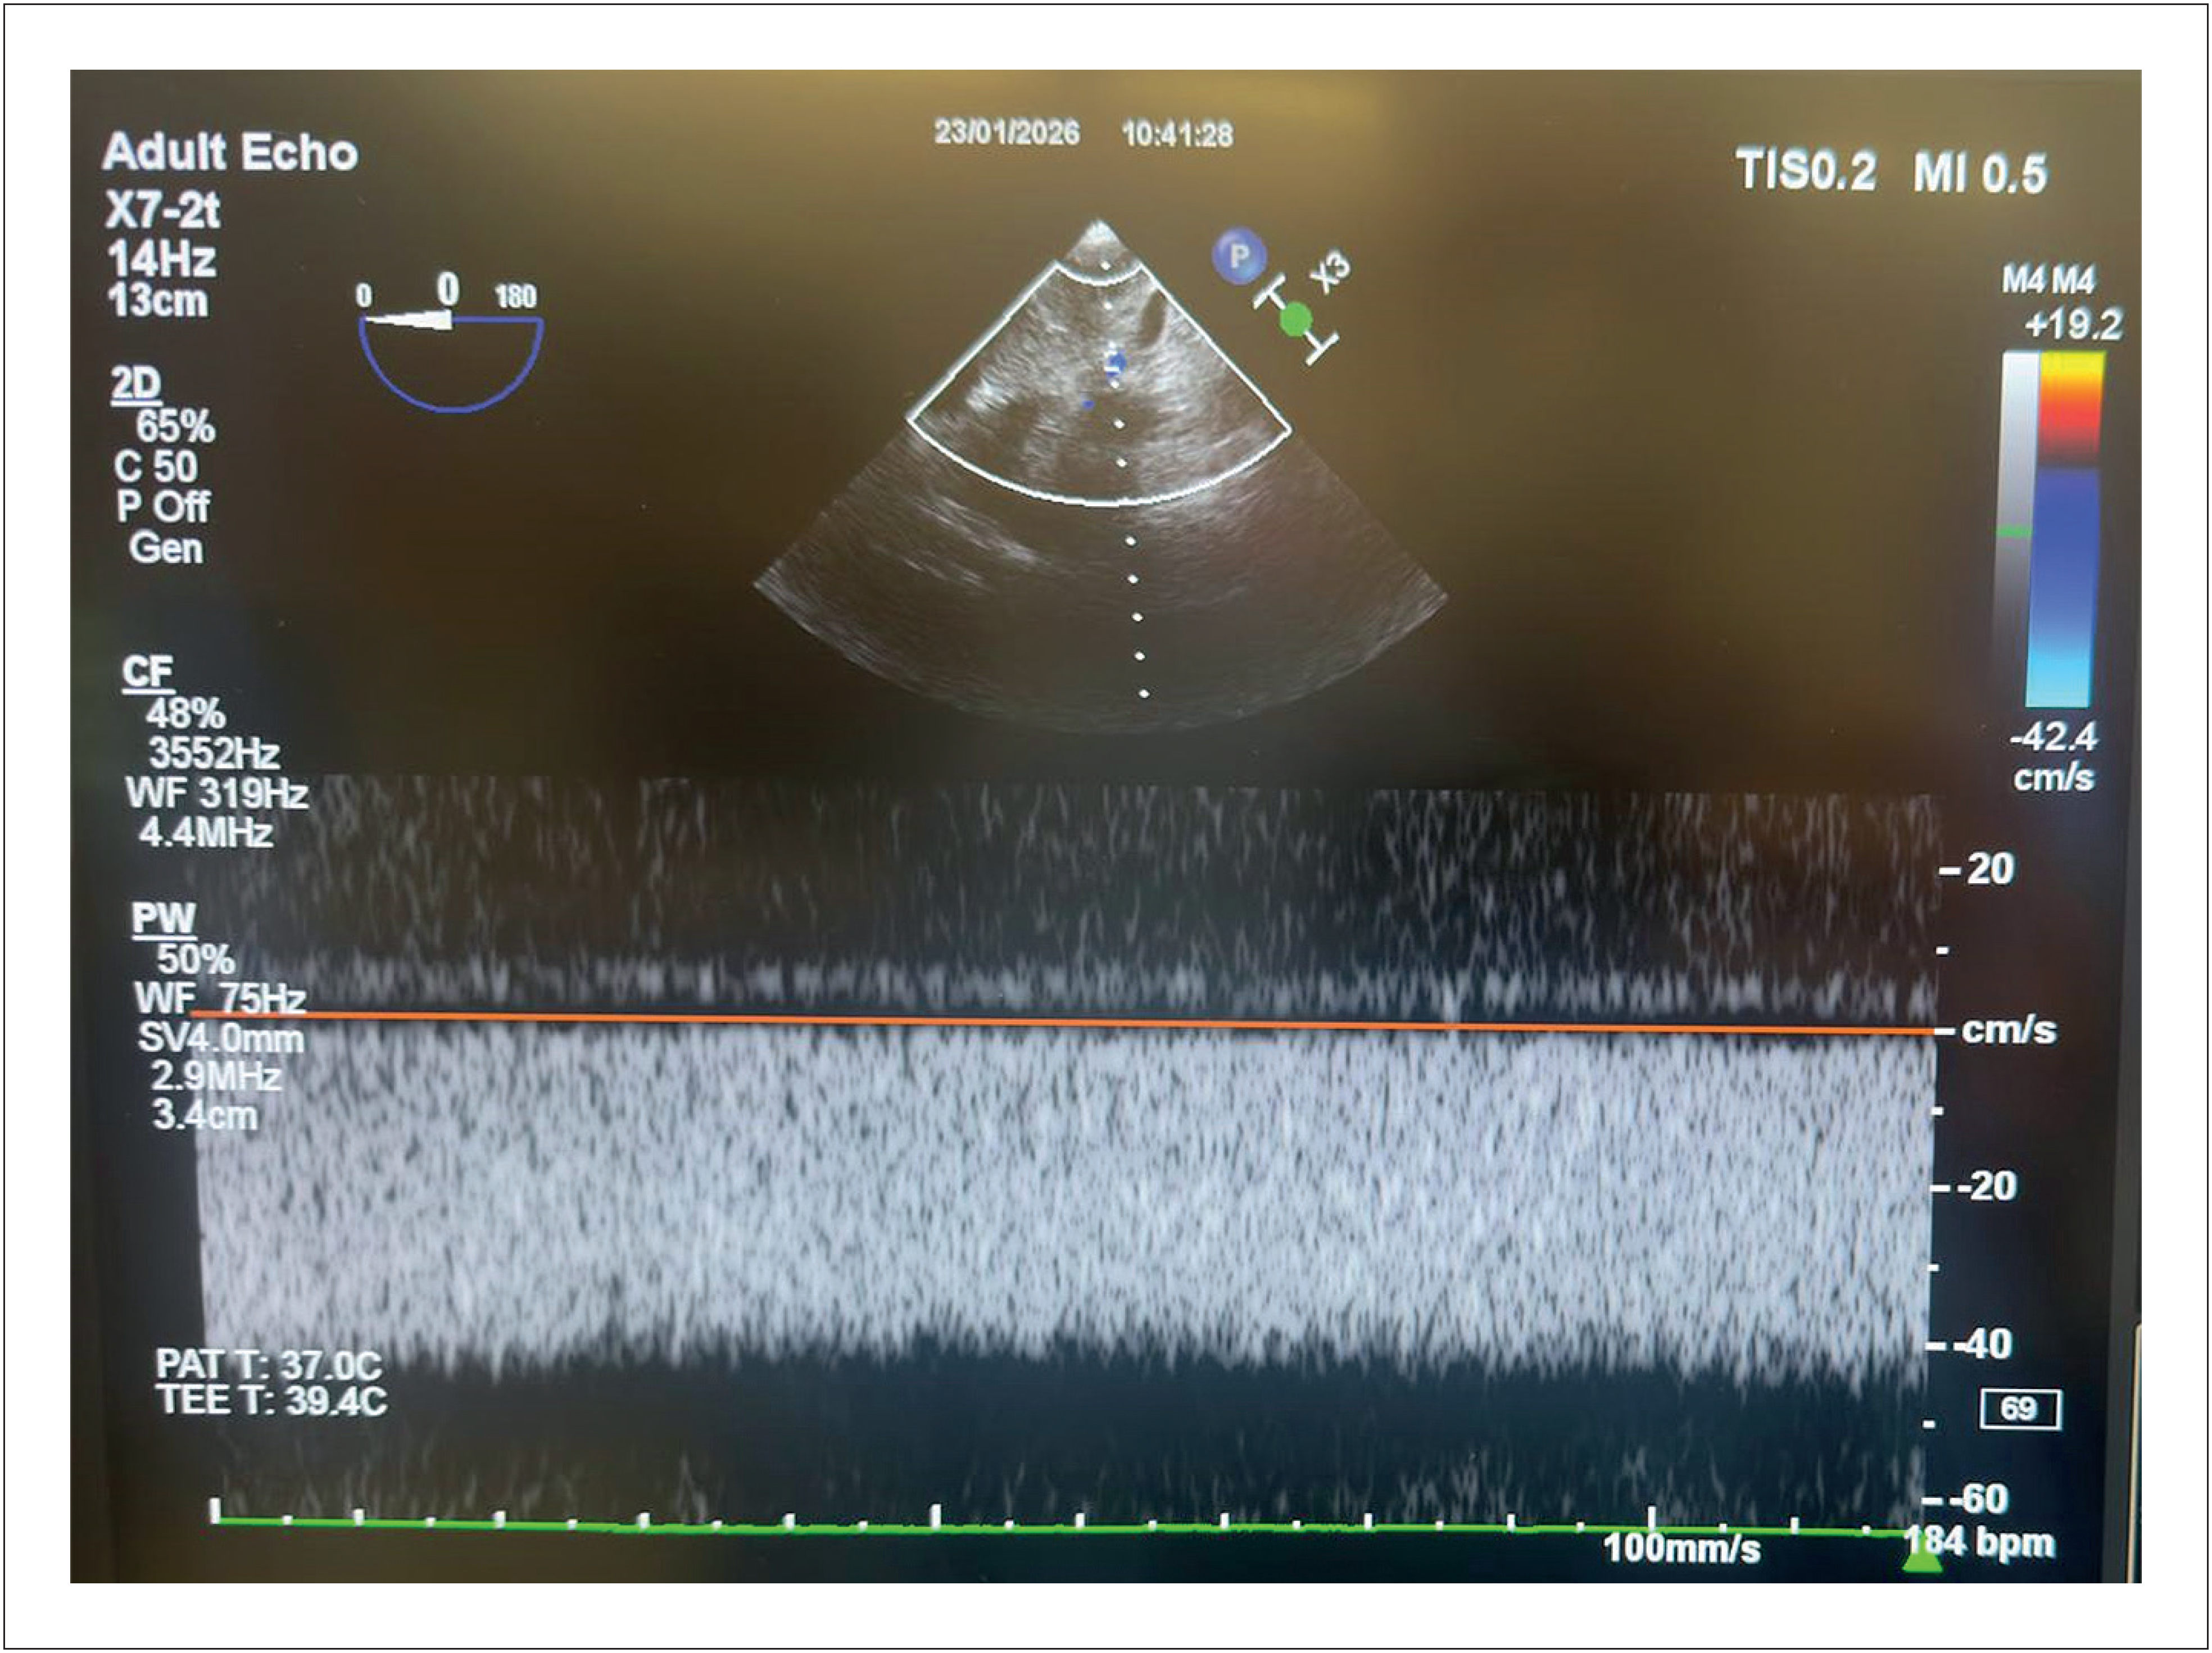
Interlobar renal venous flow showing a continuous pattern (continuous flow below baseline), characteristic of the absence of renal congestion (Type 1).
Among visceral vessels, the renal interlobar vein is the most technically challenging to assess, both by transthoracic and transesophageal echocardiography. Because these vessels are small and highly mobile with respiration, evaluation is not always feasible. Current evidence suggests that renal interlobar vein assessment is not mandatory for estimating the VExUS score; analysis of the IVC, portal vein, and hepatic veins is generally sufficient for quantifying systemic congestion, making renal assessment nonessential during surgical procedures. However, early studies indicated that impaired intrarenal flow correlated more strongly with progression to renal failure than abnormalities in other vessels. Further research is needed to clarify the diagnostic and prognostic value of renal assessment for systemic congestion during surgery.
To locate the left kidney via TEE, begin by rotating the probe to approximately 180° to identify the descending aorta in the distal esophagus. After locating it, advance the probe while applying leftward (counterclockwise) rotation until the renal parenchyma is visualized. For a longitudinal view, rotate to 90° and continue counterclockwise rotation from the aortic short-axis image while advancing until the kidney is identified. Regarding flow patterns, continuous venous flow indicates the absence of significant systemic congestion (Type 1). Type 2 is characterized by biphasic, discontinuous flow with peaks during systole and diastole. With worsening congestion, Type 3 flow appears, in which venous flow is present only during diastole. Depending on orientation, venous flow may appear above or below the baseline and is often accompanied by interlobar arterial flow in the opposite direction due to the close proximity of the vessels.
Pitfalls: Renal imaging by TEE is difficult and often yields suboptimal image quality. Because of very low velocities, the color Doppler scale should be set below 20 cm/s.
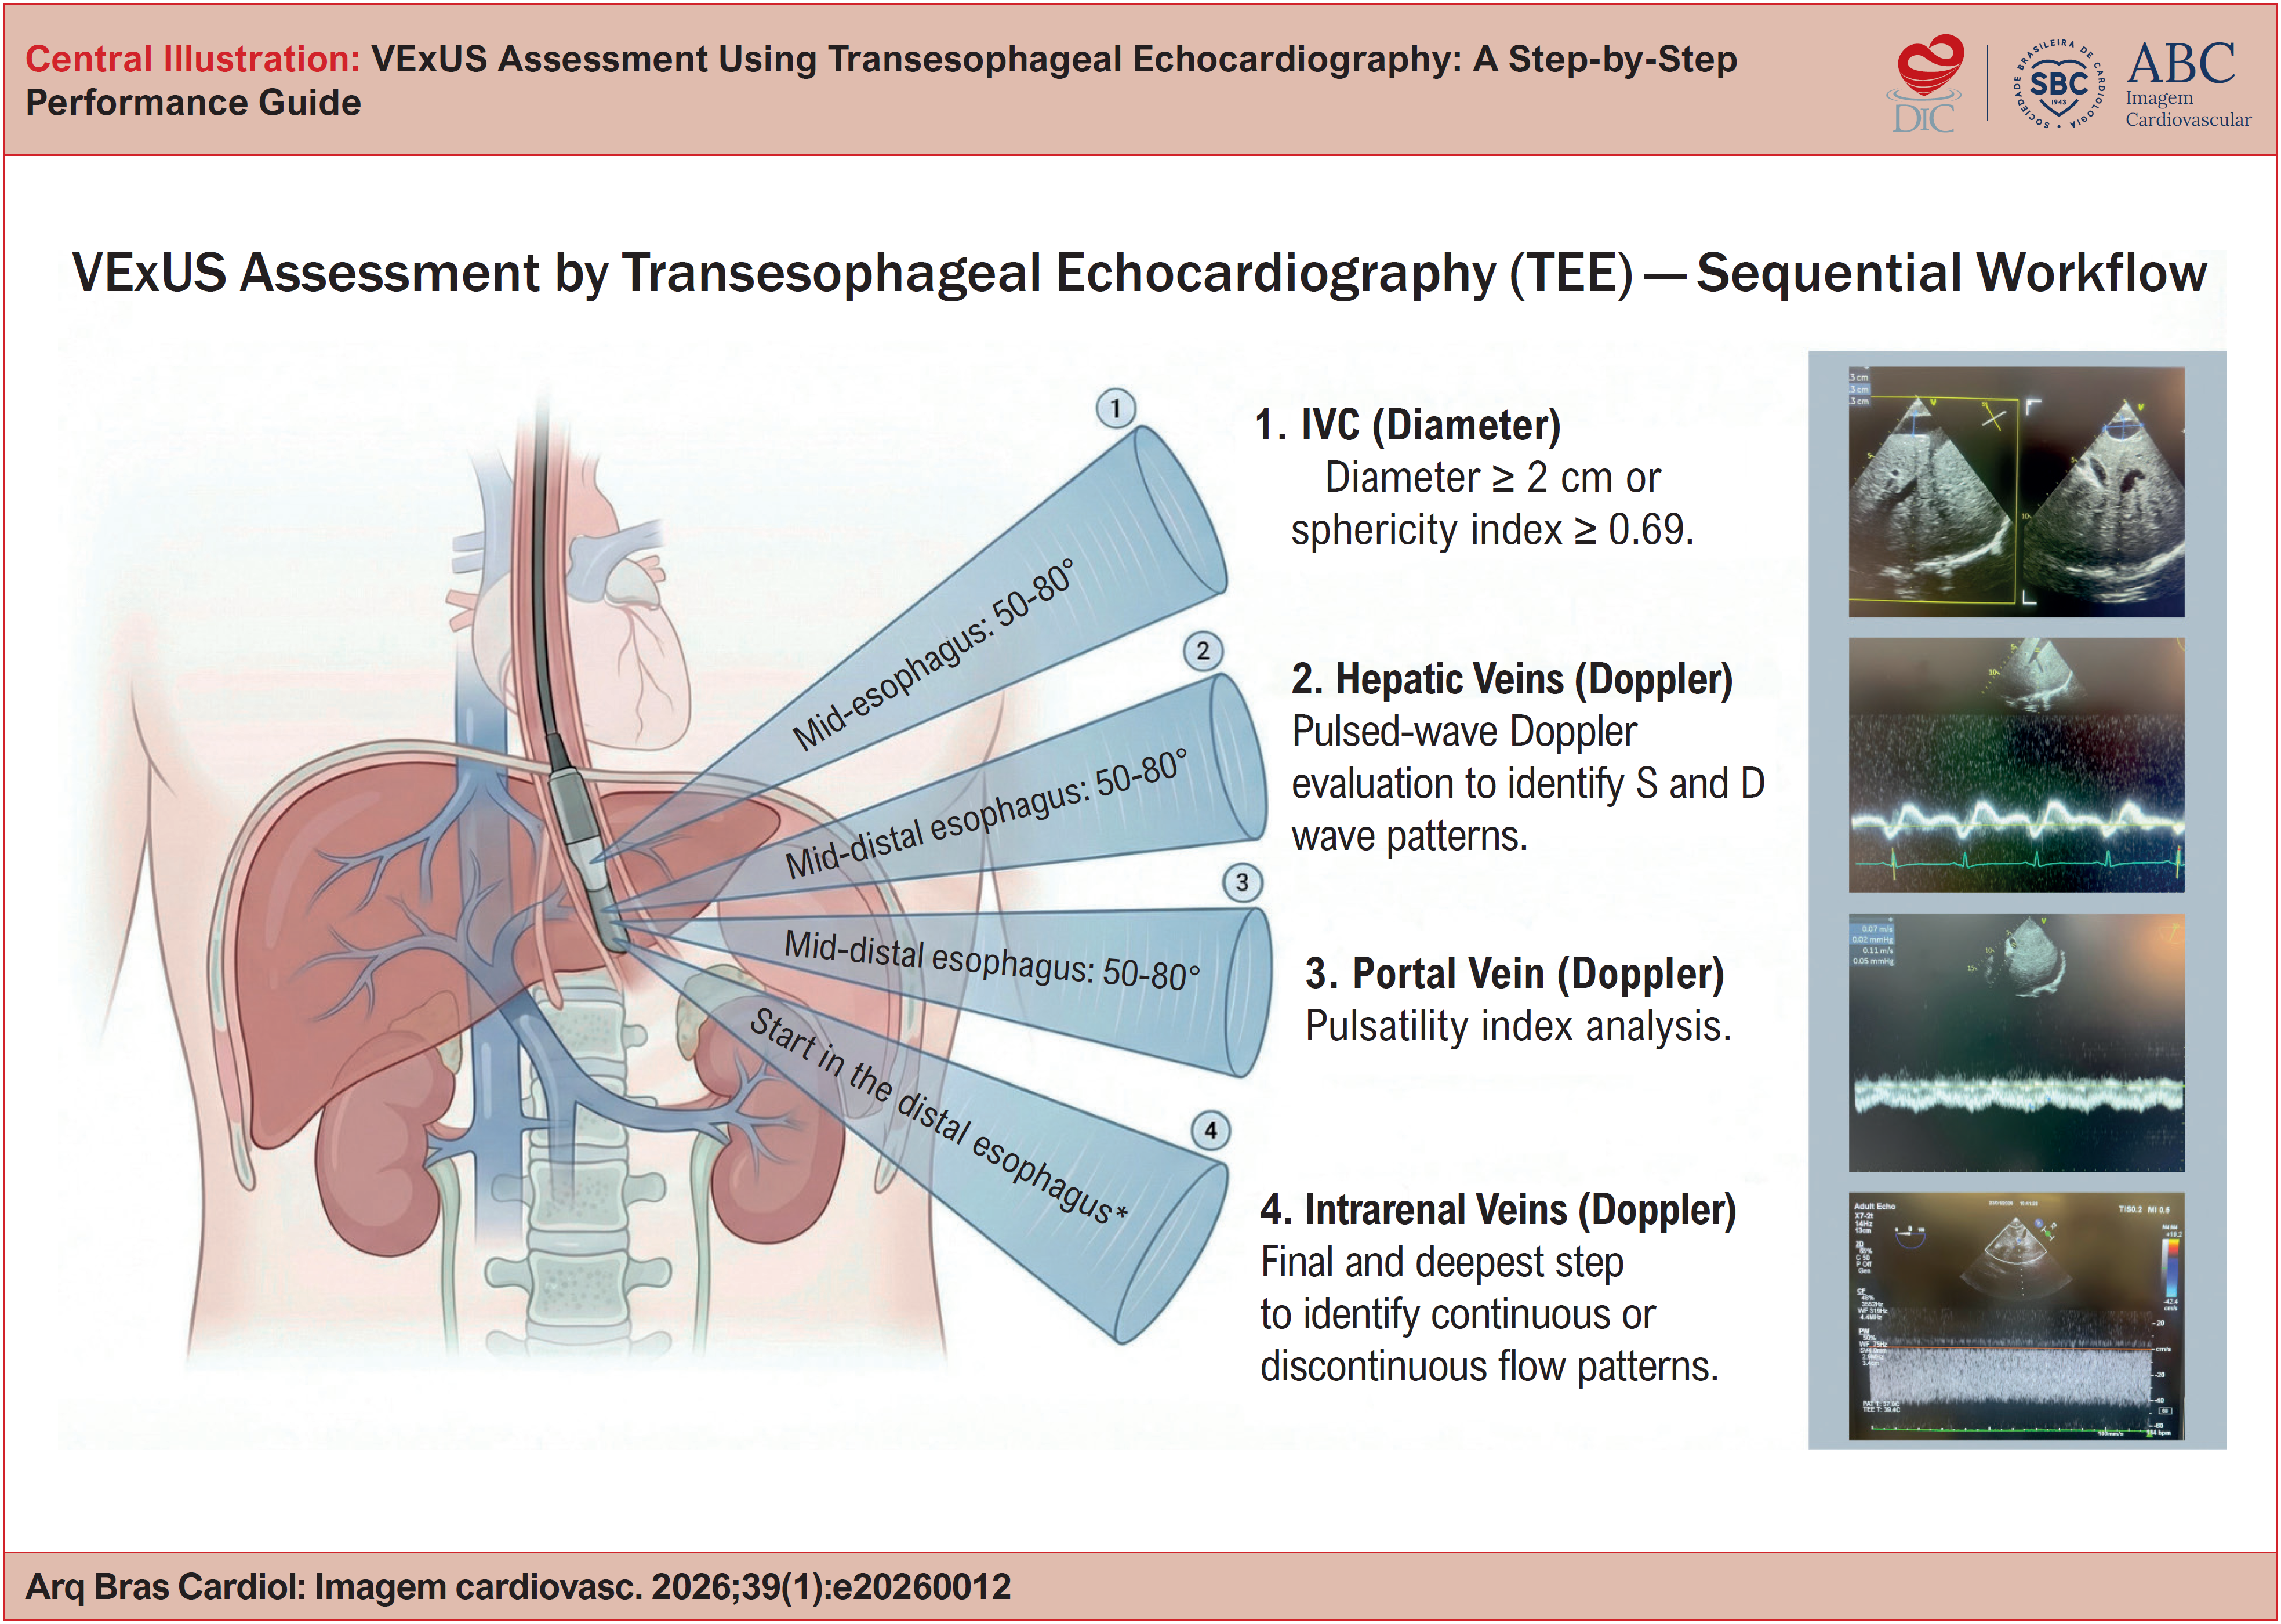
The sequential acquisition of TEE images is summarized schematically in the central figure.
Discussion
VExUS should be viewed not as a standalone tool but as a strategic component of truly multimodal hemodynamic monitoring, aligned with contemporary physiopathological models such as the hemodynamic interfaces theory proposed by Rola et al.13 This conceptual model of four interfaces offers a holistic and personalized framework for shock resuscitation, shifting the focus beyond simple normalization of Mean Arterial Pressure (MAP) and protocolized fluid administration.
-
Interface I (Ventricular-Arterial Coupling): Focuses on the relationship between Left Ventricular (LV) contractile performance and arterial afterload.
-
Interface II (Arteriolar-Capillary Coupling): Represents the transition from macrocirculation to microcirculation, where blood moves from arterioles into capillaries.
-
Interface III (Capillary-Venular Interface): Centers on the venous side. Highlights that elevated central venous pressure impairs perfusion by causing stasis and edema, even when arterial flow appears adequate.
-
Interface IV (Right Ventricular–Pulmonary Artery Coupling): Evaluates the interaction between the Right Ventricle (RV) and the pulmonary circulation. Within this framework, the goal of intraoperative hemodynamic monitoring extends beyond normalization of macro-hemodynamic variables. The primary objective becomes optimization of tissue perfusion (Interface II) and organ function. VExUS fits clearly within this model by assessing Interface III (capillary-venular), which reflects venous drainage, organ outflow, and the presence of systemic venous congestion—now recognized as a key causal mechanism of organ dysfunction.
At the same time, Interface III represents only one component of global hemodynamic assessment. Using VExUS in isolation, without considering the other interfaces, may lead to incomplete interpretation and suboptimal clinical decisions. Echocardiography, therefore, assumes a unique and central role, as it enables integrated evaluation of both the Interface I (LV–arterial coupling), Interface IV (RV–PA coupling), and Interface III (capillary/venular), through the analysis of the IVC and systemic venous flows (hepatic/portal and renal).
Especially during intraoperative management, echocardiography emerges as a comprehensive hemodynamic monitor capable of integrating flow generation, distribution, and venous drainage, overcoming fragmented approaches based on isolated parameters. Within this model, VExUS complements and refines the assessment of venous congestion and guides physiologically coherent decongestive strategies. In essence, the principal contribution of VExUS is to enhance the evaluation of Interface III by identifying scenarios in which impaired tissue perfusion results not from insufficient supply but from compromised venous drainage. When integrated into a multimodal, interface-guided approach, VExUS supports the shift from number-centered monitoring toward physiology-based monitoring focused on perfusion and clinically meaningful outcomes.
Conclusion
Performing the VExUS protocol using TEE (or its modified version, mVExUS) during surgical procedures is feasible and enables a personalized approach centered on the concept of "perfusion without congestion." It can assist in volume management and help prevent fluid overload that may lead to serious intraoperative or early postoperative complications.
-
Sources of Funding
There were no external funding sources for this study.
-
Study Association
This study is not associated with any thesis or dissertation work.
-
Ethics Approval and Consent to Participate
This article does not contain any studies with human participants or animals performed by any of the authors.
-
Use of Artificial Intelligence
During the preparation of this work, the author(s) used ChatGPT to create the Central Figure. After using this tool/service, the author(s) reviewed and edited the content as needed and take full responsibility for the content of the published article.
Availability of Research Data
The underlying content of the research text is contained within the manuscript.
References
-
1 Stassen J, Falter M, Herbots L, Timmermans P, Dendale P, Verwerft J. Assessment of Venous Congestion Using Vascular Ultrasound. JACC Cardiovasc Imaging. 2023;16(3):426-31. doi: 10.1016/j.jcmg.2022.12.028.
» https://doi.org/10.1016/j.jcmg.2022.12.028 -
2 Salgado AA, Bernardo MPL, Netto FM. My Approach to Evaluate Systemic Venous Congestion: VExUS Protocol. Arq Bras Cardiol: Imagem cardiovasc. 2024;37(2):e20240026. doi: 10.36660/abcimg.20240026.
» https://doi.org/10.36660/abcimg.20240026 -
3 Denault A, Vegas A, Royse C. Bedside Clinical and Ultrasound-Based Approaches to the Management of Hemodynamic Instability--Part I: Focus on the Clinical Approach: Continuing Professional Development. Can J Anaesth. 2014;61(9):843-64. doi: 10.1007/s12630-014-0203-0.
» https://doi.org/10.1007/s12630-014-0203-0 -
4 Denault AY, Beaubien-Souligny W, Elmi-Sarabi M, Eljaiek R, El-Hamamsy I, Lamarche Y, et al. Clinical Significance of Portal Hypertension Diagnosed with Bedside Ultrasound after Cardiac Surgery. Anesth Analg. 2017;124(4):1109-15. doi: 10.1213/ANE.0000000000001812.
» https://doi.org/10.1213/ANE.0000000000001812 -
5 Beaubien-Souligny W, Eljaiek R, Fortier A, Lamarche Y, Liszkowski M, Bouchard J, et al. The Association between Pulsatile Portal Flow and Acute Kidney Injury after Cardiac Surgery: A Retrospective Cohort Study. J Cardiothorac Vasc Anesth. 2018;32(4):1780-7. doi: 10.1053/j.jvca.2017.11.030.
» https://doi.org/10.1053/j.jvca.2017.11.030 -
6 Beaubien-Souligny W, Rola P, Haycock K, Bouchard J, Lamarche Y, Spiegel R, et al. Quantifying Systemic Congestion with Point-Of-Care Ultrasound: Development of the Venous Excess Ultrasound Grading System. Ultrasound J. 2020;12(1):16. doi: 10.1186/s13089-020-00163-w.
» https://doi.org/10.1186/s13089-020-00163-w -
7 Saadi MP, Silvano GP, Machado GP, Almeida RF, Scolari FL, Biolo A, et al. Modified Venous Excess Ultrasound: A Dynamic Tool to Predict Mortality in Acute Decompensated Heart Failure. J Am Soc Echocardiogr. 2025;38(12):1129-41. doi: 10.1016/j.echo.2025.08.011.
» https://doi.org/10.1016/j.echo.2025.08.011 -
8 Lozano-Jiménez S, Sebastian CG, Martín PV, Magallón BG, Centellas AM, Castro D, et al. Prevalence and Prognostic Impact of Subclinical Venous Congestion in Patients Hospitalized for Acute Heart Failure. Eur Heart J Acute Cardiovasc Care. 2026;14(12):749-53. doi: 10.1093/ehjacc/zuaf097.
» https://doi.org/10.1093/ehjacc/zuaf097 -
9 Waldron NH, Pandompatam G, Sareyyupoglu B, Kalagara H. Transesophageal Echocardiographic Acquisition of the Venous Excess Ultrasound Exam-a Case Series and Technical Description. Can J Anaesth. 2024;71(3):422-30. doi: 10.1007/s12630-023-02688-9.
» https://doi.org/10.1007/s12630-023-02688-9 -
10 Martin KC, Gill EA, Douglas IJ, Longino AA. Evaluation of a Modified Venous Excess Ultrasound (VExUS) Protocol for Estimation of Venous Congestion: A Cohort Study. Ultrasound J. 2025;17(1):7. doi: 10.1186/s13089-025-00411-x.
» https://doi.org/10.1186/s13089-025-00411-x -
11 Seo Y, Iida N, Yamamoto M, Machino-Ohtsuka T, Ishizu T, Aonuma K. Estimation of Central Venous Pressure Using the Ratio of Short to Long Diameter from Cross-Sectional Images of the Inferior Vena Cava. J Am Soc Echocardiogr. 2017;30(5):461-7. doi: 10.1016/j.echo.2016.12.002.
» https://doi.org/10.1016/j.echo.2016.12.002 -
12 Alday-Ramírez SM, Leal-Villarreal MAJ, Gómez-Rodríguez C, Abu-Naeima E, Solis-Huerta F, Gamba G, et al. Portal vein Doppler Tracks Volume Status in Patients with Severe Tricuspid Regurgitation: A Proof-of-Concept Study. Eur Heart J Acute Cardiovasc Care. 2024;13(7):570-4. doi: 10.1093/ehjacc/zuae057.
» https://doi.org/10.1093/ehjacc/zuae057 -
13 Rola P, Kattan E, Siuba MT, Haycock K, Crager S, Spiegel R, et al. Point of View: A Holistic Four-Interface Conceptual Model for Personalizing Shock Resuscitation. J Pers Med. 2025;15(5):207. doi: 10.3390/jpm15050207.
» https://doi.org/10.3390/jpm15050207
Edited by
-
Editor responsible for the review:
Marcelo Tavares