
 Economic viability of juveniles tilapia and arugula production integrated in aquaponics in system NFT
Abstract
This study aimed to evaluate the economic feasibility of implementing an aquaponic system using different stocking densities of tilapia juveniles integrated with arugula production in a Nutrient Film Technique (NFT) system. To gather data for the economic analysis, an experiment was conducted using a completely randomized 3 x 2 factorial design (densities: 20, 40, and 60 fish/m³; filter media volumes: 50 and 70 liters of expanded clay), with three replications. Each experimental unit consisted of an NFT aquaponic module. The economic analysis included calculations of net present value, internal rate of return, profitability index, and payback period. Results showed that fish stocking density significantly affects the economic viability of an aquaponic system integrating tilapia juveniles and arugula production. The price of arugula increased with higher fish stocking densities, while the price of fish remained unaffected. Stocking densities of 40 and 60 fish/m³ were found to be economically feasible, exhibiting similar internal rates of return, both higher than those observed at a density of 20 fish/m³, which was not economically viable.
Key words
Agribusiness; Production systems; Sustainability; Financial indicators
INTRODUCTION
Population growth results in an increased demand for food, which in turn poses challenges in producing both quantity and quality in accordance with market demands (Friede 2020). Linked to this demand is the need to develop technologies that optimize the utilization of economic, environmental, and social resources (Rodrigues et al. 2019).
Among sustainable food production methods, aquaponics stands out as an integrated production system involving the cultivation of aquatic organisms and vegetables, which can be implemented on both small and large scales in rural or urban settings. In this system, water use is reduced by about 90% compared to conventional systems, allowing for the recycling of fish waste and dissolved compounds, which are converted into nutrients for the plants through biological filtration (Corrêa et al. 2018). Planning fish and plant densities, biomass, and cultivation phases, as well as the management practices employed, is crucial to achieving success in aquaponic production (Oliveira et al. 2022a).
Several studies have evaluated the integration of fish and vegetables in aquaponic systems, with zootechnical and agronomic indicators equal to or better than those in traditional systems (Santos et al. 2021, Magalhães et al. 2022, Oliveira et al. 2022b). Nile tilapia (Oreochromis niloticus) is among the most economically important aquatic species for cultivation worldwide and can also be used in polyculture and other production systems (Pereira et al. 2021, Sarturi et al. 2021). Arugula is a widely consumed vegetable in Latin America and Mediterranean regions due to its nutritional characteristics and can also be intercropped with other species (Carvalho et al. 2018). Studies assessing the economic viability of aquaponic systems are scarce in the scientific literature, making this information academically relevant and important for the production sector.
Thus, this study aimed to evaluate the economic feasibility of implementing an aquaponic system using different stocking densities of juvenile tilapia, integrated with arugula cultivation in a Nutrient Film Technique (NFT) system.
MATERIALS AND METHODS
Characterization of the Aquaponic System
The experiment was conducted at the Federal Institute of Goiás in Rio Verde, GO, Brazil (17° 48’ 21.4”S and 50° 54’ 17.6”W). The project was approved by the Ethics Committee for Animal Use in Research at IF Goiano (protocol number 5439231019). The experimental period lasted for 42 days, from September to November 2020. The arugula production cycle also spanned 42 days, with five days in the greenhouse, seven in the nursery, and 30 in the aquaponic system. In the nursery, the arugula received a nutrient solution formulated according to species-specific recommendations, and it should be noted that the nursery operated independently of the aquaponic system.
To colonize the biological filter, 40 tilapia were stocked 30 days prior, with the biofilters filled with 60 liters of expanded clay. On the day the plants were introduced into the aquaponic system, both the fish and the expanded clay were adjusted to the experimental setup to initiate the experiment.
The experimental design was completely randomized (CRD) in a 3 × 2 factorial arrangement with three replications, with stocking density and filter volume as the factors, totaling 18 experimental units (Figure 1). The evaluated stocking densities were 20, 40, and 60 juvenile tilapia/m³, with filter volumes of 50 and 70 liters of expanded clay. Each experimental unit consisted of an aquaponic module based on the Nutrient Film Technique (NFT). The system included a 1,000-liter fish cultivation tank, a 200-liter settling tank, a 200-liter biofilter, six hydroponic troughs (each containing nine plants spaced 20 cm apart), a radial air compressor (1.10 hp – flow rate 2.0 m³/min), and a Sarlo Better 2700 motor pump.Commercial omnivorous fish feed, 4 to 6 mm in size with 36% crude protein (CP), was used. The fish were fed three times daily at the following times: 8 AM, 2 PM, and 5 PM, at a daily rate of 2% of the biomass weight. At the end of the experimental period, the fish were weighed to obtain the final weight and weight gain.
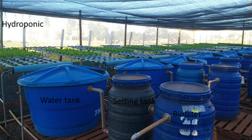
Distribution of experimental components: biofilter, settling tank, water tank (with different densities of tilapia juveniles), and hydroponic troughs (with arugula cultivation).
A commercial feed for omnivorous fish, 4 to 6 mm in size and containing 36% crude protein (CP), was used. The fish were fed three times a day at 8 AM, 2 PM, and 5 PM, at 2% of their biomass per day. At the end of the experimental period, the fish were weighed to determine their final weight and weight gain.
Dissolved oxygen, temperature, and pH were monitored daily using a multiparameter probe 30 minutes after the completion of the first feeding. Ammonia, nitrite, and nitrate were measured twice a week; alkalinity and hardness once a week using a colorimetric kit. Water sampling for analysis was performed before cleaning the units to ensure the actual concentrations of the compounds. The treatments used were:
1 – 20 tilapia juveniles and 50 liters of expanded clay;
2 – 20 tilapia juveniles and 70 liters of expanded clay;
3 – 40 tilapia juveniles and 50 liters of expanded clay;
4 – 40 tilapia juveniles and 70 liters of expanded clay;
5 – 60 tilapia juveniles and 50 liters of expanded clay;
6 – 60 tilapia juveniles and 70 liters of expanded clay.
Economic viability
Economic viability was assessed using financial indicators: net present value (NPV), internal rate of return (IRR), profitability index (PI), and payback period. We obtained input and service expenses by averaging ten price quotations from construction supply stores and other suppliers in the municipality of Rio Verde, GO. This approach enabled us to evaluate the cost composition (revenues and inputs) required for system implementation. We projected expenses using a cash flow analysis over a five-year period. We calculated the economic viability indicators as follows (Soldera & Kuhn 2018):
Net Present Value
Source: Adapted from Pereira et al. (2007).
Where:
NPV = Algebraic sum of all net values discounted to the present time, or net present value of the project at time 0;
FCF t = Free cash flow for each period t, resulting from cash inflows minus cash outflows;
t = Project period (in years);
r = Discount rate (interest) used for discounting the cash flow;
n = Total number of periods in the project, or project horizon.
Internal Rate of Return
The internal rate of return (IRR) is the rate at which the net present value (NPV) equals zero, indicating the project’s maximum return. The project is considered financially viable when the IRR exceeds the minimum attractive rate, which in this study was set at an annual discount rate of 15%, and when the NPV is greater than zero.
Source: Adapted from Pereira et al. (2007).
Where:
FCF t = Free cash flow for each period t, resulting from cash inflows minus cash outflows;
t = Time period of each free cash flow, in years;
n = Total number of periods in the project;
r = Internal Rate of Return (IRR), the rate that makes the NPV equal to zero.
The modified internal rate of return was also calculated by considering the cost of capital and the reinvestment interest of the cash flow.
Minimum Attractive Rate
The calculations were based on the minimum return determined for one year of production, meaning that treatments achieving the minimum annual rate of return (MAR) represented the least attractive option for project initiation. The established minimum rate was 15% per year.
Profitability Index
Source: Adapted from Olescowicz et al. (2023).
Where:
I0 = Initial investment;
r = Discount rate (interest) used to discount the cash flow;
FCFt = Free cash flow of the project in each period t;
t = Period t in each year of the project (from 1 to n);
r = Discount rate (interest) or internal rate of return that makes NPV equal to zero;
n = Total number of periods, or project horizon.
Payback
The calculations were based on a simulation of the first five years, indicating the time required for the system to generate a return on investment. We calculated both simple payback, which does not account for the time value of money over the five years, and the discounted payback period (DPP), which considers the present value of investment amounts in relation to the cash flow for each year.
Source: Adapted from Fasoro et al. (2019).
Where:
DPP = Discounted payback period;
n = Number of periods required for the cumulative discounted cash flows to equal or exceed the initial investment;
t = period t, in each year of the project;
FCFt = Free cash flow expected from cash inflow (net operating cash flows), in each time t;
Io = Initial investment (at time t = 0);
r = Discount rate (interest) considered for discounting the cash flow.
Revenue
We evaluated both the annual revenue per species and the total annual revenue. For the annual revenue per species, we assessed the yield of fish and arugula for each treatment separately by multiplying the average individual price by the quantity available in each unit. The total annual revenue was calculated by summing the revenue from fish and arugula for each treatment.
Revenue represents the cash flow generated from the sale of produced goods. The greater the company’s revenue, the larger the surplus after deducting incurred costs; in other words, higher revenue leads to increased profit.
Materials and Costs
The installation of the aquaponic system requires the use of materials and equipment responsible for structuring the electrical, hydraulic, filtration, and building components. The materials used in the system are listed in Table I.
In addition to the materials that make up the structure and the cost of implementing the system, production incurred costs that varied according to the treatment: feed consumed, quantity of fish, quantity of nutrient solution, seeds, water analysis cost, cost of using aerators, phenolic foam, and energy consumption (Table II).
The aeration system incurred specific costs necessary for the assembly and efficient distribution of oxygenation in the system (Table III).
Economic Feasibility Analysis
After reviewing the cash flow, we conducted an economic analysis of the aquaponic system using Microsoft Excel. Only the data collected during the aquaponics production period were considered.
Table IV Results of investment evaluation considering annual production (AP), unit prices (UP), annual revenue per species (ARPS), total annual revenue (TAR), annual cost (AC), operating cash flow (OCF), total investment (TI), working capital (WC), disinvestment (Dis), total net present value (TNPV), annual net present value (ANPV), internal rate of return (IRR), modified internal rate of return (MIRR), and profitability index (PI).| Items | 1 | 2 | 3 | 4 | 5 | 6 | ||||||
|---|---|---|---|---|---|---|---|---|---|---|---|---|
| fish | aru* | fish | aru* | Fish | aru* | fish | aru* | fish | aru* | fish | aru* | |
| AP (Un.) | 240 | 720 | 240 | 720 | 480 | 720 | 480 | 720 | 720 | 720 | 720 | 720 |
| UP (R$) | 2 | 2 | 2 | 2 | 2 | 3 | 2 | 3 | 2 | 3 | 2 | 3 |
| ARPS(R$) | 480. | 1440 | 480 | 1440 | 960 | 2160 | 960 | 2160 | 1440 | 2160 | 1440 | 2160 |
| TAR(R$) | 1920.00 | 1920.00 | 3120.00 | 3120.00 | 3600.00 | 3600.00 | ||||||
| AC (R$) | 905.71 | 905.70 | 1337.07 | 1337.08 | 1768.45 | 1768.45 | ||||||
| OCF(R$) | 1014.29 | 1014.29 | 1782.92 | 1782.92 | 1831.55 | 1831.55 | ||||||
| TI (R$) | 1785.16 | 1805.16 | 1852.59 | 1872.59 | 1920.02 | 1940.02 | ||||||
| WC (R$) | 75.48 | 75.48 | 111.42 | 111.42 | 147.37 | 147.37 | ||||||
| Dis (R$) | 178.52 | 180.52 | 185.26 | 187.26 | 192.00 | 194.00 | ||||||
| TNPV (R$) | 1737.43 | 1718.42 | 4266.01 | 4247.00 | 4381.04 | 4362.03 | ||||||
| ANPV (R$) | 518.3 | 512.63 | 1272.62 | 1266.95 | 1306.93 | 1301.26 | ||||||
| IRR (%) | 50.32% | 49.60% | 93.20% | 92.11% | 92.36% | 91.33% | ||||||
| MIRR (%) | 30.24% | 29.96% | 44.35% | 44.05% | 44.17% | 43.88% | ||||||
| PI (R$) | 0.97 | 0.95 | 2.30 | 2.27 | 2.28 | 2.25 | ||||||
RESULTS AND DISCUSSION
Table V presents the economic feasibility metrics, including unit prices, annual revenue, total annual revenue, annual costs, operating cash flow, total investment, working capital, disinvestment, total net present value, net present value, internal rate of return, modified internal rate of return, and profitability index.
Annual and cumulative cash flow (payback) of treatments over 5 years of production. Values in parentheses were negative.
The annual fish production did not vary among treatments with the same stocking density. Similarly, annual arugula production remained consistent across treatments, as the same quantity was cultivated and there were no losses due to mortality. In their evaluation of the polyculture of bullfrog tadpoles and Nile tilapia fingerlings, Sarturi et al. (2021) reported no mortality for either species at the given stocking densities. This satisfactory outcome was achieved by closely observing the biological aspects of both species. This finding is significant, as Oliveira et al. (2017) discovered phenotypic heterogeneity of variances in live weight among Nile tilapia across three different regions while studying the interactive effects of genotype and environment.
The selling price of fish at the end of the experiment did not vary among treatments, regardless of stocking density or biofilter volume. However, for arugula, a higher market value was observed for crops cultivated at higher fish stocking densities (40 and 60 fish/m³), which were 50% higher than the selling price of arugula grown at the lowest density (20 fish/m³). These results directly impacted the revenue from arugula, total annual revenue, and operating cash flow, with higher values for treatments involving greater stocking densities.
It was observed that among the evaluated densities of juvenile tilapia (20, 40, and 60 fish/m³), changes in quantity resulted in a variation of R$ 67.43 in implementation costs, with a cost of R$ 3.37 per individual fish. Additionally, varying the volume of expanded clay (50 and 70 liters) led to a cost variation of R$ 20.00, resulting in a cost of R$ 1.00 per unit of arugula. Consequently, the increase in implementation costs was greater for treatments with higher fish densities and lower volumes of expanded clay. This trend was similar to that observed in disinvestment, which accounted for 10% of the total investment.
Fish density and the volume of filter material significantly influenced the total investment cost, with higher densities and increased filter material leading to greater expenses. An analysis of the economic viability of the aquaponic system, which incorporated investments in technologies for automated water quality monitoring, indicated that while investment costs increased, profitability was still achieved. This outcome was made possible by a reduction in labor costs. These findings demonstrate that implementing productive strategies can effectively integrate technologies that optimize economic results (Zappernick et al. 2022).
This result can be attributed to the increased use of aerators (a fixed cost), which in turn raises electricity costs, as well as the costs of feed and fingerlings (variable costs). The demand for resources necessary for implementing the enterprise directly impacts profitability. However, materials available on the property that meet the system’s quality and functionality requirements can often be repurposed or improvised (Dalazen et al. 2020).
Working capital and annual costs were similar in treatments with the same fish stocking density, i.e., 1 and 2; 5 and 6; and 3 and 4. A difference of R$ 35.95 was observed in working capital between treatments that differed in stocking density, and for the annual cost, this value was R$ 431.37. The lower values of working capital and annual cost were found in treatments with lower stocking density, as they had lower variable costs for electricity, feed, and fingerlings. In a study with a low-tech aquaponic system, better results in terms of sustainability, productivity, and profitability were achieved despite higher variable costs (Bordignon et al. 2022).
In terms of net present value (NPV) and annualized NPV, treatments with the same stocking density but different amounts of expanded clay showed that those with 50 liters had a higher NPV, resulting in a difference of R$ 19.01 in total NPV and R$ 5.67 in annualized NPV. When comparing results across different stocking densities, treatments with higher fish densities yielded similar results, approximately 2.5 times higher than those with lower densities. The annualized NPV values represented 29.8% of the total NPV values. For the project to be considered viable, the NPV must exceed zero; thus, based on the results obtained in this study, all treatments are deemed viable (Mellichamp 2019).
The internal rate of return (IRR) and the modified internal rate of return (MIRR) were closely aligned among treatments with higher fish densities (40 and 60 fish/m³) and were numerically superior to the treatment with lower density. The treatments with higher densities achieved an IRR exceeding 90% and an MIRR of 44%, both of which were significantly higher than those observed in the lower-density treatments (IRR of 50% and MIRR of 30%). Higher IRR and MIRR values indicate greater profitability, suggesting that treatments with higher stocking densities offer greater economic viability (Babatunde et al. 2022).
The profitability index for treatments with the same stocking density was similar across different amounts of expanded clay (50 and 70 liters). However, among treatments with varying densities, the index was significantly higher for those with greater stocking densities, showing values 2.3 to 2.4 times higher than those for lower densities. These results indicate that higher-density treatments are more economically viable. Specifically, in treatments with higher densities, the return on invested capital ranged from R$ 2.25 to R$ 2.30 for every R$ 1.00 invested, whereas in lower-density treatments, the return was only R$ 0.96.
Table V presents the annual and cumulative cash flow (payback) values for the treatments over the next five years of production. The results indicate that all treatments achieve a return on invested capital by the second year of cultivation, along with a profit. Treatments with higher fish densities (40 and 60 fish/m³) have more than double the cumulative cash flow compared to treatments with lower densities (20 fish/m³) by the end of the five-year period. These findings align with previous research on tilapia production in masonry tanks within a water recirculation system, which demonstrated a return on invested capital starting in the second year of production and a profitability index of 45.84% (Santos-Filho et al. 2017).
Figure 2 illustrates the simulation of the internal rate of return (IRR) based on the quantities of fish and arugula units available for sale, considering the sales prices established in this project. For treatments with a stocking density of 20 fish/m³, it is necessary to produce a minimum of 42 units of arugula and sell at least 80% of the fish to achieve an IRR greater than 0.15. If 48 plants are produced, selling at least 60% of the fish will suffice. For more than 46 plants, selling at least half of the stocked fish becomes essential.
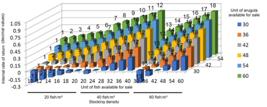
For treatments with a stocking density of 40 fish/m³, it is necessary to produce a minimum of 30 units of arugula and sell at least 80% of the fish in Treatment 3 and 90% in Treatment 4 to achieve an IRR greater than 0.15. If 36 units of arugula are produced, then at least 60% of the fish must also be sold in these treatments. When producing 42 units of arugula or more, selling at least 50% of the fish becomes necessary.
For treatments with a stocking density of 60 fish/m³, achieving an IRR greater than 0.15 requires selling a minimum of 90% of the fish when arugula production reaches 30 units. If arugula production increases to 36 units, at least 70% of the fish must be sold; for 42 units of arugula, at least 60% of the fish needs to be sold. Once arugula production exceeds 48 units, selling at least 50% of the fish becomes necessary to maintain profitability above 0.15.
When comparing the IRR of treatments with the same fish density but varying amounts of clay, only minimal variation was observed. In contrast, significant differences emerged among treatments that used the same quantity of expanded clay, particularly between Treatments 1, 3, and 5, and between Treatments 2, 4, and 6. Furthermore, a comparison of economic viability across three cultivation systems with the same stocking density revealed that aquaponics exhibited a higher IRR (Diatin et al. 2021). This suggests that, due to the high density utilized, the productive capacity of aquaponics plays a crucial role in influencing the IRR.
If the production achieves an IRR of 0.15 or higher, as desired by the producer, a portion of the output can be utilized for profitable purposes. Based on the minimum selling price, the quantity of arugula harvested, and the amount of fish remaining, the products can be allocated for personal consumption, used to generate additional income, or reinvested into production. The estimated IRR will be determined by comparing it to the rate of return from alternative financial investments (Soldera & Kuhn 2018).
Figure 3 presents simulations of the IRR based on the market values of fish and arugula, illustrating that a higher market value correlates with a higher IRR. For treatments with a stocking density of 20 fish/m³ (Treatments 1 and 2), the IRR values exceeded 0.15, indicating that the minimum selling prices must be R$ 0.60 for fish and R$ 2.00 for arugula. In treatments with a stocking density of 40 fish/m³ (Treatments 3 and 4), the sales prices required to achieve a minimum IRR of 0.15 are R$ 1.00 for fish and R$ 2.00 for arugula. For treatments with a stocking density of 60 fish/m³ (Treatments 5 and 6), the minimum selling prices should be R$ 1.20 for fish and R$ 2.00 for arugula to ensure that production meets the minimum IRR of 0.15.
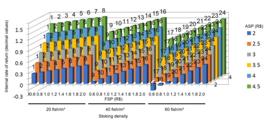
Internal rate of return according to the fish selling price (FSP) and arugula selling price (ASP).
The added value of a product is influenced by factors that promote consumption, including value perception, advertising, and quality of delivery. When combined with the dynamics of supply and demand, these elements help maintain or even increase product consumption (Chenavaz et al. 2020). Aquaponics, as a production system that enables greater control over production, can effectively attract and solidify the consumer market by emphasizing quality and fostering a more sustainable cultivation environment.
Family productive activities necessitate a comprehensive implementation plan that identifies potential scenarios relevant to the sector. The development of technologies that equip professionals and producers with the necessary knowledge for project implementation enhances their confidence in making decisions related to the activity’s growth. These findings highlight that aquaponics is a viable cultivation system that promotes food security and can be effectively implemented in areas with limited space and water, catering to both rural and urban settings for small- and medium-sized producers.
CONCLUSIONS
This study concluded that fish stocking density significantly affects the economic viability of an aquaponic system that cultivates juvenile tilapia and arugula. The selling price of arugula is influenced by the fish stocking density, with higher prices observed for arugula grown at greater densities. In contrast, the selling price of fish remained unaffected by stocking density. Stocking densities of 40 and 60 fish/m³ demonstrated economic viability, exhibiting similar internal rate of return (IRR) values, whereas the density of 20 fish/m³ did not show economic viability.
Acknowledgements
This study was financed in part by the Coordenação de Aperfeiçoamento de Pessoal de Nível Superior - Brasil (CAPES), Conselho Nacional de Desenvolvimento Científico e Tecnológico – Brazil (CNPq), Instituto Federal Goiano (IFGoiano) and Fundação de Amparo à Pesquisa do Estado de Goiás (FAPEG). The authors have declared that no competing interests exist.
-
Data availability
All data, materials, and methods used in this study are fully described and presented within the manuscript itself, as this is an economic feasibility analysis based exclusively on the primary and secondary data explicitly reported in the article. Therefore, there is no external database or additional repository, and reproduction and replication of the procedures are possible based on the information already provided in the text.
References
-
BABATUNDE A, DEBORAH RA, GAN M & SIMON T. 2022. Effects of plant density and stem pruning on plant biomass yield and economic benefits in a low-cost gravel bed aquaponic system. J Appl Aquac 35(3): 837-863. https://doi.org/10.1080/10454438.2022.2033664.
» https://doi.org/10.1080/10454438.2022.2033664 -
BORDIGNON F, STURARO E, TROCINO A, BIROLO M, XICCATO G & BERTON M. 2022. Comparative life cycle assessment of rainbow trout (Oncorhynchus mykiss) farming at two stocking densities in a low-tech aquaponic system. Aquaculture (Amsterdam, Netherlands) 556(738264): 738264. doi: 10.1016/j.aquaculture.2022.738264.
» https://doi.org/10.1016/j.aquaculture.2022.738264 -
CHENAVAZ RY, FEICHTINGER G, HARTL RF & KORT PM. 2020. Modeling the impact of product quality on dynamic pricing and advertising policies. Eur J Oper Res 284(3): 990-1001. https://doi.org/10.1016/j.ejor.2020.01.035.
» https://doi.org/10.1016/j.ejor.2020.01.035 - CORRÊA BRS, ROQUE-SPECHT VF, COSTA MM, CRUZ JUNIOR CA & CORRÊA VRS. 2018. Aquaponia: um sistema agroecológico resiliente. Cadernos Agroec 13(1): 2018.
- DALAZEN GB, FREITAS ES, MOTA CM, BENTES JR & BARROS IBA. 2020. A Avaliação econômica do sistema de aquaponia familiar em Santarém, oeste do Pará. RAGROS 11(2): 40-56.
-
DE CARVALHO FWA, NUNES GHS, BEZERRA NETO F, BARROS JÚNIOR AP, DE LIMA JSS, KHAN AS, DA SILVA JR & MOREIRA JN. 2018. Optimum plot size of planting and bio-agroeconomic revenues from arugula-carrot intercropping systems in a semi-arid region. An Acad Bras Cien 90: 3493-3512. https://doi.org/10.1590/0001-3765201820170461.
» https://doi.org/10.1590/0001-3765201820170461 -
DIATIN I, SHAFRUDDIN D, HUDE N, SHOLIHAH M & MUTSMIR I. 2021. Production performance and financial feasibility analysis of farming catfish (Clarias gariepinus) utilizing water exchange system, aquaponic, and biofloc technology. J Saudi Soc Agric Sci 20(5): 344-351. https://doi.org/10.1016/j.jssas.2021.04.001.
» https://doi.org/10.1016/j.jssas.2021.04.001 -
FASORO OA & AJEWOLE OI. 2019. Investment analysis of small scale private forest plantation development in Ogun state, Nigeria. AJAAR 10(1): 1-8. https://doi.org/10.9734/ajaar/2019/v10i130020.
» https://doi.org/10.9734/ajaar/2019/v10i130020 -
FRIEDE R. 2020. Aumento populacional e degradação ambiental: a conta que não quer fechar. Revista Augustus 25(52): 82-93. https://doi.org/10.15202/19811896.2020v25n52p82.
» https://doi.org/10.15202/19811896.2020v25n52p82 -
GONZAGA SFL, GIL AVSS, LIRA SSCE & ALVES VSRC. 2017. Utilização de indicadores de viabilidade econômica na produção de tilápia (oreochromis niloticus) em sistema de recirculação: estudo de caso de uma piscicultura de pequena escala em Parnaíba-PI. OR&A 18(4): 304-314. https://doi.org/10.21714/2238-68902016v18n4p304.
» https://doi.org/10.21714/2238-68902016v18n4p304 - HOJI M. 2003. Administração financeira. 4th ed., São Paulo: Editora Atlas, 2003.
- MAGALHÃES TFO, VALENTE CCA, MOURA LCF, RAIMUNDO CAS & SANTOS DMC. 2022. Aquaponia: uma alternativa de agricultura de hortaliças com base na agroecologia. Ciência Atual 18(1): 2022. Available at: https://revista.saojose.br/index.php/cafsj/article/view/578.
-
MELLICHAMP DA. 2019. Profitability, risk, and investment in conceptual plant design: Optimizing key financial parameters rigorously using NPV. Comput Chem Eng 128: 450-467. https://doi.org/10.1016/j.compchemeng.2019.04.016.
» https://doi.org/10.1016/j.compchemeng.2019.04.016 - OLESCOWICZ D, LAMARCA DSF & SILVA DD. 2023. Viabilidade econômica da produção de Soja, Milho e Feijão de uma propriedade rural em Canoinhas-SC. Revista Eletrônica e-Fatec 13(1): 2023.
-
OLIVEIRA GF, FORONI IL & OLIVEIRA MA. 2022a. Produção integrada de tambaqui com hortaliças em residência urbana. Res Soc Dev 11(8): e51811831189. https://doi.org/10.33448/rsd-v11i8.31189.
» https://doi.org/10.33448/rsd-v11i8.31189 -
OLIVEIRA ME, OLIVEIRA RLZ, VALERO OAO & TECH ARB. 2022b. Manual de Construção e manejo de um sistema aquapônico - Faça você mesmo. Available at: https://pedroejoaoeditores.com.br/produto/manual-de-construcao-e-manejo-de-um-sistema-aquaponico-faca-voce-mesmo/ Acesso em: 04-10-2023.
» https://pedroejoaoeditores.com.br/produto/manual-de-construcao-e-manejo-de-um-sistema-aquaponico-faca-voce-mesmo/ -
OLIVEIRA SNDE, RIBEIRO RP, OLIVEIRA CALDE, ALEXANDRE FILHO L, OLIVEIRA AMS, LOPERA-BARRERO NM, SANTANDER VFA & SANTANA RAC. 2017. Interactive effects of genotype x environment on the live weight of GIFT Nile tilapias. An Acad Bras Cienc 89: 2931-2943. https://doi.org/10.1590/0001-3765201720150629.
» https://doi.org/10.1590/0001-3765201720150629 -
PEREIRA MO, HESS JD, RODHERMEL JCB, FARIAS DR, SCHLEDER DD, ALVES L, BERTOLDI FC, CHABAN A, ANDRADE JIADE & JATOBÁ A. 2021. Curcuma longa hydrolate improves Nile tilapia survival in a recirculation rearing system, maintaining the animal homeostasis and modulating the gut microbial community. An Acad Bras Cienc 93: e20210088. https://doi.org/10.1590/0001-3765202120210088.
» https://doi.org/10.1590/0001-3765202120210088 -
PEREIRA MWG, AREDES AF & TEIXEIRA EC. 2007. Avaliação econômica do cultivo de trigo dos estados do Rio Grande do Sul e Paraná. Brazilian Review of Economics and Agribusiness, Federal University of Vicosa, Department of Agricultural Economics. REA 5(4): 1-18. https://doi.org/10.22004/AG.ECON.54149.
» https://doi.org/10.22004/AG.ECON.54149 -
RODRIGUES SCM, DIAS LAL, CARVALHO AC, FENZL N & LOPES LODC. 2019. Os recursos naturais no processo de desenvolvimento econômico capitalista. Semioses 13(4): 50-68. https://doi.org/10.15202/1981996x.2019v13n4p50.
» https://doi.org/10.15202/1981996x.2019v13n4p50 -
SANTOS AFE, CALVO FN & GOMES PF. 2021. A produção integrada de peixes e hortaliças na aquaponia. Trabalho de Conclusão de Curso (Curso Técnico em Agropecuária) - ETEC Padre José Nunes Dias, Monte Aprazível (SP). Available at: https://ric.cps.sp.gov.br/handle/123456789/6720
» https://ric.cps.sp.gov.br/handle/123456789/6720 -
SANTOS-FILHO LG, SANTOS SGAV & SILVA CELS. 2017. Utilização de indicadores de viabilidade econômica na produção de tilápia (Oreochromis niloticus) em sistema de recirculação: estudo de caso de uma piscicultura de pequena escala em Parnaíba-PI. Rural and Agro-Industrial Organizations 18: 304-314. https://doi.org/10.21714/2238-68902016v18n4p304.
» https://doi.org/10.21714/2238-68902016v18n4p304 -
SARTURI C, HELUY GM, SARMIENTO PCJ, FIGUEIREDO PG, JORGE TBF, MELLO SCRP, RAMOS LRV & PEREIRA MM. 2021. Polyculture of bullfrog tadpoles and Nile tilapia fry. An Acad Bras Cienc 93: e20210270. https://doi.org/10.1590/0001-3765202120210270.
» https://doi.org/10.1590/0001-3765202120210270 - SOLDERA D & KÜHN DD. 2018. Indicadores de Viabilidade Financeira: Considerações sobre instrumentos de análise. In: Wives DG & Kühn DD (Eds), Gestão e planejamento de agroindústrias familiares. Porto Alegre: Editora da UFRGS, p. 41-59.
-
ZAPPERNICK N, NEDUNURI KV, ISLAM KR, KHANAL S, WORLEY T, LAKI SL & SHAH A. 2022. Techno-economic analysis of a recirculating tilapia-lettuce aquaponics system. J Clean Prod 365(132753): 132753. https://doi.org/10.1016/j.jclepro.2022.132753.
» https://doi.org/10.1016/j.jclepro.2022.132753
Edited by
-
Handling editor
Igor Kaefer
All data, materials, and methods used in this study are fully described and presented within the manuscript itself, as this is an economic feasibility analysis based exclusively on the primary and secondary data explicitly reported in the article. Therefore, there is no external database or additional repository, and reproduction and replication of the procedures are possible based on the information already provided in the text.


