 In Vitro Evaluation of the Combined Toxicity of Pirimiphos-methyl and Piperonyl Butoxide
Abstract
Pirimiphos-methyl (PMM) and piperonyl butoxide (PBO) are commonly used in crops to combat pests. This study examined their cytotoxicity and genotoxicity in various cell lines (RAW 264-7, H9C2, HepG2, HEK 293) across different exposure times. HepG2 cells showed heightened sensitivity to the combination (MIX) at 100 µg/mL after 48 and 72 hours, with no genotoxic effects observed in both HepG2 and mouse whole blood cells. HEK 293 cells experienced cytotoxicity at higher concentrations of PMM, PBO, and MIX (50 and 100 µg/mL) after 48 and 72 hours. H9C2 cells exhibited the most pronounced cytotoxicity with MIX at 100 µg/mL at all time points evaluated. RAW 264-7 cells were sensitive to high concentrations (50 and 100 µg/mL) after 72 hours. Interestingly, non-toxic concentrations of MIX (5 µg/mL) inhibited 100% of nitric oxide production and significantly reduced TNF and IL-6 levels in RAW 264-7 cells stimulated with LPS. Higher concentrations of PMM and PBO individually also reduced TNF and IL-6 production, suggesting immunomodulatory effects at low concentrations without associated toxicity. These results underscore the importance of considering both concentration and exposure time when assessing toxicity, especially in chronic exposure scenarios common in real biological environments.
Key words
Pesticides; Pirimiphos-methyl; Piperonyl Butoxide; Citotoxicity; Genotoxicity
INTRODUCTION
Brazil is recognized as one of the largest agricultural producers in the world and stands as the second largest exporter of agricultural products, playing a crucial role in the international economy. To maintain this high level of the production, the Brazilian agricultural sector makes intensive use of transgenic seeds, as well as chemical inputs, such as fertilizers and pesticides (USDA 2022). Pesticides are therefore essential in reducing diseases and increasing the productivity of agricultural crops around the world. Given their widespread use, it is vital to examine the agricultural development process, the toxicity of these chemical compounds, the specific types and uses of pesticides, as well their behavior, contamination and adverse effects on both the natural environment and the health of living beings. These chemical substances can impact on the environment and human health through contamination of the ecosystem and food chain (Shetty et al. 2023).
Pirimiphos-methyl (PMM) is an insecticide widely used to control pests in various agricultural crops. This chemical, which exhibits insecticidal, acaricidal and nematocidal properties, belongs to the organophosphates group. PMM is efficient in controlling a wide range of pests and insects, including aphids, whiteflies, thrips, caterpillars and mites, acting as an inhibitor of the enzyme acetylcholinesterase, essential for the normal functioning of the insect nervous system. By inhibiting this enzyme, PMM causes neurological damage in insects, leading to paralysis and death. Regarding toxicity, PMM is considered moderately toxic to humans and animals. Safety measures must be taken during handling and application, such as the use of personal protective equipment (FAO 2016). According to the European Food Safety Authority (EFSA), PMM is applied at rates of up to 4 g per tonne of grain and 50 g per 100 m² on structural surfaces of empty grain storage facilities (EFSA 2005). Additionally, studies on PMM residues in food have shown that concentrations can reach up to 10 mg/kg in treated grains, however, it is important to consider that human exposure to PMM through food consumption and environmental contact is typically lower due to dilution and degradation processes (Mensink 2008, Mhadhbi & Beiras 2012).
Piperonyl butoxide (PBO) is a synergistic compound frequently utilized in pest control formulations. It enhances the efficacy of various pesticides, including carbamates, pyrethrins, pyrethroids, and rotenone, by inhibiting the enzymatic activity within the nervous systems of target pests. This inhibition leads to the mortality or reproductive failure of the pests. PBO is extensively employed to manage a wide range of pests, such as fleas, mites, lice, mosquitoes, and flies (Lorini & Galley, 2000). Studies have reported PBO concentrations in water ranging from 0.008 to 1.274 g/L, as well as in potatoes (0.84 µg/g) and soil samples. Furthermore, PBO is present in over 2,500 pesticide products, including household foggers, sprays, and agricultural treatments (Antonious et al. 1997, 2001, Schleier et al. 2008).
While the toxic effects of PMM have been extensively documented, the safety of this pesticide when used in combination with PBO remains insufficiently explored. Although safety thresholds of these substances are established when used independently, the literature offers limited insight into their toxic effects when combined (Hodgson 1999). It is crucial to comprehend that the health risks associated with these substances are not immediate. Nevertheless, the potential damage resulting from long-term consumption warrants serious consideration. This study aimed to evaluate the in vitro cytotoxicity and genotoxicity of these substances in biological systems, specifically targeting cells of diverse tissue origins (RAW 264-7, H9C2, HepG2, and HEK 293), over varying exposure durations (24, 48 and 72 hours). Therefore, the assessment of the toxicity arising from the combination of PMM and PBO is significant. Such an evaluation will yield results that mirror real-world exposure conditions more closely.
MATERIALS AND METHODS
Chemicals and reagents
PMM, PBO, Ethylenediaminetetraacetic (EDTA), Phosphate Buffered Saline (PBS), Fetal Bovine Serum (FBS) was obtained from HyClone (Logan, Utah, USA), Trypan Blue, Dulbecco MEM Medium (DMEM), Dimethylsulfoxide (DMSO ), MTT cell viability reagent [3-(4,5-dimethylthiazol-2-yl)-2,5-diphenyl tetrazolium bromide solution], normal melting point agarose solution, PFN 1.5 agarose solution %, low melting point agarose solution (BPF agarose) 0.5%, solution for lysis, alkaline buffer solution for electrophoresis (NaOH 300 mN/EDTA 1mM), buffer solution (NaOH 300 mN/EDTA 1mM), buffer solution Tris, ethidium bromide staining solution, FDA staining solution 30 µg/mL, ethidium bromide 8 µg/mL, methyl methanesulfonate (MMS) solution, Hydrogen peroxide (H2O2), Bioclin commercial diagnostic kit, absolute ethanol, trypsin solution (w/v) and 0.53 mM EDTA in PBS.
Cell Culture
Macrophage cell line RAW 264-7 (ATCC TIB-71™), was established from a male mouse tumor induced with murine leukemia virus Abelson, H9C2 cell line (ATCC CRL1446™) of primary neonatal cardiomyocyte cell origin, HepG2 cell line (ATCC HB-8065™) derived from human hepatocellular carcinoma, HEK 293 cell line (ATCC CRL-1573™) was isolated from the kidney of a human embryo. Cells were incubated in DMEM with 10%, FBS a mixture of antibiotics (penicillin, streptomycin, and ampicillin 100 units/mL) and antifungal Amphotericin B under predefined temperature conditions at 37°C, 95 % moisture and 5% CO2 grown to exponential growth stage.
Cytotoxicity detection using MTT assay
The cytotoxicity of PMM, PBO and MIX (PMM + PBO) were evaluated in different cell lines such as: RAW 264-7, H9C2, HepG2 and HEK 293. After counting, viable cells were seeded in a flat-bottomed 96-well plate at 0.5x10⁴ cells/well for adherent cells and 1x10⁴ cells/well for non-adherent cell AMJ2-C1. The cells were cultured at different times of exposure 24, 48 and 72 hours (in 5% CO2 at 37°C), in the presence of PMM, PBO and MIX of the two substances (in a 1:1 ratio), at concentrations 0.5; 1; 10; 50; 100 µg /mL, in a final volume of 200 µl/well. During the last 4 hours of each exposure time, the cells were incubated with a solution containing MTT (5 µg /mL in saline solution; 22 µl/ well). The supernatants were discarded and DMSO (150 µl/well) was added to solubilize the formazan crystals. Absorbance was measured at 550 nm (SpectraMax M5, Molecular Devices, USA). According to the ISO 10993-5 standard, concentrations of compounds that induced ≥ 30% cell death were considered cytotoxic. Two independent assays were performed in quadruplicate (De Brito et al. 2021).
The fractional inhibitory concentration index (FICI) for the analysis of synergy was calculated as follows: FICI = (IC50 of PMM in combination / IC50 of PMM alone) + (IC50 of PBO in combination / IC50 of PBO alone). FICI was calculated for each combination and used to classify the nature of the interaction as follows: synergy is defined as FICI < 0.5; “indifferent” or an additive effect as FICI between 0.5 and < 4; and antagonism as FICI > 4 (Odds 2003, Andrade-Neto et al. 2021).
Comet Assay
To carry out the comet assay, the PMM, PBO and MIX samples were diluted in concentrations of 1; 10; 50; 100 µg /mL in DMEM medium for Hep-G2 cells and in PBS for Balb-C mouse whole blood. The HepG2 cell was seeded 1.5x10⁶ cells/well in a 96-well plate, exposed to PMM, PBO and MIX for 24 hours at 5% CO2 at 37°C. The positive control was hydrogen peroxide (H2O2) at 100 µM and the negative control was methanol at a concentration of 100 µg /mL (Želježić et al. 2016). Whole blood samples from male Balb/c mice (Committee on Ethical Use of Laboratory Animals of Oswaldo Cruz Foundation, under license P17/13-5) were obtained by intraperitoneal collection, exposed to test substances in epperdorfs, for 2 hours at 5% CO2 at 37°C. The positive control was 160 µM MMS for whole mouse blood and the negative control was 100 µg /mL methanol.
For the alkaline comet assay, after the exposure times, the samples were added to the 0.5% low melting point agarose (LMPA: Sigma-Aldrich) in PBS, 120 μL, at 37 °C and added to slides previously coated with 1.5% normal-melting point agarose (Sigma-Aldrich) in PBS. After the agarose slide had solidified, the cells were lysed overnight, protected from light, at 4−6 °C (2.5 M NaCl, 100 mM Na 2 EDTA, 10 mM Tris, 1% [w/v] N-lauroylsarcosine sodium salt, 1% [v/v] Triton X-100 and 10% [v/v] DMSO, pH 10). After lysis, the cells were subjected to alkaline treatment in a horizontal electrophoresis system (Bio-Rad) with an alkaline buffer solution, pH > 13 (1 mM Na 2EDTA and 300 mM NaOH) for 20 min, in an ice bath. Then, electrophoresis was performed in an ice bath at 25 V (0.86 V/m) and 300 mA for 20 min. The the neutralizing solution was applied to the slide in 0.4 M Tris buffer solution, pH 7.5, through three washes, 5 min each, fixed with absolute ethanol for 10 min and dried at room temperature (Hartmann 2003).
Extensions of DNA migration were analyzed 50 cells per slide, total of 4 slides per assay according to the sizes of comet tails, in four different classes: no tail - Class 0; small tail - Class 1; long tail - Class 2; severely damaged - Class 3. DNA damage was expressed in the four different classes and per arbitrary unit (AU) according to the formula:
AU = [(M0 × 0) + (M1 × 1) + (M2 × 2) + (M3 × 3)]; where M represents the number of cells in each damage class (Poça et al. 2021).
The PMM and PBO effect on macrophage cell activation
Macrophages RAW 264-7, incubated with PMM, PBO and MIX (PMM plus PBO) for 1 hour, were plated in a 96-well microplate in a final concentration of 2.5 × 10⁵ cells/well, in quadruplicate (in 5% CO2 at 37°C). RAW 264-7 were stimulated with LPS (1 μg/mL), and after 24 hours, nitrite levels were determined in supernatants with Griess’ reagent. Absorbance was read at 540 nm using a microplate reader (Molecular Devices). The concentration of nitrite was calculated from a sodium nitrite standard curve (range 6.5–100 μM).
Statistical analysis
The data is reported as the mean ± standard error of the mean (SEM) and was statistically analyzed by one-way ANOVA test and Tukey’s post hoc test was used for comparisons. P values < 0.05 were considered significant. The data were determined using Graph Pad Prism 5.0 software (Graph Pad Prism Software Inc.).
RESULTS
Cytotoxic effect of PMM and PBO on several cell lines
To evaluate the cytotoxic effects of the combination of the pesticide PMM with the synergist PBO, a cell viability analysis was carried out on various cell lines, including HEK 293 (embryonic renal cells), HepG2 (derived from hepatocyte), H9C2 (derived from embryonic rat cardiac tissue) and RAW 264-7 (mouse macrophage). The cells were subjected to treatment with different concentrations of the PMM pesticide, individually or in association with the PBO synergist (in a 1:1 ratio). The concentrations used were 0.5, 1, 5, 10, 50, and 100 µg/mL, with exposure times of 24, 48, and 72 hours, selected based on findings from the literature related to environmental contamination and toxicological studies. The evaluation of cell viability and cell integrity was carried out according to the metabolization of MTT, with negative control assays considered as 100% cell viability. The analyses can be observed in the viability graph (Figure 1 - 4), expressed as a percentage at different exposure times.

Cell viability (%) of HepG2 cells exposed to different concentrations (0.5-100 μg/mL) of PMM, PBO, and their mixture (MIX) for 24, 48, and 72 hours. Values are expressed as mean ± SEM from two independent experiments performed in quadruplicate. *p < 0.05 compared to control (Medium); #p < 0.05 between the exposed groups.
HepG2 cell line exhibited low toxicity when exposed to PMM for 24 hours. PMM concentrations ranging from 5 to 100 µg/mL induced a statistically significant decrease in cell viability. However, exposure to concentrations between 5 and 50 µg/mL did not reduce cell viability to values below 70% (a threshold determined by us to differentiate between mildly toxic and moderately or severely toxic effects). Notably, exposure to the highest concentration (100 µg/mL) resulted in a significantly more toxic effect compared to lower exposure concentrations such as 0.5 and 1 µg/mL (Figure 1a). Prolonged exposure to PMM (48 and 72 hours) led to an increasing toxic effect, with the 100 µg/mL concentration inducing a loss of cell viability greater than 70% at 48 hours, and concentrations of 50 and 100 µg/mL also showing similar effects at 72 hours (Figure 1d and 1g).
HepG2 cells exposed to PBO showed cell viability equal to or greater than 80% at concentrations of 0.5 to 5 µg/mL across all three exposure times analyzed (Figure 1b, 1e, and 1h). Conversely, concentrations of 50 and 100 µg/mL were the most toxic, with 100 µg/mL of PBO significantly reducing viability to below 70% after 24 hours of exposure. Prolonged exposure to PBO beyond 24 hours resulted in increased cell death, particularly at concentrations of 50 and 100 µg/mL, with only the 100 µg/mL concentration inducing cell death greater than 70%.
The exposure of the association between PMM and PBO for 24 hours did not show significant differences. On one hand, the concentration of PMM at 5 µg/mL induced a small but statistically significant decrease in cell viability, while the association between PBO and PMM increased cell viability to values very close to the control group (Figure 1a, 1b, and 1c). The MIX at 100 µg/mL for 24 hours also did not show significant differences, maintaining cell viability within the 70% range. The 48-hour exposure time did not present results that could infer a synergistic or antagonistic effect in the association between PMM and PBO, as the cell viability curve of the MIX was very similar to the values presented by PMM alone, suggesting that the presence of PBO does not potentiate or rescue cells exposed to death (Figure 1d, 1e, and 1f). Conversely, HepG2 cells exposed to MIX at 50 µg/mL for 72 hours showed a rescue in cell viability compared to the PMM group, where cells exposed to PMM alone had viability below the 70% range (Figure 1g and 1i). These results suggest that both PMM and PBO exhibit concentration- and time-dependent toxic effects, with PMM toxicity appearing to be greater than that of PBO in HepG2 cells.
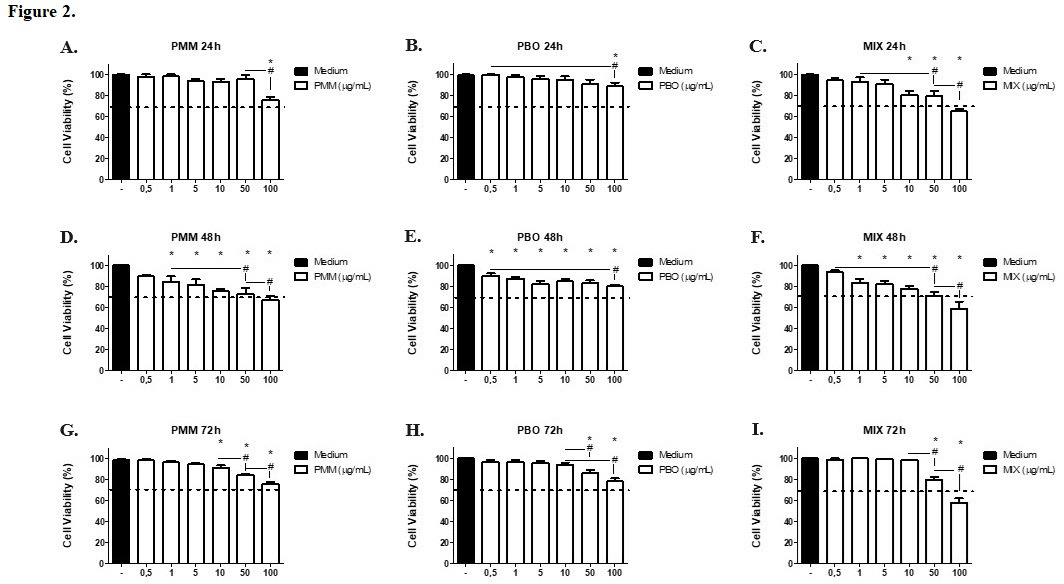
In Figure 2, we observe that PMM and PBO did not induce significant toxicity in HEK293 cells, as the 70% viability threshold was not reached at any evaluated time points. PMM at 100 µg/mL caused a statistically significant decrease in cell viability after 24 hours of exposure (Fig. 2a). Extending the exposure to 48 hours, PMM led to increased cell death at concentrations ranging from 1 to 100 µg/mL in a dose-dependent manner (Fig. 2d). When HEK293 cells were exposed to concentrations between 10 and 100 µg/mL, a statistically significant reduction in cell viability was observed (Fig. 2g). However, the 70% threshold was not reached at any of the evaluated time points (24h, 48h, or 72h).

Cell viability (%) of HEK293 cells exposed to different concentrations (0.5-100 μg/mL) of PMM, PBO, and their mixture (MIX) for 24, 48, and 72 hours. Values are expressed as mean ± SEM from two independent experiments performed in quadruplicate. *p < 0.05 compared to control (Medium); #p < 0.05 between the exposed groups.
After 24 hours of PBO exposure, a significant reduction in HEK293 cell viability was observed only at 100 µg/mL (Fig. 2b). Prolonging the exposure to 48 hours resulted in a significant reduction in cell viability at concentrations ranging from 0.5 to 100 µg/mL (Fig. 2e). However, after 72 hours of exposure, only the highest doses (50 µg/mL and 100 µg/mL) induced a significant effect (Fig. 2h). Similar to PMM, PBO exposure did not reduce cell viability below 70% under our experimental conditions.
Exposure of HEK293 cells to a combination of PMM and PBO for 24, 48, or 72 hours resulted in increasing toxicity, with the 100 µg/mL concentration inducing a loss of cell viability greater than 70% (Fig. 2a, b, and c). Furthermore, after 24 hours of exposure, the combination of PMM and PBO induced a statistically significant decrease in cell viability at concentrations of 10 and 50 µg/mL, although without reaching the threshold (Fig. 2a). At 48 hours of exposure, concentrations ranging from 1 to 50 µg/mL also caused a statistically significant decrease in cell viability without reaching the threshold. The same effect was observed for 50 µg/mL at 72 hours of exposure (Fig. 2i).
When H9C2 cells, a cardiac cell lineage, were exposed to PMM for 24 hours, a significant reduction in cell viability was observed at concentrations ranging from 5 to 100 µg/mL (Fig. 3a). The same effect was noted after 48 hours of exposure (Fig. 3d), with viability dropping below the 70% threshold only at this time point. At 72 hours of exposure (Fig. 3g), a significant reduction in cell viability was observed at concentrations between 10 and 100 µg/mL; however, viability did not fall below 70%.

Cell viability (%) of H9C2 cells exposed to different concentrations (0.5-100 μg/mL) of PMM, PBO, and their mixture (MIX) for 24, 48, and 72 hours. Values are expressed as mean ± SEM from two independent experiments performed in quadruplicate. *p < 0.05 compared to control (Medium); #p < 0.05 between the exposed groups.
When H9C2 cells were exposed to PBO for 24 hours, a concentration-dependent reduction in viability was observed at concentrations ranging from 5 to 100 µg/mL (Fig. 3b); however, the 70% viability loss threshold was not reached. At 48-hour and 72-hour exposure times, significant reductions in viability occurred at concentrations between 10 and 100 µg/mL (Fig. 3e and 3h). At 100 µg/mL, after 72 hours of exposure, this reduction approached a 60% viability loss.
In Figure 3c, when H9C2 cells were exposed for 24 hours to different concentrations of the PMM and PBO mixture, a significant reduction in cell viability occurred at concentrations between 1 and 100 µg/mL, without reaching the 70% viability threshold. At 48 hours of exposure, a significant reduction in viability was observed at the three highest concentrations, with 50 and 100 µg/mL capable of reducing cell viability to below 70% (Fig. 3f). Figure 3i shows that when H9C2 cells were exposed for 72 hours to the PMM and PBO mixture, a reduction in cell viability occurred at concentrations ranging from 5 to 100 µg/mL. Similar to the 48-hour exposure, 50 and 100 µg/mL reduced cell viability to below 70%.
The RAW 264-7 cell line exhibited a pattern of sensitivity quite like individual exposures to both PMM and PBO. In both individual exposures, RAW 264.7 cells experienced a concentration-dependent reduction in cell viability, with both PMM (100 µg/mL) and PBO (100 µg/mL) reducing cell viability to below 70% (Figure 4a, b, d, e, g and h). Overall, at 24 and 48 hours, RAW 264.9 cells exhibited viability levels above 70% at all exposure concentrations of PMM and PBO. Concentrations of 50 and 100 µg/mL slightly but significantly reduced viability compared to the control group (medium). However, in all cases, cell viability remained equal to or above 80%.

Cell viability (%) of RAW 264.7 cells exposed to different concentrations (0.5-100 μg/mL) of PMM, PBO, and their mixture (MIX) for 24, 48, and 72 hours. Values are expressed as mean ± SEM from two independent experiments performed in quadruplicate. *p < 0.05 compared to control (Medium); #p < 0.05 between the exposed groups.
Exposure for 72 hours reduced cell viability to around 40% for both PMM and PBO at the highest concentration (100 µg/mL). Similarly, the 50 µg/mL concentration decreased cell viability from values equal to or greater than 80% to slightly below 70% (Figure 4g and 4h). Proportionally, the 5 µg/mL concentration of PMM and PBO showed a reduction in viability at the longer exposure time (72 hours) compared to shorter exposure times (24 and 48 hours) (Figure 4g and 4h).
Interestingly, the MIX of PMM and PBO did not significantly affect cell viability at 24 and 48 hours (Figures 4c and 4f). As observed, only the MIX at 100 µg/mL caused a slight but statistically significant reduction in cell viability compared to the control group (Fig. 4c). The same effect was noted at 48 hours of exposure, where the two highest concentrations (50 and 100 µg/mL) reduced viability, yet still maintained values within an 80% viability range (Fig. 4f). Conversely, prolonged exposure to concentrations of 50 and 100 µg/mL for 72 hours resulted in a concentration-dependent reduction in viability to values below 70% (Fig. 4i).
IC50 and ƩFICI50 of the combination of PMM and PBO on HEK293 and RAW264-7 cells
Based on the analysis of different cell viability curves from exposures to PMM, PBO, and their combination, we determined the 50% inhibitory concentration (IC50) to evaluate whether there would be a synergistic, antagonistic, or additive interaction between these substances. Cell lines and exposure times were selected where experimentally observed cell viability losses were equal to or greater than 50%. The IC50 values for PMM, PBO, and MIX in the HEK293 cell line at 72 hours of exposure were 67.7, 86.95, and 77.98 µg/mL, respectively. Table I shows the combination of PMM and PBO in HEK293 cells, which has an average fractional inhibitory concentration index (FICI) of 2.39, indicating an additive or indifferent interaction. The IC50 values determined for the exposure of RAW264-7 cells at 72 hours to PMM, PBO, and MIX were 84.80, 81.05, and 77.49, respectively. Similar to the observations with HEK293 cells, the combination of PMM and PBO presented a FICI of 1.86, indicating an additive interaction (Table I).
DNA damage in HepG2 cells and mouse whole blood estimated by the alkaline comet assay
Many pesticides can cause deleterious effects on genetic material, where the induction of genotoxicity such as chromosome lesions can lead to mutagenic and carcinogenic effects. The comet assay is considered a highly sensitive method, as it assesses chromosomal morphological changes, and DNA damage induced by agents considered genotoxic. In this way, we evaluated the genotoxicity of PMM, PBO, and the combination of PMM plus PBO in HepG2 cells and in whole blood of mice. It was found that PMM, PBO, and MIX (PMM plus PBO) did not induce significant DNA damage at the tested concentrations. The positive control H2O2 100 μM induced a highly significant genotoxic effect (Table II). Just as in HepG2 cells, no statistically significant results of DNA damage were observed after the exposure of mouse whole blood to the samples of PMM, PBO, and MIX (PMM plus PBO) (Table III). Within the range of concentration studied, as well as the evaluated exposure time, we did not observe a risk of genotoxic activity from either PMM, PBO, or the association between them.
Detection of cytotoxicity and DNA damage in peripheral blood mice after in vitro treatment with different concentrations of PMM, PBO and the MIX.
Detection of cytotoxicity and DNA damage in cell HepG2 after in vitro treatment with different concentrations of PMM, PBO and the MIX.
The PMM and PBO effect on macrophage cell activation
Cells of the RAW 264-7 lineage were treated with non-toxic concentrations, following the data observed in Figure 5, and then stimulated with LPS for evaluation of activation and production of soluble mediators. The LPS stimulation induced the production of nitric oxide (NO), tumor necrosis factor (TNF), and interleukin-6 (IL-6), after 24 hours. None of the individually tested concentrations of PMM or PBO generated any significant inhibitory or stimulatory effect, however, the highest concentration of PMM plus PBO (MIX 5 µg/mL) was able to inhibit 100% of NO production (Figure 5a). This effect was more sensitive in the production of TNF and IL-6, where both cytokines were significantly downmodulated at concentrations of 1 and 5 µg/mL (Figure 5b and 5c). Unlike what we observed in the NO dosage, PMM and PBO individually at the highest tested concentrations (5 µg/mL) were able to reduce the production of TNF and IL-6 (Figure 5b and 5c). The presented results suggest that low individual concentrations and in association of PMM and PBO have immunomodulatory capacity, with absence of toxicity.

Effects of PMM, PBO, and their mixture (MIX) on inflammatory mediators in LPS-stimulated RAW 264.7 macrophages. (A) NO production measured by Griess reagent, (B) TNF-α and (C) IL-6 levels determined by ELISA in culture supernatants after 24 hours of LPS stimulation. Values are expressed as mean ± SEM from two independent experiments performed in quadruplicate. #p < 0.05 compared to non-stimulated control (Medium); *p < 0.05 compared to LPS-stimulated control.
DISCUSSION
The concentrations of PMM and PBO used in our in vitro assays are relevant to real-world exposure scenarios. While the concentrations in our study are lower than those applied directly in agricultural settings, they are comparable to potential human exposure levels through food residues and environmental contact. Our findings provide valuable insights into the cytotoxic and genotoxic effects of these substances, contributing to a better understanding of their potential health risks under realistic exposure conditions. This contextualization underscores the importance of comprehensive toxicological assessments that consider both individual compounds and their potential interactions in complex biological systems.
The study investigated the impact on H9C2 cardiac cells, which are frequently used as an in vitro model for analyzing drug-induced cardiotoxicity. Short-term exposure (24 hours) to PMM, PBO, and MIX did not induce cytotoxicity. However, longer exposures revealed varying degrees of toxicity. Recent studies have elucidated the cytotoxic effects of organophosphate pesticides on H9C2 cardiac cells using the MTT assay. Atale et al. (2014) reported that 48-hour exposure to malathion at concentrations ranging from 5 to 40 µg/mL induced a 25% reduction in cell size, with 20 µg/mL identified as the LD50 and the threshold for stress mediation. Similarly, Felemban et al. (2015) demonstrated that chlorpyrifos exhibited cytotoxicity at concentrations of 100 and 200 μM when H9C2 cells were exposed for 24 and 48 hours. These findings underscore the potential cardiotoxicity of organophosphate pesticides and highlight the importance of comprehensive toxicological assessments to elucidate their impact on cardiac function (Atale et al. 2014, Felemban et al. 2015).
The HepG2 cell line, derived from human hepatocarcinoma, is widely used for evaluating xenobiotic metabolism and liver toxicity due to its sophisticated in vitro capabilities, which aid in understanding the transport, metabolism, and elimination of substances by the liver, as well as their potential to induce hepatotoxicity. The liver’s crucial role in biotransformation and detoxification makes it a primary target for the harmful effects of xenobiotics, which can disrupt homeostasis and cause irreversible damage (Houck et al. 2009, Jaeschke 2002, Judson et al. 2010).
In this study, HepG2 cells exposed to PMM, PBO, and their mixture (MIX) for 24 hours showed no significant changes in cell viability, indicating non-cytotoxicity. However, extended exposure for 48 hours revealed that only the MIX at 100 µg/mL reduced cell viability. This aligns with previous findings by Camatini et al. (1996), who reported no cytotoxicity in rat hepatocytes exposed to PMM and Benomyl but noted glutathione depletion. Similarly, Hreljac et al. (2008) observed varied effects of organophosphates on HepG2 cells, with methyl paraoxon reducing proliferation only at high concentrations (Hreljac et al. 2008). Zhang et al. (2021) found that trichloropyridinol significantly inhibited HepG2 cell viability in a concentration-dependent manner (Camatini et al. 1996, Zhang et al. 2021).
The research also examined the effects on HEK 293 renal cells, which are crucial for assessing potential nephrotoxicity. Short-term exposure (24 hours) to PMM and PBO individually did not prove toxic, but the MIX showed toxicity at 100 µg/mL. Longer exposures revealed varying toxicity profiles, with PMM showing increased toxicity at 48 and 72 hours, while the MIX consistently demonstrated cytotoxic effects at higher concentrations across all time points.
The toxicological relevance of the findings lies in the concentration- and time-dependent effects observed for both PMM and PBO, individually and in combination. Although no synergistic interaction was confirmed, the data reinforce the need to consider the cumulative and potentially additive effects of these compounds, particularly under chronic exposure scenarios. PMM has been associated with a range of adverse health outcomes, including neurotoxicity, cardiotoxicity, and reproductive toxicity. PBO, despite being primarily used as a synergist, has demonstrated toxicological effects in various organ systems, including the liver, thyroid, and central nervous system, especially at high doses or prolonged exposure (Gokalp et al. 2005, Handy et al. 2002, Jokanović 2018). These findings underscore the importance of evaluating not only the individual toxicological profiles of pesticide components but also their combined effects, even when no synergism is detected.
The assessment of potential genotoxicity of PMM and PBO, both individually and in combination, is crucial for understanding their impact on human health. This study employed the alkaline comet assay to detect genomic lesions that could result in DNA strand breaks in HepG2 cells and mouse whole blood cells. HepG2 cells were chosen for their retention of normal human hepatocyte functions and possession of phase I and II xenobiotic metabolization enzymes, which are essential for activating and detoxifying pro-mutagenic and pro-carcinogenic agents (Jin et al. 2009, Westerink & Schoonen 2007a, b).
Genotoxic pesticides pose a significant risk as they can directly or indirectly affect chromosomal DNA, potentially leading to chronic genotoxicity, reproductive toxicity, and carcinogenicity. These effects may manifest as hereditary genetic diseases, reproductive dysfunction, or congenital deformities. The cleavage of chromatin DNA into internucleosomal fragments is a key cellular event in pesticide-induced genotoxicity. Genotoxins can cause various types of DNA damage, including base modifications, DNA adducts, and single or double-strand breaks, with double-strand breaks considered the most severe (Collins 2004, Li et al. 2015).
In this study, the comet assay results indicated that PMM, PBO, and their mixture (MIX) were not genotoxic at any of the tested concentrations in HepG2 cells exposed for 24 hours or in mouse whole blood exposed for 2 hours. These findings are consistent with previous research by Piatti et al. (1994) which also found no genotoxic effects for PMM both individually and in a mixture with benomyl in a 48-hour exposure, which observed that PMM individually did not had any genotoxic effect at any of the tested concentrations (0.5 µg /mL to 25 µg /mL and 0.8 µg /mL to 50 µg /mL, respectively) (Piatti et al. 1994). Also, in the studies performed by Kopp et al. (2018), the effects of DNA damage and cytotoxicity of PMM, PBO or combined in HepG2 cells were analyzed for 24 hours in five concentrations (500, 250, 100, 10 and 1 μM) and observed that the substances did not cause DNA damage or cytotoxicity at the tested concentrations (Kopp et al. 2018). The results of this work confirm the idea that PMM and PBO substances do not have genotoxic activity in HepG2 cells.
Although the present study did not identify genotoxic effects for PMM, PBO, or their combination under the tested conditions, it is important to interpret these findings in light of methodological differences compared to previous studies. For instance, Vardavas et al. (2016) reported genotoxic and inflammatory effects in the liver and kidneys of New Zealand white rabbits following chronic exposure to PBO (22.5 or 45 mg/kg/day, three times per week for four months), using the micronucleus assay in peripheral blood. In contrast, our study employed the alkaline comet assay in HepG2 human hepatocellular carcinoma cells and mouse whole blood, with acute exposure durations of 24 and 2 hours, respectively, and concentrations up to 100 µg/mL. These differences in biological models (in vivo vs. in vitro), exposure duration (chronic vs. acute), route of administration (oral vs. direct contact), and genotoxicity assessment methods (micronucleus vs. comet assay) limit direct comparisons between the findings.
Furthermore, the study by Vardavas et al. (2016) did not evaluate PMM, which underscores the novelty of our investigation into the combined toxicity of PMM and PBO across multiple human and murine cell lines. The absence of genotoxicity observed in our study may reflect the shorter exposure durations and lower systemic complexity of in vitro models. Therefore, our results do not contradict those of Vardavas et al. (2016) but rather complement the existing literature by providing initial evidence under controlled acute exposure conditions. These findings highlight the need for further studies employing chronic and integrative models to fully elucidate the genotoxic potential of these compounds.
Macrophages are essential immune system cells that play crucial roles in the inflammatory response and defense against pathogens. The RAW 267-4 cell line is frequently used in toxicity studies due to its ability to simulate immune responses in vitro. The toxic effects from the tested compounds only manifested after prolonged exposures of 72 hours, suggesting an interesting dynamic between exposure duration and observed toxic effects (Smith & Johnson 2020).
The observation that toxic effects occurred only after 72 hours of exposure indicates that RAW 267-4 macrophages may possess an initial defense or resistance mechanism that diminishes over time. This resistance could be attributed to several factors, including: Cellular Repair Mechanisms: Cells may activate repair pathways in response to initial stress, allowing for temporary survival (Johnson & Lee 2021) and stress Adaptation: Macrophages might adapt to adverse conditions, leading to a delayed response to toxicity (Miller et al. 2019).
The findings suggest that toxicity evaluation should consider not only the concentration of compounds but also the duration of exposure. This is crucial for understanding how these compounds may affect cells in real biological environments, where chronic exposure is common. Delayed toxicity may have significant implications in contexts such as occupational exposure professionals exposed to pesticides or chemicals may not perceive immediate effects, but health risks could accumulate over time (Thompson et al. 2022). The toxic effects to manifest can aid in developing therapeutic strategies to mitigate these effects (Garcia & Patel 2023).
The analysis of nitric oxide (NO), TNF, and IL-6 production suggests that different signaling pathways are being modulated by these substances, reflecting their specific interactions and effects on the immune response. RAW264 cells treated with PMM showed normal NO production, even after stimulation with LPS. This suggests that PMM does not interfere with the activation of inducible nitric oxide synthase (iNOS), which is responsible for NO production in response to inflammatory stimuli. Conversely, the decrease in NO production observed in cells treated with PBO indicates that it may be inhibiting iNOS activity, possibly through negative modulation of the NF-kB signaling pathway, which is crucial for iNOS expression (Xie et al. 1994, Liu et al. 1997). Another mechanism involved in this inhibition could be attributed to PBO’s ability to inhibit cytochrome P450 enzymes, which may be involved in the metabolism of mediators that promote iNOS activation. CYPs can affect NO production through various pathways, including the regulation of tetrahydrobiopterin (BH4) synthesis, an essential cofactor for NOS activity (Gonzalez et al. 2025). Additionally, CYPs can influence the production of reactive oxygen species (ROS), which can interact with NO and affect its bioavailability (Gonzalez et al. 2025).
TNF production in RAW264 cells treated with PMM and PBO showed an interesting pattern. PMM inhibited TNF production at higher concentrations, suggesting that it may be modulating the NF-kB signaling pathway, which is fundamental for TNF expression (Hayden & Ghosh 2014). NF-kB activation is often mediated by pattern recognition receptors, such as TLRs, which are activated by LPS (Kawai et al. 2007). The inhibition of TNF in cells treated with PBO also suggests similar modulation, possibly through the inhibition of CYPs, which can influence the availability of inflammatory mediators and NF-kB activation. IL-6 production showed a distinct pattern. While PMM did not inhibit IL-6 production at any of the tested concentrations, PBO did inhibit IL-6 production. This difference can be explained by the activation of distinct signaling pathways. IL-6 production is often mediated by the STAT3 signaling pathway, which can be activated by different inflammatory mediators (Takeda et al. 1999). The fact that PMM does not inhibit IL-6 suggests that it does not affect this pathway, whereas PBO, by inhibiting CYPs, may be altering the availability of mediators that activate the STAT3 pathway, resulting in the inhibition of IL-6 production. The signaling pathways that regulate the production of NO, TNF, and IL-6 are interconnected but also have unique characteristics. NO and TNF production is closely related to NF-kB activation, while IL-6 production may be more dependent on the STAT3 signaling pathway. The modulation of the PPAR pathway may also be involved, as PPARs have an anti-inflammatory role and can inhibit the expression of inflammatory cytokines, including TNF and IL-6 (Martin 2010). Although both PMM and PBO, individually and in combination, modulated the production of inflammatory mediators such as nitric oxide (NO), TNF-α, and IL-6 in LPS-stimulated RAW 264.7 macrophages, the data do not support a synergistic interaction between the two compounds. The observed effects, particularly the inhibition of NO production by the MIX at 5 µg/mL and the reduction of TNF and IL-6 levels at 1 and 5 µg/mL, were comparable to or only slightly more pronounced than those induced by the individual compounds at the same concentrations. These findings suggest an additive or independent effect rather than a synergistic one. Furthermore, the absence of a formal synergy analysis (e.g., combination index or isobologram) for the inflammatory endpoints limits the ability to infer synergism. Therefore, the interpretation of the interaction between PMM and PBO should be restricted to additive effects under the tested conditions.
Previous studies on cellular toxicity often report acute effects with shorter exposures. The uniqueness of the results obtained with RAW 267-4 may indicate differences in cellular physiology or immune responses among various cell lines. Comparing these findings with available literature could enrich the understanding of cellular responses to toxicity (Anderson et al. 2020). It is important to consider the limitations of the study, such as the exclusive use of the RAW 267-4 cell line, which may not fully reflect in vivo responses. Future research could include assessments in animal models to verify whether the observed effects in vitro translate into relevant biological responses in organisms (Roberts et al. 2021), as well as mechanistic analyses investigating the molecular pathways involved in initial resistance and eventual toxicity after prolonged exposures (Chen et al. 2022).
CONCLUSIONS
This study provides valuable insights into the cytotoxic and genotoxic effects of PMM and PBO, both individually and in combination. PMM and PBO exhibited concentration- and time-dependent cytotoxic effects across various cell lines, with significant reductions in viability at higher concentrations and prolonged exposures. The genotoxic assay indicated no significant DNA damage, suggesting these substances do not pose a genotoxic risk under the tested conditions. Additionally, the combination of PMM and PBO showed immunomodulatory properties by inhibiting the production of NO, TNF, and IL-6 in LPS-stimulated macrophages, possibly by modulating different cellular signaling pathways. The observed interactive effects highlight the complexity of assessing the safety of these compounds, suggesting that toxicity evaluation should consider not only the concentration of the compounds but also the duration of exposure. Future research should focus on elucidating the mechanisms underlying these effects and investigating the long-term consequences of chronic low-dose exposures. These findings underscore the importance of comprehensive toxicological assessments to inform regulatory decisions.
Acknowledgements
This study was financed in part by the Coordenação de Aperfeiçoamento de pessoal de Nível Superior - Brasil (CAPES) - Finance Code 001. The authors declare that they have no known competing financial interests or personal relationships that could have appeared to influence the work reported in this paper.
References
- ANDERSON J, SMITH R & BROWN T. 2020. Cellular responses to toxic agents: A comparative analysis. J Toxicol 45: 123-135.
- ANDRADE-NETO VV, REBELLO KM, PEREIRA TM & TORRES-SANTOS EC. 2021. Effect of Itraconazole-Ezetimibe-Miltefosine Ternary Therapy in Murine Visceral Leishmaniasis. Antimicrob Agents Chemother 65(5): e02676-20.
- ANTONIOUS GF, BYERS ME & KERST WC. 1997. Residue levels of pyrethrins and piperonyl butoxide in soil and runoff water. J Environ Sci Health B 32(5): 621-644.
- ANTONIOUS GF, SNYDER J & PATEL GA. 2001. Pyrethrins and piperonyl butoxide residues on potato leaves and in soil under field conditions. J Environ Sci Health B 36(3): 261-271.
- ATALE N, GUPTA K & RANI V. 2014. Protective effect of Syzygium cumini against pesticide-induced cardiotoxicity. Environ Sci Pollut Res 21: 7956-7972.
- BECKEL HDS, LORINI I & LAZZARI SMN. 2006. Efeito do sinergista butóxido de piperonila na resistência de Oryzaephilus surinamensis (L.) (Coleoptera, Silvanidae) a deltametrina e fenitrotiom. Rev Bras Entomol 50: 110-114.
- CAMATINI M, COLOMBO A, BONFANTI P, DOLDI M, URANI C, DIBISCEGLIA M & NAGELKERKE JF. 1996. In Vitro Biological Systems as Models to Evaluate the Toxicity of Pesticides. Int J Environ Anal Chem 65: 153-167.
- CHEN L, ZHAO Y & WANG H. 2022. Mechanistic insights into macrophage toxicity: Implications for therapeutic strategies. Immunol Lett 215: 45-52.
- COLLINS AR. 2004. The Comet Assay for DNA Damage and Repair: Principles, Applications, and Limitations. Mol Biotechnol 26: 249-261.
- DE BRITO TM ET AL. 2021. Anti-Inflammatory Activity and Chemical Analysis of Different Fractions from Solidago chilensis Inflorescence. Oxid Med and Cell Longev 2021: 1-13.
- EFSA - EUROPEAN FOOD SAFETY AUTHORITY. 2005. Conclusion regarding the peer review of the pesticide risk assessment of the active substance Pirimiphos-methyl. EFSA J 3(8): 1-53.
- FAO - FOOD AND AGRICULTURE ORGANIZATION OF THE UNITED NATIONS. 2016. FAO Specifications and Evaluations for Agricultural Pesticides: Pirimiphos-Methyl.
- FELEMBAN SG, GARNER AC, SMIDA FA, BOOCOCK DJ, HARGREAVES AJ & DICKENSON JM. 2015. Phenyl Saligenin Phosphate Induced Caspase-3 and c-Jun N-Terminal Kinase Activation in Cardiomyocyte-LikeCells. Chem Res Toxicol 28(11): 2179-2191.
- GARCIA M & PATEL S. 2023. Therapeutic implications of delayed toxicity in macrophage models. Clin Immunol 120: 78-85.
- GOKALP O, BUYUKVANLI B, CICEK E, OZER MK, KOYU A, ALTUNTAS I & KOYLU H. 2005. The effects of diazinon on pancreatic damage and ameliorating role of vitamin E and vitamin C. Pestic Biochem Phys 81(2): 123-128.
- GONZALEZ M, CLAYTON S, WAUSON E, CHRISTIAN D & TRAN QK. 2025. Promotion of nitric oxide production: mechanisms, strategies, and possibilities. Front Physiol 16: 1545044.
- HANDY RD, ABD-EL SAMEI HA, BAYOMY MFF, MAHRAN AM, ABDEEN AM & EL-ELAIMY EA. 2002. Chronic diazinon exposure: pathologies of spleen, thymus, blood cells, and lymph nodes are modulated by dietary protein or lipid in the mouse. Toxicology 172(1): 13-34.
- HARTMANN A. 2003. Recommendations for conducting the in vivo alkaline Comet assay. Mutagenesis 18(1): 45-51.
- HAYDEN MS & GHOSH S. 2014. Regulation of NF-κB by TNF family cytokines. Semin Immunol 26(3): 253-266.
- HODGSON E. 1999. Induction and inhibition of pesticide-metabolizing enzymes: roles in synergism of pesticides and pesticide action. Toxicol Ind Health 15: 6-11.
- HOUCK KA, DIX DJ, JUDSON RS, KAVLOCK RJ, YANG J & BERG EL. 2009. Profiling Bioactivity of the ToxCast Chemical Library Using BioMAP Primary Human Cell Systems. J Biomol Screen 14(9): 1054-1066.
- HRELJAC I, ZAJC I, LAH T & FILIPIČ M. 2008. Effects of model organophosphorous pesticides on DNA damage and proliferation of HepG2 cells. Environ and Mol Mutagen 49: 360-367.
- JAESCHKE H. 2002. Mechanisms of Hepatotoxicity. Toxicol Sci 65(2): 166-176.
- JIN X, CHEN Q, TANG S, ZOU J, CHEN K, ZHANG T & XIAO X. 2009. Investigation of quinocetone-induced genotoxicity in HepG2 cells using the comet assay, cytokinesis-block micronucleus test and RAPD analysis. Toxicol in Vitro 23(7): 1209-1214.
- JOHNSON K & LEE A. 2021. Repair mechanisms in macrophages exposed to environmental toxins. Environ Health Persp 129.
- JOKANOVIĆ M. 2018. Neurotoxic effects of organophosphorus pesticides and possible association with neurodegenerative diseases in man: A review. Toxicology 410: 125-131.
- JUDSON RS ET AL. 2010. In Vitro Screening of Environmental Chemicals for Targeted Testing Prioritization: The ToxCast Project. Environ Health Perspect 118(4): 485-492.
- KAWAI T & AKIRA S. 2007. Signaling to NF-κB by Toll-like receptors. Trends Mol Med 13(11): 460-469.
- KOPP B, VIGNARD J, MIREY G, FESSARD V, ZALKO D, LE GGARAT L & AUDEBERT M. 2018. Genotoxicity and mutagenicity assessment of food contaminant mixtures present in the French diet. Environ and Mol Mutagen 59: 742-754.
- LI D, HUANG Q, LU M, ZHANG L, YANG Z, ZONG M & TAO L. 2015. The organophosphate insecticide chlorpyrifos confers its genotoxic effects by inducing DNA damage and cell apoptosis. Chemosphere 135: 387-393.
- LIU SF, YE X & MALIK AB. 1997. In vivo inhibition of nuclear factor-kappa B activation prevents inducible nitric oxide synthase expression and systemic hypotension in a rat model of septic shock. J Immunol 159(8): 3976-3983.
- LORINI I & GALLEY DJ. 2000. Effect of the synergists piperonyl butoxide and DEF in deltamethrin resistance on strains of Rhyzopertha dominica (F.) (Coleoptera: Bostrychidae). An Soc Entomol Bras 29: 749-755.
- MARTIN H. 2010. Role of PPAR-gamma in inflammation. Prospects for therapeutic intervention by food components. Mutat Res 690(1-2): 57-63.
- MENSINK BJWG. 2008. Environmental risk limits for pirimiphos-methyl. RIVM Letter Report 601716011.
- MHADHBI L & BEIRAS R. 2012. Acute Toxicity of Seven Selected Pesticides (Alachlor, Atrazine, Dieldrin, Diuron, Pirimiphos-Methyl, Chlorpyrifos, Diazinon) to the Marine Fish (Turbot, Psetta maxima). Water Air Soil Pollut 223: 5917-5930.
- MILLER D, THOMPSON R & WHITE J. 2019. Adaptation mechanisms of immune cells under stress conditions. Cell Stress 3(4): 123-130.
- NAGY K, DUCA RC, LOVAS S, CRETA M, SCHEEPERS PTJ, GODDERIS L & ÁDÁM B. 2020. Systematic review of comparative studies assessing the toxicity of pesticide active ingredients and their product formulations. Environ Res 181: 108926.
- ODDS FC. 2003. Synergy, antagonism, and what the chequerboard puts between them. J Antimicrob Chemother 52(1): 1.
- OGASAWARA N ET AL. 2017. Modulation of immunological activity on macrophages induced by diazinon. Toxicology 379: 22-30.
- PIATTI E, MARABINI L & CHIESARA E. 1994. Increase of micronucleus frequency in cultured rat hepatocytes treated in vitro with benomyl and pirimiphos-methyl separately and in mixture. Mutat Res Lett 324(1-2): 59-64.
- POÇA KSD ET AL. 2021. Gasoline-station workers in Brazil: Benzene exposure; Genotoxic and immunotoxic effects. Mutat Res Genet Toxicol Environ Mutagen 865: 503322.
- ROBERTS C, GREENFIELD S & ADAMS P. 2021. In vivo validation of in vitro toxicity models using RAW macrophages. Toxicol Sci 180: 456-467.
- SCHLEIER JJ III, PETERSON RK, MACEDO PA & BROWN DA. 2008. Environmental concentrations, fate, and risk assessment of pyrethrins and piperonyl butoxide after aerial ultralow-volume applications for adult mosquito management. Environ Toxicol Chem 27(5): 1063-1068.
- SHETTY SS, DEEPTHI D, HARSHITHA S, SONKUSARE S, NAIK PB, KUMARI NS & MADHYASTHA H. 2023. Environmental pollutants and their effects on human health. Heliyon 25(9): e19496.
- SMITH A & JOHNSON B. 2020. The role of macrophages in chronic exposure scenarios: A review. J Immunol Res 2020(5).
- TAKEDA K, CLAUSEN BE, TSUNEYASU K, TSUJIMURA T, TERADA N, FÖRSTER I & SHIZUO A. 1999. Enhanced Th1 Activity and Development of Chronic Enterocolitis in Mice Devoid of Stat3 in Macrophages and Neutrophils. Immunity 10(1): 39-49.
- THOMPSON E, MARTINEZ F & NGUYEN T. 2022. Occupational health risks associated with chronic chemical exposure: A review. Med J 72: 345-356.
- USDA. 2022. Brazil’s Momentum as a Global Agricultural Supplier Faces Headwinds.
- VARDAVAS AI ET AL. 2016. Long-term exposure to cypermethrin and piperonyl butoxide cause liver and kidney inflammation and induce genotoxicity in New Zealand white male rabbits. Food Chem Toxicol 94: 250-259.
- WESTERINK WMA & SCHOONEN WGE. 2007a. Phase II enzyme levels in HepG2 cells and cryopreserved primary human hepatocytes and their induction in HepG2 cells. Toxicol in Vitro 21(8): 1592-1602.
- WESTERINK WMA & SCHOONEN WGE. 2007b. Cytochrome P450 enzyme levels in HepG2 cells and cryopreserved primary human hepatocytes and their induction in HepG2 cells. Toxicol in Vitro 21(8): 1581-1591.
- XIE QW, KASHIWABARA Y & NATHAN C. 1994. Role of transcription factor NF-kappa B/Rel in induction of nitric oxide synthase. J Biol Chem 269(7): 4705-4708.
- YASUNAGA S, NISHI K, NISHIMOTO S & SUGAHARA T. 2015. Methoxychlor enhances degranulation of murine mast cells by regulating F cϵ RI-mediated signal transduction. J Immunotoxicol 12(3): 283-289.
- ŽELJEŽIĆ D ET AL. 2016. Cytotoxic, genotoxic and biochemical markers of insecticide toxicity evaluated in human peripheral blood lymphocytes and an HepG2 cell line. Food Chem Toxicol 96: 90-106.
- ZHANG N, ZHU L, ZHANG R, ZHANG C, CHENG J, TAO L, ZHANG Y & XU W. 2021. Evaluation of toxicological effects of organophosphorus pesticide metabolites on human HepG2 cells. Environ Toxicol Phar 88: 103741.