
 Inhibition of human tumor cell migration by a rice-derived chimeric cysteine protease inhibitor
Abstract
The cystatin superfamily includes proteins crucial for inhibiting cysteine proteases, enzymes involved in many biological processes. In plants, cystatins regulate seed germination, development, and pathogen defense. In humans, inhibiting legumain-type cysteine proteases offers a promising cancer treatment strategy, as this enzyme’s expression often rises during tumor progression. We evaluated a novel rice-derived chimeric legumain inhibitor using in silico and in vitro methods. Computational simulations confirmed the inhibitor’s stability and nanomolar affinity for legumain’s active site. Post-expression and purification assays determined its kinetics and demonstrated its efficacy in reducing HT29 tumor cell migration and viability. Our findings suggest the chimeric Oryzacystatin I mutant with SNSL motifs is a promising candidate for cancer drug development.
Key words
cystatin; proteinase inhibitor; legumain; cancer
INTRODUCTION
Legumain (EC:3.4.22.34) is a cysteine protease belonging to the C13 family that exhibits specificity for hydrolyzing asparaginyl bonds (Rawlings et al. 2018). This catalytic activity is mediated by a catalytic dyad consisting of Cys189 and His148 residues (Figure 1). Legumain is found in a wide range of organisms, including mammals (Dall et al. 2015), plants (Müntz & Shutov 2002), nematodes (Holzhausen et al. 2018), and ticks (Abdul Alim et al. 2007), but not in bacteria.
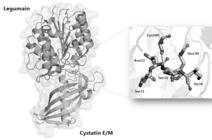
Crystallographic structure of legumain in complex with cystatin E/M. On the left, the interaction between the proteinase and its inhibitor and on the right, the residues involved in the inhibition mechanism: the catalytic residues Cys189 and His148 of legumain and the [SNSI] residues of the inhibitory site of cystatin E/M.
In mammals, legumain is synthesized as a glycosylated proenzyme (prolegumain) that undergoes auto-catalytic activation under acidic pH and reducing conditions. It is believed that the newly synthesized legumain travels through the trans-Golgi network to lysosomes via endosomes, with glycosylation playing a crucial role in its transport. Although legumain functions primarily within lysosomes where it processes various proteins, recent studies revealed significant extracellular functions suggesting an important activity beyond lysosomal activity.
An increasing number of researches have linked the extracellular presence of legumain to the development of different types of cancer. Tumors create an acidic microenvironment at their borders, where secreted prolegumain can be activated, facilitating substrate activation or degradation (Gatenby et al. 2006). A meta-analysis revealed that legumain is highly expressed in tumors and correlates with a poorer clinical prognosis (Zhen et al. 2015). Legumain is induced in multiple myeloma under chronic hypoxia (Clees et al. 2022), drives cellular proliferation and migration in multiple cancers (Chen et al. 2022, Toss et al. 2019, Zhang et al. 2021), enhances tumorigenesis in epithelial tissues (Bayramoglu et al. 2022), and promotes the progression of cervical cancer and retinoblastoma (Meng & Liu 2016, Tang et al. 2022). Therefore, the regulation of legumain activity holds promising potential as a therapeutic strategy.
Among the regulators of legumain activity, cystatins (MEROPS family I25) stand out as an evolutionarily related and widely distributed group of proteins capable of competitively inhibiting papain and/or legumain-like cysteine proteases (Rawlings et al. 2018). Cystatins are classified based on their cellular localization, structural similarity, presence or absence of disulfide bonds, and molecular weight (Abrahamson 1994). In mammals, cystatins are subdivided into three subfamilies: stefins (family 1), cystatins (family 2) and kininogens (family 3) (Müller-Esterl et al. 1985). Among humans, cystatins C, E/M, and F, three members of family 2, exhibit potent legumain inhibition in the nanomolar (nM) range (Alvarez-Fernandez et al. 1999). Cystatin E/M, predominantly found in epithelial tissues, is the human cystatin with the lowest reported Ki value against legumain. As a competitive inhibitor, cystatin E/M residues interact directly with legumain active site (Figure 1). The active cystatin E/M consists of approximately 120 amino acids and has a molecular weight of 15 kDa. It can be glycosylated and contains two disulfide bridges between positions 73-83 and 97-117 (Ni et al. 1997).
In contrast, plant cystatins (phytocystatins) represent an independent evolutionary branch from mammalian cystatins, supporting the notion of parallel evolution of cystatins in animals and plants (Balbinott & Margis 2022). Phytocystatins can be identified by the consensus sequence [LVI]-[AGT]-[RKE]-[FY]-[AS]-[VI]-X-[EDQV]-[HYFQ]-N and classified based on their molecular weight and structural similarity (Margis et al. 1998). The three-dimensional structure of phytocystatins is conserved, consisting of an alpha helix in the N-terminal region over five antiparallel beta sheets (Turk & Bode 1991). Phytocystatins can be classified into three types: type I phytocystatins (PhyCys-I) are proteins with a structure similar to human cystatins and can inhibit papain-like proteases (MW = 12~16 kDa); type II phytocystatins (PhyCys-II) are dual-target inhibitors, as they possess an inhibitory activity towards papain and legumain through a carboxyl-terminal extension with the motif [SNS]-[LI] capable of inhibiting legumain (MW = ~23-26 kDa); and type III phytocystatins with multiple repeats of the basic structure (Nissen et al. 2009).
Interestingly, within the cystatin superfamily, a functional convergence can be observed between mammalian cystatin E/M (Figure 2b) and plant PhyCys-II (Figure 2c) despite their different three-dimensional structure organization, both of which possess domains capable of inhibiting papain-like and legumain. On the other hand, PhyCys-I (Figure 2a) exhibits a high structural similarity to cystatin E/M but lacks the SNS[I-L] inhibitory domain for legumain, present in the loop after the alpha-helix (Figure 2a) (Balbinott & Margis 2022).

Three-dimensional structure of cystatins and phytocystatins. (a) rice oryzacystatin-1 (PDB 1EQK) containing the papain-like inhibitory domain (QxVxG and PW) inside the straight circular area; (b) Human cystatin E/M (PDB 4N6O) containing papain-like and the legumain-like inhibitory domains (SNSI) inside the dotted circular area, and (c) Sesame type-II phytocystatin (PDB 2MZV) containing both inhibitory sites.
Additionally, recent studies revealed that legumain plays a pivotal role in tumor development. Given the importance of phytocystatins and legumain, this study will explore the regulation of legumain activity in human cancer cells employing an innovative strategy of chimeric inhibitor derived from Oryzacystatin I harboring multiple legumain inhibitory domains within a single protein inhibitor. This research aims to contribute to the development of new biotechnological assets capable of contributing to the development of treatments for diseases like cancer.
MATERIALS AND METHODS
Design of a chimeric inhibitor and molecular modeling
We designed a chimeric legumain inhibitor based on the sequence of Oryzacystatin-I, namely 4xSNSL. The amino acids present in the four loops of the original protein backbone were replaced by the inhibitory motif towards legumain (SNSL) as displayed in Figure 3a. For the modeling, the three-dimensional coordinates of rice Oryzacystatin-I (PDB ID 1EQK) were used as the structural template for the 4xSNSL inhibitor. Based on the amino acid sequence of Oryzacystatin-I, the loop residues were manually modified to match the desired structure of the chimeric mutant inhibitor 4xSNSL. Homology modeling was performed using the Swiss-Model server (Mirdita et al. 2022, Waterhouse et al. 2018). In addition to modeling the inhibitor 4xSNSL, the three-dimensional structures of cystatins C, F and the carboxy terminal domain of barley HvCPI-4 were modeled using ColabFold (Mirdita et al. 2022).

Structural model of oryzacystatin-I with the four mutated SNSL motifs, where the secondary structures of the proteins are represented as cartoons and the loop residues as sticks (a). Panel (b) shows the designations of the corresponding loops as loop1 (L1), loop2 (L2), loop3 (L3), and loop4 (L4), respectively. Molecular docking of Legumain (PDB ID 4N6O) against each of the four loops of the mutant chimeric inhibitor is shown in panel (c). The RMSF of all four sets of modified residues Ser, Asn, Ser and Leu in 4xSNSL mutant after docking with legumain (d).
Protein-protein interaction (PPI)
Molecular docking was performed through the LightDock software (Jiménez-García et al. 2018) using the experimental three-dimensional coordinates of human legumain (PDB ID 4N6O) and the modeled chimeric inhibitor 4xSNSL. Four simulations were performed, one for each loop of the inhibitor. During the simulations, the catalytic site residues of legumain and the inhibitory site of the 4xSNSL mutant were constrained, while the rest of the structure of the 4xSNSL mutant was kept flexible. The DFIRE scoring function was used to evaluate the binding free energy of docked complexes and to select the best results (Zhou & Zhou 2002).
Molecular dynamics
The legumain-4xSNSL complexes obtained from docking were submitted to molecular dynamics simulations to reduce improper contacts and identify equilibrium conformations. The PROPKA algorithm, available on the PDB2PQR server (Jurrus et al. 2018), was used to prepare the system to assign the protonation state at pH 7.0 (Dolinsky et al. 2007). Molecular dynamics simulations were conducted using the GROMACS package version 2023.2 (Van Der Spoel et al. 2005) and the AMBER99SB force field. All complexes were solvated using the TIP3P water model (Mark & Nilsson 2001) in a tetrahedral box containing Na+ and Cl- ions at a concentration of 0.15 mM. Complexes were centered and minimum distances of 1 Å were maintained between any protein atom and the edge of the box. Periodic boundary conditions were applied to the system. System minimization was performed in three steps, aiming to reduce the global energy and correct improper solute-solvent interactions, avoiding instabilities that could compromise the quality of the results (Van Der Spoel et al. 2005). Temperature was equilibrated at 297.15 K using the isothermal-isochoric (NVT) scheme, and the pressure was maintained at 1 atm using the isothermal-isobaric (NPT) ensemble. The production step used an integration time of 2 fs to generate trajectories of 300 ns. The GROMACS rms and rmsf tools were used to obtain RMSD and RMSF data from the generated trajectories.
Binding free energy calculations
Molecular Mechanics Poisson-Boltzmann Surface Area (MM-PBSA) calculations were employed to determine the binding free energy of each complex (Valdés-Tresanco et al. 2021). The polar component of solvation free energy was estimated using Posson-Boltzmann (PB) equations. During calculations, a dielectric constant of ε solute = 2 was considered for the solute arising from the presence of charged residues and dielectric constant ε solute = 80 for water. The free binding energy for each complex was then estimated using equation 1,
where each energy term (G), in the right of the equation, is given by equation 2:
Given that enthalpy (H) is the sum of ∆ EMM and ∆ Gsol terms, equation 2 can also be written as
Where:
The ∆ Gsol is calculated from the following equation:
Where:
Next, the entropic component of the binding energy during the molecular dynamics simulation was calculated using the Interaction Entropy (IE) method. Thus, IE is defined as:
In the above equation, -TS is the interaction entropy, Eplint represents the interaction energy of the protein-ligand complex, and serves as a fine-tuning parameter to account for the non-idealities of the simplified surface area-based model and capture the overall nonpolar solvation free energy more accurately (Duan et al. 2016).
Inhibition constant calculation
A correlation was established between the experimental and theoretical data by plotting the logarithm of the experimental inhibition constant (Ki) values (Miller et al. 2012) the obtained MM-PBSA values, generating a graph of a log Ki vs. interaction energy. Using the interaction energy values for the 4xSNSL mutant complexes with legumain and the equation of the line obtained for the cystatins and PhyCys, it was possible to calculate the theoretical inhibition constant for each one of the four simulations of the 4xSNSL inhibitor with legumain.
Enzyme kinetics of the 4xSNSL mutant against commercial legumain (EC 3.4.22.2) was evaluated using the fluorescent substrate Z-Ala-Ala-Asn-AMC (N-carbobenzoxyl-Ala-Ala-Asn-7-amido-4-methylcoumarin), as described in the literature (Alvarez-Fernandez et al. 1999, Martinez et al. 2007). Briefly, a mix containing different substrate concentrations (0.2 µM, 0.5 µM, 1 µM, and 2 µM), 1 mM DTT in 100 mM citrate-phosphate buffer pH 5.5 was prepared. Three reactions, one without inhibitors and two containing different concentrations of the 4xSNSL inhibitor (5 nM and 15 nM) were prepared. Next, 2 nM of legumain was added to each reaction, and the release of free AMC was measured at excitation and emission wavelengths of 360 and 460 nM, respectively. All enzymatic measurements were performed in triplicate in 96-well reaction plates in a fluorimeter using a final volume of 100 µL at 30 °C. Data were analyzed using SoftMax® Pro 6.2.2 software.
Cloning, expression and purification of 4xSNSL
The gene encoding the 4xSNSL chimeric mutant inhibitor was obtained by in vitro synthesis and cloning into the pETDuet-1 vector by GenOne (www.genone.com). The vector (Supplementary Material - Figure S1) contained a six-histidine tag at the C-terminus for affinity purification of the recombinant protein. Approximately 200 ng of the plasmid was incubated with 100 µL of E. coli Codon Plus-RP competent cells containing 100 mM CaCl2 and 15% v/v glycerol. The cells were incubated on ice for 20 min, followed by a heat shock at 42 °C for 30 s. The cells were then supplemented with 900 µL of LB medium and incubated for 1 hour at 37 °C at 220 rpm. Subsequently, 200 µL of this culture was plated on agar plates containing 100 µg/mL ampicillin and 35 µg/mL chloramphenicol. Transformed cells were selected based on the resistance of the Codon Plus RP strain and the pETDuet-1 vector to chloramphenicol and ampicillin, respectively. A single colony of the transformed bacteria was inoculated into 5 mL of LB medium supplemented with 100 µg/mL ampicillin and 35 µg/mL chloramphenicol and incubated with shaking (220 rpm) at 37 °C for 17 hours. Subsequently, 2 mL of this culture were inoculated into 250 mL of LB medium containing 100 µg/mL ampicillin and 35 µg/mL chloramphenicol and incubated with shaking (220 RPM) at 37 °C. When the optical density (OD600nm) of the culture reached 0.3 - 0.4, expression was induced by adding isopropyl β-D-1-thiogalactopyranoside (IPTG) to a final concentration of 1 mM. The culture was incubated with vigorous shaking at 18 °C for 17 hours.
The resulting culture was centrifuged at 4000 rpm for 30 minutes, the supernatant was discarded, and the bacteria were resuspended in 10 mL of lysis buffer (20 mM sodium phosphate, 200 mM NaCl, 0.5% Triton X-100, and 0.1 mg/mL lysozyme). The cells were lysed by sonication for 3 minutes in 5-second pulses of 30 J, with 10-second intervals.
The obtained lysate was supplemented with 5 mM imidazole, and chromatography was performed using 5 mL of Ni-NTA agarose resin in a benchtop column under atmospheric pressure. The lysate was applied to the column, and elution was carried out in 1 mL fractions using an elution buffer containing 20 mM NaCl, 200 mM NaCl, 5% glycerol, and 200 mM imidazole. The fractions with the lowest degree of contaminants were pooled and concentrated using Amicon Ultra columns in a buffer containing 20 mM sodium phosphate, 100 mM NaCl, and 5% glycerol. The concentration of total purified proteins was determined by the Bradford assay (Bradford 1976).
Cell migration assay
When cell culture reached 90% confluence, all culture medium was removed, and an artificial scratch was created using a 200 µL pipette tip in the center of the cell monolayer. The cells were washed 1x with CMF to remove detached cells, and the [50 µM] protein treatment was added. Wound closure was monitored by images captured using an inverted microscope (Olympus IX40) at 0 hours and 24 hours. Analysis was performed using ImageJ software version 1.8.0 with the “Wound Healing Size Tool” plugin (Suarez-Arnedo et al. 2020).
Statistical analysis
Data are presented as mean ± standard deviation. For the analysis of cell viability data (MTT, SRB, and VN), comparisons between groups were performed using Student’s t-test, assuming parametric data. Two-way analysis of variance (ANOVA) was performed for the statistical analysis of wound-healing assay data (wound area in mm²). The difference in wound area (Δ mm²) was statistically analyzed using Student’s t-test.
RESULTS AND DISCUSSION
Structural analysis
Based on the amino acid sequence and secondary structure data of rice Oryzacystatin-I, the residues present in the four loops were replacedin order to harbor the SNSL inhibitory motif, resulting in the 4xSNSL chimeric rice Oryzacystatin-I mutant (Figure 3a, b). To further investigate the interactions between legumain and the 4xSNSL chimera, each of the four loops present in the chimeric 4xSNSL was docked against the binding site of legumain. For the sake of comparison, cystatin C, F, E/M, oryzacystatin-1, and barley carboxy HvCPI-4 were also docked against legumain. To ensure a proper fitting at the contact interfaces, each complex was submitted to 300-ns molecular dynamics simulations (Figure 3c). As shown in figure S2, Loops 1 and 4 reached equilibrium after 15 ns of simulation, while Loop 2 took about 50 ns and Loop 3 took about 25 ns. The root means square deviation (RMSD) for Loops 1 and 4 stabilized between 0.3-0.4 nm, while for Loop 2 it was about 0.3 nm and for Loop 3 above 0.4 nm. This analysis indicates that mutation in Loop 3 made it more flexible while mutations in Loop 2 made it more rigid than Loops 1 and 4. A RMSD of other cystatins (Oryzacystatin-I, cystatin C, F and E/M) is also given in figure S3 and shows that a stability is reached after 10 ns for cystatin E/M and about 50 nm for the others. To gain insight into the individual flexibility of residues within the 4xSNSL structure, the root mean square fluctuation (RMSF) analysis was performed individually for each complex. As observed in figure S4, the terminal portions of the 4xSNSL chimera exhibit high flexibility, despite which Loop is docked into the binding pocket of the legumain with values exceeding 0.4 nm. Nevertheless, as shown in figure 3d, upon anchoring, residues involved in the interfacial interaction with legumain exhibited RMSF values below 0.3 nm. This indicates that these residues exhibit minimal movement relative to their average position when interacting with legumain, suggesting a stable and well-defined structure within the inhibitory motifs.
Interaction energy profile
Initially, to better characterize the effect of the proposed mutations in different regions of the chimera protein, the interaction energy between legumain and each of the 4xSNSL loops were calculated and compared with the interaction with cystatin C, F, E/M, oryzacystatin-1, and the carboxy terminal domain of barley HvCPI-4. Loop 4 exhibited the highest interaction energy (-87.62 ± 0.61 kcal/mol), followed by Loop 2 (-81.36 ± 1.4 kcal/mol), Loop 1 (-61.08 ± 5.32 kcal/mol), and Loop 3 (-48.89 ± 2.16 kcal/mol). Subsequently, it was calculated the binding free energy of complexes formed by legumain with cystatin C, F, E/M, oryzacystatin-1, and the carboxy terminal domain HvCPI-4. The selection of these cysteine protease inhibitors was based on the availability of their Ki values in the literature, enabling a comparative assessment of their affinities for legumain. Among these inhibitors, cystatin E/M exhibits the lowest Ki value (0.0016 nM), followed by cystatin C (0.20 nM), cystatin F (10 nM), the carboxy terminal domain of HvCPI-4 (190 nM), and rice Oryzacystatin-I, which does not display inhibitory activity against legumain (Alvarez-Fernandez et al. 1999, Martinez et al. 2007). Consistent with the Ki values, Cystatin E/M, the inhibitor with the lowest Ki, also demonstrated the strongest interaction energy (-97.92 ± 1.02 kcal/mol). Cystatin C (-84.80 ± 1.67 kcal/mol), F (-80.79 ± 2.0 kcal/mol), and the carboxy terminal domain of HvCPI-4 (-63.44 ± 5.54 kcal/mol) exhibited progressively weaker interaction energies. Interestingly, Oryzacystatin-I, which lacks inhibitory activity, displayed an interaction energy of -46.63 ± 1.55 kcal/mol. A graphical representation of the binding energy of each of the four SNSL loops and the above-mentioned inhibitors is shown in figure 4C.

(a) SDS-PAGE 12% electrophoretic profile of 4xSNSL mutant expression in LB medium (band around 10 kDa): MWM - Molecular weight marker; NIB - Non-induced bacteria; IB - Induced bacteria; S - Lysate supernatant; FT - Flow thru; E - Elution. (b) Km plot as a function of increasing inhibitor concentrations. (c) Individual interaction energy between cystatins or phytocystatins and legumain. (d) Correlation between protein-inhibitor complex interaction energy and log(Ki).
As evident in Table I, the substantial disparity in the Van der Waals energy component (ΔVDWAALS) appears to be a primary factor contributing to the weaker binding of Loops L1 and L3. This aligns with established literature, as competitive inhibitors predominantly engage through non-covalent interactions, including Van der Waals forces.
While the inhibitory mechanism of legumain by cystatins or PhyCys relies on the interaction of the inhibitory domain with legumain catalytic site, additional residues also play a role in regulating legumain activity. To gain a deeper understanding of this mechanism and identify the residues involved in inhibition, we performed interaction energy decomposition analysis of legumain complexes with cystatin E/M (positive control) and Oryzacystatin-1 (negative control). To achieve this, we evaluated the individual interaction energies of all residues described in the literature as involved in legumain catalytic and regulatory activity: Asn32, Arg44, His45, Gly189, Cys189, Glu190, Ser216, Tyr217, and Trp232 (Dall & Brandstetter 2013). Results revealed that the residues involved in the interaction between cystatin E/M and legumain exhibited more negative (attractive) interaction energy values compared to those involved in the interaction between oryzacystatin-1 and legumain (figure S5). These findings corroborate with experimental observations, as cystatin E/M exhibits the lowest experimental Ki value for legumain inhibition, while oryzacystatin-1 lacks inhibitory activity towards legumain. The interaction energy decomposition of the complexes formed by the 4xSNSL chimeric mutant inhibitor and legumain revealed a similar profile to that observed in the cystatin E/M-legumain complex. This feature highlights the importance of the interaction between legumain and the asparagine (Asn) residue at the inhibitory site for effective inhibition, as this protease specifically cleaves peptide bonds following Asn residues. In the legumain-cystatin E/M complex, the Asn residue exhibited the lowest interaction energy (-4.73 kcal/mol) compared to the other residues. Similarly, the chimeric mutant residues docked onto legumain via loops 2 and 4 displayed Asn residue interaction energies in the order of -3.29 and -2.58 kcal/mol, respectively (figure S5). Analysis of the residues located at the loop 2 and 4 revealed that a large portion of them interacted attractively with legumain. This helps explain the smaller (more negative) interaction energy values observed in these loops, indicating their higher affinity for legumain.
Expression and purification of 4xSNSL
Following several rounds of optimization, we determined the optimal expression conditions for the protein 4xSNSL using E. coli Codon Plus RP. Following sample optimization, the protein was successfully purified by immobilized metal ion affinity chromatography (IMAC) (Figure 4a). This process resulted in the pure recombinant inhibitor 4xSNSL in sufficient quantity (262 µM) for further experiments.
Determining the inhibition constant
To establish the theoretical inhibition constant values, a correlation analysis was performed between the interaction energy values obtained from the entropy-based interaction method and the base-10 logarithms of the experimental Ki values for cystatin E/M (0.0016 nM), cystatin C (0.20 nM), cystatin F (10 nM), and the carboxy terminal domain of HvCPI-4 (190 nM) (Alvarez-Fernandez et al. 1999, Martinez et al. 2007). Analysis of inhibitor 4xSNSL in complex with legumain revealed plausible binding affinity values for L2 (1.25 nM) and L4 (0.12 nM) using the linear equation and logarithm. However, elevated values in the μM range were observed for L1 (2.23 μM) and L3 (199 μM) (Figure 4D). Collectively, interaction energy, energy decomposition, and theoretical inhibition constant results indicate that mutant chimeric inhibitor 4xSNSL effectively inhibits legumain in the nanomolar range. This inhibition is primarily mediated by loops 2 and 4 of the inhibitor.
To determine the kinetic parameters of inhibitor 4xSNSL, initial reaction rates, measured by the release of 7-amino-4-methylcoumarin (AMC), were plotted against different substrate concentrations in an Eadie-Hofstee plot (v0 versus v0/[S]). Then, using the values obtained from Km versus [I] and the equation KMap = KM(1+[I] _ Ki ), the inhibition constant (Ki) of the 4xSNSL inhibitor was determined to be 24.6 ± 6.8 nM (Figure 4b).
HT-29 cell assays
The MTT assay analysis demonstrated that the inhibitor (50 µM) was unable to significantly reduce mitochondrial activity (t-test, protein: 85.84% ± 15.42; P = 0.1870) (Figure 5a). Similar results were observed in the SRB assay (t-test, protein: 92.42% ± 6.428; P = 0.111 (Figure 5b). However, a statistically significant increase in neutral red uptake was observed (t-test, protein: 102.1% ± 0.8485, P = 0.0183) (Figure 5c). Nonetheless, this increase represents only 2.1%, which may not be biologically relevant for neutral red uptake.

Cell viability and migration tests. Cell viability was evaluated by three colorimetric methods: (a) MTT, (b) sulforhodamine and (c) neutral red. (d) Cell migration was evaluated by wound closure measured after 24 hours.
The cell migration assay conducted by creating an artificial “wound” demonstrates the ability of cells to recover from injury through cell multiplication and migration. The interaction between time and treatment with the inhibitor (50 µM) has a significant effect on the migration ability of HT29 cells (two-way ANOVA, F (1, 5) = 12.87, P = 0.0158). The difference in scratch area at 0 and 24 h was also evaluated to determine the migration capacity of these cells and the effect size of protein exposure. The difference between the area reductions of the groups was significant (Student’s t-test, P = 0.0062). The data show that the control group had an average reduction of 0.7960 ± 0.009560, while the inhibitor-treated group had an average reduction of 0.5457 mm² ± 0.05996, representing a 32% inhibition of migration (Figure 5d). Other concentrations and administration dynamics of the inhibitor need to be tested to determine optimal effect concentrations and its half-life in vitro and in vivo systems.
The link between legumain and tumor progression and its potential as an anti-tumor drug target has driven the search and development of various inhibitory compounds, including lansoprazole, and phycocyanobilin (Bosnjak et al. 2019, Ness et al. 2015, Wilkinson et al. 2023). Our findings demonstrate that the chimeric inhibitor 4xSNSL effectively suppresses legumain activity in the nanomolar (nM) range, significantly reducing the migration of HT29 adenocarcinoma cells at micromolar concentrations. Similar studies with esomeprazole and omeprazole revealed that these drugs reduce the invasion of MDA-MB-231 breast cancer cells without affecting cell viability (Zhao et al. 2021). Exogenous legumain has been shown to promote the invasion and migration of cholangiocarcinoma (bile duct cancer) cells without affecting cell proliferation (Chu et al. 2023). Consistent with these findings, our cell viability assays (MTT, SRB) and migration assays demonstrate that legumain inhibition significantly reduces cell migration and invasion during tumor progression without affecting cell viability (Chen et al. 2023). Thus, the combination of legumain inhibitory compounds with cytotoxic drugs holds immense potential for cancer treatment. Further research is warranted to fully elucidate the role of legumain in the process of carcinogenesis.
CONCLUSIONS
This study presents an innovative approach for regulating legumain-type cysteine proteases using a multi-site inhibitor. The findings obtained through this strategy expand the biotechnological potential of these enzyme inhibitors for treating diseases such as cancer. Enzymatic assays demonstrated that a multi-site inhibitor effectively suppresses legumain activity in the nanomolar (nM) range. Although the inhibition constant of the 4xSNSL mutant is close to that of cystatin E/M, the presence of four binding sites may allow inhibition to occur at a ratio of one inhibitor molecule to two molecules of the legumain proteinase. Furthermore, we observed reduced cell migration in colorectal adenocarcinoma cells. The data and observations presented here will serve as a foundation for future research aimed at elucidating the mechanisms of cysteine protease regulation in tumor environments and developing novel and more effective cancer therapeutic strategies.
SUPPLEMENTARY MATERIAL
ACKNOWLEDGMENTS
This work was supported by the Conselho Nacional de Desenvolvimento Científico e Tecnológico (CNPq), INCT Plant-Stress Biotech (MCTIC), Centro Nacional de Supercomputação (CESUP) and Fundação de Amparo à Pesquisa do Rio Grande do Sul (FAPERGS) and Fundação de Amparo à Pesquisa do Distrito Federal (FAPDF).
REFERENCES
- ABDUL ALIM M, TSUJI N, MIYOSHI T, KHYRUL ISLAM M, HUANG X, MOTOBU M & FUJISAKI K. 2007. Characterization of asparaginyl endopeptidase, legumain induced by blood feeding in the ixodid tick Haemaphysalis longicornis. Insect Biochem Molec 37: 911-922.
- ABRAHAMSON M. 1994. [49] Cystatins. In: Method Enzymol, p. 685-700.
- ALVAREZ-FERNANDEZ M, BARRETT AJ, GERHARTZ B, DANDO PM, NI J & ABRAHAMSON M. 1999. Inhibition of Mammalian Legumain by Some Cystatins Is Due to a Novel Second Reactive Site. J Biol Chem 274: 19195-19203.
- BALBINOTT N & MARGIS R. 2022. Review: Unraveling the origin of the structural and functional diversity of plant cystatins. Plant Sci 321: 111342.
- BAYRAMOGLU Z, KILINC ANU, OMEROGLU E, YILMAZ F, BAYRAMOGLU D, UNLU Y & AYDIN HA. 2022. Expression of extracellular matrix proteins nidogen-1 and legumain in endometrial carcinomas. J Obstet Gynaecol Res 48: 1019-1025.
- BOSNJAK T, SOLBERG R, HEMATI PD, JAFARI A, KASSEM M & JOHANSEN HT. 2019. Lansoprazole inhibits the cysteine protease legumain by binding to the active site. Basic Clin Pharmacol Toxicol 125: 89-99.
- BRADFORD MM. 1976. A rapid and sensitive method for the quantitation of microgram quantities of protein utilizing the principle of protein-dye binding. Anal Biochem 72: 248-254.
- CHEN B ET AL. 2022. Cleavage of tropomodulin-3 by asparagine endopeptidase promotes cancer malignancy by actin remodeling and SND1/RhoA signaling. J Exp Clin Canc Res 41: 209.
- CHEN J, XU W, SONG K, DA L-T, ZHANG X, LIN M, HONG X, ZHANG S & GUO F. 2023. Legumain inhibitor prevents breast cancer bone metastasis by attenuating osteoclast differentiation and function. Bone 169: 116680.
- CHU Y, SHI D, WANG N, REN L, LIU N, HU F, MENG W, HONG S-J & BAI X. 2023. Clonorchis sinensis legumain promotes migration and invasion of cholangiocarcinoma cells via regulating tumor-related molecules. Parasit Vectors 16: 71.
- CLEES A-S ET AL. 2022. Identification of the Cysteine Protease Legumain as a Potential Chronic Hypoxia-Specific Multiple Myeloma Target Gene. Cells 11: 292.
- DALL E & BRANDSTETTER H. 2013. Mechanistic and structural studies on legumain explain its zymogenicity, distinct activation pathways, and regulation. PNAS 110: 10940-10945.
- DALL E, FEGG JC, BRIZA P & BRANDSTETTER H. 2015. Structure and Mechanism of an Aspartimide-Dependent Peptide Ligase in Human Legumain. Angew Chem Int Edit 54: 2917-2921.
- DOLINSKY TJ, CZODROWSKI P, LI H, NIELSEN JE, JENSEN JH, KLEBE G & BAKER NA. 2007. PDB2PQR: expanding and upgrading automated preparation of biomolecular structures for molecular simulations. Nucleic Acids Res 35: W522-W525.
- DUAN L, LIU X & ZHANG JZH. 2016. Interaction Entropy: A New Paradigm for Highly Efficient and Reliable Computation of Protein–Ligand Binding Free Energy. J Am Chem Soc 138: 5722-5728.
- GATENBY RA, GAWLINSKI ET, GMITRO AF, KAYLOR B & GILLIES RJ. 2006. Acid-Mediated Tumor Invasion: a Multidisciplinary Study. Cancer Res 66: 5216-5223.
- HOLZHAUSEN J, HAAKE C, SCHICHT S, HINSE P, JORDAN D, KREMMER E & STRUBE C. 2018. Biological function of Dictyocaulus viviparus asparaginyl peptidase legumain-1 and its suitability as a vaccine target. Parasitology 145: 378-392.
- JIMÉNEZ-GARCÍA B, ROEL-TOURIS J, ROMERO-DURANA M, VIDAL M, JIMÉNEZ-GONZÁLEZ D & FERNÁNDEZ-RECIO J. 2018. LightDock: a new multi-scale approach to protein–protein docking. Bioinformatics 34: 49-55.
- JURRUS E ET AL. 2018. Improvements to the APBS biomolecular solvation software suite. Protein Sci 27: 112-128.
- MARGIS R, REIS EM & VILLERET V. 1998. Structural and Phylogenetic Relationships among Plant and Animal Cystatins. Arch Biochem Biophys 359: 24-30.
- MARK P & NILSSON L. 2001. Structure and Dynamics of the TIP3P, SPC, and SPC/E Water Models at 298 K. J Phys Chem A 105: 9954-9960.
- MARTINEZ M, DIAZ-MENDOZA M, CARRILLO L & DIAZ I. 2007. Carboxy terminal extended phytocystatins are bifunctional inhibitors of papain and legumain cysteine proteinases. FEBS Lett 581: 2914-2918.
- MENG F & LIU W. 2016. Knockdown of Legumain Suppresses Cervical Cancer Cell Migration and Invasion. Oncol Res 23: 7-12.
- MILLER BR, MCGEE TD, SWAILS JM, HOMEYER N, GOHLKE H & ROITBERG AE. 2012. MMPBSA.py : An Efficient Program for End-State Free Energy Calculations. J Chem Theory Comput 8: 3314-3321.
- MIRDITA M, SCHÜTZE K, MORIWAKI Y, HEO L, OVCHINNIKOV S & STEINEGGER M. 2022. ColabFold: making protein folding accessible to all. Nat Methods 19: 679-682.
- MÜLLER-ESTERL W, FRITZ H, KELLERMANN J, LOTTSPEICH F, MACHLEIDT W & TURK V. 1985. Genealogy of mammalian cysteine proteinase inhibitors. FEBS Lett 191: 221-226.
- MÜNTZ K & SHUTOV AD. 2002. Legumains and their functions in plants. Trends Plant Sci 7: 340-344.
- NESS KA ET AL. 2015. Development of a potent and selective cell penetrant Legumain inhibitor. Bioorg Med Chem Lett 25: 5642-5645.
- NI J ET AL. 1997. Cystatin E is a Novel Human Cysteine Proteinase Inhibitor with Structural Resemblance to Family 2 Cystatins. J Biol Chem 272: 10853-10858.
- NISSEN MS, KUMAR GNM, YOUN B, KNOWLES DB, LAM KS, BALLINGER WJ, KNOWLES NR & KANG C. 2009. Characterization of Solanum tuberosum Multicystatin and Its Structural comparison with Other Cystatins. Plant Cell 21: 861-875.
- RAWLINGS ND, BARRETT AJ, THOMAS PD, HUANG X, BATEMAN A & FINN RD. 2018. The MEROPS database of proteolytic enzymes, their substrates and inhibitors in 2017 and a comparison with peptidases in the PANTHER database. Nucleic Acids Res 46: D624-D632.
- SUAREZ-ARNEDO A, FIGUEROA FT, CLAVIJO C, ARBELÁEZ P, CRUZ JC & MUÑOZ-CAMARGO C. 2020. An image J plugin for the high throughput image analysis of in vitro scratch wound healing assays. PLoS ONE 15: e0232565.
- TANG Q, XU F, LIN J, ZHANG C, LIU X, DONG L, ZHAO J, ZHU L & LIN T. 2022. Legumain affects the PI3K/AKT tumor progression pathway in retinoblastoma. Exp Eye Res 224: 109221.
- TOSS MS, MILIGY IM, GORRINGE KL, MCCAFFREY L, ALKAWAZ A, ABIDI A, ELLIS IO, GREEN AR & RAKHA EA. 2019. Legumain is an independent predictor for invasive recurrence in breast ductal carcinoma in situ. Mod Pathol 32: 639-649.
- TURK V & BODE W. 1991. The cystatins: Protein inhibitors of cysteine proteinases. FEBS Lett 285: 213-219.
- VALDÉS-TRESANCO MS, VALDÉS-TRESANCO ME, VALIENTE PA & MORENO E. 2021. gmx_MMPBSA: A New Tool to Perform End-State Free Energy Calculations with GROMACS. J Chem Theory Comput 17: 6281-6291.
- VAN DER SPOEL D, LINDAHL E, HESS B, GROENHOF G, MARK AE & BERENDSEN HJC. 2005. GROMACS: Fast, flexible, and free. J Comput Chem 26: 1701-1718.
- WATERHOUSE A ET AL. 2018. SWISS-MODEL: homology modelling of protein structures and complexes. Nucleic Acids Res 46: W296-W303.
- WILKINSON IV ET AL. 2023. The Cyanobacterial “Nutraceutical” Phycocyanobilin Inhibits Cysteine Protease Legumain. Chembiochem 24: e202200455.
- ZHANG D, WANG L, WANG H, LV X, REN Q & ZHENG G. 2021. The effects of legumain in THP1 leukemia cells. BIOCELL 45: 149-156.
- ZHAO T ET AL. 2021. Esomeprazole inhibits the lysosomal cysteine protease legumain to prevent cancer metastasis. Invest New Drugs 39: 337-347.
- ZHEN Y ET AL. 2015. Clinicopathologic significance of legumain overexpression in cancer: a systematic review and meta-analysis. Sci Rep 5: 16599.
- ZHOU H & ZHOU Y. 2002. Distance-scaled, finite ideal-gas reference state improves structure-derived potentials of mean force for structure selection and stability prediction. Protein Sci 11: 2714-2726.


