 Industrial strategy to reduced hold time of pork shank in continuous freezing tunnel
Abstract
This study evaluated industrial strategies to reduce the retention time of pork shank in a continuous freezing tunnel. The influence of the use of secondary packaging and the change in the supply method from horizontal to vertical in the freezing of pork shank was evaluated. This resulted in a reduction of 3.5 h in the retention time of the product to meet the critical freezing temperature of -18°C, and a 0.5% reduction in the percentage of reprocess. The temperature variation between the freezing levels was also evaluated, using the statistical process control tool. The temperature of the different freezing levels was monitored, and it was verified that the variations were caused by the defrosting process, due to mechanical problems in the ventilation system. With this work was possible to promote improvements in the freezing system to meet the critical temperature and to reduce the percentage of reprocessing of products.
Key words
critical temperature; packaging; pork shank; reprocess
INTRODUCTION
Pork is the most consumed meat in the world, representing 40.4% of all animal protein consumption (Travassos & Coelho 2017). Brazil has been standing out in the production of this meat, where in 2020 it reached the fourth position in the world (USDA 2021). Exports of pork cuts have also been increasing, where from January to April 2021 they reached a level of 351.8 thousand tons, representing an increase of 25.3% compared to 2020 in the same period, reaching revenue of US$ 232.3 million according to the Brazilian Association of Animal Protein (ABPA 2021). In addition, sales have also stood out in the domestic market, reaching 17.65 kilos per capita according to the Brazilian Association of Swine Breeders (ABCS 2021).
In the case of pork meat for export, it needs to be frozen to keep the chemical, organoleptic and nutritional characteristics of the product as close as possible to the initial characteristics, in addition to hindering the action of microorganisms and enzymes. The pork cuts most exported by Brazil are: shank, shoulder, belly, ribs, rack, loin, shoulder and fillet.
Freezing is a meat preservation method in which low temperatures destroy some microorganisms and prevent the growth of others, thus allowing a high quality product to be obtained, even after a long period of storage. This process involves expenditure of energy and time.
For export products such as pork, the recommended temperature for storage is -18°C (Brazil 2004), because at this temperature about 85% of the water in the product is already frozen, reducing the growth of microorganisms, the speed of chemical and enzymatic reactions (Freitas & Figueiredo 2000).
According to data that point to an increase in exports (ABCS 2021), slaughterhouses also had to adapt to this high demand, from infrastructure to labor. As the freezing process takes time, especially in larger pieces of meat, there is a need to study ways to carry out the process more quickly and efficiently so that the final product reaches the desired temperature in the shortest possible time.
In slaughterhouses, freezing is usually carried out in tunnels, with products already packaged to facilitate handling and storage, at temperatures from -35°C to -40°C, as recommended by Ordinance No. 711, of November 1, 1995 (Brazil 1995), in addition to ensuring that during the retention time the products reach a temperature in the thermal center of – 18°C (American Society of Heating 1998, Evangelista 1989, Pardi et al. 2001).
Products that do not meet the critical temperature of -18°C, during the retention time must return to the process (reprocessing), which ends up interfering with the time and useful space in the tunnel, reducing the freezing capacity, causing unnecessary increases in energy costs and impact on the final quality of the product. In this sense, the present work aims to evaluate strategies to reduce the retention time of pork shank in an industrial continuous freezing tunnel, aiming to minimize the reprocessing of products.
MATERIALS AND METHODS
Samples and packaging
Samples of pork shank with a maximum percentage of 10% of superficial fat, weighing approximately 10 kg were used to evaluate the retention time in an industrial continuous freezing tunnel. Each piece was individually packaged using low-density polyethylene (LDPE) primary packaging, with dimensions of 600 mm in length, 600 mm in width and 0.05 mm in thickness. After receiving the primary packaging, all parts were packaged in a single low-density polyethylene (LDPE) package, with dimensions of 850 mm in length, 550 mm in width and 0.10 mm in thickness, consisting of the secondary packaging. Finally, these were packed in corrugated cardboard boxes (tertiary packaging), wave C (3.6/3.7 mm, 13 to 15 waves/10 cm), dimensions 570 mm long, 378 mm wide, 160 mm high and 3 cm thick, with automatic assembly performed by a double machine for gluing and assembling boxes (Model TF I, Plasmetal), with capacity for 4,200 boxes/hour, containing two pieces and variable net weight from 18 to 22 Kg. boxes with shank were placed in a continuous freezing tunnel without the lid, for greater heat transfer between the air in the tunnel and the product.
Characteristics of the freezing tunnel
The industrial continuous freezing tunnel is composed of 32 product distribution levels, of which 1 is for return. Each level is made up of 13 trays measuring 3,685 m long and 1,260 m wide, made of galvanized steel sheets. Each tray has a capacity for 32 boxes, totaling 12,896 boxes for freezing (Fig. 1a).

Scheme demonstrating the levels and trays (a) and representation of the supply of trays in the continuous freezing tunnel (b).
The tunnel consists of 5 ventilation blocks containing 15 fans, with a power of 15 hp, voltage of 380/660 V and 1,175 rpm, with a propeller diameter of 106 mm, located on the wall opposite the product entrance. The mean cold air inlet temperature in the tunnel is -40°C and outlet temperature -30°C. The products enter the tunnel through conveyors in a horizontal direction, countercurrent to the cold air flow (Fig. 1b).
Methods for shank samples supplying in freezing tunnel
The supply of trays is made of two ways, horizontally and vertically, and monitored by Factory Talk View SE Client Software – FTView, Johnson Controls (Johnson 2014). In horizontal supply, the boxes reach the tunnel entrance through rolling routes, where a mechanical arm pushes 32 boxes onto the entrance elevator tray, then the tunnel operator directs the elevator to the level that will be used, the tray is implemented in the level, which causes the other trays to be pushed in the direction of ventilation, the procedure is repeated until the entire level is complete. After filling, the tray is colored red in the Factory Talk View SE Client Software – FTView, Johnson Controls, and when the maintained time is reached, the tray is colored white (Johnson 2014).
When meeting the box retention time, the operator directs an empty tray at the entrance to the level that will be unloaded, which means that the tray that is closest to ventilation is positioned on the exit elevator. The elevator will direct the tray to the first level (return level), causing the tray at the end of this level to be positioned on the input elevator, which will move to the output conveyor and unload the boxes, the procedure is repeated until the entire level is empty. Refueling will be carried out at this level, which is already empty.
With this supply model, the first tray filled at the level will remain during the entire retention time in the position closest to the fans (position of greatest thermal exchange), while the last tray will be at the point furthest from the fans (position with lower thermal exchange), in this case it will only move to the position closest to the ventilation during unloading, which may impact the product’s critical temperature.
When supplying vertically, the boxes reach the tunnel entrance via conveyor belts, where a mechanical arm pushes 32 boxes onto the entrance elevator tray, and the elevator automatically moves to the level that will be filled. The tray is introduced level, causing the other trays that are already filled to be pushed towards the ventilation. This causes the tray closest to the ventilation to be positioned over the exit elevator. The elevator will direct this tray to the first level (return level), causing the tray at the end of this level to be positioned on the input elevator, which will move to the output conveyor and unload the boxes.
The inlet elevator then repeats the loading procedure and positions the tray at the inlet of the next freezing level. In this model, the tray will be in the position furthest from the fans, only while the other levels are filled. As a result, the box retention time is no longer a pre-defined value, but will be determined by the number of trays that will be fed, as the greater the production volume, the faster the trays are filled and reach the storage position. unloading. In this model, the color of the tray will change to white after 23 hours of freezing.
With this supply model, the freezing procedure begins with the box in the position furthest from the fans (point of lowest thermal exchange) and ends at the point closest to the fans (point of greatest thermal exchange), favoring the critical temperature of the product be met in a shorter retention time.
Monitoring the freezing temperature of pork shanks in relation to packaging and tunnel supply methods
To evaluate the influence of secondary packaging during the freezing of pork shanks, the temperature of products packaged only in primary packaging (individual packages) and with primary packaging and secondary packaging was monitored, both of which were packaged in corrugated cardboard boxes (tertiary packaging).
After programming the Datapaq® Food Tracker® probe, model TB 5016, it was inserted into the center of one of the pieces and positioned at the bottom of the box. The boxes were loaded simultaneously using a conveyor belt, using the horizontal method, placed on a tray at the point furthest from the fans, the point of lowest thermal exchange, at freezing level 21 (Fig. 1a).
Subsequently, the box loading procedure was changed to vertical and the boxes with the pieces packaged with both primary and secondary packaging were loaded simultaneously using a conveyor belt, during the retention time there was movement of the boxes within the level.
The freezing temperature inside the tunnel of pork leg samples packaged with both primary and secondary packaging and in designated cardboard boxes was also monitored to check whether they reached the critical temperature (-18°C). If the products did not reach the critical temperature, they would be sent back to the freezing process (reprocessing), which could result in a reduction in the tunnel’s freezing capacity.
Temperature monitoring at different levels within the freezing tunnel
To evaluate the temperature at different levels within the freezing tunnel, 7 Datapaq® probes were used (Food Tracker®, model TB 501), which were positioned at levels 1, 7, 13, 18, 23, 28 and 31 (Fig. 2), at the place where products are loaded (at the furthest point from the ventilation blocks). Datapaq programming and data recording were carried out with the help of the Food Tracker In-sight program, version 8. The measurement interval was 10 minutes between each reading.

Monitoring the temperature of the freezing tunnel, at different levels, was carried out over a period of 54 h with and without the defrosting stage in the evaporation blocks. Defrosting was carried out in the first 6 h of testing, using superheated steam originating from the compressor discharge to melt the ice in the coil, followed by circulation with running water at room temperature (±20°C), and during the last 5 minutes of defrosting, steam and water are used simultaneously. This defrosting procedure is carried out once a week, as it removes the ice formed by humidity in the air, on the evaporation blocks and trays.
Based on the analysis of the tunnel’s defrosting temperature data, the ventilation system was monitored to identify faults and propose improvements.
Statistical analysis
The data were evaluated using 6 samples of pork shank (temperature in the freezing tunnel at levels 01, 07, 13, 18, 23, 28 and 31) using 𝑋̅ (mean) and R (amplitude), which are the most used and should be used simultaneously, as they complement each other. The graph (mean temperature) controls the variability at the mean level of the process and its changes and the R the amplitude of data variation, which demonstrates the dispersion of the process that generates variability. From the values of 𝑋̅ and R, the control limits of the means were calculated, considering the extension of 3 standard deviations (±3σ) for each side of the means, which, according to the normal distribution, covers 99.73% of the values of the sample means. Microsoft Excel 2010 software, 14.0.4760.1000, was used to calculate the control limits.
RESULTS
Influence of packaging and tunnel supply method on pork shank freezing temperature
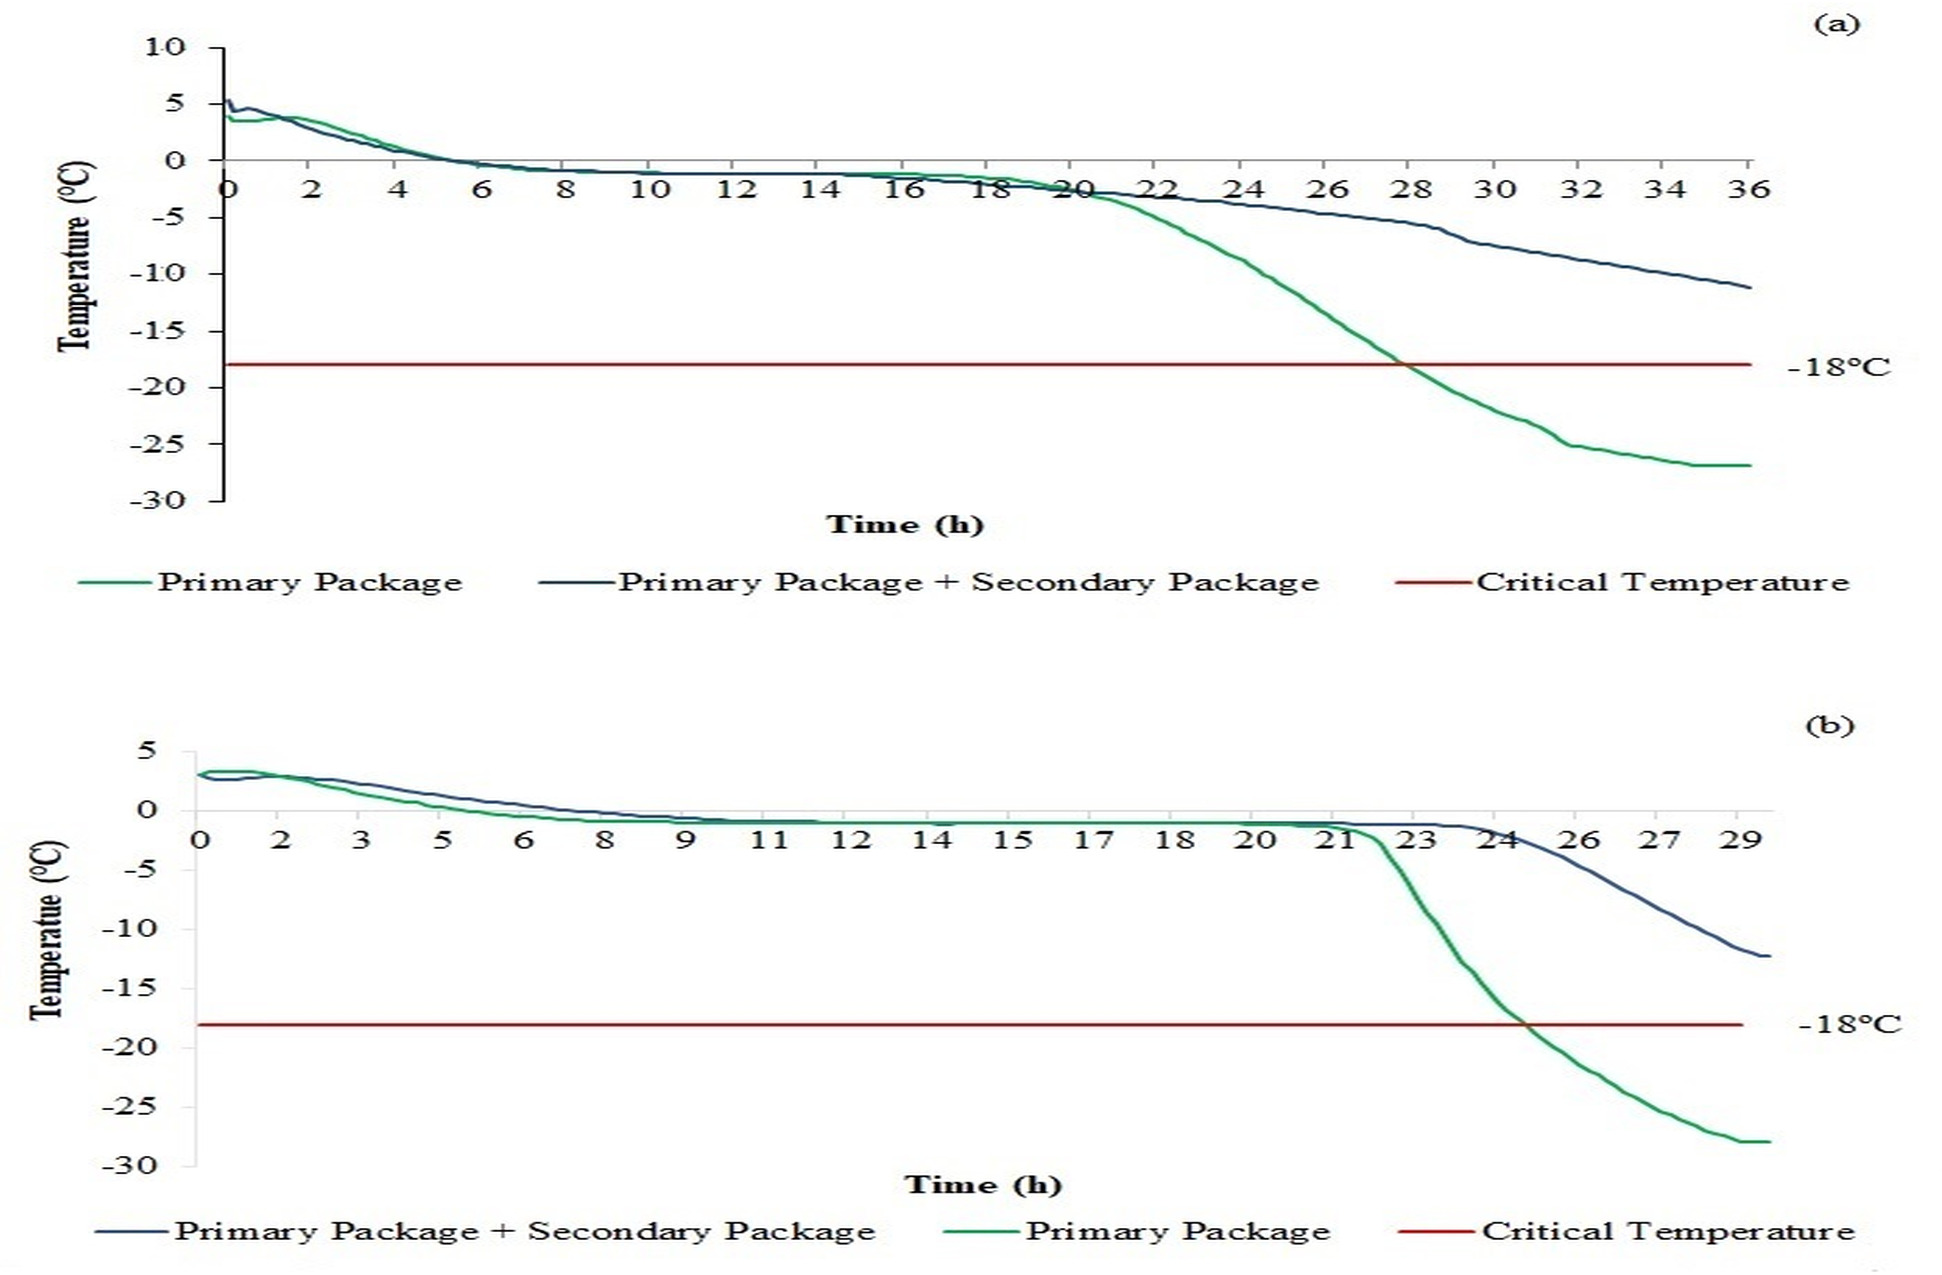
Fig. 3 shows the freezing curve of pork shank samples packaged in individual packaging (primary packaging) and with both primary and secondary packaging with horizontal supply (Fig. 3a) and with vertical supply (Fig. 3b). All samples were placed in corrugated cardboard boxes and placed inside the freezing tunnel.

Freezing curves for pork shank packaged in primary packaging, with both primary and secondary packaging arranged in the tunnel in a location with lower thermal exchange, with horizontal (a) and vertical (b) supply.
In horizontal supply, (Fig. 3a) during the retention time, at the point of lowest thermal exchange, the boxes with shanks packed in primary packaging met the critical temperature of -18°C after approximately 27 h of freezing. However, products packaged with both primary and secondary packaging, even after 36 h of freezing, were unable to reach the critical temperature of -18°C, not meeting the requirements specified by Resolution No. 216 (Brazil 2004), which states that to minimize the risk of cross-contamination, frozen food must be stored at a temperature equal to or below -18°C.
After 36 h of freezing, the shanks packaged in primary packaging reached a temperature of -26.8°C, according to International Institute of Refrigeration- IIR (International Institute of Refrigeration 2006), around 88% of the water present in the food is already frozen at a temperature of -30°C, which reduces the growth of microorganisms as well as the speed of chemical and enzymatic reactions. At this temperature the water activity is reduced, close to 0.60, where the growth of microorganisms is prevented in water activities between 0.6 – 0.7, below 0.60 the growth of microorganisms hardly occurs, from 0.65 onwards, the proliferation of some specific microorganisms begins, and up to 0.75 only some halophytic bacteria, yeasts and xerophilic fungi can develop.
Influence of the use of cardboard box packaging and the method of supply on the freezing temperature of pork shank
Fig. 4 shows the freezing curves of pork shank samples packed in primary packaging and in cardboard boxes with vertical and horizontal supply. The change in the supply procedure from horizontal to vertical resulted in a reduction of 3.5 hour in the time required to reach the critical temperature of -18°C, resulting in a 12.5% gain in freezing time, and a reduction of 0.5 h in the freezing time in the critical zone (0° to -5°C), with a probable reduction in the size of the ice crystals formed and the conservation of the integrity of the muscle tissue, which can reduce water loss due to exudation, maintaining the final quality of the product (Zhu et al. 2022).

Freezing curve for pork shank packed in primary packaging and in cardboard boxes with vertical and horizontal supply.
This reduction in freezing time can be directly correlated with energy consumption, as it results in shorter operating periods for refrigeration systems while processing the same product volume, thereby potentially reducing overall energy usage. Additionally, the vertical supply method decreased the percentage of products that failed to reach the critical temperature and required reprocessing, thereby minimizing rework and further energy expenditure.
After 29 h of retention, the difference between horizontal and vertical supply is around 7.6°C. Reaching a temperature of -27.9°C, when supplied in the freezing tunnel using the vertical method, a temperature close to -30°C at which the growth of microorganisms is reduced, as is the speed of chemical and enzymatic reactions.
As freezing tunnels use forced air circulation, using low temperatures (-35 to -45°C) and air speed (3 to 8 m/s), the position closest to the ventilation system favors transfer of convection heat. The vertical supply method is favored, as the tray moves towards the ventilation system during the retention time, remaining only for a short period of time at the furthest point from the ventilation system.
In addition to the improvements provided by vertical delivery, the efficiency of heat transfer during freezing is directly associated with the type of packaging used. Removing the secondary packaging made of low-density polyethylene, which is thicker and more continuous, significantly reduced the thermal resistance around the piece, facilitating the conduction of cold to the thermal center of the product. At the same time, the vertical configuration favored a better distribution of the heat flow inside the tunnel, as the boxes gradually move towards the region of greater ventilation, remaining longer in zones of more intense convection. This combination of a lower barrier to thermal conduction (due to the simplified packaging) and better exposure to forced cold air (due to the movement in the vertical configuration) promoted a significant reduction in the time required to reach the critical temperature of -18°C, optimizing the freezing process and the final quality of the product.
In horizontal filling, the last tray of the level remains in the position close to the fans only while the level is discharged, about a few minutes, spending most of the retention time in the position furthest from the fans, at this point the air flow it needs to overcome all the barriers formed by the products present in the other trays, which makes it the point of lowest thermal exchange and thus makes it difficult to meet the product’s critical temperature.
The percentage of boxes of shanks that did not reach a critical temperature of -18°C and were destined for reprocessing was evaluated at the exit of the tunnel over a period of 6 months, in relation to the total number of boxes frozen in the agroindustry. In the 6-month period, in which the boxes with shanks were packed with both primary and secondary packaging and supplied using the horizontal method, the mean number of boxes that returned to the freezing process was 1,192 boxes/month, impacting the percentage of reprocessing 0.47% in relation to the total number of boxes frozen by the agroindustry. Subsequently, there was a change in the shank packaging standard, with the shank pieces being packaged only in primary packaging, during this period the number of boxes that returned to the process was only 109 boxes/month, which resulted in a reduction of 0.43% in the percentage of boxes of shanks sent for reprocessing, which is equivalent to a reduction of approximately 1,083 boxes per month.
Next, the boxes of shanks were filled in the freezing tunnel using the horizontal method and the pieces were packaged only with the primary packaging, and the mean number of boxes in this period that returned to the freezing process was 109 boxes/month, impacting a percentage reprocessing rate of 0.04%. Subsequently, the method of supplying the boxes was changed to vertical, obtaining only 24 boxes/month that returned to the freezing process, reducing the reprocessing to just 0.01%, resulting in a reduction of approximately 85 boxes per month, equivalent to a reduction 0.03% reprocessing.
Monitoring temperatures at tunnel freezing levels
Fig. 5 shows the temperature values inside the freezing tunnel with defrosting in the evaporation blocks (a), and without the defrosting stage (b) at levels 01, 07, 13, 18, 23, 28 and 31, during 54 h. After 6 h of monitoring, there was an increase in the temperature of all levels, and during defrosting process period was carried out in the tunnel’s evaporation blocks, which explains this increase in temperature. During the defrosting procedure in which there is no forced convection, the ambient temperature reached 2°C at level 31, while at level 01 the temperature reached -9.6°C, a difference of 11.6°C (Fig. 5a). During the thaw, only natural convection is acting, where the air, when heated, suffers a reduction in density and thus tends to rise, while colder air comes to take its place, which explains the temperature difference between the highest and lowest level of the tunnel.

Temperature values inside the freezing tunnel with defrosting in the evaporation blocks (a), and without the defrosting stage (b) at levels 01, 07, 13, 18, 23, 28 and 31, during 54 h.
Although defrosting is a fundamental procedure for the efficiency of the process, it causes temperature fluctuations, which can cause water recrystallization and the formation of water crystals on the surface of the product, which will consequently alter the quality of the meat, drying it out. its surface, compromising the color, flavor and texture, in addition to causing weight loss.
Based on the results, it was decided to evaluate these data during the normal freezing process, in this case, disregarding the stage of defrosting the evaporation blocks of the continuous tunnel (Fig. 5b). Thus, the highest temperature recorded was -20.5°C at level 23, while at level 01 it was -29.9°C, a difference of 9.4°C between the levels evaluated, with a temperature variation of 15.5 and 10.0°C.
Table I presents the maximum, minimum and mean temperatures obtained in the freezing tunnel with defrosting and without the defrosting stage, at levels 01, 07, 13, 18, 23, 28 and 31. It can be seen that the greatest temperature variation (41.6°C) occurred at level 31, considering the defrosting process, which is mainly impacted by the high temperature during the defrosting procedure, while level 01 presented the smallest variation (30.2°C), as it is located in a region where melting has less interference.
Maximum, minimum and mean temperatures obtained in the freezing tunnel with and without defrosting in the evaporation blocks at levels 01, 07, 13, 18, 23, 28 and 31.
Disregarding melting, it is clear that all levels have similar temperature variations of 9.9 to 13.3°C, except level 23, with a variation of 15.5°C. This difference demonstrates the presence of preferential air flow channels. It is also clear that the mean temperatures of the central levels are below that stipulated by Ordinance No. 711 of November 1, 1995 (Brazil 1995), which establishes that quick freezing tunnels must operate between -35°C to -40°C.
To analyze the variability of the tunnel temperature during the freezing time of the products, graphs of mean temperature (X mean) and mean temperature range (R) were created, which present the upper (LCS) and lower (LCI) control limits of the process, obtained from the sample mean and the range of temperature monitoring data without the defrosting process at levels 01, 07, 13, 18, 23, 28 and 31 (Fig. S1).
Analyzing Fig. S1a, for which the tunnel temperature was monitored without defrosting, there are points below the lower control limit (LCI), of the process (-35°C) and above the upper control limit (LCS), -30°C, as well as within the range of -30 to -35°C is observed, demonstrating that the process is not stable over the evaluated time and is outside the statistical limit (±3σ), making it necessary to investigate other patterns of non-randomness in the data and indicating that there are special causes generating variability.
Regarding the amplitude (Fig. S1b), without the defrosting stage, it can be seen that around 50 h there was a point above the upper limit. The cause of this variation can be attributed to a mechanical problem in the ventilation blocks in the central region of the tunnel, which directly impacted the thermal exchange within the tunnel, mainly at levels 13, 18 and 23, as can also be assessed in Fig. 5.
These results indicate the need to implement corrective actions to minimize this temperature variation, thus, a general analysis of the operation of the fans was carried out, where it was identified that the central ventilation block of the tunnel was damaged, this was replaced, and a sensor was installed, which emits a light signal to identify/report faults in the ventilation system, a spare fan was also purchased to replace in case of faults and an increase in the unit’s energy demand was requested, in order to reduce variations during peak hours.
After implementing the improvement actions (replacing damaged equipment, installing the sensor, purchasing a backup fan and requesting an increase in energy demand), the temperature of the freezing tunnel was again monitored, with the probes once again positioned at the levels 01, 07, 13, 18, 23, 28 and 31, during the 54 h. However, during the experiment, the probe positioned at level 31 was damaged during the retention time and the data was disregarded. Fig. 6 shows the temperature in the freezing tunnel at levels 01, 07, 13, 18, 23 and 28, for 54 h, after the implementation of the improvements, and with the defrosting stage.

Temperature in the freezing tunnel at levels 01, 07, 13, 18, 23 and 28, for 54 h, after implementing the improvement actions with defrosting (a) and without defrosting (b).
When considering the normal operating operation of the tunnel, without the de-icing procedure, less dispersion of the temperature data is noticed in relation to the tunnel temperature after the implementation of the improvements (Fig. 6b).
After 11 h of datalogger activation, the temperature in the tunnel reached 3.5°C at level 28, while at level 01 the temperature reached -18°C, a difference of 20°C, an increase due to the injection of hot gas in the evaporation block, to carry out the defrosting procedure.
Although the defrosting process is fundamental to the efficiency of the freezing system, fluctuations in the ambient temperature of the tunnel during this process can favor partial defrosting of the product and thus the formation of ice crystals on the surface, which can cause burning at the surface cold, drying out its surface, compromising the color, flavor and texture of the product and even causing weight loss, negatively impacting the quality of the product.
Throughout the entire monitoring period, the lowest temperature recorded was -42.8°C at level 01. Level 18 exhibited the highest minimum temperature of -38.9°C, resulting in a temperature variation of 30.9°C. The mean temperature at level 01 was -36.1°C, while at level 18, it was -29.2°C, indicating a temperature difference of 6.9°C between the two levels (Table II).
Maximum, minimum and mean temperatures obtained in the freezing tunnel at levels 01, 07, 13, 18, 23 and 28 after the implementation of improvement actions with and without the defrosting stage.
During the temperature monitoring period, following the implementation of improvements and excluding defrosting, the recorded maximum temperatures varied from -29.8°C to -32.2°C, indicating a difference of only 2.4°C between the evaluated levels, as shown in Table II. The mean temperatures obtained between the levels varied from -35.1 to -38.5°C, in accordance with what is recommended by Ordinance No. 711 of November 1, 1995 (Brazil 1995), which establishes that quick freezing tunnels must operate between -35°C to -40°C, which demonstrates that the adjustments made provided better temperature uniformity between levels.
After implementing the improvement actions in the continuous freezing tunnel, statistical control of the process data was carried out again, evaluating the upper (LCS) and lower (LCI) control limits and the mean temperature (X mean) and mean amplitude temperature (R) graphs were created, presented in Fig. S2, without considering the defrosting process.
Analyzing Fig. S2a, there are points below the lower control limit (LCI), of the process (-37.7°C) and above the upper control limit (LCS), -35.5° C, as well as, within the range of -35.5 to -37.7°C it is clear that despite the adjustments made to the process, several points remain below the lower control limit (LCI) of the process, as well as other points are outside the upper control limit (LCS), showing that the process remains unstable over time, remaining with several special causes. This demonstrates that it is necessary to carry out further actions aimed at these causes, until the process becomes stable and predictable. Points above the upper control limit demonstrate that actions are necessary to correct these causes, while points below the lower control limit demonstrate that there has been an improvement in the process and that it must be standardized.
Despite presenting points outside the control limits, most of these points are within the limits specified by Ordinance No. 711 of November 1, 1995 (Brazil 1995), which establishes that quick freezing tunnels must operate between - 35°C to -40°C.
It is also possible to notice that the mean temperature of the tunnel is high as the products are supplied/removed, mainly due to the removal of the thermal load present in the products during the freezing process. To keep all points within the control limits, it would be necessary to increase the energy efficiency of the equipment, which would cause an increase in the system’s energy consumption.
DISCUSSION
Influence of packaging and tunnel supply method on pork shank freezing temperature
Products packaged with both primary and secondary packaging, after the retention time, reached a temperature of -11°C, at this temperature the product is already considered frozen and around 79% of the water is already frozen (American Society of Heating 1989). Although most microorganisms do not develop at temperatures below -10°C, this condition can favor the speed of chemical and enzymatic reactions, reducing the shelf life of the product when compared to the test in which the shanks were packaged only in primary packaging.
It is also possible to notice that for products with both primary and secondary packaging, the freezing time in the critical zone (0°C to -5°C) was approximately 5 h (22.5%) longer than for products packaged with primary packaging. According to Reno et al. (2011), this can favor the formation of large crystals inside cells and in intercellular spaces, which can cause the rupture of the cellular structure, causing irreversible changes and increasing water loss through exudation.
It can be seen in Fig. 3b that the boxes with shank packed in individual packages reached the critical temperature of -18°C after 24 h and 30 min. As for samples packed with both primary and secondary packaging, even after 29 h of freezing it was not possible to reach the critical temperature of -18°C, not meeting the requirements specified by Resolution No 216 (Brazil 2004).
In this supply method, the retention time of the boxes in the tunnel is no longer a pre-defined value but depends on the supply flow of the trays. With the change in the way of filling the boxes, the retention time was reduced from 36 h to 29 h, resulting in a total reduction of 7 h in the freezing process. Reducing the retention time of products, as long as they reach the critical freezing temperature, is crucial for increasing the system’s capacity.
After 29 h of freezing, the shanks packaged in primary packaging reached a temperature of -27.9°C, close to -30°C, where around 88% of the water present in the food is already frozen (International Institute of Refrigeration 2006), at this temperature the growth of microorganisms is reduced, as is the speed of chemical and enzymatic reactions.
The products packaged in with both primary and secondary packaging reached a temperature of -12.20°C, after the retention time, at this temperature around 20% of the water is not frozen, although the majority of microorganisms do not develop at temperatures below - 10°C, this condition can favor the speed of chemical and enzymatic reactions, reducing the shelf life of the product when compared to the test in which the shanks were only packaged in individual packaging.
It is also possible to notice that for products packaged with both primary and secondary packaging, the freezing time in the critical zone (0 to -5°C) was 1.5 h (8%) longer than for individually packaged products, which it can favor the formation of large crystals inside cells and in intercellular spaces, which can cause disruption of the cellular structure.
Analyzing Fig. 3a and b, it can be seen that in both experiments, regardless of whether the box was positioned at the point of lowest thermal exchange or whether there was movement at the level, the retention time was not sufficient to meet the critical temperature of the product for the boxes with shanks packed with both primary and secondary packaging. The result can be explained by the use of low-density polyethylene secondary packaging (single package), which is 0.10 mm thick, twice as thick as the thickness of the primary packaging, which increases transfer resistance of conductive heat, as to reach the thermal center of the piece it is necessary to overcome the resistance of the single package, the resistance of the primary packaging, the resistance linked to the surface fat of the piece and the resistance of the meat of the product. Furthermore, the use of primary packaging can favor the presence of air pockets inside the packaging, these air pockets can act as a thermal insulator, making heat transfer difficult (Resende et al. 2003).
The thermal conductivity of shank pieces can be altered by the composition of the tissue and mainly by the surface fat of each piece, as according to (American Society of Heating 1989), the conductivity of pork fat at -15°C is low, around 0.218 W/m.K, This factor can make heat transfer by conduction even more difficult, especially in parts with a high percentage of fat. The percentage of surface fat on the pieces during production is assessed visually, which may affect the total freezing time of the products. Although surface fat interferes with the freezing time of the pieces, it is essential for providing organoleptic characteristics to the meat, directly impacting palatability and also serves as a protective layer that prevents cold burning during the freezing process.
Furthermore, the thermal conductivity of primary and secondary LDPE packaging is low (Rezgar et al. 2019), which makes heat transfer difficult and favors the slow formation of ice crystals when using conventional freezing techniques.
The use of a cardboard box also makes heat transfer difficult, mainly because it is made up of multilayers, with the center layer having a wavy shape, which means that the sheets are spaced apart, giving space for air, this condition provides more an obstacle to heat transfer by conduction in the wall thickness and can also act as a thermal insulator (Nasser Eddine et al. 2022).
The use of a cardboard box also makes heat transfer difficult, mainly because it is made up of multilayers, with the center layer having a wavy shape, which means that the sheets are spaced apart, giving space for air, this condition provides more an obstacle to heat transfer by conduction in the wall thickness and can also act as a thermal insulator.
Santos (2005) and Delavechia (2017), obtained a reduction of up to 45 and 74% respectively in the freezing time of meat products when frozen in screened stainless steel and HDPE boxes compared to the use of cardboard boxes, which demonstrates the influence of the resistance offered by the cardboard packaging to heat transfer.
The products, when subjected to the freezing process only using individual packages (primary LDPE packaging), remained with their appearance unchanged, without superficial drying, cold burning, or superficial sublimation, maintaining the quality expected by the product, proving to be a viable option for freezing pork shanks.
The industrial freezing process can be very complicated, mainly because the product studied has a very complex structure, with irregular shape and size, making it difficult to achieve homogeneity in the product’s temperature, in addition to the possibility of the existence of a vacuum, air pockets inside the product and packaging. Furthermore, convective heat transfer coefficients can vary according to the position of the product inside the tunnel and the use of different types of packaging. Due to the possibility of all these interferences, the retention time in the industry must always be longer than necessary, taking into account a safety margin, in order to ensure that the critical temperature at the end of freezing is met.
Through these experiments, it was possible to change the item’s packaging specification, where the use of secondary low-density polyethylene packaging (single package) was removed and only the use of low-density polyethylene packaging (primary packaging) was standardized.
Influence of the use of cardboard box packaging and the method of supply on the freezing temperature of pork shank
The results demonstrate that the change in the packaging standard and the supply of boxes helped to reduce 0.46% in the number of boxes destined for reprocessing, with 0.43% referring to the change in the shank packaging standard for the use of only of individual packaging and 0.03% referring to vertical supply.
Although the result found appears to be small compared to the total number of frozen boxes in the agribusiness, the reduction in the number of boxes sent for reprocessing has a crucial effect on the quality of the final product. During the period of time in which the box is removed from the tunnel and sent back for freezing, fluctuations in temperature may occur, which may favor partial defrosting of the product and thus the formation of ice crystals on the surface, causing the The surface becomes dry and also freezing for a long period can cause denaturation of proteins, as the ice crystals redistribute and change the concentration of solutes in the muscle fibers, negatively impacting the quality of the product.
To optimize processes, it is crucial that companies concentrate efforts to eliminate any type of reprocessing and/or rework, as reprocessing also demonstrates the inefficiency of the system, causes operational wear and tear, and ends up interfering with the time and useful space in the tunnel, reducing the freezing capacity and causing unnecessary increases in costs.
The removal of secondary packaging promoted a reduction of around 91% in the percentage of boxes of shanks that returned to the process, enabling the critical temperature to be reached during the retention time of the samples in the freezing tunnel. The change in the supply method from horizontal to vertical helped to make the reduction in the percentage of reprocessing even more significant, as it reduced around 78% of the reprocessing of boxes of shanks packed in individual packaging. These changes were essential for improving the freezing process and helped maintain the final quality of the product.
Zhu et al. (2022), investigated the effects of different rapid freezing methods, such as liquid nitrogen spray freezing at -80°C (LNF), refrigerator freezing at -80°C (RF), and micro-freezing at -30°C (MF), on the quality of freshwater fish during storage at -18°C for 14 days. The results indicated that LNF and MF were effective in reducing the total freezing time and maintaining more homogeneous muscle structures with smaller and more regular ice crystals. In addition, LNF treatment showed improved water retention capacity and textural characteristics, significantly delaying the changes in immobilized water content. In contrast, the present study focuses on optimizing the freezing process by reorganizing the supply in the freezing tunnel, specifically comparing the vertical and horizontal supply methods. This practical and easy-to-implement approach resulted in a significant reduction in the time required to reach -18°C, as well as improving thermal uniformity and reducing the need for product reprocessing.
Monitoring temperatures at tunnel freezing levels
Freezing food industrially is an extremely complex process, mainly due to the large number of variables involved. The efficiency of the process can be impacted by the format and chemical composition of the products, the uniformity of the initial temperature and quantity of products to be frozen, human errors, mechanical problems in the equipment, as well as external factors, such as power peaks.
In relation to amplitude (Fig. S2b), it appears that all points are within the control limits (±3σ), proving that the adjustments made improved the uniformity of temperature between levels. These actions were also fundamental in enabling service the high demand for the sale of pork, bringing significant monetary results to the company and above all, ensuring the quality of the final product, which has a positive impact on customer satisfaction and compliance with legislation.
The improvement actions were essential to meet the high demand for pork sales, bringing significant monetary results to the company and, above all, ensuring the quality of the final product, which has a positive impact on customer satisfaction and compliance with legislation.
CONCLUSIONS
The use of secondary packaging in pork shank samples previously packaged in primary packaging increases resistance to heat transfer, making the retention time insufficient to freeze the product. Using only the primary packaging and changing the position of the shank box within the level resulted in a reduction of 3.5 hour in meeting the critical temperature of -18°C.
Corrective and preventive actions in ventilation equipment promoted improvements in temperature uniformity between freezing levels, which represented a reduction in the maximum temperature difference obtained between levels from 9.4°C to just 2.4°C.
All the strategies tested and implemented in this present work, such as changing the packaging pattern, changing the method of filling the boxes in the continuous tunnel, improving the ventilation system and optimizing the freezing positions, helped to reduce the freezing time of the shanks and consequently the retention time of the product in the tunnel and the percentage of reprocessing of all cuts produced by the agroindustry.
Thus, the results obtained with pork cuts, especially in relation to vertical supply, reveal significant potential for application in other meat production lines, such as beef and poultry, as long as the physical and thermal characteristics of each product are respected. The reduction in retention time and the increase in thermal efficiency observed in the freezing tunnel can be scaled up to higher capacity systems, contributing to energy savings, increased productivity and reduced reprocessing in several manufacturing units.
Data availability
Data will be made available on request.
Acknowledgements
This study was financed in part by the Conselho Nacional de Desenvolvimento Científico e Tecnológico (CNPq, Brazil), Coordenação de Aperfeiçoamento de Pessoal de Nível Superior (CAPES, Brazil) – Finance Code 001 and Research Support Foundation of the State of Rio Grande of Sul – Brazil (FAPERGS).
References
- ABCS. 2021. Brasileiros tem aumentado o consumo per capita de carne suína. Associação Brasileira dos Criadores de Suínos.
- ABPA. 2021. Perfil de Consumo e Panorama do Setor de Proteínas no Brasil. Associação Brasileira de Proteína Animal.
- AMERICAN SOCIETY OF HEATING R. 1989. Thermal Properties of Foods - Handbook, Atlanta.
- AMERICAN SOCIETY OF HEATING R. 1998. 1998 ASHRAE handbook : refrigeration, Inch-Pound ed., Atlanta, GA SE - 1 volume (various pagings) : illustrations ; 29 cm: American Society of Heating, Refrigeration and Air-Conditioning Engineers Atlanta, GA.
- BRAZIL. 1995. Ministério da Agricultura, Pecuária e Abastecimento. Portaria no 711, de 1 de novembro de 1995. Normas técnicas de instalações e equipamentos para abate e industrialização de suínos. Diário Oficial da República Federativa do Brasil, Brasília, DF, 3 nov. 1.
- BRAZIL. 2004. Agência Nacional de Vigilância Sanitária (Anvisa). Resolução de Diretoria Colegiada n° 216, de 15 de setembro de 2004. Dispõe sobre Regulamento Técnico de Boas Práticas para Serviços de Alimentação.
- DELAVECHIA AL. 2017. Otimização do desempenho de congelamento de produtos refrigerados em túneis contínuos. Trabalhos de Conclusão de Curso, UFSM. (Unpublished).
- EVANGELISTA J. 1989. Tecnologia de Alimentos, 2a ed ed., Rio de Janeiro / RJ: Atheneu.
- FREITAS AC & FIGUEIREDO P. 2000. Conservação de Alimentos, Lisboa - PT, 203 p.
- INTERNATIONAL INSTITUTE OF REFRIGERATION. 2006. Recomendation for chilled storage of perishable produce. Iif-iir - Fr.
- JOHNSON C. 2014. Technical operating manual York Variable Retention Tunnel - MRT.
- NASSER EDDINE A, DURET S & MOUREH J. 2022. Interactions between Package design, airflow, heat and mass transfer, and logistics in cold chain facilities for horticultural products. Energies 15: 8659.
- PARDI MC, SANTOS IF, SOUZA ER & PARDI HR. 2001. Ciência, Higiene e Tecnologia da Carne, 2a ed., UFG, 624 p.
- RENO MJ, PRADO MET & RESENDE JV de. 2011. Microstructural changes of frozen strawberries submitted to pre-treatments with additives and vacuum impregnation. Ciência e Tecnol Aliment 31: 247-256.
- RESENDE JV, SILVEIRA JUNIOR V & NEVES FILHO L. 2003. Experimental measures of the effective heat transfer coefficients in air blast freezers for the processing of fruit pulps. Rev Eng Térmica 2: 11.
- REZGAR H, TAHER A, ALI D & RICHARD EL. 2019. Thermal conductivity of low density polyethylene foams part I: comprehensive study of theoretical models. J Therm Sci 28: 745-754.
- SANTOS CÁ. 2005. Estudo da transferência de calor durante o congelamento de cortes de aves em caixas de papelão ondulado. Dissertação (Mestrado) - Universidade Federal de Santa Catarina, Centro Tecnológico. Programa de Pós-graduação em Engenharia de Alimentos. (Unpublished).
- TRAVASSOS GF & COELHO AB. 2017. Padrão de substituição entre carnes no consumo domiciliar do Brasil. Rev Econ e Sociol Rural 55: 285-304.
- USDA. 2021. Pork Prodution. United States Department of Agriculture.
- ZHU M, ZHANG J, JIAO L, MA C, KANG Z & MA H. 2022. Effects of freezing methods and frozen storage on physicochemical, oxidative properties and protein denaturation of porcine longissimus dorsi. LWT 153: 112529.
Edited by
-
Handling editor
Alexander Kellner
Data will be made available upon reasonable request.