 Coupled Numerical Simulation of CO2 - EOR Flooding: Integrating Multiphysics Interactions
Abstract
Numerical simulation of CO2-enhanced oil recovery (CO2-EOR) critically advances hydrocarbon field development by quantifying multiphase saturation dynamics during CO2-driven displacement. This study establishes a cylindrically configured 1D triple-phase mathematical model integrating Darcy’s law and mass conservation principles, employing an implicit pressure-explicit saturation (IMPES) finite-difference scheme to resolve spatiotemporal evolution of aqueous, oleic, and gaseous phase saturations. Systematic incorporation of chemical reaction kinetics, viscosity-pressure coupling, and dynamic relative permeability effects yields a novel computational framework for immiscible displacement analysis. Simulations reveal two governing mechanisms: 1) CO2-saturated fluid/rock interactions induce pore-throat dilation, amplifying effective flooding radii; 2) Wellbore-formation pressure differentials (ΔP) dictate CO2 plume propagation, where elevated ΔP expands repulsion radii and oil displacement annulus thickness. Paradoxically, increased reservoir porosity reduces annular confinement while diminishing displacement efficiency despite enhanced volumetric throughput, with simulations confirming persistent oil-rich annuli characteristic of non-miscible regimes. These findings provide actionable guidelines for optimizing CO2-EOR injectivity parameters and ensuring long-term carbon sequestration integrity in heterogeneous formations, bridging theoretical modeling with field-scale implementation strategies.
Key words
CCUS; CO2-EOR; CCO2 flooding; numerical simulation; geophysical-chemical reactions; viscosity
Introduction
Carbon Capture, Utilization and Storage (CCUS) technology is one of the key technologies to reduce CO2 emissions and mitigate the greenhouse effect (Zhang et al. 2024). While conventional CO2 mitigation strategies primarily focus on emission reduction through energy conservation, CCUS technology demonstrates substantially greater decarbonization efficacy and scalability potential when strategically optimized geological reservoir selection and storage protocols are implemented (Liao et al. 2022). So far, there are over 200 CCUS projects worldwide (Zuloaga-Molero et al. 2016) that leverage CO2 flooding technology to enhance crude oil properties and reservoir porosity. This is achieved by injecting CO2 into the reservoir as an innovative replacement agent through injection wells. This approach not only substantially elevates the oilfield recovery rate but also concurrently accomplishes CO2 emission reduction and sequestration, thereby fostering a mutually beneficial outcome (Wu et al. 2022). The numerical simulation of CO2 flooding represents a pivotal technology in the realm of oil and gas field development, enabling enhanced understanding and optimization of extraction processes (Ramadhan et al. 2023). To gain a deeper comprehension of the mechanisms and influencing variables of CO2 flooding, optimizing the flooding strategy, augmenting recovery rates, minimizing costs, and extending the productive lifespan of oilfields, it is exceedingly significant to delve into the mathematical models underpinning the numerical simulation of CO2 flooding. This endeavor holds immense value and potential for advancing the field.

Since its inaugural adoption in the Sacroc field of the United States in 1972, CO2 flooding has garnered extensive research attention from petroleum engineers worldwide. This has led to the formulation of numerous diverse mathematical models aimed at simulating and optimizing the process of CO2 (Bou-Mikael 1996). Comparative experiments and mathematical simulations conducted in the North Sea oilfield of the United Kingdom, analyzing CO2, CH4 and dissolved gas, revealed that the application of CO2 as a solvent outperformed both CH4 and dissolved gas solutions by a significant margin (Cardenas et al. 1984). The fluid flow model devised by Gerritsen & Durlofsky (2005) for intricate multiphase and multicomponent systems employs detailed calculations of reservoir heterogeneity to describe the gas injection process within a miscible phase. This model demonstrates that miscible-phase injection can enhance both recovery rates and CO2 sequestration efficiency (Gerritsen & Durlofsky 2005). Toi et al. (2010) established a mathematical model for the diffusion coefficient of CO2 in hydrocarbons under ambient temperature and pressure conditions, based on experimental studies involving CO2 diffusion within hydrocarbons and subsequent measurements of the diffusion coefficients under those standard conditions (Toi et al. 2010). Domestic scholars have conducted extensive research in the theoretical realm of oil repulsion. Cheng et al. (1998) formulated a pioneering 3D multiphase multicomponent reservoir simulator, explicitly incorporating CO2 aqueous-phase solubility dynamics to resolve oil-gas-water phase interactions in compositional reservoir systems (Cheng et al. 1998). Hou Jian developed a practical mathematical model for CO2 mixed-phase flooding building upon the refined black oil model. This model employs the adjustment to the permeability and effective viscosity of oil and gas to accurately simulate the mixed-phase process (Hou 2004). Xu Geyuan et al. established a comprehensive multi-phase and multi-component zonal seepage model incorporating the critical factor of diffusion into the analysis (Xu 2011). Gao Ran et al. conducted a simulation encompassing the distribution of CO2 across oil, gas and water phases, the impact of dissolved CO2 on reservoir properties, as well as the entire process of CO2-induced oil displacement and sequestration. This simulation integrated the two-phase flashing of oil and gas, the concurrent dissolution of CO2 in water, and the reciprocal effects of these phenomena (Gao et al. 2021).
Currently, the majority of reservoir numerical simulation software available in the market can be used to simulate the CO2 displacement process (Cui et al. 2016), they often fall short in accurately accounting for the multifaceted effects of CO2. Specifically, these software tools may overlook the influence of CO2 as a hydrocarbon component in oil and gas phases on the overall crude oil mobility (Wang et al. 2023a, b). Additionally, they may not comprehensively consider the effects of CO2 dissolution in water, the chemical reactions between carbonic acid and formation minerals, and the subsequent impact of the mineralization process on reservoir permeability (Zhao & Liu 2023). To better simulate the CO2 flooding process, it is imperative to integrate the enhanced crude oil mobility resulting from CO2 dissolution, the geophysical and chemical reactions occurring within the formation under specific conditions, and the dynamics of the CO2 flooding process itself (Wang et al. 2024). This holistic approach ensures a more accurate portrayal of the intricate interactions and effects involved in CO2-enhanced oil recovery.
In this study, a one-dimensional three-phase mathematical model is formulated under the assumption of a columnar formation. This model serves as the foundational basis for subsequent solution and analysis, enabling the simultaneous simulation of CO2 distribution within oil and gas phases, the dissolution of CO2 in water, as well as the reactions that occur under specific formation conditions during the displacement process. Furthermore, the study employs advanced programming techniques to optimize parameters based on the numerical simulation results.
STRATIGRAPHIC PHYSICAL MODEL AND BOUNDARY CONDITIONS
The physical modeling and assumed conditions of the strata in this study are as follows:
-
(1)
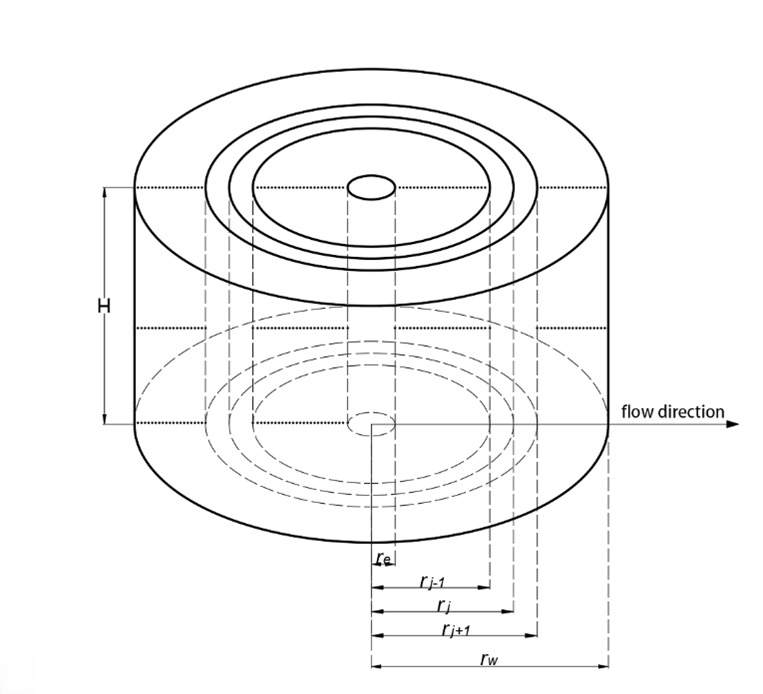
A borehole of radius in the center of an isotropic cylindrical formation is divided into cells of radius using an isobaric progression grid.
-
(2)
There are three-phase isothermal seepage of water, oil, and CO2 gas in the formation. Oil and water are insoluble in each other, and CO2 gas can be dissolved in water and oil, and all three phases conform to Darcy’s law;
-
(3)
The formation rock and fluid are compressible, the influence of capillary force is ignored, and gravity is ignored.
The initial and boundary conditions in this study are as follows:
Distribution of pressure, water, oil, and CO2 gas three-phase saturation at various locations in the formation at the beginning of the CO2 flooding.
Pressure:
, the pressure of the units in the formation, except for the borehole, is equal to the initial pressure of the formation ;
, the pressure of the unit in the borehole is the bottomhole pressure .
Saturation:
, the water saturation of all units in the formation is equal to the initial water saturation of the formation ;
, the oil saturation of all units in the formation is equal to the initial oil saturation of the formation ;
, CO2 gas saturation of all units in the formation is equal to the initial CO2 gas saturation in the formation ;

MATHEMATICAL MODELING
Derivation of Continuity Equation
The continuity equation is established under the condition of continuity, the so-called continuity condition means that when the fluid flows in the space where it is located, there is no void formation inside, and the establishment of the continuity equation should also follow a basic law of nature - the law of conservation of mass.
Take a cylindrical unit, let it be unit , its height is ,inner and outer diameter are , , the direction of fluid flow is: from inside to outside. Then along the reservoir flow direction, in the standard environment, in 4 time from the inner face of the water, oil, CO2 gas three-phase flow into the unit of mass are:
The mass of each of the three phases flowing out of the unit cell from the outer end face is:
Then it can be obtained that after time the mass change of the three phases of water, oil and CO2 in the cell and out of the cell are:
And the overall change in the three-phase fluid mass of water, oil, and CO2 gas in the cell in time, respectively:
The mass conservation continuity equation is derived as follows, using the CO2 gas phase as an example:
From the law of conservation of mass: total change in mass in the cell = mass flowing into the cell - mass flowing out of the cell. Then it can be obtained:
The left side of the equation
The right side of the equation
The equation is simplified to give:
Similarly, the mass conservation continuity equations for the water and oil phases can be obtained as:
In the process of CO2-EOR flooding, Oil, gas and water three-phase fluids flow in the pore medium, and their flows obey Darcy’s law. The equation of Darcy’s law in Cartesian coordinate system takes the form:
Substituting into the mass conservation continuity equation:
Pressure Solving
Neglect capillary forces:, this is obtained by substituting into the mass conservation continuity equation:
In the mass conservation continuity equation density, gas solubility, porosity are all functions of pressure, which can be obtained by expanding the derivative phase in by time:
There is , this is obtained by substituting into Eq. (12):
In this way, can be eliminated throughSo there’s only one unknown in the new formula that needs to be solved:
whereThen the left end of the continuity equation for a three-phase fluid can also be multiplied by the corresponding coefficients and summed:
The derivation of cell-specific pressure-solving equations is carried out using the gas phase of cell No. 1 as an example:
The mass of the gas passing through the rear face of unit is:
The mass of the gas passing through the front face of unit is:
The gas mass increment for unit is:
The volume of unit is:
Then there are:
The proof is as follows:
Ditto:In this way, Eq. (13) can discretize the time() from to and the radius() from to . And the formula can be simplified:
Eq. (17) is logarithmically transformed () and discretized in the direction of radius:
Saturation Solving
The difference equation for saturation can be obtained by substituting Eq. (14)(15)(16) into Eq. (9)(7)(8). The newly obtained difference formula for solving saturation can discretize the time () from to . And the formula can be simplified:
Sorting out can be obtained water, oil, CO2 gas three-phase saturation solution formula:
Geophysical-chemical Reactions
In the process of expulsion, the special reactions between carbonic acid generated by the dissolution of CO2 in water and formation minerals, as well as the effect on formation porosity during mineralization (Dong 2022), all of which are altered by geochemical reactions. The change rule of porosity of the formation medium with effective volume strain is:
where is the effective volumetric strain, which is the combined result of geochemical volumetric strain (), adsorption strain (), pore pressure-induced strain (), and volumetric strain (), and and are the initial and current porosities, respectively. is the initial effective volumetric strain. The volumetric strain and chemical volumetric strain in the initial state are both zero. is the initial pore pressure.For , Eq. (25) is simplified into:
It is clear from Eq. (26) that formation porosity is influenced by the volumetric strain of the formation medium and is related to pore pressure, geochemical volumetric strain, and adsorption-induced volumetric strain (medium expansion).
Correction of Viscosity with Saturation
CO2 is extremely easy to dissolve in crude oil, so that the viscosity of crude oil is significantly reduced (Shikai 2023). Moreover, the larger the initial viscosity of crude oil is, the more obvious the range of decrease is. The main function of CO2 to reduce the viscosity of crude oil is to improve the fluidity of crude oil, so that the oil driving efficiency can be achieved with a small amount of driving agent to achieve a certain effect; or with a quantitative amount of driving agent can realize a higher driving effect.
The effect of formation pressure on crude oil viscosity can be broken down into two components: the effect of pressure changes on viscosity in the absence of CO2 dissolution, and the effect of pressure changes on crude oil viscosity when CO2 is dissolved and precipitated in the crude oil. These two components do not respond to pressure changes in the same way, which leads to saturation pressure. When the formation pressure is higher than the saturation pressure, the volume change of the crude oil has the main part of the effect on the viscosity of the crude oil, and the volume of the crude oil decreases with the increase of the pressure, which leads to the increase of the viscosity. And when the formation pressure is lower than the saturation pressure, the effect of CO2 dissolution in crude oil on the viscosity of crude oil accounts for the main part, and as the pressure decreases, the dissolved CO2 gas precipitates out of the crude oil, leading to the coalescence of heavy hydrocarbon fractions, which manifests itself as a sharp increase in the viscosity of crude oil. In this way, an empirical formula for the variation of viscosity with saturation can be obtained:
Where , , , are the coefficients of variation of crude oil viscosity with the solubility of the CO2 gas in the crude oil.Iteration of Penetration
Relative permeability is an intrinsic property used to characterize the ease of fluid flow in porous media. As an important physical parameter, the calculation of relative permeability plays an important role in the numerical simulation of CO2-EOR flooding. In the case of multiphase fluids seeping through a formation gap (Dong 2020a), the saturation of each phase of the fluid jointly determines the distribution of the flow path (Dong 2020b). This allows the relative permeability to be corrected by the saturation degree and iteratively calculated. The relationship between relative permeability and saturation is as follows:
Where is the relative permeability of the water phase of residual oil saturation and retained gas saturation, is the residual oil saturation, is the retained gas saturation, is the bound water saturation. The denominator is the maximum range of water saturation that can be changed, and the numerator is the mobile water saturation. is the calculation coefficient of the relative permeability of the water phase. Where is the relative permeability of oil phase under bound water saturation and retained gas saturation. The denominator is the maximum range of oil saturation that can be changed, and the numerator is the mobile oil saturation. is the calculation coefficient of the relative permeability of the oil phase. Where, is the residual oil saturation and the relative permeability of the gas phase under mature confinement. The denominator is the maximum range of gas saturation that can be changed, and the numerator is the mobile gas saturation. is the calculation coefficient of the relative permeability of gas phase.
NUMERICAL SIMULATION RESULTS AND ANALYSIS
Initial and boundary conditions
The boundary conditions of this simulation are constant-pressure inner boundary, constant-pressure outer boundary, and the outer boundary pressure 500m away from the center of the borehole is the initial formation pressure. This simulation analyzes the saturation degree of the three of phases water, oil and CO2 gas in the CO2-EOR flooding process and the parameters that have influence on the CO2-EOR flooding efficiency regularly. The parameters and parameter conditions of this simulation are shown in the following Table I:
Influence analysis of parameters
Figure 3 depicts saturation profiles of water, oil, and CO2 gas prior- and post-geophysical-chemical reaction, with radius on the x-axis and saturation on the y-axis. Notably, the front and back sections of all three phases remain unchanged, while the middle sections shift left: water and oil saturations rise, while CO2 gas saturation decreases. This is attributed to dissolved CO2 reacting with the formation, enlarging pores and enabling water and oil to erode the formation more effectively, thereby increasing their saturations and reducing CO2 saturation. This aligns with findings in Wang et al. (2023a).
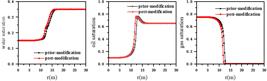
Figure 4 juxtaposes saturation profiles of water, oil, and CO2 gas prior- and post-correction for viscosity, plotting radius against saturation. Water saturation exhibits a leftward shift upfront and marginally midway, with an unchanged increasing rate and unchanged backend. Conversely, oil saturation exhibits a rightward shift in both frontal and intermediate stages, with peak attenuation attributed to enhanced mobility that disrupts complete immiscible-phase interaction. Concurrently, CO2 saturation displays similar front-loaded displacement patterns accompanied by accelerated depletion rates in early-to-mid phases, while maintaining stable saturation levels in later stages. This phenomenon stems from CO2 solubility significantly reducing oil viscosity, thereby enhancing fluidity, CO2 repulsion efficiency, expanding the repulsion radius, and consequently right-shifting the oil saturation curve. Furthermore, the heightened oil mobility accelerates the non-mixed-phase CO2 flooding in increased water and CO2 saturations, which is in harmony with the theory presented in (Huang 2017).

Analysis of simulation results
Figure 5 illustrates saturation of water oil and CO2 gas of the initial day. The x-axis is formation displacement radius, and the y-axis is the saturations. As CO2 gas initially contacts formation fluids, non-mixed-phase repulsion commences. Some CO2 dissolves in crude oil, expanding its volume and boosting oil saturation, the oil saturation bulges evidently. The remaining CO2 forms an upper phase, partly dissolving in water, with water saturation increasing more in the first half of contact. Most upper-phase CO2 migrates forward, extracting hydrocarbons from oil, but insufficiently to reach mixed-phase conditions. Early breakthrough of formation fluids by the upper phase diminishes CO2 flooding efficiency, aligning with findings in (Kang et al. 2014).
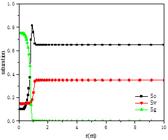
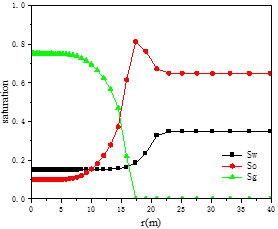
Figure 6 displays saturation profiles of water, oil, and CO2 gas on the 15th day. The x-axis is formation displacement radius, and the y-axis is the saturation. The initial section of each curve is linear, indicating bound water, residual oil, and stagnant CO2 saturation. As intrusion depth increases, water saturation rises to initial levels, oil saturation peaks from residual to initial, then declines, while CO2 saturation drops to zero. This signifies non-mixed-phase replacement with CO2 displacing fluids. The oil saturation bulge reflects CO2 dissolution, expanding oil volume and saturation. The unaffected formation’s rear section maintains initial three-phase saturation levels.

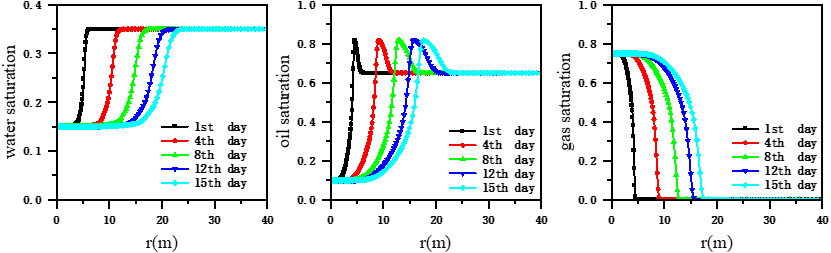
Figure 7 shows saturation curves of water, oil, and CO2 gas vs. flooding time. The x-axis is the radius, and the y-axis is the saturation. The curves depict water saturation over various flooding days. With non-mixed-phase replacement, the expelled radius expands with time, but its growth rate decelerates. Water saturation increases from bound to initial levels over longer periods with diminishing rates. Oil saturation rises from residual to peak, then declines to initial levels over longer durations with slower rates, exhibiting a more pronounced exclusion zone effect. CO2 saturation declines from residual to initial levels over longer spans with slower rates. CO2 displaces mobile water and oil, leaving bound water, residual oil, and CO2 in pores. The horizontal parallel segments at curve ends indicate unaffected strata with initial saturation values.
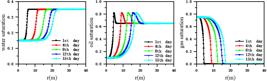
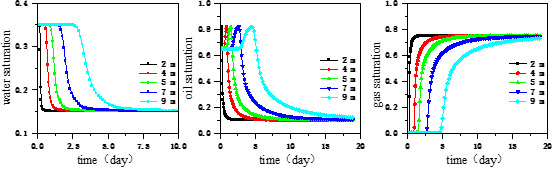
Figure 8 illustrates the saturation dynamics of water, oil, and CO2 gas in three phases versus injection time at varying radii during CO2 flooding. The horizontal axis is injection time, and the vertical axis is the saturations. The figure reveals that saturation changes commence at different times and rates for units at different locations. Initially, near-wellbore units exhibit rapid water saturation decline to bound water levels within 10 days, while distant units take longer with slower declines. Oil saturation near the wellbore surges to a peak before declining to residual levels, with faster changes compared to distant units. CO2 saturation increases from zero, driving fluids away from the wellbore, eventually filling all pore space except for residual oil and bound water. Larger radii units experience longer unmixed-phase displacement durations. Oil saturation takes longer to reach residual levels compared to water saturation reaching bound levels at the same location.
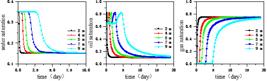
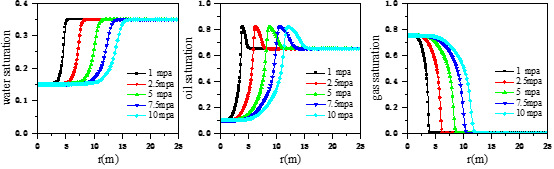
Figure 9 depicts the saturation profiles of water, oil, and CO2 gas in a three-phase system under varying differential pressures between the wellbore and the formation during a simulation of oil displacement. The horizontal axis represents the radius of formation displacement, and the vertical axis indicates the saturation levels of water, oil, and CO2 gas in these three phases. The differential pressures between the bottomhole flowing pressure and the formation’s initial pressure are set at 1 MPa, 2.5 MPa, 5 MPa, 7.5 MPa, and 10 MPa, respectively. The numerical simulation results clearly indicate that, at a given simulation time, a larger differential pressure between the bottomhole flowing pressure and the formation’s initial pressure leads to a greater radius of CO2 displacement and a more pronounced intrusion zone. This is attributable to the fact that the pressure differences the two-phase fluids of water and oil to infiltrate into the formation’s pore spaces. When the formation pressure remains constant, an increase in the bottomhole pressure intensifies the rate of CO2 displacement, resulting in a larger displacement radius.

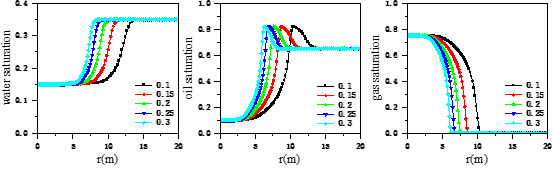
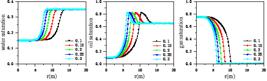
Figure 10 illustrates the saturation profiles of water, oil, and CO2 gas in varying formation porosities during an oil displacement simulation. The horizontal axis represents the radial displacement within the formation, while the vertical axis indicates the saturations of water, oil, and CO2 gas. The formation porosities are set at 0.1, 0.15, 0.2, 0.25, and 0.3, respectively. The saturation curves for these three phases reveal that at a given simulation time, a greater pressure differential between the wellbore and the formation leads to a larger radius of CO2 displacement and a more pronounced intrusion zone. This phenomenon stems from the fact that the pressure differential between the wellbore and the formation facilitates the infiltration of water and oil, two-phase fluids, into the formation’s pore spaces. When the formation pressure remains constant, an increase in the bottomhole flowing pressure intensifies the rate of CO2 displacement, leading to a larger displacement radius.
CONCLUSIONS
-
(1)
Based on Darcy’s law and mass conservation principles, this study develops a 1D triple-phase mathematical framework to characterize CO2-EOR flooding dynamics, systematically investigating the evolution of formation pressure and phase saturations under variable operational conditions. As immiscible displacement progresses, formation pressure exhibits a monotonic increase accompanied by a diminishing formation-borehole pressure differential. Oil saturation undergoes transient elevation to peak oil saturation before reverting to initial reservoir conditions, while aqueous phase saturation manifests a distinct stepwise distribution pattern across radial distances. Concomitantly, CO2 gaseous saturation progressively diminishes to baseline levels, demonstrating characteristic radial propagation signatures of CO2 flooding.
-
(2)
An equation linking porosity changes to effective volumetric strain is incorporated, elucidating the interplay between porosity, pore pressure, and various strains induced by geophysical-chemical reactions. An empirical viscosity-pressure relation is fitted to experimental data, enhancing the characterization of crude oil viscosity’s sensitivity to volume changes, CO2 dissolution, and other factors. This contributes to a more physically meaningful numerical simulation of CO2-EOR flooding. Furthermore, a theoretical relative permeability model for water, oil, and CO2 phases is presented, facilitating accurate representation of three-phase flow in simulations.
-
(3)
Observations reveal a stepwise water saturation distribution at varying radial distances, indicative of non-mixed-phase zones. Oil saturation exhibits a distinct replacement ring, peaking at full saturation prior declining to formation levels. CO2 gas saturation gradually diminishes to zero, underscoring the characteristics of radial displacement.
-
(4)
Reduction of viscosity highlights enhanced oil mobility, expanding the driving radius but inhibiting full CO2-oil contact, leading to reduced oil saturation peaks. This accelerates unmixed-phase CO2 flooding, shrinking the annulus and boosting water and CO2 saturations. CO2-infused water and oil phases react with the formation, enlarging pores and fostering increased water and oil saturations, ultimately decreasing CO2 saturation, flooding radius, and recovery efficiency.
ACKNOWLEDGMENTS
This work is supported by Provincial Frontier Technology Research and Development Plan (grant No.BF2024018).
References
- BOU-MIKAEL SAM. 1996. A New analytical method to Evaluate, Predict, and Improve CO2 Flood Performance in Sandst one Reservoirs. In: SPE/DOE Improved Oil Recovery Symposium. Tulsa, Oklahoma. doi: 10.2118/35362-MS.
- CARDENAS RL, ALSTON RB, NUTE AJ & KOKOLIS GP. 1984. Laboratory Design of a Gravity-Stable Miscible CO2 Process. J Petrol Technol 3: 111-118.
- CHENG LS, LI CL & CHEN YM. 1998. Numerical simulation for calculating CO2 solubility in water phase. J Petrol Univ (Natural Science Edition 2(22): 38-41.
- CUI GD, REN SR & DOU B. 2016. Geothermal exploitation from depleted high temperature gas reservoirs via recycling supercritical CO2: Heat mining rate and salt precipitation effects. Appl Energ 183: 837-852.
- DONG X, SHEN LW & LIU XF. 2020a. NMR characterization of a tight sand’s pore structures and fluid mobility: an experimental investigation for CO2 EOR potential. Mar Petrol Geol 118: 104460.
- DONG X, SHEN LW & NASER G. 2020b. How N2 injection improves the hydrocarbon recovery of CO2 HnP: An NMR study on the fluid displacement mechanisms. Fuel 278: 118286.
- DONG X, SHEN LW & BO L. 2022. Fracture’s Impact on the Recovery of Hydrocarbon from Low-Permeability Rock’s Pores: New Insights from 1H Nuclear Magnetic Resonance Experiment. SPE J 27: 2913-2925.
- GAO R, CY LV & LUN ZM. 2021. Integrated Numerical Simulation of Carbon Dioxide Displacement and Sequestration. Special Oil Gas Reserv 28(02): 102-107.
- GERRITSEN MG & DURLOFSKY LJ. 2005. Modeling fluid flow in oil reservoirs. Annu Rev Fluid Mech 37: 211-238.
- HOU J. 2004. Streamline-Based Mathematical Model for CO2 Miscible Flooding. Appl Math Mech 25(6): 635-642.
- HUANG BP. 2017. Study on CO2 immiscible flooding technology in low permeability reservoir of Daqing Oilfield Northeast Petroleum University.
- KANG H, GAO J & SONG XM. 2014. Study on Oil Saturation Distribution of CO2 Drive in Low Permeability Reservoir. Sci Technol Eng 14(14): 198-201.
- LIAO GZ, HE DB & WANG GF. 2022. Discussion on the limit recovery factor of carbon dioxide flooding in a permanent sequestration scenario. Petrol Explor Develop 49(6): 1463-1470.
- RAMADHAN R, ABDURRAHMAN M & BISSEN R. 2023. Numerical simulation of potential site for CO2 sequestration in a depleted oil reservoir in northern Thailand. Energy Rep 9(S11): 524-528.
- SHIKAI M. 2023. Numerical simulation study of CO2 flooding in low permeability reservoirs of Block H. Northeast Petroleum University. doi: 10.26995/d.cnki.gdqsc.2023.000875.
- TOI K, OHORI Y & MAEDA YE. 2010. Effect of molecular weight on the diffusion coefficient of carbon dioxide in polystyrene. J Poly Sci Part A Poly Chem 18(7): 364-375.
- WANG D, LI J & LIAN W. 2024. Impact of CO2 sequestration on pressure systems in saline aquifer: Simulation of differential pressure evolution in the caprock-reservoir. Geoenerg Sci Eng 236: 212748.
- WANG JG, WANG HM & WANG XL. 2023a. A multiphysical-geochemical coupling model for caprock sealing efficiency in CO2 geosequestration. Deep Undergr Sci Eng 2(02): 188-203.
- WANG K, MA L & TAYLOR K. 2023b. Microstructure changes as a response to CO2 storage in sedimentary rocks: Recent developments and future challenges. Fuel 333: 126403.
- WU BZ, YUUAN XY & GUO TZ. 2022. Method for extracting apparent resistivity from transient electromagnetic logging measurements and geosteering potential. J China Univ Petrol, Edition of Natural Science 46: 99-109.
- XU GY. 2011. CO2-EOR multiphase multicomponent zonal seepage model considering diffusion. Oil Gas Field Surf Eng 2(30): 24-25.
- ZHANG ZC, BER MX & DU SY. 2024. Research progress of CO2 displacement and storage integration technology. World Petrol Industr 32(01): 100-107.
- ZHAO C & LIU QB. 2023. Investigating effects of structural deformation regimes on mineralization distributions in fluid-saturated rocks: computational simulation approach through generic models. Minerals 13(5): 664.
- ZULOAGA-MOLERO P, YU W & XU YF. 2016. Simulation Study of CO2-EOR in Tight Oil Reservoirs with Complex Fracture Geometries. Sci Rep 6: 334-345.