
 Inhibitory Effect on the Tyrosinase Activity and Low Cytotoxicity of Monounsaturated Long-Chain Chelating Fatty Ester
Abstract
In the present study, 5-Hydroxy-2-(Oleoyloxymethyl) -4H-pyran-4-one (KMO 3), and their chelated with Cu(II) and Fe(III) ions were synthesized to explore their inhibitory activity against tyrosinase and cytotoxicity. To this end, the structures of the obtained compounds were confirmed by ATR/FT-IR, 13C and 1H-NMR, and UV-vis techniques. The results show that chelating fatty ester presents the bands at 1567m, 1511w cm-1 attributed to the coordinated carbonyl (Cu(II)←[O=C]2), and the bands at 1540m, 1519m cm−1 which were attributed to the coordinated carbonyl (Fe(III)←[O=C]3). The inhibitory effect of chelating Oleic acid 2 (inhibition 68.3% ± 4.5) showed a factor of 19 times higher than free fatty acid (3.6% ± 3.2). IC50 Anti-tyrosinase activity of the Kojic acid 1 and KMO 3 compounds were 62.8 ± 6.6 µM and 77.6 ± 4.3 µM. The IC50 and IC90 values for tyrosinase inhibitory activity for chelating fatty ester and their complexes are values > 400 µM. Finally, the assay with the series showed no hemolytic activity (EC50> 250 μg mL-1), and not cytotoxic to B16F10, ACP-02, and human dermal fibroblast cells at 100 µM and showed no hemolytic potential at the concentration of IC50 250 µM.
Key words
kojic acid; oleic acid; conjugates chelating pyrone-fatty Acid; ATR/FT-IR; melanoma
INTRODUCTION
5-Hydroxy-2-(hydroxymethyl)-4H-pyran-4-one (Kojic Acid, KA 1), is a natural metabolite produced by fungi well known by O, O-chelating pyrone group (C-5 enolic hydroxyl group), that is considered as a pharmacophore which inhibits tyrosinase activity in melanogenesis, including radioprotective and skin-lightening agent in skin cream and lotions products (Saeedi et al. 2019). Notably, KA 1 may be useful for the selective treatment of leishmaniasis and may have great potential as an anti-leishmanial agent (Rodrigues et al. 2014) by activating macrophage cells (Rodrigues et al. 2011). This bioactive compound is significant for human health due to its diversified potential biological activity. Usually, KA 1 esters can be used as alternatives for a safe skin whitening agent due lower cytotoxic effect (Lajis et al. 2012). In specific literature, it is demonstrated that selective tyrosinase inhibitors from Pyrone-Fatty Conjugates (PFCs), have been synthesized via chemical or biotechnological processes with a pyrone group, linked by covalently bound to lipid moieties with potential application of biotechnology in cosmetics, pharmaceuticals, and medical areas. Yet, we call PFCs that have the ability of metals scavenging “Chelating Pyrone-Fatty Conjugates”.
The derivatives of the unsaturated free fatty acids are more attractive because KA 1 esters can be used as alternatives for a safe skin whitening agent and potential depigmenting agents to treat hyperpigmentation (Lajis et al. 2012). Esterification has been employed, as a strategy, to enhance the stability and efficacy of KA 1. Therefore, the KA 1 and kojic dipalmitate (KDP) are prescribed to treat skin hyperpigmentation (Tazesh et al. 2022, Mohammadi 2021). In the same way, the incorporation of antioxidant excipients in KDP formulations is recommended for yielding better stability results (Tazesh et al. 2022). Other non-chelating di- or monoesters such as lauric, palmitic, and especially oleic acid (OA 2) also show some potential for treating hyperpigmentation as a safe and non-toxic depigmenting agent (Mohammadi 2021).
Free fatty acids are also attractive because those presenting potentially modulate inflammatory and immune responses to skin lesions (Cardoso et al. 2011). These acids act as potent antioxidant molecules (Cho et al. 2010), and also have presented remarkable selective regulatory effects on inhibiting melanin synthesis in melanoma cells, suggesting a new mechanism to explain the physiological effects of fatty acids (Ando et al. 1998, 1999, 2004, 2006, 2007, Yoon et al. 2010, Yamada et al. 2019). Anti-cancer effects and action mechanisms of Omega-9 fatty acids exhibit essential pharmacological activities that pose them as potential candidates for anti-tumor action (Farag & Gad 2022).
Tyrosinase (EC 1.14.18.1), a binuclear copper-containing glycoprotein present in bacteria, fungi, plants, and animals is a key regulatory enzyme in initiation responsible by ortho-hydroxylation of L-tyrosine to L-dihydroxyphenylalanine (L-DOPA) and subsequent oxidation to dopaquinone of the melanin-biosynthesis pathway (Holm et al. 1996). Particularly, melanin is a pigment of yellow-reddish or brown-black color, biomolecules produced in melanosomes by melanocytes in human skin (Pillaiyar et al. 2017). Thus, the accumulation of an excess of melanin involves many negative aspects of life and greatly increases the risk of human malignant melanoma cells (Wang et al. 2022). So, tyrosinase inhibition could be important in melanoma therapy (Brozyna et al. 2008, Slominski et al. 2009).
In 2020, Worldwide, the epidemiological assessment of global cancer data estimated 325,000 new melanoma cases and is estimated to increase to 510,000 new cases and 96,000 deaths by 2040, if 2020 rates remain stable (Arnold et al. 2022). In Latin America and the Caribbean, Brazil has the highest number of cancer clinical trials, scientific publications about cancer clinical trials, and high rates of cancer incidence and mortality (215.4 and 91.2 per 100,000 individuals, respectively) due to environmental risk, like the high incidence of UV radiation associated to the specific genetic factors as the susceptibility of melanoma´s genes of those populations (Gössling et al. 2023). Otherwise, results of in vivo radioprotection showed that KA 1 and its manganese and zinc complexes exhibited significant radioprotective effects against a lethal dose of gamma-irradiation in mice (Emami et al. 2007, Hosseinimehr et al. 2009). In this context, is relevant to develop new and better therapies to reduce the cases and deaths due to the undesirable resistance of melanoma cells in the response on chemo radio- or to photo radiotherapy, and overcoming the limited clinical melanoma responses in current therapy (Rinaldi et al. 2022, Lopes et al. 2022).
Our purpose was to evaluate the production, and confirmation of chemical structure by various physicochemical techniques using ATR/FT-IR, 13C and 1H-NMR and UV-Vis studies, tyrosinase inhibitory activity, and also cytotoxicity against cancer cell lines or human fibroblasts of KMO 3 and their chelated with cooper and iron ions, with the perspective of use future as pharmacological agents in situ of the low cytotoxicity, simple synthesis and low cost with application medical.
MATERIALS AND METHODS
Material
Reagents: NaNO3 (Sigma-Aldrich®) (St. Louis, MO, USA), KH2PO4 (Sigma-Aldrich®), K2HPO4 (Sigma-Aldrich®), MgSO4 (Sigma-Aldrich®), (NH4)2SO4 (Sigma-Aldrich®), FeSO4.7H2O (Sigma-Aldrich®), NaHCO3 (Sigma-Aldrich®), (CH3COO)2Cu.H2O (Sigma-Aldrich®), FeCl3 (Sigma-Aldrich®), Cis-9-octadecenoic acid (Oleic acid, OA) (Synth®). Solvents: dimethylsulfoxide (DMSO) (sigma-Aldrich®), ether (Synth®), ethanol (Synth®), ethyl acetate(Synth®), acetone (Sigma-Aldrich®)and hexane(Synth®). Other: microplate’s (BIOLOG Eco™) and thin layer chromatography (TLC) plate’s silica gel GF254, 0.20mm (Merck®), Agar (BD Bacto™) (Detroit, MI, USA), Dulbecco’s Modified Eagle’s Medium(DMEM) (Gibco®) (Grand Island, NY, USA), 4-dihydroxyphenylalanine (L-dopa) (Sigma-Aldrich®), mushroom L-Tyrosinase (EC 1.14.18.1) (sigma-Aldrich®), fetal bovine calf serum (Gibco®), Alamar Blue (Sigma-Aldrich®), L-glutamine (Sigma-Aldrich®), penicillin (Sigma-Aldrich®), streptomycin (Sigma-Aldrich®) and Doxorubicin (Sigma-Aldrich®). All reagents and solvents were homemade and of analytical grade. The water used was re-distilled and ion-free.
Obtaining 2-hydroxymethyl-5-hydroxy-gamma-pyrone (kojic acid, KA 1)
The KA 1 was produced by cepa Aspergillus flavus IOC-3974 on submerged cultivation in the Czapek Dox medium modified with 12% m v-1 of sucrose and a Carbon/Nitrogen ratio of 200 (Santos et al. 2018). The mycelial development of A. flavus IOC 3974 on Czapek Dox agar pH 5.5 sterilized used sucrose as a carbon source (Ferreira et al. 2010). The maximum yield obtained was 2.5% m v-1 of metabolite in the culture on the fourteenth day. After lyophilization, the metabolite was extracted with ethyl acetate/ethanol and purified using acetone/hexane as an anti-solvent recrystallization system. The cepa A. flavus IOC3974 used in this work was obtained from the “laboratorio de coleção de fungos do Instituto Oswaldo Cruz in Rio de Janeiro (Brazil).
Preparation of 2-Oleicoyloxymethyl-5-hydroxy-gamma-pyrone or kojic monooleate (KMO 3)
The reagent alkyl was obtained by mixing 50 mmol (14.1 g) of (9Z)-Octadec-9-enoic acid (Oleic Acid, OA 2) and 15 mmol (2.05 g) of anhydrous zinc chloride in an oil bath kept at reflux. After, 15 mmol (2.15 g) of KA 1 and the reaction was kept under the same initial conditions (Ichimoto & Tatsumi 1962). The esters of yellow color were extracted and crystallized with ethyl ether.
Preparation of bis(2-Oleicoyloxymethyl-5-hydroxy-gamma-pyrone)copper(II) (Cu((KMO)2 3a) coordination complex
The preparation of the complex Cu(KMO)2 3a in 2:1 ligand-to-metal was made by a mixture of 2.5 moles (0.5 g) of copper acetate dissolved on 20 mL of ethanol and 5 mmol (2.03 g) of ester solubilized on 30 mL in ethanol added dripping and moderate agitation and the reaction mixture was stirred at room temperature for 30 minutes. This complex compound was extracted from the reaction medium with hexane. Finally, the compound of forest-green color was obtained after evaporation of the residual hexane.
Preparation of tris(2-Oleicoyloxymethyl-5-hydroxy-gamma-pyrone)iron(III) (Fe(KMO)3 3b) coordination complex
The preparation of the complex Fe(KMO)3 3b was similar to the procedure described in the previous section in 3:1 ligand-to-metal was made by a mixture of 1.7 mmol (0.28 g) of Ferric chlorite dissolved on 20 mL of ethanol and 5 mmol (2.03 g) of ester solubilized on 30 mL in ethanol added dripping and moderate agitation and the reaction mixture was stirred at room temperature for 30 minutes. After to evaporation of the solvent, this complex compound was extracted from a medium with hexane. Finally, the compound blood-red color was obtained after evaporation of the residual hexane.
ATR/FTIR measurements
Fourier-transformed infrared spectroscopy using the Attenuated Total Reflectance (FTIR-ATR) spectrum was recorded with an AVATAR 370 FTIR Thermo Nicolet spectrometer (Thermo Nicolet Corporation, USA). The spectrometer is directly controlled by EZ OMNIC (Thermo Nicolet Corporation, USA) software. The IR spectra were collected with the SMART and plotted by OMNIC Spectra software. All spectra were registered in the region of 4000-400 cm-1, with a resolution of 4 cm−1 and 32 scans. The spectrometer is directly controlled by VISIONLite software.
NRM spectroscopy measurements
Nuclear magnetic resonance (NMR) spectra were recorded on a Varian 300 MHz NMR spectrometer (300 MHz and 75 MHz for 1H and 13C, respectively) using TMS as an internal standard.
UV-Visible Absorption Spectra Analysis
The equipment Spectrophotometer Thermo Scientific™ GENESYS™ 10 UV-Vis, MODEL: G10S UV-VIS was used for scanning the spectrum of the substance in the ultraviolet-visible region from 200 to 500 nm, with the aid of a quartz cuvette in which the baseline is made with the sample solvent. A standard solution of 1 mg mL-1 of the sample is prepared and dilutions are made to create the graphs.
Mushroom tyrosinase inhibitory assay
Tyrosinase activity inhibition was determined by the method measuring the absorbance at 470 nm as described previously (Tomita et al. 1992) in triplicate by measuring the Dopachrome formed due to the action of tyrosinase enzyme on tyrosine substrate. In brief, samples were dissolved in water to make the different concentrations. The 96-well plate was set up in the following order; 20 μL of sample and 80 μL of mushroom tyrosinase (100 μg mL-1 in 20 mM phosphate buffer, pH 6.8). After incubation at 25 °C for 5 min, the reaction was initiated by adding 100 μL of 0.02% L-dopa solution to each well. IC50 value, a concentration giving 50% inhibition of tyrosinase activity, was determined by interpolation of the dose-response curves.
Cytotoxicity against cancer cell lines by Alamar Blue assay
Analyzes to evaluate the cytotoxicity of the samples were performed in triplicate using cell lines NIH 3T3 (Murine Fibroblasts), B16F10 (Murine Melanoma), and APC02 (human gastric adenocarcinoma). The strains were cultivated in DMEM medium (Dulbecco’s Modified Medium or Dulbecco’s Modified Eagles Medium) plus 10% fetal bovine serum, 1% penicillin, and 1% streptomycin. All cells were incubated at 37 ºC using a controlled atmosphere with around 5% CO2 on 72 h, and were increased 10 µL of Alamar Blue 0.4% solution 2 hours before reading fluorescence (Excitation: 540 nm and Emission: 585 nm) (Yamaguchi et al. 2012). All cell lines were maintained in DMEM medium supplemented with 10% fetal bovine serum, 2 mM L-glutamine, 100 U mL-1 penicillin, and 100 mg mL-1 streptomycin at 37°C with 5% CO2. The negative control received the same amount of DMSO (0.001% in the highest concentration). Doxorubicin was used as a positive control (0.02-8.6 mM). All studies were performed according to Brazilian research guidelines (Law 196/96, National Council of Health).
Normal human fibroblasts were seeded into 24 well plates at a density of 3 x 10⁴ cells per well and treated with samples for 24 hours. After the treatment period, the medium was collected for microtubules and proteins quantified by the Lowry method. Then, the proteins (30 µg/sample) were subjected to electrophoresis on SDS-PAGE 1.0 mm system (BioRad Mini-Protean® III), polyacrylamide (PAGE) 30% containing 10% sodium dodecyl sulfate (SDS), copolymerized with 1% gelatin, initially at 70 V for 30 minutes and then at 120 V for 90 minutes. After the incubation period, the gels were stained with Coomassie Brilliant Blue® for 30 minutes at room temperature and destained with a solution containing 10% methanol and 10% acetic acid in water. The gel was scanned (450 dpi) and the intensities of the bands and molecular weights were calculated using the ImageJ software.
The tumor cell lines used in this work were B16F10 (Murine Melanoma) and ACP-02 (gastric adenocarcinoma) kindly provided by all lines originating from the National Institute of Health, Bethesda (Maryland, USA). B16-F10 and ACP-02 cells were cultured in continuous log-phase growth in DMEM containing 10% FBS. Cells were seeded in 96-well plates (2500 cells/well) and incubated at 37 °C in 5% CO2 for about 24 hours before ascorbic acid treatment (Montenegro et al. 2010, Da Silva Junior et al. 2007).
Cell membrane disruption or hemolytic activity
The test was performed in 96-well plates using a 2% mouse erythrocyte suspension in 0.85% NaCl containing 10 mM CaCl2. The compounds diluted, as mentioned above, were tested at 625 mg mL-1. DMSO was used as a negative control and Triton X-100 (1%) was used as a positive control. After incubation at room temperature for 1h and centrifugation, the supernatant was removed and the liberated hemoglobin was measured spectrophotometrically at 540 nm (Montenegro et al. 2010, Yamaguchi et al. 2012).
Statistical analysis
The IC50 value was obtained by extrapolation from linear sigmoidal regression analysis from graphs plotted using the Origin version 6.0 (Origin Inc., USA) program and denoted the concentration of sample required to inhibit 50% of mushroom tyrosinase inhibitory activity (400-3.25 μM). The data were expressed as mean ± standard error of the mean (SEM). Analysis of variance was performed by ANOVA procedures. Significant differences between the means were determined by Tukey’s pairwise comparison test at a level of p < 0.05.
RESULTS AND DISCUSSION
Figure 1 presents a schematic summary of the main experimental stages of this research. The KA 1 was produced in a biotransformation process, containing sucrose as a carbon source, by the A. flavus IOC-3974. The unsaturated long-chain fatty chelating ester was obtained yielding 21% w/w. The Cu(KMO)2 3a and Fe(KMO)3 3b coordination complexes were obtained by reaction of KMO 3 with the salts of Cu(II) and Fe(III), in ethanol yielding 87% and 76% w/w, respectively, using titillation method at 30 oC. The change in color of the reaction medium from yellow to green with salts of copper and from yellow to red wine with iron salts was the first indicative attributed to the formation of the coordination complexes.

Experimental steps and chemical structure of KA 1, Chelating Kojic-Oleic Conjugates and they’re chelated with Cu(II) and Fe(III) ions compounds.
The structure of all substances was characterized by ATR/FT-IR spectroscopy, and confirmed by 13C and 1H-NMR, and UV-vis complementary techniques.
Figure 2 shows the results of obtained ATR/FT-IR spectra in the range of 3400-650 cm−1 with a spectral resolution of 1 cm−1 and a scan number of 32 scans/sample of all compounds. The results of ATR/FT-IR spectra represent a unique combined fingerprint pattern to each analyzed compound and were used for the differentiation of the structural changes of KMO 3 ester, and their derivatives. Analyzing the profiles of the spectrum of the ester is possible to see a hybrid of KA 1 e o OA 2 spectra, presenting a visible change in the intensity of the bands in the region of 1750-600 cm−1 (relating the C=O stretch), assigned by the increase of the intensity of functional groups that absorbs in the region 3200-2600 cm−1 in FT-IR spectra (relating the CH2 stretch); a phenomenon that describes the characteristic formation of chelating fatty ester.

Room temperature FTIR/ATR Absorbance spectra in the range 3600-650 cm−1 of KA 1, Chelating Kojic-Oleic Conjugates and they’re chelated with Cu(II) and Fe(III) ions compounds.
Table I shows 3the summary of principal data of experimental vibrational wavenumbers, mode of vibrations, and functional group from ATR/FT-IR spectra compared with values of bending deformation and stretching described in the literature. We show the update of the values in the spectrum of KA 1 by ATR technique. In general, the results in values of the spectrum of chelating ester did not show a significant difference (p > 0.05) between the values of change in the position absorption peak described in the literature (see Table I).
Table I. Characteristic frequencies (cm-1), Functional Groups, Vibration Mode, and Intensity for ATR/FTIR Spectra of Chelating Kojic-Lipid Conjugates and their chelated with Cu(II) and Fe(III) ions compounds.
The interpreting peak of spectrum FT-IR of KA 1 and OA 2 are well defined in the literature (See Table I). Figure 2 presents also the major peaks that represent pyrone functional groups in ester are observed: weak absorption peak at around 3098 cm−1 (C-H stretching of ring), medium absorption peak at 1642 and 1617 cm−1 (C=O symmetry and asymmetry stretching of ring), medium absorption peak at 1583 and 1462 cm−1 (C=C symmetry and asymmetry stretching of ring), medium peak at 1270 cm−1 (C-O-C stretching of ring), weak peak around 948 cm−1 (C-H ring bending deformation in-plane) and weak absorption peak at 1343 and 1073 cm−1 (C-O alcohol bending deformation). The principal major peaks that represent fatty functional groups in ester are observed: absorption peak at 2918 and 2848 cm−1 ((C-H)CH2 asymmetry and symmetry stretching), peak at 2954 cm−1 ((C-H)CH3 asymmetry stretching), peak at 1650 cm−1, 2937 cm−1 and 1735 cm−1 (C=O stretching of ester), 1462 cm−1 (C-H bending (scissoring)), weak peak at 1417 cm−1 ((CH2)-CH2-(CO)-O) bending), absorption peak at 1378 cm−1 (CH2 bending), the medium absorption peak at 1243 cm−1 (C-C-O stretching), weak absorption peak at 948 cm−1 ((C-H)=CH (cis) bending out of plane), and 724 cm−1 (C-H bending (rocking)). All values in the characterization of the 3700-650 cm−1 range of functional groups, vibration mode, and intensity ATR/FT-IR absorbance spectra of the complexes (shown in Table I). In the region, of 1750-600 cm−1 can be found the bands that confirm the bounding of pyrone-fatty ester with a metal ion through the oxygen atom in the carbonyl group, shown by the decreasing of the stretching vibration frequency (C=O) in the absorption peak at 1735 cm−1 (see Figure 2) indicated the presence of the carboxyl group (C=O) at 30-50 cm−1 in the FT-IR spectra.
Table I also shows the values of the free carbonyl stretching and coordinated with different metal ions. The common chemical structures of derivatives are structures analogous to chelating pyrone-fatty ester. For this reason, the bands of symmetric and asymmetric stretches of carbonyl groups free of gamma-pyrone appear at 1678-1650 cm−1 and 1626-1610 cm−1, respectively (see Table I). Specifically, the region of 1500-1625 cm−1 is used to determine the characteristic bands of the coordination compounds with gamma-pyrone. Thus, we can highlight the bands assigned to the stretching of carbonyl complexes with different metal ions in the regions of the spectrum according to the values reported in the literature for the ion Cu(II) (1509-1569 cm−1); Fe(III) (1562-1510 cm−1) the confirmation is made by the intervals values as described for the complex compounds of ion Cu(II) with ligands derived 3-Hydroxy-2-methyl-4H-pyran-4-one on 1605 - 1509 cm−1 (Thompson et al. 2004), kojic-phenylalanine amide on 1567, 1513 cm−1 (Kwak et al. 2010), and others complex compounds of Fe(III) with ligands derived from 2,6-dimeyhyl-4-pyrone on 1653-1563 cm−1 (Gray et al. 1992), chitosan-kojic conjugates on 1562, 1512 cm−1 and KA 1 on 1556, 1510 cm−1 (Synytsya et al. 2008). In this case, bands in the region of 460-270 cm−1 can be attributed to the vibrations of metal-oxygen bonds, therefore, was not found a specific band for the connection between the metal and the oxygen of the hydroxyl group. the results of this work also showed that the vibration of the metal with the derivative chelating fatty ester carbonyl occurred in the region 1550-1510 cm−1 (see Table I). The ATR/FT-IR spectra shown in Figure 2 of Cu(KMO)2 3a and Fe(KMO)3 3b coordination complexes are very similar. In this case, the results of spectra of the chelating fatty ester present the bands at 1567m, 1511w cm-1 attributed to the coordinated carbonyl Cu(II) ion (Cu(II)←[O=C]2), and the bands at 1540m, 1519m cm−1 which were attributed to the coordinated carbonyl Fe(III) ion (Fe(III)←[O=C]3), respectively. Therefore, the ATR/FT-IR spectroscopy technique made it possible to analyze and study the chelating fatty ester and their coordination compounds, and due to its selectivity, this technique has considerable potential and relevant details in elucidating this type of compound. Thus, these results showed it possible to verify that all ATR/FT-IR spectra in this work showed better resolution much higher compared with those obtained by traditional method Infrared spectra at KBr pellets, mainly, in the spectra of coordination compounds reported in the literature.
The structural characterization of KA 1 and KMO 3 was confirmed by 13C and 1H-NMR, also confirmed for numerous previous works described in the chemical literature and related areas. NMR spectra are available in Figure 3. A chemical shift of methylene protons at C-7 in 1H-NMR spectra was a reliable indicator for distinguishing the regioisomer of KMO 3.

KA 1- 1H NMR (300 MHz, D2O): δ = 9.07 (s,1H, H-9, OH of ring), 8.02 (s,1H, H-6), 6.33 (t, J4 = 0.9 Hz, 1H, H-3), 5.68 (s,1H, H-10, OH), and 4.28 (d, J = 0.9 Hz, 1H, CH2-7) ppm. 13C NMR (75 MHz, DMSO-d6): δ = 174.1 (C-4), 168.3 (C-2), 145.9 (C-5), 139.5 (C-6), 110.0 (C-3), and 59.6 (CH2-7) ppm.
KMO 3 - 1H-RMN (δ, ppm) (300 MHz, CDCl3): 0.84-0.88 (weak triplet, H-18’,t, J = 10.6 Hz, CH3), 1.25-1.29 (2H, m, (CH2)n, very sharp singlet, H-2’- H-7’, H-12’-H-15’), 1.64 (4H, m, H-3’ H-17’), 1.98-2.0 (slightly sharp singlet, 4H, m, H-8’ e H-11’), 2.35-2.40 (2H, t, J = 12.4 Hz, H-3’), 2.35-2.40 (2H, t, H-2’), 4.92 (2H, s, α-H-7), 5.31-5.35 (2H, m, H-9’ and H-10’), 6.51 (1H, s, H-3), 7.88 (1H, s, H-6) ppm. 13C-RMN (δ, ppm). (75 MHz, CDCl3): δ 178.9 (C-1’), δ 174.1 (C-4), δ 172.7 (C-2), δ 145.8 (C-5), δ 139.5 (C-6), δ 137,9 (C-9’; C-10’), δ 110.0 (C-3), δ 59.6 (C-7), δ 24,74 (C-3’); δ 33,88 (C-2’),; δ 31,92 (C-16’); δ 29,64-29,08 (C-4’ a C-7’, C-12’ a C-15’), δ 27.22 (C-8’ a C-11’), δ 22.68 (C-17’), δ 14.12 (C-18’) ppm.
The results showed that the KA 1 portion of the molecule was confirmed by the presence of two singlet signals at δ 6.49 and δ 7.85 which were assigned to H-3 and H-6. H-7 gave a singlet signal at δ 4.93(Karkeszová et al. 2021). The 1H-NMR spectrum of the esters gave 3-hydrogen triplet at δ 0.88, indicating a terminal methyl group (Lajis et al. 2012). Two hydrogen methylene signals are observed at H3 - H15 and H3 -H11 of the esters. The downfield methylene signal at δ 2.40 was due to the presence of the CH2 group, next to the ester linkage. The 13CNMR spectrum gave a total carbon count for the oleic ester of C-18’. The C-1 (ester group) peak. appeared at 163. Very low field signals were observed at δ 172 and δ 173 which were due to C-2 and C-4 of the pyrone ring (Jumbri et al. 2015). The Carbonyl group of the ketone is more deshielded than the carbonyl group of esters due to the effect of the pyrone ring. The other carbon assignments are also shown in Figure 3.
Figure 4 shows the UV-vis spectra for KMO 3, Cu(KMO)2 3a, and Fe(KMO)3 3b. Three strong absorption peaks at 240, 270 e 316 nm were observed clearly, ascribed to the π→π * transition and n→π * transition. The UV absorption intensity of KMO 3 is very low, but the addition of carboxyl groups and hydrophobic tails will change the spatial structure of the complexes, potentially improving the stability of the PFCs.
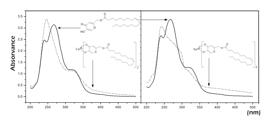
The absorption bands at 218 and 274 nm are assigned to the 4-oxopyranone group of kojic acid 1 structure. These bands were assigned to the n→π* transitions (R bands) and π→π* transitions (K bands) of the C=O chromophore (Synytsya et al. 2008). Previous studies had found that the absorption spectrum of the ligand oleic acid 2 exhibits two notable peaks around 250 and 300 nm. The peak at 250 nm was ascribed to the π−π* transition of C=C bonds, while the band at 300 nm was attributed to the n−π* transition of C=O bonds (Rimal et al. 2020). In this work, the absorbance at 240 nm can be attributed to the electronic transition of the π→π* type from the main chromophore group to the unsaturated α, β ketone of the γ-pyrone ring (Ichimoto & Tatsumi 1962).
The UV-Vis spectral changes in the absorption maximum at 270 nm, resulting from the formation of the coordination bond between oxygen and iron or copper metal. The absorbance at 270 nm is attributed to the n→π* electronic transition of the carbonyl of the γ-pyrone ring and the absorbance at 316 nm is attributed to the absorption of the n→π* bond of the carbonyl of the ester derivative KMO 3. This effect is called displacement bathochromic, as the maximum absorbance is shifted to a longer wavelength, attributed to the effect of the substituent and interactions with the solvent hexane.
The formation of PFCs was accompanied by a bathochromic shift of the π→π* transition of the carbonyl group in the γ-pyrone ring (Marwaha et al. 1994). The spectral changes that occur in the absorbance at 270nm, for KMO 3 and Cu(KMO)2 3a, attributed to the coordinated carbonyl in Cu(II)←[O=C]2 and, similarly between KMO 3 and Fe(KMO)3 3b in Fe(III)←[O=C]3, are due to the hypochromic effect due to the formation of the complex. The coordination bond that occurs between the valence electrons of the carbonyl oxygen (n electrons), which prevent the band transition to R bands, was attributed to n→π* interactions (Synytsya et al. 2008)). It is noteworthy that PFCs presented absorbance bands above 400 nm, in the visible region, which was not observed in the spectrum of KMO 3. This band can be attributed to the spectrophotometric characterization of the esters.
Figure 5 shows the results in vitro for tyrosinase inhibitory activity, on a single concentration of 400 µM. The general sequence of the inhibitory activity is shown as follows: compound KA 1 is slightly greater than compound KMO 3. These results showed that the chelating fatty exhibited an effect on mushroom anti-tyrosinase presenting values of inhibition above 50% in the concentration of 400 μM. This significant improvement (p <0.05) of the inhibitory effect of chelating OA 2 (inhibition 68.3% ± 4.5) showed a factor of 19 times higher than free fatty acid (3.6% ± 3.2). Moreover, the ability of O, O-cheating was responsible for maintaining 76% of tyrosinase inhibitory effects in vitro compared to the positive control, with inhibition of 89.7% ± 5.2 (see Figure 5).

The profile of the relationship between Mushroom tyrosinase inhibitory activity (%) versus concentration of KA 1; OA 2 and KMO 3. In 5-400 µM. Concentration mean ± Standard deviation (SD) of four independent experiments.
The IC50 values of positive control determined are closed as reported in the literature, between 40-70 µM (Wang et al. 2022). In this study, the IC50 Anti-tyrosinase activity of the KA 1 and KMO 3 compounds were 62.8 ± 6.6 µM and 77.6 ± 4.3 µM, respectively. IC50 and IC90 values for tyrosinase inhibitory activity for chelating fatty ester and their complexes presented less than 90% at the highest concentration assayed (IC90 values > 400 µM). The profile of tyrosinase inhibitory activity on the dilution curve to determine the IC50 for the KA 1 and KMO 3 compounds is shown in Figure 5. The results complementary dilutions, presented in the curve, to determine the IC50 of KA 1 were 25μM (26.3% ± 1.2); 50 μM (43.9% ± 3.7); 100 μM (59.3% ± 4.5) and 200 μM (72.9% ± 3.5) and to KMO 3 were 25μM (22.6% ± 2.6); 50 μM (39.4% ± 1.0); 100 μM (50.8% ± 2.8) and 200 μM (59.6% ± 3.5). The inhibition profile presented by the ester (see Figure 5) is very similar to the KA 1. It was understood that the high lipid solubility of the free or chelated ester can enable important changes due to toxicity and why this activity needs to be evaluated in these aspects (Kwak et al. 2010).
Based on data collected from three independent experiments this result showed that all compounds in this work had not exhibited a considerable effect against two cancer cell lines, because they have values of IC50 above 5 μg mL-1. These results are by National Cancer Institute (NCI) protocols, where compounds exhibiting IC50 values < 4 μg mL-1 are considered active (Montenegro et al. 2010). These results have positive impacts in the continuity of these studies showing that the insertion of the chelating group in the molecule of OA 2 did not change significantly the cytotoxicity for these cell types. Monounsaturated fatty acid C-16 showed the ability to inhibit melanogenesis to down-regulate melanin content in a dose-dependent pattern and exhibited no cytotoxicity at 500 mM in a human cell line (Yoon et al. 2010). The assay with the series showed the absence of hemolytic activity (EC50 > 250 μg mL-1). High concentrations of unsaturated fatty acids are known which markedly differ in their resistance to osmotic rupture and at low concentrations, however, unsaturated fatty acids have been found to protect erythrocytes against hypotonic hemolysis with a high degree of specificity (Montenegro et al. 2010, Reis et al. 2011). Therefore, we may suggest that these compounds had minimum damage to the membrane.
These results demonstrated that the substances do not have cytotoxicity related to inhibition of cell proliferation and the ability to induce lyses of mouse erythrocytes demonstrating that no membrane damage was found (Montenegro et al. 2010). Regarding the hemolytic assay, none of the compounds was capable of causing hemolysis in mouse erythrocytes, even at the highest concentration of 250 μg mL-1 (Reis et al. 2011). In the literature, clinical observations indicate that a high percentage of melanoma patients do not respond or suffer from severe drug-related toxicity, and to overcome these problems (Rinaldi et al. 2022).
The results of values IC50 of cytotoxicity against cancer cell lines for B16F10 (melanoma) and ACP02 (gastric 8 adenocarcinoma) human cells were evaluated by Alamar Blue assay showed that the substances in this study have low activity IC50 > 5µM, compared to the Doxorubicin (positive control, IC50 = 0.08 ± 0.07). In this context, the potential cytotoxicity of the active compounds on B16F10 cell sand normal human fibroblasts (NHF) was verified by measuring cell viability compared to those exposed to KA 1. The results indicated that Cu(KMO)2 3a did not exhibit any appreciable cytotoxic activity at a dose of 100 µM. Solid lipid nanoparticles have been suggested as a drug delivery platform for the topical delivery of KDP, because, the natural dissolution of KDP in an oil medium makes it difficult to load pharmacologic doses in a stable penetrative drug delivery system as topical dosage form (Mohammadi 2021). Literature is considered the option of designing, preparing, and characterizing nanoemulsions and liposomes containing oleic acid, a pH-sensitive monounsaturated fatty acid that allows the in vivo administration of oleic acid, which would otherwise be toxic in its free form. and that also has an antimetastatic and anti-inflammatory role in melanoma (Rinaldi et al. 2022). Kojic acid monooleate, however, a non-chelating pyrone-fat conjugate, also has the potential as a tyrosinase inhibitor and results have shown that both kojic monooleate and its nanoemulsion were not cytotoxic against the 3T3 mouse embryonic fibroblast cell line with IC50 > 500 μg mL-1 (Syed Azhar et al. 2018). Fact that coordination complexes of KMO 3 to be a low-cost synthesis, we suggest that this derivative can be a good alternative source to the solid lipid nanoparticles and nanoemulsion of KMO 3 in the drug delivery system as a topical dosage form acting as anti-melanomagenesis.
CONCLUSIONS
The Chelating Pyrone-Fatty Conjugates of iron and cooperation with both of these ligands are new complexes and have not been reported before. It was presented in this study the simple and low-cost synthesis of new complexes as backbone molecules, demonstrably, modifying the biochemistry property of Oleic acid 2 as a tyrosinase inhibitor was positively influenced by the insertion of O, O- chelating group which can reduce melanin in the melanocyte. Therefore, based on the results of the inhibitory effect on the tyrosinase activity and low cytotoxicity of the substance of this study, it is suggested in silico and in vitro experiments and studies on animals to evaluate the potential of and possible application of these molecules as pharmacological agents for melanoma and/or macrophage cells.
ACKNOWLEDGMENTS
The authors are grateful that this research was supported by the Brazilian Agencies FINEP (Financiadora de Estudos e Projetos), FAPESPA (Fundação Amazônia de Amparo e Estudos e Pesquisa), CAPES (Coordenação de Aperfeiçoamento de Pessoal de Nível Superior), and CNPq (Conselho Nacional de Desenvolvimento Científico e Tecnológico) for financial support and scholarship. Also are thankful to FIOCRUZ (Fundação Oswaldo Cruz) for the microorganism strains. The author would like to thank Diego Estumano, Faculdade de Biotecnologia no Programa de graduação em biotecnologia, Instituto de Ciências Biológicas da Universidade Federal do Pará, for the support graphic.
REFERENCES
- AGARWAL RC, GUPTA SP & RASTOGI DK. 1974. Complexing behaviour of kojic acid—studies on its rare earth metal complexes. J Inorg Nucl Chem 36: 208-211.
- ANDO H ET AL. 2006. Intracellular composition of fatty acid affects the processing and function of tyrosinase through the ubiquitin-proteasome pathway. Biochem J 394: 43-50.
- ANDO HY, FUNASAKA MO, FURUMURA AOM, MATSUNAGA J, MATSUNAGA N, HEARING VJ & ICHIHASHI M. 1999. Possible involvement of proteolytic degradation of tyrosinase in the regulatory effect of fatty acids on melanogenesis. J Lipid Res 40: 1312-1316.
- ANDO H, KONDOH H, ICHIHASHI M & HEARING VJ. 2007. Approaches to Identify Inhibitors of Melanin Biosynthesis via the Quality Control of Tyrosinase. J Invest Dermatol 127: 751-761.
- ANDO H, RYU A, HASHIMOTO A, OKA M & ICHIHASHI M. 1998. Linoleic acid and α-linolenic acid lightens ultraviolet-induced hyperpigmentation of the skin. Arch Dermatol Res 290: 375-381.
- ANDO H, WATABE H, VALENCIA JC, YASUMOTO K, FURUMURA M, FUNASAKA Y, OKA M, ICHIHASHI M & HEARING VJ. 2004. Fatty acids regulate pigmentation via proteasomal degradation of tyrosinase: a new aspect of ubiquitin-proteasome function. J Biol Chem 279: 15427-15433.
- ARNOLD M, SINGH D, LAVERSANNE M, VIGNAT J, VACCARELLA S, MEHEUS F, CUST AE, DE VRIES E, WHITEMAN DC & BRAY F. 2022. Global Burden of Cutaneous Melanoma in 2020 and Projections to 2040. JAMA Dermatol 158: 495-503.
- BROZYNA AA, VANMIDDLESWORTH L & SLOMINSKI AT. 2008. Inhibition of melanogenesis as a radiation sensitizer for melanoma therapy. Int J Cancer 123: 1448-1456.
- CARDOSO CR, FAVORETO S JR, OLIVEIRA LL, VANCIM JO, BARBAN GB, FERRAZ DB & SILVA JS. 2011. Oleic acid modulation of the immune response in wound healing: A new approach for skin repair. Immunobiology 216: 409-415.
- CHO K-H, HONG J-H & LEE K-T. 2010. Monoacylglycerol (MAG)-Oleic Acid Has Stronger Antioxidant, Anti-Atherosclerotic, and Protein Glycation Inhibitory Activities than MAG-Palmitic. Acid J Med Food 13: 99-107.
- DA SILVA JUNIOR EM ET AL. 2007. Synthesis and potent antitumor activity of new arylamino derivatives of nor-β-lapachone and nor-α-lapachone. Bioog Med Chem 15: 7035-7041.
- EMAMI S, HOSSEINIMEHR SJ, TAGHDISI SM & AKHLAGHPOOR S. 2007. Kojic acid and its manganese and zinc complexes as potential radioprotective agents. Bioorg Med Chem Lett 17: 45-48.
- FARAG MA & GAD MZ. 2022. Omega-9 fatty acids: potential roles in inflammation and cancer management. J Genet Eng Biotechnol 20: 1-11.
- FERREIRA NR, SARQUIS MIM, ALVES CN & SANTOS AS. 2010. Biotransformation of sucrose into 5-hydroxy-2-hydroxymethyl-γ-pirone by Aspergillus flavus. An Acad Bras Cienc 82: 569-576.
- FINNEGAN MM, LUTZ TG, NELSON WO, SMITH A & ORVIG C. 1987. Neutral water-soluble post-transition-metal chelate complexes of medical interest: aluminum and gallium tris (3-hydroxy-4-pyronates). Inorg Chem 26: 2171-2176.
- GÖSSLING G, REBELATTO TF, VILLARREAL-GARZA C, FERRIGNO AS, BRETEL D, SALA R, GIACOMAZZI J, WILLIAM WN JR & WERUTSKY G. 2023. Current Scenario of Clinical Cancer Research in Latin America and the Caribbean. Curr Oncol 30: 653-662.
- HOLM RH, KENNEPOHL P & SOLOMON EI. 1996. Structural and Functional Aspects of Metal Sites in Biology. Chem Rev 96: 2239-2314.
- HOSSEINIMEHR SJ, EMAMI S, ZAKARYAEE V, AHMADI A & MOSLEMI D. 2009. Radioprotective effects of kojic acid against mortality induced by gamma irradiation in mice. Saudi Med J 30: 490-493.
- ICHIMOTO I & TATSUMI C. 1962. Studies on Kojic Acid Derivatives: The Acylation of Kojic Acid. Bull Univ Osaka Pref Ser B 13: 53-58.
- INNAWONGA B, MALLIKARJUNANA P, IRUDAYARAJB J & MARCYC JE. 2004. The determination of frying oil quality using Fourier transform infrared attenuated total reflectance. Food Sci Technol 37: 23-28.
- JUMBRI K, AL-HANIFF ROZY MF, ASHARI SE, MOHAMAD R, BASRI M & FARD MASOUMI HR. 2015. Optimisation and Characterisation of Lipase-Catalysed Synthesis of a Kojic Monooleate Ester in a Solvent-Free System by Response Surface Methodology. PLoS ONE 10: e0144664.
- KARKESZOVÁ K, MASTIHUBOVÁ M & MASTIHUBA V. 2021. Regioselective Enzymatic Synthesis of Kojic Acid Monoesters. Catalysts 11:1430.
- KWAK SY, NOH JM, PARK SH, BYUN JW, CHOI HR, PARK KC & LEE YS. 2010. Enhanced cell permeability of kojic acid-phenylalanine amide with metal complex. Bioorg Med Chem Lett 20: 738-741.
- LAJIS AF, HAMID M & ARIFF AB. 2012. Depigmenting effect of Kojic acid esters in hyperpigmented B16F1 melanoma cells. J Biomed Biotechnol 2012: 952452.
- LOPES J, RODRIGUES CMP, GASPAR MM & REIS CP. 2022. Melanoma Management: From Epidemiology to Treatment and Latest Advances. Cancers 14: 4652.
- MARWAHA SS, KAUR J & SODHI GS. 1994. Organomercury(II) complexes of kojic acid and maltol: synthesis, characterization, and biological studies. J Inorg Biochem 54: 67-74.
- MOHAMMADI F. 2021. Preparation and evaluation of kojic acid dipalmitate solid lipid nanoparticles. J Cien Tecnol Ent Med 61: 10-28.
- MONTENEGRO RC ET AL. 2010. Cytotoxic activity of naphthoquinones with special emphasis on juglone and its 5-O-methyl derivative. Chem-Biol Inter 184: 439-448.
- PILLAIYAR T, MANICKAM M & NAMASIVAYAM V. 2017. Skin whitening agents: medicinal chemistry perspective of tyrosinase inhibitors. J Enzyme Inhib Med Chem 32: 403-425.
- REIS R DA R ET AL. 2011. Synthesis and anticancer activities of some novel 2-(benzo[d]thiazol-2-yl)-8-substituted-2H-pyrazolo[4,3-c]quinolin-3(5H)-ones. Eur J Med Chem 46: 1448-1452.
- RIMAL V, SHISHODIA S & SRIVASTAVA P K 2020. Novel synthesis of high-thermal stability carbon dots and nanocomposites from oleic acid as an organic substrate. Appl Nanosci 10: 455-464.
- RINALDI F ET AL. 2022. pH-responsive oleic acid based nanocarriers: Melanoma treatment strategies. Int J Pharm 613: 121391.
- RODRIGUES AP, CARVALHO AS, SANTOS AS, ALVES CN, DO NASCIMENTO JL & SILVA EO. 2011. Kojic acid, a secondary metabolite from Aspergillus sp., acts as an inducer of macrophage activation. Cell Biol Int 35: 335-3343.
- RODRIGUES AP, FARIAS LH, CARVALHO AS, SANTOS AS, DO NASCIMENTO JL & SILVA EO. 2014. A novel function for kojic acid, a secondary metabolite from Aspergillus fungi, as antileishmanial agent. PLoS ONE 9: e91259.
- SAEEDI M, ESLAMIFAR M & KHEZRI K. 2019. Kojic acid applications in cosmetic and pharmaceutical preparations. Biomed Pharmacother 110: 582-593.
- SANTOS AS, SOUZA MGS, BARBOSA RNS & FERREIRA NR. 2018. Biotechnological And Semicontinuous Process Of Kojic Acid Production (Pbsc-Hmp) Using Sacarosis As A Source Of Carbon Patente BR102016019091A2. Data do Depósito: 17/08/2016. Data da Publicação: 06/03/2018.
- SLOMINSKI A, ZBYTEK B & SLOMINSKI R. 2009. Inhibitors of melanogenesis increase toxicity of cyclophosphamide and lymphocytes against melanoma cells. Int J Cancer 124: 1470-1477.
- SONVANSHI V, GANDHI K, RAMANI A, SHARMA R & SETH R. 2024. ATR-FTIR coupled with chemometric techniques to detect vanaspati ghee (hydrogenated vegetable oil) adulteration in milk fat. Results Chem 7: 101343.
- SYED AZHAR SNA, ASHARI SE & SALIM N. 2018. Development of a kojic monooleate-enriched oil-in-water nanoemulsion as a potential carrier for hyperpigmentation treatment. Int J Nanomedicine 13: 6465-6479.
- SYNYTSYA A, BLAFKOVÁ P, SYNYTSYA A, ČOPÍKOVÁ J, SPĚVÁČEK J & UHER M. 2008. Conjugation of kojic acid with chitosan. Carbohydr Polym 72(1): 21-31.
- TAZESH S, TAMIZI E, SIAHI SHADBAD M, MOSTAGHIMI N & MONAJJEMZADEH F. 2022. Comparative Stability of Two Anti-hyperpigmentation Agents: Kojic Acid as a Natural Metabolite and Its Di-Palmitate Ester, Under Oxidative Stress; Application to Pharmaceutical Formulation Design. Adv Pharm Bull 12: 329-335.
- THOMPSON KH, CHILES J, YUEN VG, TSE J, MCNEILL JH & ORVIG C. 2004. Comparison of anti-hyperglycemic effect amongst vanadium, molybdenum and other metal maltol complexes. J Inorg Biochem 98: 683-690.
- TOMITA Y, MAEDA K & TAGAMI H. 1992. Melanocyte-stimulating properties of arachidonic acid metabolites: possible role in postinflammatory pigmentation. Pigment Cell Res 5: 357-561.
- WANG W, GAO Y, WANG W, ZHANG J, YIN J, LE T, XUE J, ENGELHARDT UH & JIANG H. 2022. Kojic Acid Showed Consistent Inhibitory Activity on Tyrosinase from Mushroom and in Cultured B16F10 Cells Compared with Arbutins. Antioxidants (Basel) 11: 502.
- YAMADA H, HAKOZAKI M, UEMURA A & YAMASHITA T. 2019. Effect of fatty acids on melanogenesis and tumor cell growth in melanoma cells. J Lipid Res 60: 1491-1502.
- YAMAGUCHI KKL, VEIGA-JUNIOR VF, PEDROSA TN, VASCONCELLOS MC & LIMA ES. 2012. Biological activities of essential oils of Endlicheria citriodora, a methyl geranate-rich lauraceae. Quím Nova 36: 826-830.
- YOON W-J, KIM M-J, MOON J-Y, KANG H-J, KIM G-O, LEE NH & HYUN C-G. 2010. Effect of palmitoleic acid on melanogenic protein expression in murine B16 melanoma. J Oleo Sci 59: 315-319.


