Multipopulation models with quarantine and vaccination To study the spatial spread dynamics of Mpox in the african continent
ABSTRACT
The African continent is facing an unprecedented epidemic due to the spread of mpox. The shortage of vaccines and the lack of quarantine policies for those infected have made it difficult to control the disease. This work presents an analysis of the dynamics of disease spread through a multipopulation compartmental Model SEIR (Susceptible, Exposed, Infectious, and Recovered) and simulates different scenarios of spatial spread of mpox in affected African regions. We propose modified multipopulation Models SEIR and SEIQVR (Susceptible, Exposed, Infectious, Quarantine, Vaccination, and Recovered) to analyze real-world data from the current mpox outbreak in Africa. In this model, we simulate possible scenarios with quarantined and vaccinated populations to propose measures to mitigate the disease.
Keywords:
mpox; multipopulation models; numerical analysis; vaccination; quarantine
1 INTRODUCTION
Mpox is an endemic disease in countries of Central and West Africa, caused by the Monkeypox virus, which belongs to the genus orthopoxvirus and family Poxviridae (which includes the variola virus, the virus used in the smallpox vaccine, and the cowpox virus). The Monkeypox virus was first identified in 1958 in monkeys, despite these primates being its natural hosts. Mpox usually manifests mild symptoms. This virus was first documented in humans in 1970, and outbreaks have been reported in many countries, with most cases confined to endemic areas 9), (21.
According to the WHO (World Health Organization), the epidemic situation of mpox in the world remains worrying, especially due to the spread of a new variant, clade 1b. This strain was initially identified in the Democratic Republic of the Congo (DRC) in 2023 and has since spread to other countries. In August 2024, the WHO declared that the epidemic was a public health emergency of international concern due to the high number of cases, with at least 13 countries reporting confirmed cases of mpox in 2024. The number of cases increased by around 160%, and the number of deaths by 19%, compared to the same period last year. To date, more than 14,000 cases have been recorded, and 524 people have died 27.
During the global mpox outbreak in 2022, which affected more than 70 countries, less than 1% of the infected people died. However, the new variant of the virus, originally from the DRC, appears to have a fatality rate of approximately 3% to 4% 19), (27. Most of the cases occurred in the DRC, which represented almost 96% of infections and deaths, totaling more than 16,000 cases and more than 500 reported deaths. According to the Africa Centers for Disease Control and Prevention (African CDC), 70% of the reported cases in the DRC occurred in children under 15 years of age, with 85% of the recorded deaths. In this region, subclades 1a and 1b are prevalent. Health authorities are particularly concerned about the region experiencing simultaneous outbreaks of other diseases, such as cholera and measles 1.
The new variant, clade 1b, has also been detected outside Africa. In January 2025, China reported a localized outbreak after initially identifying the strain in a foreigner with a travel history to the DRC. Four additional people were infected after close contact with the index case. In the United States, cases of the new strain have been confirmed in several states. In February 2025, the New York State Department of Health confirmed the first case of the new mpox strain, further increasing global concerns about the spread of this little-known variant 24), (25.
The global response faces significant challenges, including limited vaccine availability. Bavarian Nordic, the manufacturer of the MVA-BN (Jynneos) vaccine, announced that it could supply up to 10 million doses by the end of 2025, with the potential to increase production depending on demand and regulatory approvals 4), (23), (27. The WHO and other international organizations continue to monitor the situation and coordinate efforts to contain the spread of mpox, emphasizing the need for continued surveillance, equitable distribution of vaccines, and strengthening of health systems, especially in the most affected countries.
According to the WHO Director General, mpox is present in several countries, with different modes of transmission and varying levels of risk. For example, in the Ivory Coast and South Africa, health authorities reported outbreaks of a different, less dangerous variant of the virus, which spread globally in 2022. In 2024, scientists reported the emergence of a new form of a more lethal variant capable of killing up to 10% of those infected. This variant was detected in a mining town in the DRC in September 2023, and new cases were subsequently reported in several neighboring countries 27.
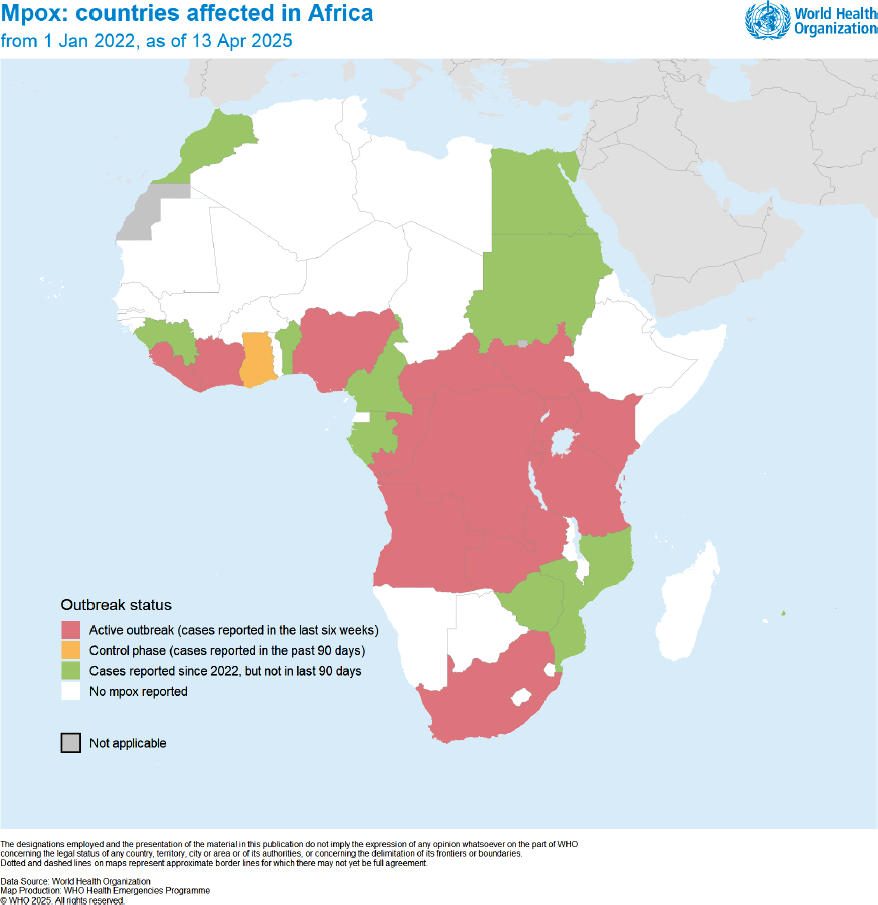
Figure 1 presents the distribution map of mpox cases in regions affected by the disease from January 1, 2022, to April 13, 2025. Following the 2022 outbreak, which affected several countries with viruses from the Clade 1a and Clade 2 families, the African region is once again facing a significant increase in the number of cases due to the emergence of the Clade 1b variant, which has proven to be more lethal than the others.

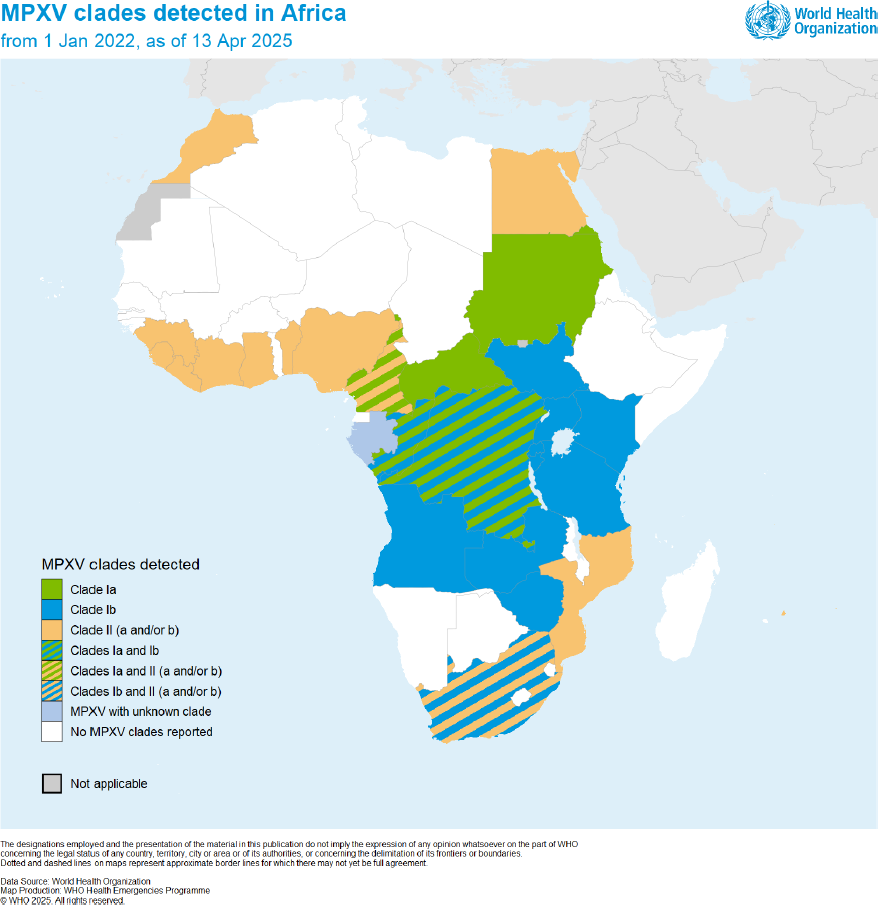
The distinct clades and subclades of mpox are impacting diverse populations in different geographic regions, each exhibiting varied transmission dynamics. Its spread poses a risk to public health and requires a coordinated international response. Clade 1a circulates in several Central African countries and is associated with human-to-human transmission. Clade 1b has recently emerged in the eastern part of the DRC and is undergoing sustained human-to-human transmission 31.
Clade 2a has historically been rarely isolated and documented in humans, with most available genetic sequences coming from animal species. However, more recent transmissions have been recorded in several West African countries 31. Clade 2b, first detected in Nigeria, has been undergoing sustained circulation among humans since at least 2016, causing a large outbreak that has been ongoing since 2022. In 2024, the WHO conducted a global risk assessment, in which clades 1a and 1b present a high risk of transmission and global propagation. Clades 2 and 2b present a moderate risk 31.
The DRC is in a state of alert, as illustrated in Figure 2, as it has registered a significant increase in the number of cases, resulting in the spread of the disease to nearby areas. According to health authorities, this situation is due to a shortage of vaccines for the entire population and the negligence in imposing quarantines in highly affected areas 27. In these maps, it is possible to understand the spatial dynamics of the spread of the disease and the behavior of mpox dispersal according to each clade.

To generate the curves of infected cases, daily cases, and deaths, the real collected data was inserted into Python, allowing us to observe the behavior of the disease in each region. This information presents an overview of the mpox epidemic in Africa. Data on the number of cases and deaths were obtained directly from the weekly bulletins issued by the WHO 31. Some regions, such as Kenya, Burundi, Uganda, the Ivory Coast, and Rwanda, only had their first notified cases in 2024, due to the emergence of a new variant of the virus that began circulating in the region. While other regions such as Nigeria, the DRC, Ghana, Central African Republic, Liberia, Cameroon, and Congo have recorded cases since the start of the global outbreak in 2022 31.
Nigeria and the Central African Republic reported their first cases on January 9, 2022, while the DRC, it presents the highest number of cases, notified its first cases only on May 22, 2022. Despite efforts to contain the outbreak, the emergence of a new variant, the clade 1b, in 2024 led the WHO to once again declare mpox as a global public health emergency. In 2025, there was another increase in the number of cases, affecting several regions. Among the most impacted are the DRC with 18,607 cases, Burundi with 3,751 cases, and Uganda with 5,153 cases 31.
In view of the current mpox scenario on the African continent, this document presents an analytical study of the epidemic in the region. The study will be carried out through the analysis of a multipopulation SEIR epidemiological model, with the objective of generating the curve of accumulated cases in 12 regions selected for the research. In order to propose mitigation measures of the disease, this study also analyzes a modified SEIR model, incorporating vaccination and quarantine, which we will call the model SEIQVR.
This document is divided into several sections, detailing the models developed and their application to the mpox epidemic on the African continent, through multipopulation dynamics. Section 2 presents a mathematical analysis of these models, including the stability of specific equilibrium points for multipopulation models. Section 3 employs models to examine the trajectory of the epidemic under various scenarios in Africa, such as the implementation of vaccination and quarantine.
This includes a comparative analysis of model predictions with real data, allowing us to understand the behavior of the epidemic and its potential for future spread in each scenario. To estimate the numerical parameters of the model, updated data were used to feed Python. Throughout this study, we sought to emphasize the critical role of vaccination, isolation, and rigorous public health interventions in managing and controlling the mpox outbreak in Africa.
2 MULTIPOPULATION MODELS SEIR AND SEIQVR
In this work, we propose the analysis of two epidemiological models: Model SEIR and a modified SEIR (which we call SEIQVR), which includes quarantine and vaccination, with p distinct populations interacting with each other to study the spatial diffusion of mpox.
In this section, a SEIR type model will be analyzed, in which the individuals of the i-th population (where each index i = 1, 2, . . . , n represents a population in a different geographic region, for example, different countries) are divided, at time instant t, into the categories: Susceptible (S i,t ), Exposed (E i,t ), Infectious (I i,t ) and Removed (R i,t ), and the total population of each group is given by . The evolution of the system dynamics over time can be represented by the system of Ordinary Differential Equations (ODE) (2.1).
where β i represents the contagion rate between individuals in population i, while β i,j represents the contagion rate of the individuals in population i for the contact with infected individuals in population j, belonging to the neighborhood j ∈ V i of population i. The birth and death rates are given by µ i , while α i represents the incubation rate (inverse of the incubation period), and γ i the recovery rate (inverse of the mean infectious time) 16. The units of the parameters involved in the model are: . It is important to stress that the SEIR model does not consider deaths from the disease explicitly. By neglecting the disease deaths, individuals die from causes not related to mpox at a rate µ i . Since we consider, for simplicity, that the birth and death rates are equal, adding the equations of the system (2.1), we obtain
Therefore, it follows that is a constant for all t. Furthermore, . Figure 3 presents the population transition flowchart in the compartments.

This multipopulation model was used to investigate the dynamics of the mpox epidemic in Africa, with an emphasis on its behavior before the availability of vaccines. The second model incorporates control measures through compartment quarantine and vaccination, allowing for the analysis of quarantine and vaccine effectiveness in controlling the epidemic. For that, the virus reproduction rate (R 0) will be analyzed, since, in a single population, if R 0 < 1, the disease will disappear; if R 0 > 1, an epidemic will occur; and if R 0 = 1, the disease will become endemic 11.
To estimate this parameter, data from the mpox epidemic were used to feed the EpiEstim application from Imperial College London5, allowing the generation of the value of R 0 in a weekly time window.
However, in multipopulation models, this will be replaced by a matrix. The disease’s behavior, whether increasing or decreasing, depends on the eigenvalues of this matrix. Determining this parameter from reliable epidemiological data allows public health authorities to develop and implement effective strategies for controlling outbreaks and preventing future epidemics. The analysis of R 0 for a multipopulation model will be studied in the next section, providing a more realistic understanding of disease spread in interacting populations.
2.1 Stability Analysis for the Multipopulation SEIR Model
The stability analysis of the nonlinear System (2.1) was carried out based on work in 8), (20. To do so, the transmission dynamics between subpopulations were represented through the infection matrix β [B ij ], where β denotes the infection rate and [B ij ] describes the interaction between subpopulations. The equilibrium points and stability of the model described by the system of equations (2.1), normalized to a single population, can be found in 28. Thus, this study proposes stability analysis for populations with i = 2.
2.1.1 Stability Analysis for the two Populations Model
With the aim analyze the stability of the System (2.1) for two populations, the equations referring to the compartments S, E, I, and R were decoupled and normalized, resulting in the following system.
where , e , with i = 1, 2. To make time dimensionless, we define τ as a function of the rates α 1 , α 2 , µ 1 , µ 2 , γ 1 and γ 2, which represent, respectively, the incubation rates, mortality rates and recovery rates of 2 populations. Like this, we have , which defines the time scale based on the combined incubation, mortality, and recovery rates in the two groups. Furthermore, the population fraction of the first and second populations is represented, respectively, by and . In this analysis, the compartment of the population of recovered individuals is disregarded, since the total population is constant and the value of r can be determined by the relation r = 1 −s−e−ι. Thus, the following model is obtained:
where,
and
The stability analysis of the System (2.4) is done through the coefficient matrix, and is given by the Jacobian Matrix applied in theequilibrium. The Jacobian Matrix for the System (2.4) is given by:
To determine the equilibrium points, one needs to determine the values of s, e, i, and r that satisfy e . Considering the equilibrium point . Substituting this point in the Jacobin Matrix (2.6), we obtain:
For this system, it turns out thatthree of the eigenvalues are represented by δ i , which are inherently negative due to µ i , α i , and γ i being positive numbers. Therefore, we evaluate the stability of the system as follows:
the trace and determinant by of the System (2.8) is given by:
with . We have that the System (2.1) is locally asymptotically stable at the equilibrium point if all eigenvalues of the Jacobian matrix evaluated at the point equilibrium have a negative real part. For two dimensional systems, this condition is guaranteed by the Hurwitz criterion 18, establishes states that local stability occurs if and only if tr(J) < 0 e det(J) > 0, otherwise, that is, if any of the above conditions is not satisfied, the solutions of the system diverge from the equilibrium point , characterizing local instability 13), (26), (29. From an epidemiological point of view, this divergence indicates a transition from a controlled state to an endemic situation, characterized by the recurrent occurrence of epidemic outbreaks.
2.2 Multipopulation Model With Vaccination
With the aim contain the increase in the number of cases, Africa began vaccination campaigns against mpox in September 2024 10. Thus, it is expected that the population in the susceptible compartment will decrease throughout the campaign, since part of these individuals are transferred directly to the “Vaccinated” or immunized class. To analyze the effectiveness of vaccination, we include the Vaccinated compartment (V i,t ) in the Model (2.1). Figure 4 displays the schematic diagram that describes the transition dynamics between the compartments of the model. The total population of each group is now given by . It is assumed, for simplicity, it is assumed that the total population is constant, the analysis is analogous to what was done for the system (2.1). The system of differential equations that describes the dynamics of the model with the inclusion of vaccination is given by:
where φ i represents the vaccination rate. Considering that the vaccine is not fully effective 12, there is still the possibility that a small portion of the population will contract mpox, even after previous infection or vaccination 12), (14. This possibility occurs with transmission rate εβ B i j , where 0 ≤ ε ≤ 1 is the vaccine ineffectiveness coefficient, and Φ = 1 − ε represents its effectiveness. When ε = 0, vaccinated individuals don’t get infected; in other words, the vaccine is perfectly effective, with Φ = 1. On the other hand, if ε = 1, vaccinated individuals can become infected in the same way as susceptible individuals, which means that the vaccine offers no protection at all, in other words, Φ = 0 3), (7.

Flowchart of the SEIVR model; the diagram illustrates the transition dynamics between compartments.
2.2.1 Stability Analysis in a Model With Vaccination for Two Populations
With the aim of analyzing the stability of the System (2.11) for two populations, the equations were decoupled and normalized, resulting in the following system.
with , with i = 1, 2. For the stability analysis of the Model (2.12), we use the same parameterizations used in the (2.1.1) subsection. Thus, we obtain the following model:
where,
The stability analysis of the System (2.13) is done through the coefficient matrix, and is given by the Jacobian Matrix applied at the equilibrium points. Considering the break-even point
The stability analysis of System (2.15) will be performed in a manner analogous to that presented in the subsection (2.1.1). Thus, the trace and determinant of System (2.15) is given by:
When considering ε = 1, we obtain Φ = 0, which characterizes an ineffective vaccination. In this case, Equations (2.16) and (2.17) begin to exhibit the same behavior as Equations (2.9) and (2.10) of the System (2.1), corresponding to the dynamics of two populations without vaccination.
In this analysis, it is observed that the stability of the system, that is, the growth rate of the epidemic associated with the System (2.11) is always lower than that corresponding to the System (2.1). This result allows us to assess the impact of vaccination on controlling the spread of the epidemic. Such behavior occurs under the condition that det(J) > 0 for both Systems (2.1) and (2.11), and what tr(J)(2.1) ≥ tr(J)(2.11).
2.3 Multipopulation Model With Vaccination and Quarantine
In this subsection, we present a multipopulation compartmental model of the SEIQVRD type, extended to include quarantine, vaccination, reinfection, dynamics between subpopulations, and mobility between regions. We used this model to evaluate vaccination and quarantine strategies in the context of the mpox epidemic in Africa. This framework is particularly valuable for investigating the impact of non-pharmacological interventions, such as quarantine, in mitigating the spread of mpox. The explicit inclusion of a quarantine compartment allows for precise quantification of the contribution of isolating infected individuals to reducing disease transmission.
The rate γ i represents the transition of infected individuals to the quarantine state, while ω i models the recovery rate in that same state, and κ i corresponds to the mortality rate. The susceptible population is vaccinated at a rate ϕ i ; however, due to the ineffectiveness of vaccination, represented by ε, a small portion of those vaccinated may not acquire immunity. Like this, effective immunization occurs at a rate Φ. Thus, the model allows simulating scenarios in which increased efficiency in early case detection and isolation directly impacts the dynamics of the epidemic. Figure 5 illustrates the compartmental scheme that describes the dynamics of the Model SEIQVRD.

Flowchart of the Model SEIQVRD, illustrating the transitions between population compartments. The immunized compartment refers to the portion of the population that acquires immunity through vaccination or after hospital discharge.
Another relevant aspect is inter-regional mobility, represented by the sum over J ∈ V i , which incorporates the effect of interaction between different locations. This factor is essential for analyzing how quarantine in a given region can influence, or be influenced by, neighboring regions - especially in urban contexts or in countries with high connectivity between cities.
Furthermore, the equation corresponding to the population of recovered individuals incorporates the possibility of reinfection, mediated by the presence of infected individuals and modulated by a rate ε. This approach allows us to represent scenarios in which acquired immunity is temporary or incomplete-a crucial aspect for formulating long-term control strategies. The total population of each group, including people killed by mpox, is given by . For simplification, as in the case of the SEIR model, by assuming that the birth and death rates are equal to µ i , the total population remains constant over time, that is, N i,t = N i . The system of differential equations that describes the dynamics of the model, considering the inclusion of quarantine, is given by:
Additionally, it is possible to dynamically characterize the groups of individuals discharged from hospitals and those vaccinated. To do this, the following equations are introduced into the model:
where A i represents the hospital discharge of a patient after being cured of the disease, becoming immune, while V i represents the portion of the population that acquires immunity through vaccination.
2.3.1 Stability Analysis in a Model With Vaccination and Quarantine for two Populations
The stability analysis of the Model (2.18) will be conducted in a manner analogous to that presented in the subsection (2.2.1). For the System (2.18), considering two populations, the equations were decoupled and normalized, resulting in the following system:
with , with i = 1, 2. For the stability analysis of the Model (2.20), we use the same parameterizations used in the subsection (2.1.1). Thus, we obtain the following model:
where,
The stability analysis of the System (2.21) is done through the coefficient matrix, and is given by the Jacobian Matrix applied at the equilibrium points. To determine the equilibrium points, one needs to determine the values of s i , e i , i i , q i and r i that satisfy and .
Therefore the equilibrium point for the System (2.21) is as follows:
By substituting the equilibrium point (2.23), the following matrix is obtained.
Thus, the trace and determinant of the System (2.24) are given by:
and
In this analysis, the epidemic growth rate associated with the System (2.18) is always lower than that corresponding to the System (2.1). Such behavior is observed under the condition that det(J) > 0 for both Systems (2.7) and (2.24), and that tr(J)(2.7) ≥ tr(J)(2.24). It can be seen that the stability of the system with vaccination and quarantine presents similarities to the model that considers only vaccination. However, it is possible to note that the parameter η acts as a regulator.
In Model (2.13), η represents the recovery rate of individuals who are not subjected to control measures, while in Model (2.21), it corresponds to the rate of individuals who enter isolation. This parameter is fundamental for adjusting the values of the trace and the determinant of the System (2.21), which highlights the relevance of quarantine in models with vaccination in an attempt to mitigate the spread of the disease.
3 NUMERICAL RESULTS: MPOX IN AFRICA
The explicit Euler method was implemented computationally to solve the Model (2.18) through finite differences, with the objective of generating the curves of infected people over time, using a time step of dt = 0.1 days. This value was chosen to ensure sufficient conditions to preserve the stability properties of the model’s equilibrium points 6. The study aims to analytically analyze the dynamics of the mpox epidemic on the African continent, considering the scenarios before and after the vaccination campaign carried out in the region, using the clinical parameters in Table 2. For the parameter β i,j , we consider that a fraction of 0.001 of individuals interact with individuals from neighboring regions, resulting in a fast diffusion of the disease and generating the curve of accumulated infected cases in 12 African regions, where population groups interact with each other. The initial conditions and populations in the affected regions are described in Table 1, obtained from 30. The number of cases was obtained directly from the data source at 31.
3.1 Mpox Cases in Africa Before the Vaccination Campaign
In this subsection, we analyze the behavior of mpox on the African continent. To do so, we use the Model (2.1) to generate curves of infected cases up to the start date of vaccination campaigns in the regions affected by the disease. In this context, we employ the basic reproductive number, R 0, for mpox in the studied period. The value of R 0 considered in this case study refers to the System (2.1) with n = 1, resulting in:
Figure 6 presents the graph of the values, R 0, estimated from daily case data using the EpiEstim application, developed by Imperial College London 5. It is observed that the highest R 0 values occurred at the beginning of the outbreak, exceeding 5.0, which prompted the WHO to declare mpox a Public Health Emergency of International Concern (PHEIC). This declaration was in effect from July 23, 2022, to May 10, 2023.

After the implementation of the intervention, a significant reduction in the values of R 0 was observed, which remained in the range 0 < R 0 ≤ 1 during the emergency period. However, with the emergence of a new variant of the virus, characterized by greater transmissibility and lethality, new peaks of R 0 close to 2.0 were recorded in the months of October 2023 and January 2024, followed by smaller elevations in April and May 2024. This dynamic created favorable conditions for the persistence of the disease for a longer period.
Between June 2024 and April 2025, the values of R 0 remained in the range between 1 and 2, showing a smooth downward trend. The sharpest reduction is observed from November 2024, coinciding with the start of vaccination campaigns in the regions most affected by the disease, which began in September 2024.
The System (2.4), for the case n = 1, admits two equilibrium points: one disease-free and the other endemic 28. When R 0 < 1, the solutions of the system converge asymptotically to the disease-free equilibrium. On the other hand, if R 0 ≥ 1, the solutions tend toward the endemic equilibrium, allowing the epidemic to persist 11. During the analysis period, it was observed that the number of susceptible and infected individuals fluctuated over time, resulting in the disappearance and subsequent reappearance of mpox. This behavior is characteristic of endemic diseases, which recur even after periods of apparent eradication.
To simulate the data from the current mpox epidemic in Africa, we used the parameters described in Table 2. All actual data on the mpox epidemic in Africa were collected directly from the case spreadsheet available at 31. For this case study, we considered the populations of each region through 30. The parameter β was estimated by analyzing the virus reproduction number, R 0.
Figure 7 presents the infected curve of the current mpox epidemic in 12 African regions. It can be seen that the number of cases grew almost linearly during the period in which monitoring was intensified, a result of efforts by health organizations to mitigate the disease in endemic regions.

Comparative analysis between the observed mpox case data and the projections generated by Model (2.1), over the period from January 2022 to September 2024.
An important observation in this analysis is that, shortly after the PHEIC declaration was closed and a new variant emerged, there was a sharp increase in the number of cases, with most of them concentrated in the DRC. This scenario led the WHO to re-declare the PHEIC. Among the main strategies adopted in this new phase are: emergency approval of vaccines, a request to diagnostic test manufacturers to submit their applications with the utmost urgency, and an appeal to wealthier nations for support, especially in the acquisition of vaccines for the poorest regions of Africa.
Based on the analysis of the R 0, presented in Figure 6, and the simulation with real mpox data illustrated in Figure 7, it is observed that the model described in Equation (2.1) presents good agreement with the observed data of accumulated mpox cases in the African regions considered in this study. Furthermore, the results indicate that, in the absence of interventions such as vaccination and quarantine, the trend is for continued growth in the number of cases, resulting in a prolongation of the epidemic in the region. Next, the simulations will consider vaccination interventions. To this end, the Model (2.11) will be analyzed to assess the impact of this strategy on controlling the current mpox epidemic in Africa.
3.2 Mpox Vaccination Strategies in Africa
Vaccination campaigns against mpox began in September 2024. Even with the proven effectiveness of available vaccines in preventing the disease, public health authorities on the African continent face a series of significant obstacles to the effective implementation of vaccination. Between the main challenges that stand out are vaccine shortages, barriers to access to immunizers, high costs involved, regulatory gaps, and the logistical complexity related to distribution in remote areas. Furthermore, the circulation of a new, more virulent variant of the virus, clade 1b, further aggravates the epidemiological scenario, reinforcing the urgency of effective and comprehensive vaccination strategies.
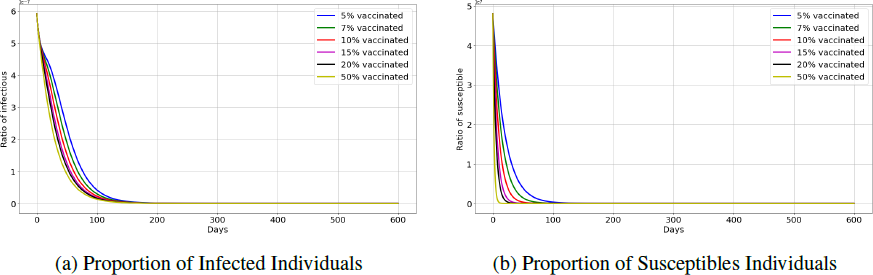
Given this context, we propose an analysis of the Model (2.11) with the aim of estimating the impact of vaccination on mpox control in regions affected by the disease. To gain a more in-depth understanding of the influence of vaccination on the dynamics of mpox transmission in the most affected areas of the African continent, we carried out a series of numerical simulations using the Model (2.11). In these simulations, we consider that the vaccine is not fully effective. Like this, In order to keep the scenarios compatible with reality, we estimate the temporal evolution of the fractions of susceptible (uninfected and non-immune) and infected individuals in the population, varying vaccination rates and assuming a vaccine efficacy of 80% 12. The results of these simulations are presented in Figure 8, where the vaccination rate was varied from 5% to 50%, in accordance with the continental mpox response plan proposed by the Africa CDC 2.

Solution of Model (2.11): Dynamics of the mpox epidemic considering different vaccination rate.
In Figure 8a, we present the scenario with different vaccination rates. It can be seen that, as the vaccination rate increases, the proportion of infected individuals decreases, which is an expected result in vaccination campaigns during epidemics. Already in Figure 8b, it is possible to observe that, as the population is vaccinated, there is a decrease in the proportion of susceptible individuals, indicating the effectiveness of vaccination in reducing population vulnerability to the disease.
This analysis allows us to observe that expanding vaccination coverage plays a fundamental role in the epidemiological dynamics of the disease. The results of the simulations, considering different vaccination rates (5%, 7%, 10%, 15%, 20%, 50%) and a vaccine efficacy of 80%, indicate that the increase in the vaccination rate is directly associated with the reduction of the infected population and the decrease in the number of susceptible individuals. As more individuals are vaccinated, the spread of the pathogen is progressively contained, even in scenarios with connectivity between multiple populations. These findings reinforce the importance of vaccination campaigns as an essential strategic measure for controlling the disease and reducing the epidemiological burden in different regions.
It took place a sensitivity analysis of the SEIVR model was performed to assess the impact of vaccine efficacy on disease dynamics. For that, simulations were conducted varying the vaccine efficacy rate between 70% and 90%, while the vaccination rate was kept constant at 7% of the total population 12. The simulations accompanied the temporal evolution of the proportions of susceptible and infected individuals throughout the study period.
The results presented in Figure 9 show a significant reduction in the fraction of actively infected individuals with the increase in vaccine efficacy, highlighting the fundamental role of this variable in containing viral transmission.

Solution of Model (2.11), illustrating the dynamics of the mpox epidemic under different levels of vaccine efficacy.
Such findings highlight the relevance of vaccines with high efficacy and broad coverage for the control of infectious diseases, especially in scenarios of sustained transmission.
3.3 Impact of Vaccination and Quarantine as Strategies to Mitigate Mpox Transmission in Africa
The System (2.18) models the impact of vaccination on the dynamics of the susceptible population (S i ), describing its transition to the immunized group (R i ) as individuals develop immunity after vaccine administration.
We used the Model (2.18) to simulate vaccination dynamics in African regions affected by mpox. The data used in the simulations considers the period from September 2024-the start of vaccination campaigns-to March 31, 2025. The vaccination rates used in the simulations were estimated based on recent data on vaccination coverage in the region, according to the guidelines and projections established by the Continental Response Plan Mpox 2.0 2. This scenario allows us to assess the potential impact of vaccination on controlling the mpox epidemic on the African continent. Table 3 presents the parameters used in each simulation scenario.
Figure 10 illustrates the impact of vaccination from April 2024 to March 2025. With the aim understand the influence of vaccination on mpox control, simulations were conducted considering a scenario of dose shortages and logistical difficulties in distribution, factors that compromise the response to the outbreak on the African continent. Different scenarios were analyzed, in which the dynamics of the disease were evaluated based on the curve of infected individuals, considering vaccination rates between 10% and 50% and vaccine efficacy ranging from 0% to 90%.

Figure 10a presents the evolution of the disease based on the cumulative curve of confirmed cases, while Figure 10b describes the dynamics of the disease through the curve of daily cases.
Despite the numerous challenges faced by health organizations in implementing vaccination campaigns in Africa and the persistently low vaccination coverage in the region, the results obtained indicate that vaccination, combined with increased testing and quarantine of infectious individuals, has a significant impact on controlling mpox. Such an effect is evidenced by the simulations presented, with Figure 11 illustrating the evolution of the R 0 throughout the vaccination period, revealing a significant reduction in this indicator.

The results obtained indicate that expanding vaccination coverage plays a decisive role in efforts to mitigate the mpox epidemic in the regions analyzed. The analysis shows that even vaccines with low efficacy, when associated with a high coverage rate, contribute significantly to containing transmission. It is observed, nonetheless, that the effectiveness of vaccination is enhanced by increasing the proportion of immunized individuals. It should be noted that, in the absence of vaccination, the number of infected individuals shows exponential growth.
4 CONCLUSION
This research concentrated on studying the transmission dynamics of the mpox epidemic in Africa, which started in 2022 and is still ongoing. For that, we began our analysis by studying the multipopulation models that include compartments of vaccinated individuals and quarantined individuals, investigating the equilibrium points and the influence of the R 0 on the stability of the systems for two populations.
Based on the results obtained, we conclude that the interventions implemented by health authorities-such as vaccination, quarantine, and reducing the contact rate-are highly effective in containing the epidemic. Our study was based on the development of two mathematical models derived from a classical Model SEIR, extended to multiple interacting populations, explicitly incorporating the effects of vaccination and quarantine. This approach allowed us to assess the impact of vaccination on susceptible populations and the role of quarantine in controlling infectious individuals.
Additionally, we examined the relationship between vaccination effectiveness and the vaccination rate needed to contain the disease, based on data collected directly from the Africa CDC and WHO. This calibration allowed the models to adhere to real data, providing support for decision-making by public health authorities.
The results of this research have relevant implications for the development of effective epidemiological strategies, as they present an approach capable of simulating different scenarios of disease proliferation and indicate the most efficient measures for its containment. It should be noted that Africa faces a series of structural challenges that hinder the implementation of mitigation measures, aggravated by the emergence of new variants of the virus. Given this context, it was feared that negligence regarding mpox could result in a health crisis of similar proportions to the COVID-19 pandemic.
Thus, this study sought to apply this innovative strategy, already effectively applied by several authors in the study of COVID-19, to model the dynamics of mpox, with the aim of preventing new infections, reducing transmission, and avoiding the spread of the disease to other regions of the world. In a global scenario marked by the continuous emergence of infectious agents responsible for epidemics and pandemics, causing elevated morbidity and mortality, research like this is extremely important. They not only contribute to the improvement of existing disease control strategies but also provide a solid foundation for adapting models to new pathogens that may emerge.
Data availability
All data generated or analysed during this study are included in this published article.
REFERENCES
-
1 AP. WHO declares mpox outbreaks in Africa a global health emergency as a new form of the virus spreads. Disponível em Disponível em https://apnews.com/article/who-mpox-africa-health-emergency-cc9bdf31b49d06bec5efd44fb55d5e42 (2024). Accessado em 03 de junho de 2025.
» https://apnews.com/article/who-mpox-africa-health-emergency-cc9bdf31b49d06bec5efd44fb55d5e42 -
2 A. CDC & WHO. MPOX CONTINENTAL RESPONSE PLAN 2.0. Disponível em Disponível em https://africacdc-org.translate.goog/download/mpox-continental-response-plan-2-0/?_x_tr_sl=en&_x_tr_tl=pt&_x_tr_hl=pt&_x_tr_pto=wa (2025). Accessado em 03 de junho de 2025.
» https://africacdc-org.translate.goog/download/mpox-continental-response-plan-2-0/?_x_tr_sl=en&_x_tr_tl=pt&_x_tr_hl=pt&_x_tr_pto=wa -
3 M.M. Christodoulidou & N.A. Mabbott. Efficacy of smallpox vaccines against Mpox infections in humans. Immunotherapy Advances, 3 (2023), 1-9. doi: https://doi.org/10.1093/immadv/ltad020
» https://doi.org/10.1093/immadv/ltad020 -
4 CNBC. Mpox vaccine maker Bavarian Nordic seeks ‘critical’ EU approval for teens after WHO declares health emergency. Disponível em Disponível em https://encurtador.com.br/bviE (2024). Accessado em 03 de junho de 2025.
» https://encurtador.com.br/bviE -
5 A. Cori, Z. Kamvar, J. Stockwin, T. Jombart, E. Dahlqwist, R. FitzJohn, R. Thompson, R. Nash, J. Wardle & S. Bhatia. EpiEstim v2.2-4: A tool to estimate time varying instantaneous reproduction number during epidemics. Disponível em Disponível em https://github.com/mrc-ide/EpiEstim (2022). Accessado em 10 de junho de 2025.
» https://github.com/mrc-ide/EpiEstim -
6 F. Dayan & M. Iqbal. Construction and Analysis of a Nonstandard Computational Method for the Solution of SEIR Epidemic Model. Scientific Inquiry and Review, (2023), 1-24. doi: https://doi.org/10.32350/sir.71.06
» https://doi.org/10.32350/sir.71.06 -
7 N.P. Deputy, J. Deckert, A.N. Chard, N. Sandberg, D.L. Moulia., E. Barkley, A.F. Dalton, C. Sweet, A.C. Cohn, D.R. Little, A.L. Cohen, D. Sandmann, D.C. Payne, J.L. Gerhart & L.R. Feldstein. Vaccine Effectiveness of JYNNEOS against Mpox Disease in the United States. The new england journal of medicine, 388(26) (2023), 2434-2443. doi: https://doi.org/10.1056/NEJMoa2215201
» https://doi.org/10.1056/NEJMoa2215201 -
8 R.G. Díaz., W.M. Lezca., I.A. Ugalde., J.B. Castillero., K. Vajravelu. & D. Guinovart. Multipopulation mathematical modeling of vaccination campaign of COVID-19 in Cuba. International Journal of Modelling and Simulation, (2025), 1-23. doi: https://doi.org/10.1080/02286203.2025.2457762
» https://doi.org/10.1080/02286203.2025.2457762 - 9 F.J. Fenner, D.A. Henderson, I. Arita, Z. JeZek & I. Ladnyi. “Smallpox and its Eradication”. World Health Organization, Genebra (1988).
-
10 G1. Vacinas contra mpox começam a ser aplicadas na África. Disponível em Disponível em https://oglobo.globo.com/saude/noticia/2024/09/19/vacinas-contra-mpox-comecam-a-ser-aplicadas-na-africa.ghtml (2024). Accessado em 03 de junho de 2025.
» https://oglobo.globo.com/saude/noticia/2024/09/19/vacinas-contra-mpox-comecam-a-ser-aplicadas-na-africa.ghtml -
11 J. Giesecke. “Modern Infectious Disease Epidemiology”. CRC Press, Florida (2017). doi: https://doi.org/10.1201/9781315222714
» https://doi.org/10.1201/9781315222714 -
12 Jynneos. The FIRST FDA-Approved and ACIP-Recommended Mpox Vaccine. Disponível em Disponível em https://jynneos-com.translate.goog/?_x_tr_sl=en&_x_tr_tl=pt&_x_tr_hl=pt&_x_tr_pto=tc (2024). Accessado em 03 de junho de 2025.
» https://jynneos-com.translate.goog/?_x_tr_sl=en&_x_tr_tl=pt&_x_tr_hl=pt&_x_tr_pto=tc - 13 H.K. Khalil. “Nonlinear Systems 3rd ed”. Prentice Hall, New Jersey (2002).
-
14 T. Li, Z. Li, Y. Xia, J. Long & L. Qi. Mpox reinfection: A rapid systematic review of case repor. Infectious Medicine, (2024). doi: \url{https://doi.org/10.1016/j.imj.2024.100096}.
» https://doi.org/10.1016/j.imj.2024.100096 - 15 T.M. Mack, D.B. Thomas, A. Ali & M.M. Khan. Epidemiology of smallpox in west Pakistan: I.Acquired Immunity and the distribution of disease. American Journal of Epidemiology, 95(2) (1972), 157-168.
-
16 J.C. Marques, A. Cezaro & M.J. Lazo. A SIR Model with Spatially Distributed Multiple Populations Interactions for Disease Dissemination. Trends in Computational and Applied Mathematics, 23(1) (2022), 143-154. doi: https://doi.org/10.5540/tcam.2022.023.01.00143
» https://doi.org/10.5540/tcam.2022.023.01.00143 -
17 F. Miura, C.V. Ewijk, J. Backer, M. Xiridou, E. Franz, E.O. de Coul, D. Brandwagt, B.V. Cleef, G.V. Rijckevorsel, C. Swaan, S.V. den Hof & J. Wallinga. Estimated incubation period for monkeypox cases confirmed in the Netherlands, May 2022. Euro Surveill, (2022). doi: \url{10.2807/1560-7917.ES.2022.27.24.2200448}.
» https://doi.org/10.2807/1560-7917.ES.2022.27.24.2200448 - 18 J.D. Murray. “Mathematical Biology, Interdisciplinary Applied Mathematics, vol. 17”. Springer-Verlang, Berlin (1993).
-
19 M.P.H.N. Ndembi, O.F. Morenike, M.D.A. Komakech, K. Mercy, S. Tessema, M.D.P. Mbala-Kingebeni, M.D.C. Ngandu, M.D.N. Ngongo, M.D.J. Kaseya & S.A.K.M.B. Salim. Evolving Epidemiology of Mpox in Africa in 2024. The new england journal of medicine , 392(7) (2025), 666-676. doi: https://doi.org/10.1056/NEJMoa2411368
» https://doi.org/10.1056/NEJMoa2411368 -
20 N. Nuraini, K.K. Sukandar, P. Hadisoemarto, H. Susanto, A.I. Hasan & N. Sumarti. Mathematical models for assessing vaccination scenarios in several provinces in Indonesia. Infectious Disease Modelling, (2021), 1236-1258. doi: https://doi.org/10.1016/j.idm.2021.09.002
» https://doi.org/10.1016/j.idm.2021.09.002 -
21 OMS. Multi-country monkeypox outbreak in non-endemic countries. Disponível em Disponível em https://www.who.int/emergencies/disease-outbreak-news/item/2022-DON385?utm_.com (2022). Accessado em 03 de junho de 2025.
» https://www.who.int/emergencies/disease-outbreak-news/item/2022-DON385?utm_.com -
22 W.H. Organization. Monkeypox. Disponível em Disponível em https://www.who.int/en/news-room/fact-sheets/detail/monkeypox (2022). Accessado em 03 de junho de 2025.
» https://www.who.int/en/news-room/fact-sheets/detail/monkeypox -
23 POLITICO. Bavarian Nordic asks EU to extend mpox shot license to adolescents. Disponível em Disponível em https://www.politico.eu/article/bavarian-nordic-eu-extend-mpox-shot-imvanex-license-adolescents/ (2024). Accessado em 03 de junho de 2025.
» https://www.politico.eu/article/bavarian-nordic-eu-extend-mpox-shot-imvanex-license-adolescents/ -
24 Reuters. China discovers cluster of new mpox strain. Disponível em Disponível em https://www.reuters.com/business/healthcare-pharmaceuticals/china-discovers-cluster-new-mpox-strain-2025-01-09/?utm_ (2025). Accessado em 03 de junho de 2025.
» https://www.reuters.com/business/healthcare-pharmaceuticals/china-discovers-cluster-new-mpox-strain-2025-01-09/?utm_ -
25 Reuters. New York health department confirms first case of new mpox strain. Disponível em Disponível em https://encurtador.com.br/bdOi (2025). Accessado em 03 de junho de 2025.
» https://encurtador.com.br/bdOi - 26 E.J. Routh. “A Treatise on the Stability of a Given State of Motion”. Macmillan, London (1877).
-
27 RTP. Mpox. Fabricante dinamarquês da vacina quer aprovação para adolescentes. Disponível em Disponível em https://encurtador.com.br/PoYG (2024). Accessado em 03 de junho de 2025.
» https://encurtador.com.br/PoYG - 28 A.M.O. Santos. “Aplicação de um modelo matemático SEIR com quarentena e vacinação para o estudo da MPOX no Brasil”. Dissertação de mestrado, Programa de Pós-Graduação em Modelagem Matemática da Universidade Federal de Pelotas, Pelotas, RS (2023).
- 29 S.H. Strogatz. “Nonlinear Dynamics and Chaos 2rd ed”. CRC Press, New York (2019).
-
30 WHO. World Health Organization: Data. Disponível em Disponível em https://data.who.int/countries/ (2024). Accessado em 03 de junho de 2025.
» https://data.who.int/countries/ -
31 WHO. Global Mpox Trends. Disponível em Disponível em https://worldhealthorg.shinyapps.io/mpx_global/#26_Case_definitions (2025). Accessado em 03 de junho de 2025.
» https://worldhealthorg.shinyapps.io/mpx_global/#26_Case_definitions
Data citations
WHO. World Health Organization: Data. Disponível em Disponível em https://data.who.int/countries/ (2024). Accessado em 03 de junho de 2025.

 Source: WHO
  Source: WHO