 A new method for probabilistic risk analysis of earth dams
Abstract
This paper presents a novel methodology for probabilistic failure risk analysis of earth dams based on the use of event trees. This approach is designed to eliminate low-relevance failure risks, thereby enabling engineers to concentrate on the detailed characterization of critical risks. The proposed methodology integrates probabilistic load characterization, reliability analyses of dam subsystems, and consequence assessments. The application of the method to a dam under construction on the Camanducaia River (São Paulo, Brazil) demonstrated its effectiveness; the filtering process reduced the number of analyzed risks by 67% (from 9 to 3). The quantitative results indicate that piping is the predominant failure mode, exhibiting a failure probability of 9.81×., under standard operating conditions. The probability of overall failure was determined to be for dry weather and for rainy conditions. The number of incremental fatalities ranged from 29 to 51 depending on the reservoir level and failure mode. A review of international guidelines revealed notable discrepancies. Specifically, risks were deemed acceptable under the guidelines of the USBR (2011) and USACE (2014), yet were not permitted under ANCOLD (2003). These findings underscore the notion that low failure probabilities do not invariably align with acceptable risk levels, thereby reinforcing the need for a comprehensive risk evaluation.
Keywords:
Dam safety; Risk analysis; Event tree analysis; Risk acceptability; Earth dam
1. Introduction
In the context of dams, it can be said that risk analysis has been evolving since the 1970s (Hartford et al., 2016). However, it is only since the 2000s, due to the publication of various guidelines (ANCOLD, 2003; CDA, 2013; Environment Agency, 2013; SPANCOLD, 2013; USBR, 2003, 2019), that the subject has been consolidated as being fundamental to dam safety. In this context, various methodologies have been reported by different authors (Baecher & Christian, 2003; Morales-Nápoles et al., 2014; Bowles & Needham, 2017; Lacasse et al., 2022; Zhang et al., 2022; D’Hyppolito et al., 2024).
Risk analysis methodologies can be divided into three types: qualitative, semi-quantitative, and quantitative (or probabilistic) methodologies. Qualitative analyses use a descriptive scale to represent the frequency of failure modes and the severity of possible consequences; in semi-quantitative analyses, values are assigned to the qualitative scales; however, in probabilistic analyses, it is necessary to mathematically characterize the frequencies and potential consequences of failure modes (Rausand, 2011).
The main objective of this study is to present a new methodology for analyzing the risk of failure of earth dams with a probabilistic bias based on event trees. This paper also presents an estimate of the probability of failure of large Brazilian dams, to establish benchmark values for failure risk analysis for earth dams.
2. Brazilian dam failures
In Brazil, the documentation of accidents and incidents involving dams is extremely scarce. The Brazilian Dams Committee (CBDB) published a study on dam accidents and incidents in Brazil (CBDB, 2021). The study shows that in a selection of 166 accident cases, only 40% have adequate technical documentation.
The Brazilian government began systematically collecting information on dam accidents and incidents in 2011, with the first national dam safety report. The primary sources of information are public officials who report annual accidents and incidents to supervisory bodies. The evolution of the number of accidents and incidents recorded until 2021 is shown in Figure 1.

Some accidents involving earth dams deserve to be highlighted because of the importance of their consequences, whether for the developer, society, or the environment. Table 1 highlights several cases of national relevance.
Coelho (2023) gathered data from various sources to consolidate the information on the performance of earth dams in Brazil between 1940 and 2023. The aim was to characterize the failure modes and their mechanisms according to the current guidelines in dam engineering. To this end, 79 dam failures were analyzed and characterized. The evidence shows that of the 79 failures analyzed, 68% were due to external erosion, 19% to internal erosion, 6% to spillway collapse, and 6% to slope instability. When evaluating only large dams (height 15 m), the total number of failures was 19, of which 50% were due to external erosion, 32% to internal erosion, 14% to spillway collapse, and 5% to slope instability. For comparison, ICOLD (2019) concluded that the most common failure modes in earth dams are overtopping (40%), internal erosion (39%), and structural failure (21%).
Based on the large dams registered with the National Dam Safety Information System (SNISB), the operating times of 410 earth dams between 1940 and 2023 were calculated, totaling 11,493 years. Thus, it was possible to estimate the annual failure frequency of large dams in Brazil. Table 2 summarizes the results.
3. Event tree
An event tree is a logical structure that, given an initiating event, promotes the analysis of sequences of events by means of diagrams. In this context, there is no logical difference between an “event” (e.g. earthquake, storm) or a “condition” (e.g., existence of a layer with high liquefaction potential in the foundation of a dam). An event tree can be built from either qualitative or quantitative perspectives (Christian, 2004). The event tree starts with an initiating event, from which the engineer develops logical sequences of events that could occur during the construction and/or operation of the dam. Each event is associated with a conditional probability of occurrence (Christian, 2004). All possible outcomes must be identified, and all outcomes are exclusive, that is, they cannot be computed more than once. Analysis must proceed along each logical sequence to evaluate subsequent outcomes. At each stage, the probabilities are conditional, that is, they are the probabilities of the current event only if all the probabilities of the previous events have occurred. The probability of each outcome is the product of the conditional probabilities at the end of the tree (Christian, 2004). Figure 2 shows an example of an event tree applied to two generic connected systems. System 2 was logically conditioned using System 1. For simplicity, only two possible responses were assumed: success and failure of the system. The probability of each response was assumed arbitrarily for illustration purposes.

4. Probabilistic risk analysis
Specific risk is defined by Kaplan & Garrick (1981) as the combination: (I) probability of a certain load occurring (), (II) probability of a certain failure occurring given that the load has occurred (), and (III) consequences given that the failure has occurred (). Quantitatively, specific risk can be expressed by Equation 1 (Kaplan & Garrick, 1981):
The literature on risk analysis applied to dams reports various probabilistic analysis methods. The USBR (2019) and Zhang et al. (2022) state that the most commonly used analyses for dams today are Event Tree Analysis (ETA) and Fault Tree Analysis (FTA). Lacasse et al. (2022) stated that the most commonly used analysis for dams is the ETA. Morales-Nápoles et al. (2014) and Lacasse & Nadim (2019) report the use of Bayesian Network (BN). FTA and ETA are risk analysis methods that use fault trees and events as causal models, respectively. Baecher & Christian (2003) and Christian (2004) exemplify the use of FTA and ETA in dams. A BN is a Bayesian update network that aims to quantify and update risks using a Bayesian approach (Smith, 2006).
While ETA remains a widely adopted approach for dam safety risk assessment because of its transparency and structured representation of failure sequences, alternative methods, such as Bayesian Networks (BN), offer distinct advantages. BNs enable the dynamic updating of probabilities as new evidence becomes available and can capture complex dependencies among variables, which are often oversimplified in ETA. However, BNs require substantial data for calibration and expert judgment of conditional probability tables, which can be challenging in practice. Conversely, ETA is easier to implement and interpret but lacks flexibility for backward inference updates. Recent studies suggest that hybrid approaches combining ETA for scenario structuring and BN for probabilistic reasoning can enhance the robustness of dam safety assessments (Kabir & Papadopoulos, 2019; Wang et al., 2023).
5. Quantitative risk representation
Quantitative risk is usually represented in graphs (fN charts) showing the annualized probability of a failure and its consequences. When the consequences are loss of life, the risk is called the annualized expected loss of life or social risk. In contrast to social risk, the concept of individual risk is defined as the probability of death of at least one person in the event of a structural failure (USBR, 2019). In some cases, this risk is defined as the probability of system failure (SPANCOLD, 2013).
The ALARP principle is often used to assess the need for, and magnitude of, risk reduction. ALARP is an acronym for “As Low As Reasonably Practicable”, which refers to a principle of subjective risk assessment. This principle provides an approach to increasing the efficiency of risk reduction. The central idea of ALARP is that reducing risks beyond a certain level may not be justifiable if it is impractical, or if the costs are disproportionately high in relation to the benefits obtained (SPANCOLD, 2013). According to the USBR (2019), to judge whether risks follow the ALARP principle, the following must be considered.
-
Level of risk in relation to established risk guidelines;
-
The disproportion between the sacrifice (resources, time, and effort) in implementing risk reduction measures and consequent risk reduction was achieved;
-
Cost-effectiveness of risk reduction measures;
-
Recognized and relevant practices;
-
Social concerns revealed by consultation with the community and other interested parties.
In short, the overall intention of ALARP is to assess whether risks should be reduced and, if so, to what extent. The use of this principle implies a balance between equity and efficiency (USBR, 2019).
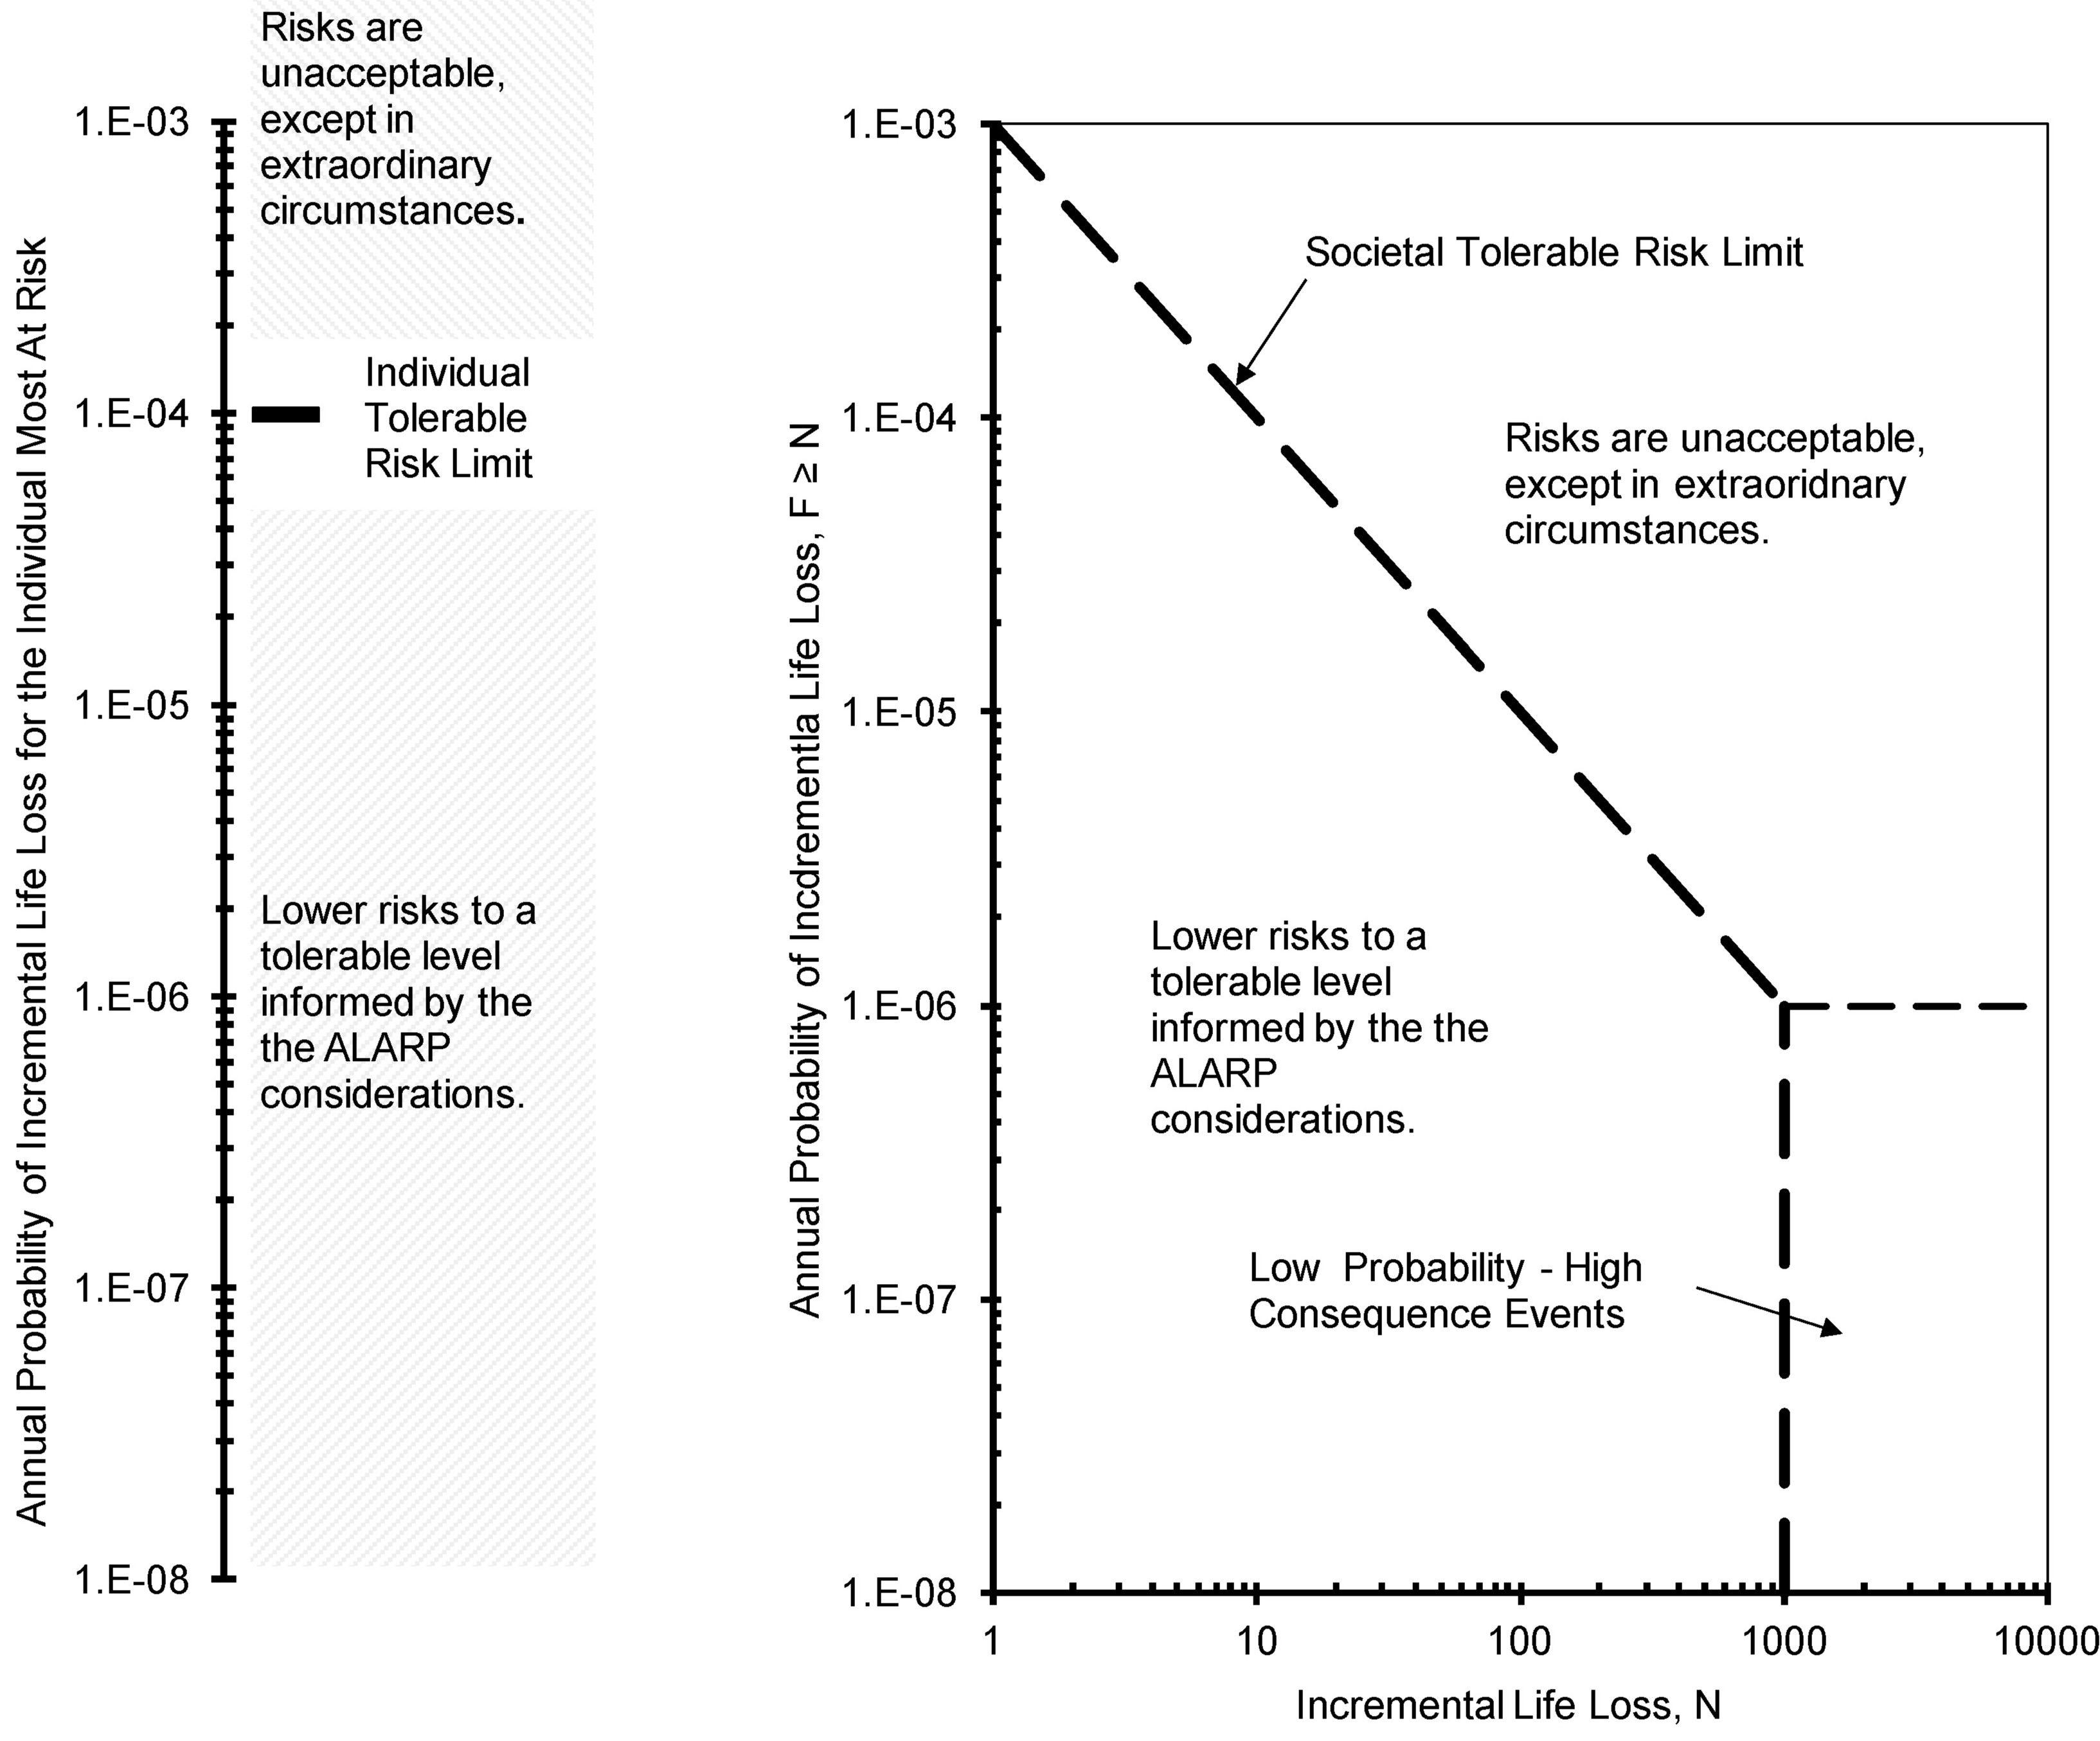
Figure 3 illustrates the use of the fN chart and ALARP principle to define risk limits for dams. The limits presented in USACE (2014) represent an adaptation of the public protection guidelines published by the USBR (2011), the risk evaluation guidelines published by ANCOLD (2003), and the risk management policy for dam safety published by NSWDSC (2006).

6. Proposed methodology
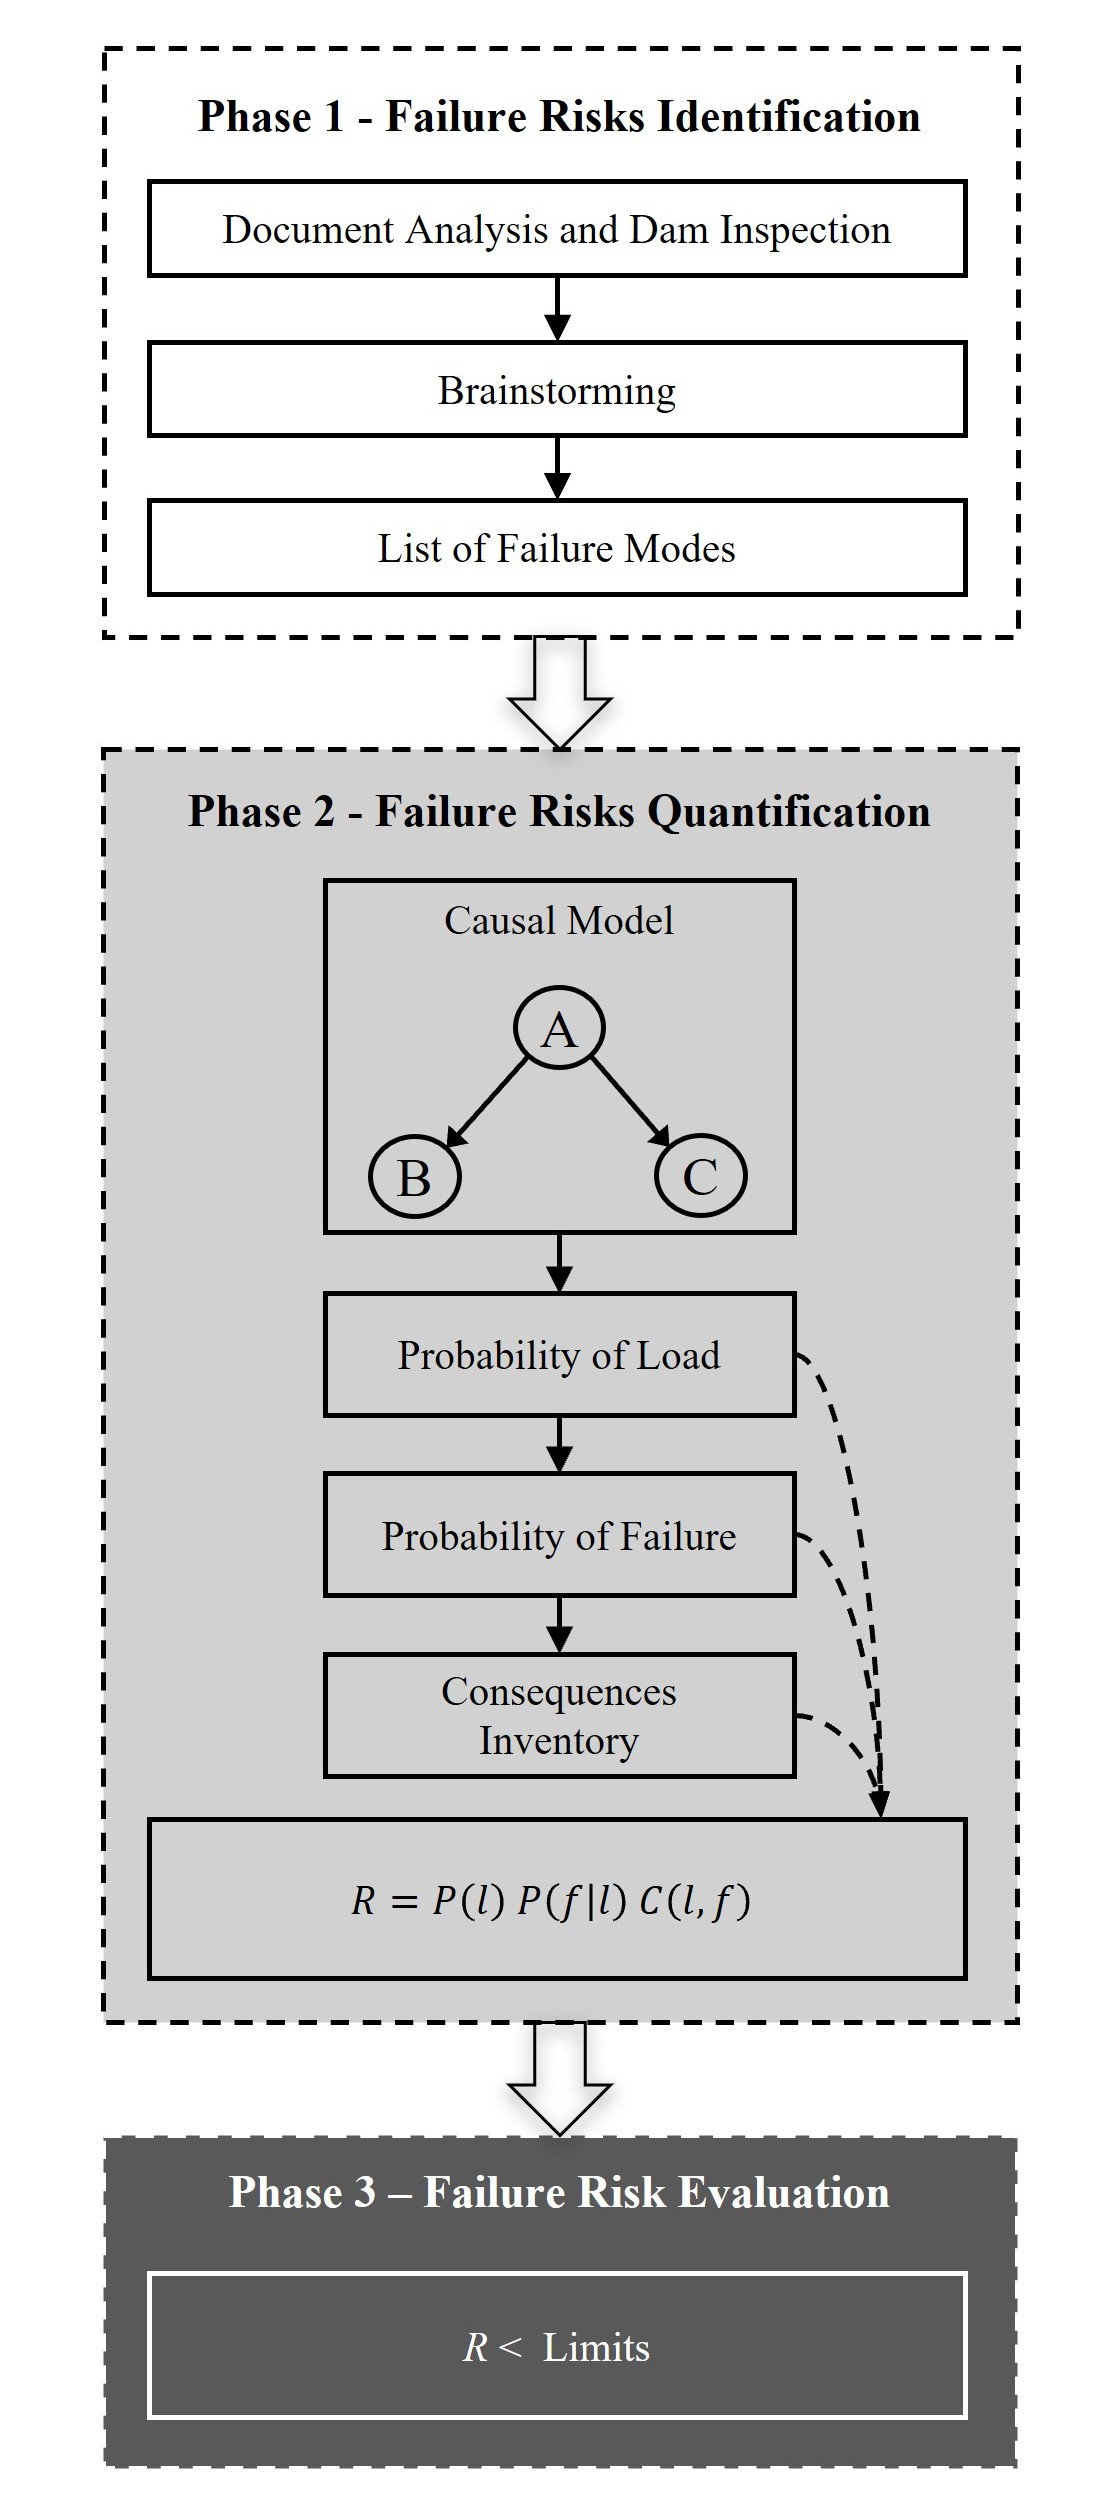
The proposed method aims to quantify the risk of failure of earth dams. Therefore, it is a probabilistic analysis method that is divided into three phases: (1) failure risk identification, (2) failure risk quantification, and (3) failure risk evaluation.
In Phase 1, the relevant failure risk hypotheses should be formulated on the basis of existing documentation and field inspection of the dam. These hypotheses and their consequences must be evaluated from a qualitative perspective with the aim of eliminating the risks of failure that are of little relevance to the analysis process. The uncertainties in this phase are associated with the experience of the assessors and the amount of data available on the dam.
In Phase 2, the relevant failure risks identified in Phase 1 must be quantified by means of failure probability and consequence analyses. These analyses involve the development of causal models, determination of loading scenarios, geological-geotechnical analyses, hydrological-hydraulic analyses, structural analyses, dam-break studies, and inventory of fatalities.
Finally, in Phase 3, the quantified risks are plotted on fN graphs and compared with admissible limits, uncertainty analyses can be conducted, and mitigation measures may be necessary.
This methodology is applicable to earth dams at any scale. Figure 4 shows a general outline of the method and summarizes the analysis phases described above.

6.1 Phase 1 – failure risk identification
The identification of risks in dams necessitates a concentration on failure modes (FM) that are particularly pertinent to safety analysis. A substantial body of research on dam failures, as well as the guidelines established by several international organizations, indicates that the predominant mechanisms in earth dams are associated with uncontrolled leakage and structural instability (Foster et al., 2000; USBR, 2019; Lacasse et al., 2022). An analysis of historical data on Brazilian dams indicates that the most relevant failure modes include: (1) internal erosion; (2) external erosion; (3) instability; (4) liquefaction; and (5) structural problems. These FMs should be prioritized during brainstorming sessions and are aligned with more than 90% of documented failures worldwide. Each FM should be identified clearly and objectively to facilitate consistent and transparent risk identification.
Subsequently, the degree of susceptibility to each FM should be judged using the probability ratio and verbal description, as shown in Table 3.
Once the susceptibility of each FM is defined, its consequences must be determined. To achieve this, the classification of the consequences shown in Table 4 is used.
The final classification of each failure mode is determined by the combination of two elements: its susceptibility and the potential downstream consequences of its occurrence. This combination is pivotal for producing a qualitative assessment of the risk level posed by each failure mode, thus facilitating informed decision-making processes. Table 5 presents the possible combinations, ranging from Level I (lowest) to Level V (highest), with the recommendation that risks classified as Level III or above are considered relevant for detailed analysis in Phase 2. To increase the reliability of this process and reduce subjectivity, it is crucial to apply inter-rater agreement metrics, such as Fleiss’ Kappa, to evaluate consistency among evaluators during susceptibility and consequence judgments. Additionally, sensitivity analyses should be performed on the adopted risk matrix to verify the robustness of filtering decisions under parameter variations. These measures ensure transparency, methodological rigor, and alignment with best practices in dam safety risk assessment.
6.2 Phase 2 – failure risk quantification
Quantification of the risk of failure must result in an annual loss of life. To realize this objective, four studies should be conducted: (a) choosing a causal model, (b) characterization of the loads and their probabilities, (c) characterization of the failure modes and their probabilities for each load, and (d) estimation of the loss of life for each failure mode.
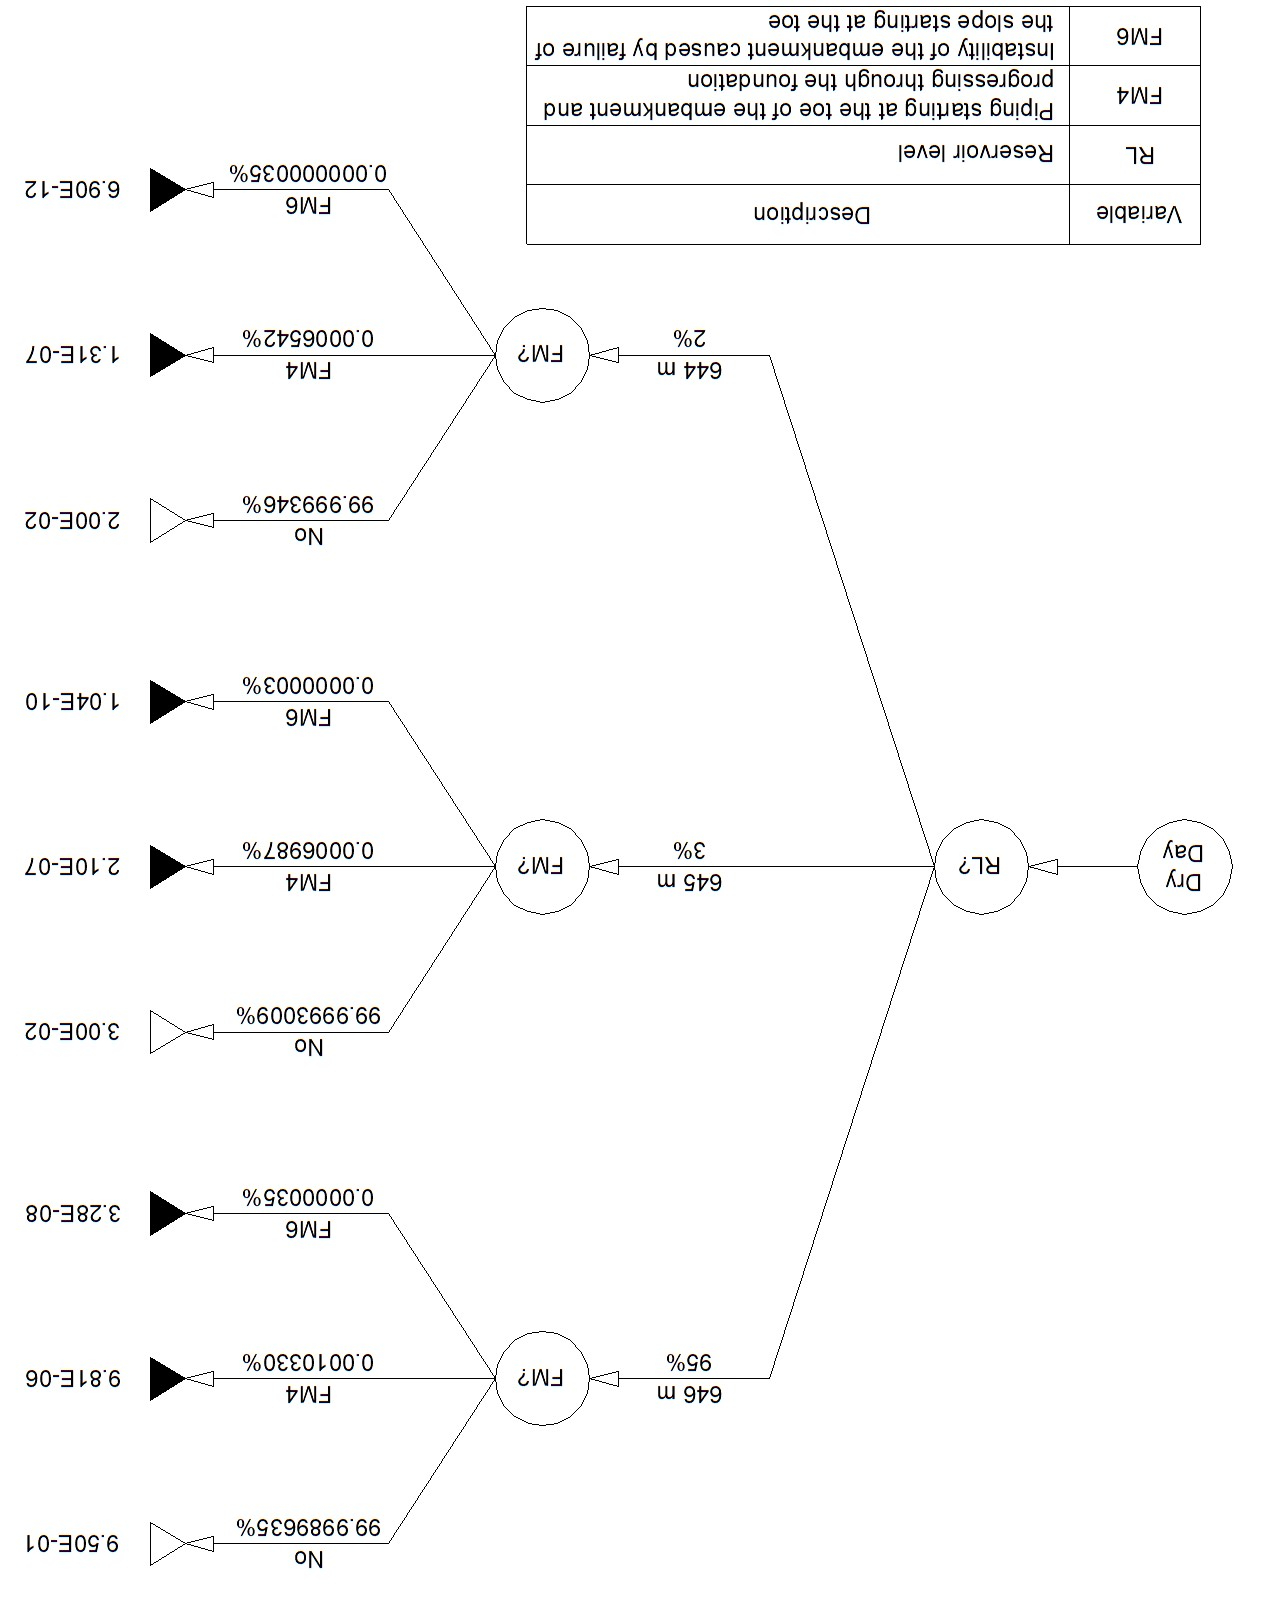
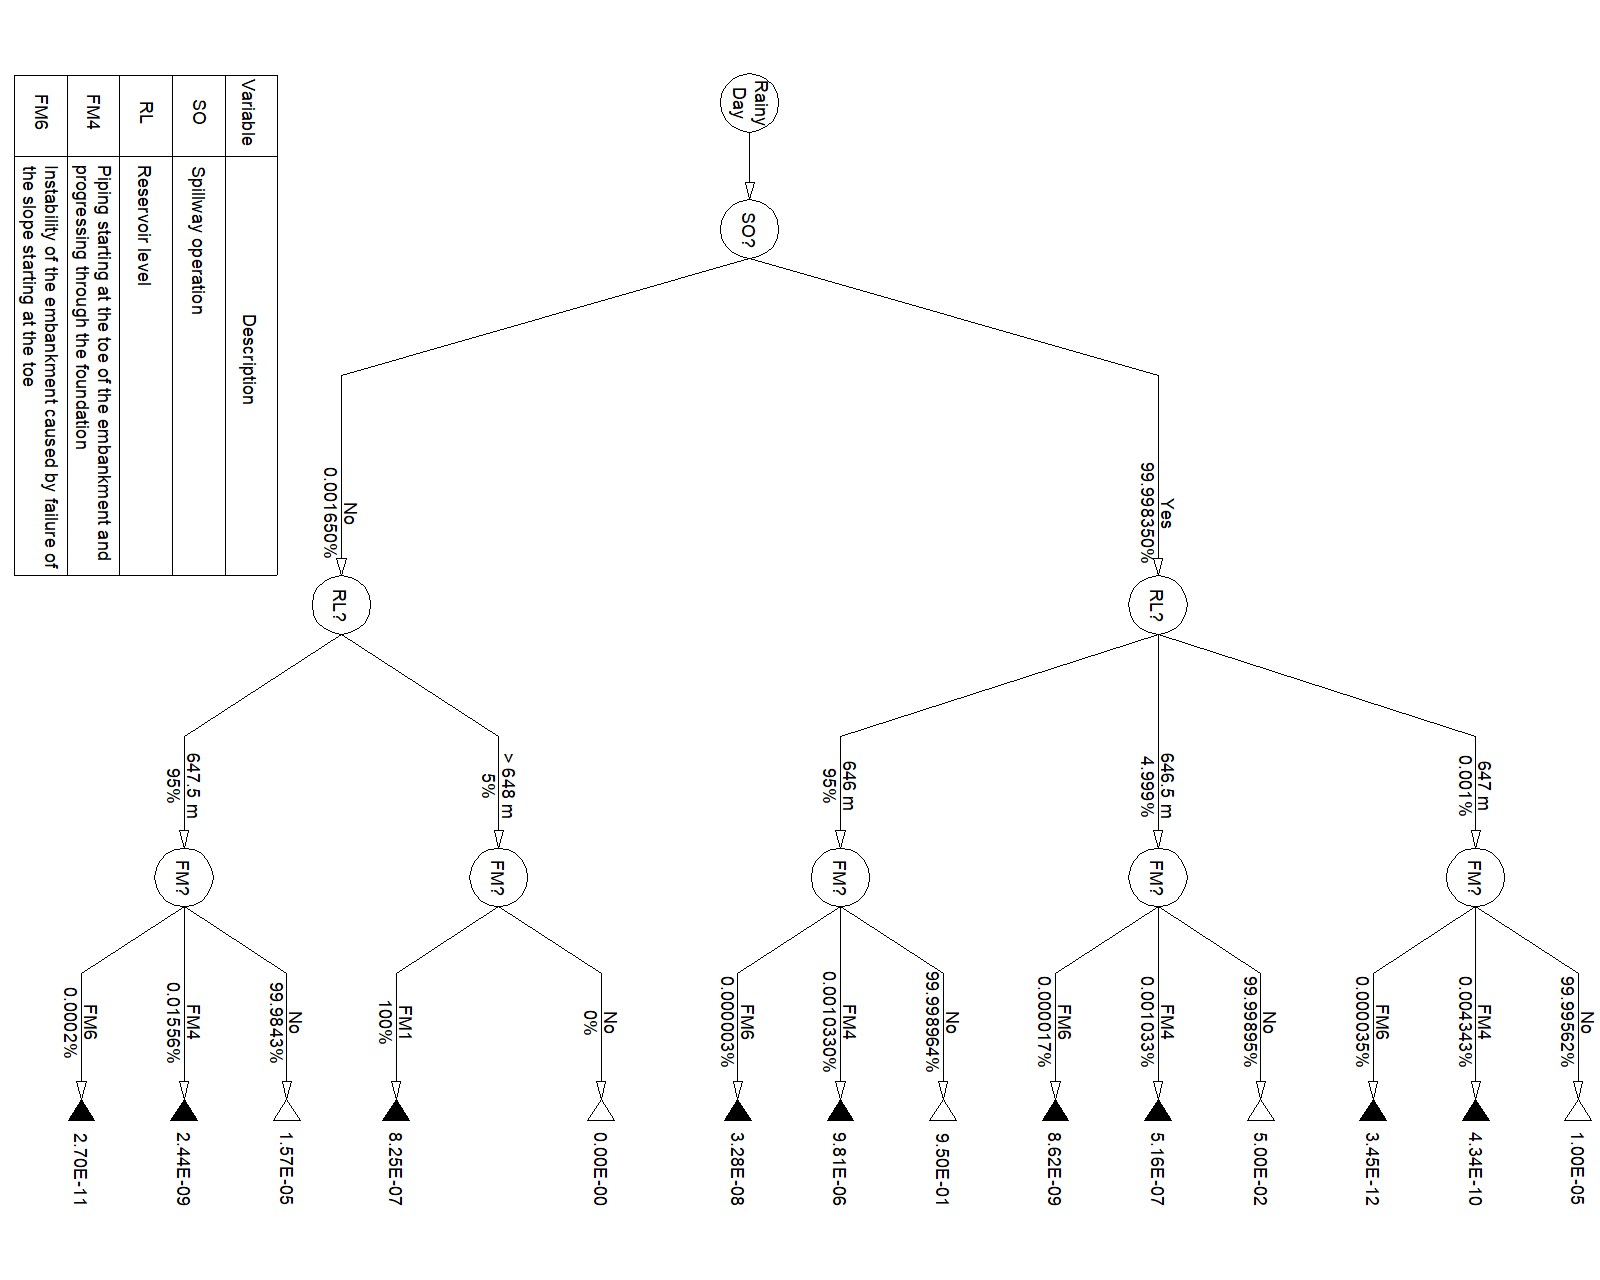
It is suggested that a causal model be developed by using event trees. In general, three event trees are required: one for normal loads and two for exceptional loads (hydrological and seismic loads). The event trees created serve as a structure for automatically calculating the probability of each failure mode and must have two sequences of events: one for the probability of the loads, and the other for the probability of the failure modes given the load. The completion of the event trees must be justified using specific reliability analyses. Figures 5 and 6 illustrate the structure of the event trees to be created. Filled triangles indicate branches that generate consequences downstream of the dam and empty triangles indicate no consequences.

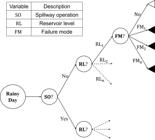
The loading probabilities to be inserted into the event tree must reflect the variation in the reservoir level (RL) over a 1-year period. This variation can be determined using exceedance probability curves or water level permanence probability curves in the reservoir (USBR, 2019). These curves require information from the RL-level history or from numerical simulations. Determining which and how many levels to use must be performed by discretizing the exceedance probability curve. The USBR (2019) recommends using Simpson's rule for discretization. Figure 7 illustrates this discretization.

If there is a clearly dominant RL above 95% permanence, for example, and this RL is the most critical, it is recommended to simplify the load determination by adopting the dominant level as representative of the load curve.
Except for ruptures owing to external erosion via overtopping, which should be considered a certain event, these probabilities should be calculated based on geotechnical analyses. It is recommended that these analyses be preferably performed via first-order second moment (FOSM) owing to its simplicity and good adherence to geotechnical systems (Sayão et al., 2012) or Monte Carlo Simulations (MCS), as suggested by Assis (2020). In situations where it is not possible to calculate failure probabilities directly, owing to the lack of engineering models, for example, the use of subtrees of events or failures is recommended (Lacasse et al., 2022).
The loss of life inventory should be carried out based on dam break studies (USBR, 1999). Coelho (2023) suggested that dam-break studies be carried out in 2D using topographic bases and images compatible with a 1:10,000 scale (or larger), allowing for the planning of escape routes in urban areas. The most important flood parameters are hydrodynamic potential (DV), peak flow rate, and time of arrival of the flood wave. The main objective of dam-break simulation is to determine the population at risk (PaR) and estimate the fatalities of the simulated failure scenarios.
It is suggested that the fatality inventory be based on the PaR multiplied by the fatality rate (USBR, 1999). The PaR is calculated based on the buildings affected, and the fatality rate is estimated based on the hydrodynamic potential (DV) defined by multiplying the height and velocity of the flood. Coelho (2023) suggests that the fatality rate be standardized into three classes of DV based on the USBR (2015). Table 6 shows the suggested rates.
The uncertainties associated with the number of fatalities can be estimated from the variation in the PaR and/or DV as a function of different breach parameters. In this case, the MCS can be used. In expedient cases, sensitivity analyses can be performed to understand the degree of uncertainty. Population behavior can be simulated using software such as LifeSim (USBR, 2019).
Failure risk should be calculated by multiplying the probability of failure by the associated number of fatalities. In the case of an exceptional scenario, the number of fatalities must disregard the effect of the associated flooding and calculate incremental fatalities. The incremental fatalities, in turn, are given by the difference between the fatalities due to the FM and the flood fatalities associated with the load case, without considering dam failure (USBR, 2019).
6.3 Phase 3 – failure risk evaluation
It is suggested that the quantified risks be represented in fN graphs and compared with the admissible limits proposed by government agencies. Because there are no admissible limits proposed by Brazilian agencies, the USACE (2014) criterion is recommended.
Calculated risks must be judged as acceptable or unacceptable. Specific mitigation measures should be proposed for these unacceptable risks. For risks that are acceptable but close to tolerance limits, it is recommended that uncertainty analyses be conducted using MCS. Finally, nothing needs to be done regarding the acceptable risks.
6.4. Scalability and limitations
The scalability of the proposed methodology to small dams or data-poor regions warrants further investigation. In such contexts, reliance on detailed geotechnical and hydrological data may limit full implementation. Simplified event trees with aggregated failure modes, the use of regional empirical data, and expert elicitation can serve as practical adaptations. Nevertheless, these simplifications introduce epistemic uncertainty, which should be acknowledged explicitly.
Emerging approaches, such as surrogate modeling and machine-learning-based reliability approximations, offer promising alternatives for contexts with limited data availability, enabling probabilistic risk analysis with reduced computational and data demands (Liang et al., 2023; Huang et al., 2025).
7. Case studies
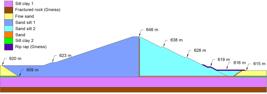
A dam under construction on the Camanducaia River (São Paulo State) since 2019 was chosen because it is a recent project and familiar to the authors. Figure 8 shows a typical cross-section. The dam was designed as a homogeneous earth fill, approximately 800 m long and 36 m high, with a crest that was 7 m wide. The upstream slope has a gradient of 1V:3H, and the downstream slope has a gradient of 1V:2H, with 3 m wide berms at elevations of 628 and 638 m. The upstream slope has riprap protection up to an elevation of 648 m. The internal drainage system consists of a 0.70 m thick central sand filter and a 0.70 m thick downstream horizontal sandwich drain.
The 73 m wide spillway was built in a rocky area, with a maximum discharge capacity of 793 m3/s, for a water level in the reservoir at an elevation of 646.4 m. This spillway capacity exceeds that associated with the 10,000 years recurrence time flood, which is approximately 715 m3/s. The spillway has a threshold at an elevation of 643.0 m and is controlled by eight segment gates to maintain the reservoir's water level at 646.0 m. It was built on a roller-compacted concrete (RCC) dam, located on the right shoulder, with a total width of 74.0 m.
The reservoir is designed to have a storage capacity of 55,880,000 m3 at the normal maximum water level (646.0 m).
The parameters of the materials present in the typical cross section are listed in Table 7.
8. Analysis and results
Based on the analyzed documents and the authors' brainstorming, nine possible failures were identified for the earth dam under analysis (Table 8). The process of filtering out insignificant risks reduced the number of failure risks by 67% (from nine to three) because of the diversity of documents available on the dam under analysis, which allowed good convergence of the subjective characterizations of susceptibility and consequences for each FM.
To assess subjectivity in Phase 1, an inter-rater reliability test (Fleiss’s kappa) was applied. The findings indicated a substantial degree of consensus among the experts, as evidenced by the high level of agreement (K ≈ 1.00). This strong consistency among experts significantly reduced subjectivity, as evidenced by the minimal variation observed in decisions regarding susceptibility and consequences. While this may be indicative of the availability of detailed documentation and the evaluator's experience, the incorporation of formal metrics, such as Kappa, enhances transparency and reliability, thereby consolidating the robustness of the methodology against qualitative judgments. To further ensure robustness, sensitivity analyses were performed on the failure mode classifications, confirming that the qualitative filtering process was generally stable. The critical failure modes (FM1, FM4, and FM6) exhibited consistently high-risk levels (IV or V) under parameter variations of ±10%, validating their prioritization for detailed probabilistic analysis. In contrast, the low-relevance modes (FM7 and FM8) maintained minimal risk levels (I or II), thus supporting their exclusion. Certain intermediate modes (FM2, FM3, FM5, and FM9) transitioned to level III under combined positive variations because their initial scores approximated the classification limits. This underscores the significance of meticulously documenting sensitivity outcomes. The filtering process provides a reliable foundation for the prioritization of failure modes, recognition of uncertainties, and alignment with best practices in dam safety risk analysis.
Consequently, only failure modes 1, 4, and 6 were quantified under the specified loading conditions. Two event trees were constructed to represent the normal and exceptional loading scenarios (Figures 9 and 10). The probability of load occurrence was derived from the reservoir exceedance probability curve, whereas the likelihood of spillway operation was estimated using the Dormant–Weibull formulation (USACE, 2013). The failure mode probabilities were computed using the FOSM method. For slope instability (FM4), Morgenstern & Price’s (1965) approach was employed as the performance function for the FS evaluation. In the case of internal erosion by piping (FM6), the FS was assessed against the critical vertical hydraulic gradient (Terzaghi & Peck, 1996) at the downstream slope base.


The probability of each FM is summarized in Table 9 (result of the event tree), as well as an estimate of fatalities according to Item 6.2. The results showed that the probabilities of dam failure on dry and rainy days were 1.02× and 1.12×, respectively. On both dry and rainy days, FM4 (Piping) was the most likely failure mode, contributing 99% and 93% to the probability of dam failure, respectively. On dry days, FM1 (overflow) and FM6 (slope instability) were insignificant for the dam failure probability. On rainy days, FM1 had a weight of 7%, and FM6 had a weight of 1%.
It should also be noted that all calculated failure probabilities were lower than the reference values for Brazilian dams (Table 2).
The probability of each FM and its consequence were plotted on fN graphs (Figures 11 and 12), representing the expected loss of life for each FM analyzed. To quantify the aleatory uncertainty (natural variability), 1,000 Monte Carlo simulations were performed for each branch of the event tree. Event probabilities were modeled with beta distributions using parameters derived from the mean and an assumed standard deviation equal to 10% of the mean (Figures 9 and 10). Beta was chosen because its domain was [0,1]. Incremental fatalities were modeled as normal random variables, with means from Table 8 and standard deviations equal to 10% of the mean.


It is important to note that these simulations propagate aleatory uncertainty only, indicating the inherent randomness of events. Epistemic uncertainty was not modeled in this study. If epistemic uncertainty is considered, additional layers of simulation or Bayesian approaches.
The results show that all risks of dam failure are acceptable for the USBR (2011) and USACE (2014). According to ANCOLD (2003), the risk of failure associated with pipes on dry and rainy days is not acceptable, demonstrating the need for mitigation. These results indicate that low failure probabilities do not always correspond to acceptable risk levels, as in the case of FM4 for RL=646 m. Good adherence to the failure history was observed, that is, overflows and internal erosion, with a significantly higher risk than that of slope instability.
Piping risks demonstrate a need for mitigation. Therefore, the following approaches are recommended: (a) reducing epistemic uncertainty, (b) implementing intervention measures on the dam, and (c) improving emergency action plans and/or relocating exposed populations. The epistemic uncertainty can be reduced by conducting complementary field tests to estimate the permeability of the foundation and dam body and monitor seepage through the dam. Dam interventions may include installing an inverted filter to control internal erosion. The latter approach (emergency planning and relocation) is not considered here, as it is not the focus of this study.
9. Conclusions
A new probabilistic risk analysis methodology for earth dams was presented. The essence of the methodology is to filter out low-relevance failure risks so that the engineer in charge can concentrate their efforts on the detailed characterization of the relevant risks. The main structure of the method is composed of event trees fed by reliability analyses of subsystems of the dam.
The application of the methodology presented to a dam under construction on the Camanducai River, São Paulo, Brazil, showed that: (I) the process of filtering out insignificant risks can be very effective, especially when there are many safety documents available. In the case study presented, the number of failure risks was reduced by 67% (from 9 to 3); (II) the risk of failure due to piping was the most likely (9.81×) and was assessed as tolerable by the USBR (2011) and USACE (2014) guidelines, but not by ANCOLD (2003). The calculated probabilities were compared with reference values for Brazilian dams and indicated that low failure probabilities do not always correspond to acceptable risk levels according to existing guidelines; (III) the methodology showed potential for comparing the failure risks of different dams using fN graphs; and (IV) the methodology showed potential for analyzing aleatory uncertainty in calculated risks.
The methodology has been validated in a single case study; therefore, further applications are needed to reinforce its generalization, as well as real-time risk updates, which can be implemented through software that links monitoring data to Phase 2 of the methodology.
Recent advancements in probabilistic risk analysis for dam safety have emphasized the integration of machine learning (ML) techniques to complement traditional methods. ML models, including gradient boosting, neural networks, and hybrid optimization algorithms, have demonstrated superior performance in predicting dam behavior, detecting anomalies, and approximating reliability indices under uncertainty (Yang et al., 2024; Yadav & Jha, 2025). These data-driven approaches can enhance real-time risk assessment and support decision-making, particularly when combined with conventional frameworks, such as ETA or BN. Future research should explore hybrid methodologies that leverage the interpretability of event trees and the predictive power of ML, paving the way for adaptive data-informed dam safety management.
Making dam safety decisions based on quantitative risks offers a powerful means of not only identifying critical failure modes but also prioritizing how to deal with dam safety objectively and rationally.
List of symbols and abbreviations
Effective cohesion
Horizontal permeability
Vertical permeability
Consequences given that the failure has occurred
COV Coefficient of variation
DV Hydrodynamic potential
FM Failure mode
Agreement coefficient
P(f) Probability of failure
P(f|l) Probability of a certain failure occurring given that the load has occurred
P(l) Probability of load
PaR Population at risk
RL Reservoir level
SO Spillway operation
Reliability index for normally distributed factor of safety
ysat Saturated specific weight
Average
' Effective internal friction angle
Acknowledgements
The authors thank PUC-Rio and CAPES, and the Brazilian Agency for the Support and Evaluation of Graduate Education for financial support during the first author’s doctoral studies.
-
Discussion open until May 31, 2026.
-
Data availability
The datasets generated analyzed in the course of the current study are available from the corresponding author upon request.
-
Declaration of use of generative artificial intelligence
The authors declare that no artificial intelligence (AI) tools or resources were used in the conception, development, analysis, writing, or revision of this article. All content presented was entirely produced by the authors, based on their own research and duly cited bibliographic references.
References
- ANCOLD. (2003). Guidelines on risk assessment Hobart: Australian National Committee on Large Dams.
-
Assis, A.P. (2020). Risk management for geotechnical structures: consolidating theory into practice. Soils and Rocks, 43(3), 311-336. https://doi.org/10.28927/SR.433311
» https://doi.org/10.28927/SR.433311 - Baecher, G.B., & Christian, J.T. (2003). Reliability and statistics in geotechnical engineering Hoboken: John Wiley & Sons.
- Bowles, D.S., & Needham, J. (2017). Approaches to estimating individual risk for dam safety tolerable risk evaluation. In Proceedings of the US Society on Dams Conference. Aurora, CO: USSD.
- CBDB. (2021). Lessons learned from dam accidents and incidents in Brazil. Rio de Janeiro: Comitê Brasileiro de Barragens.
- CDA. (2013). Dam safety guidelines Thornhill, ON: Canadian Dam Association.
-
Christian, J.T. (2004). Geotechnical engineering reliability: how well do we know what we are doing? Journal of Geotechnical and Geoenvironmental Engineering, 130(10), 985-1003. https://doi.org/10.1061/(ASCE)1090-0241(2004)130:10(985)
» https://doi.org/10.1061/(ASCE)1090-0241(2004)130:10(985) - Coelho, A.S. (2023). Earth dam failure risk: quantitative analysis methodology [Doctoral thesis, Pontifical Catholic University of Rio de Janeiro]. Pontifical Catholic University of Rio de Janeiro’s repository (in Portuguese).
-
D’Hyppolito, L.C.B.S., Sayão, A.S.F.J., & Nunes, A.L.L. (2024). A simple method for assessing the probability of liquefaction of tailings dams. Soils and Rocks, 47(4), e2024000924. https://doi.org/10.28927/SR.2024.000924
» https://doi.org/10.28927/SR.2024.000924 - Environment Agency. (2013). Guide to risk assessment for reservoir safety management: methodology and supporting information (Vol. 2). Bristol.
-
Foster, M., Fell, R., & Spannagle, M. (2000). The statistics of embankment dam failures and accidents. Canadian Geotechnical Journal, 37(5), 1000-1024. https://doi.org/10.1139/t00-030
» https://doi.org/10.1139/t00-030 -
Hartford, D.N.D, Baecher, B.G, Zielinski, A.P., Patev, C.R., Ascila, R., & Rytters, K. (2016). Operational safety of dams and reservoirs: understanding the reliability of flow control systems. London: ICE Publishing. https://doi.org/10.1680/osdr.61217.161
» https://doi.org/10.1680/osdr.61217.161 -
Huang, H., Pang, Q., Yan, J., Chen, S., Wang, S., Wu, Y., & Gu, Y. (2025). A seepage prediction method for earth-rock dams integrating surrogate modeling with hysteresis effect functions. Journal of Civil Structural Health Monitoring, 15(8), 3695-3711. https://doi.org/10.1007/s13349-025-01011-y
» https://doi.org/10.1007/s13349-025-01011-y - International Commission on Large Dams – ICOLD. (2019). Bulletin 99 update: statistical analysis of dam failures. Chile: ICOLD.
-
Kabir, S., & Papadopoulos, Y. (2019). Applications of Bayesian networks and Petri nets in safety, reliability, and risk assessments: a review. Safety Science, 115, 154-175. https://doi.org/10.1016/j.ssci.2019.02.009
» https://doi.org/10.1016/j.ssci.2019.02.009 -
Kaplan, S., & Garrick, B.J. (1981). On the quantitative definition of risk. Risk Analysis, 1(1), 11-27. https://doi.org/10.1111/j.1539-6924.1981.tb01350.x
» https://doi.org/10.1111/j.1539-6924.1981.tb01350.x -
Lacasse, S., & Nadim, F. (2019). Risk assessment and dams. In Proceedings of the XVII European Conference on Soil Mechanics and Geotechnical Engineering. ISSMGE.https://doi.org/10.32075/17ECSMGE-2019-1110
» https://doi.org/10.32075/17ECSMGE-2019-1110 - Lacasse, S., Nadim, F., Liu, Z., Høeg, K., Eidsvig, K.U., & Piciullo, L. (2022). Risk assessment and risk management for dams. International Society for Soil Mechanics and Geotechnical Engineering, 20(1), 4559-4564.
-
Liang, J., Li, Z., Pan, L., Khailah, E.Y., Sun, L., & Lu, W. (2023). Research on surrogate model of dam numerical simulation with multiple outputs based on adaptive sampling. Scientific Reports, 13(1), 11955. https://doi.org/10.1038/s41598-023-38590-z
» https://doi.org/10.1038/s41598-023-38590-z -
Morales-Nápoles, O., Delgado-Hernández, D.J., De-León-Escobedo, D., & Arteaga-Arcos, J.C. (2014). A continuous bayesian network for earth dams’ risk assessment: methodology and quantification. Structure and Infrastructure Engineering, 10(5), 589-603. https://doi.org/10.1080/15732479.2012.757789
» https://doi.org/10.1080/15732479.2012.757789 -
Morgenstern, N.R., & Price, V.E. (1965). The analysis of the stability of general slip surfaces. Geotechnique, 15(1), 79-93. https://doi.org/10.1680/geot.1965.15.1.79
» https://doi.org/10.1680/geot.1965.15.1.79 - NSWDSC. (2006). Risk management policy framework for dam safety Sydney: New South Wales Dam Safety Committee.
-
Rausand, M. (2011). Risk assessment: theory, methods, and applications New York: John Wiley & Sons. https://doi.org/10.1002/9781118281116
» https://doi.org/10.1002/9781118281116 -
Sayão, A.S.F.J., Sandroni, S.S., Fontoura, S.A.B., & Ribeiro, R.C.H. (2012). Considerations on the probability of failure of mine slopes. Soils and Rocks, 35(1), 31-37. https://doi.org/10.28927/SR.351031
» https://doi.org/10.28927/SR.351031 -
Schafer, L.H., Beier, A.N., & Macciotta, R. (2021). A failure modes and effects analysis framework for assessing geotechnical risks of tailings dam closure. Minerals, 11(11), 1234. https://doi.org/10.3390/min11111234
» https://doi.org/10.3390/min11111234 -
Smith, M. (2006). Dam risk analysis using bayesian networks. In Proceedings of the Geohazards: Technical, Economical and Social Risk Evaluation, Lillehammer, Norway. Retrieved in March 5, 2025, from https://dc.engconfintl.org/geohazards/10
» https://dc.engconfintl.org/geohazards/10 - SPANCOLD. (2013). Risk analysis applied to management of dam safety Spanish National Committee on Large Dams.
- Terzaghi, K., & Peck, R.B. (1996). Soil mechanics in engineering practice New York: John Wiley & Sons.
- USACE. (2013). Bayesian weibull analysis of USACE equipment life data. Washington, D.C.: United States Army Corps of Engineers.
- USACE. (2014). Dam safety regulation: ER 1110-2-1156 Washington, D.C.: United States Army Corps of Engineers.
- USBR. (1999). A procedure for estimating loss of life caused by dam failure. Washington, D.C.: United States Bureau of Reclamation.
- USBR. (2003). Guidelines for achieving public protection in dam safety decision making. Washington, D.C.: United States Bureau of Reclamation.
- USBR. (2011). Best practices in dam and levee safety risk analysis Washington, D.C.: United States Bureau of Reclamation.
- USBR. (2015). Guidelines for estimating life loss for dam safety risk analysis Washington, D.C.: United States Bureau of Reclamation.
- USBR. (2019). Best practices in dam and levee safety risk analysis Washington, D.C.: United States Bureau of Reclamation.
-
Wang, F., Li, H., Sheng, J., Yuan, L., Pan, Y., & Zhao, J. (2023). A Bayesian method for dam failure risk analysis using causal loop diagrams and word frequency analysis. Natural Hazards, 119(3), 2159-2177. https://doi.org/10.1007/s11069-023-06196-3
» https://doi.org/10.1007/s11069-023-06196-3 -
Yadav, S., & Jha, P. (2025). Use of machine learning in predicting structural performance of dams. International Journal of Hydropower and Civil Engineering, 6(1), 21-24. https://doi.org/10.22271/27078302.2025.v6.i1a.60
» https://doi.org/10.22271/27078302.2025.v6.i1a.60 -
Yang, X., Xiang, Y., Wang, Y., & Shen, G. (2024). A dam safety state prediction and analysis method based on EMD-SSA-LSTM. Water, 16(3), 395. https://doi.org/10.3390/w16030395
» https://doi.org/10.3390/w16030395 -
Zhang, S., Hou, W., Yin, J., & Lin, Z. (2022). Review of research and practice on the theory and technology of reservoir dam risk assessment. Sustainability, 14(22), 14984. https://doi.org/10.3390/su142214984
» https://doi.org/10.3390/su142214984
Edited by
-
Editor:
Renato P. Cunha https://orcid.org/0000-0002-2264-9711
The datasets generated analyzed in the course of the current study are available from the corresponding author upon request.