 The Research on Optimization of Laser-Arc Hybrid Welding Process Parameters Based on Neural Networks for Maximum Tensile Strength of Weld Joint
Abstract:
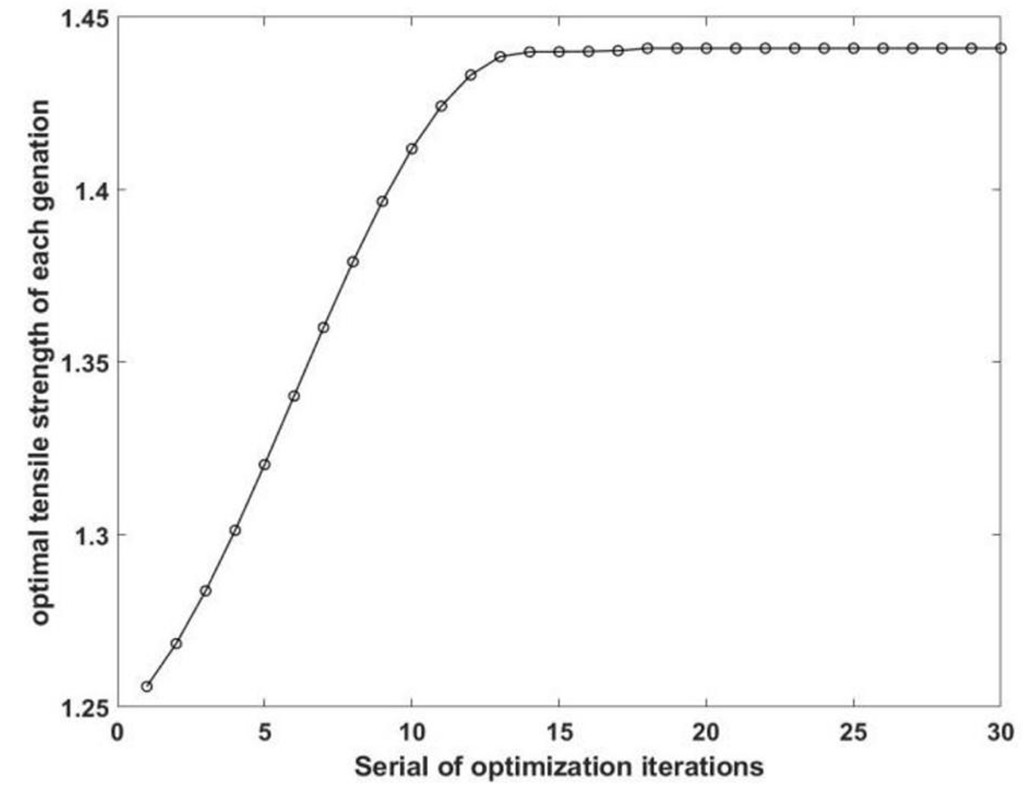
In laser - arc hybrid welding, the selection of welding parameters is crucial for achieving excellent mechanical properties of weld joints. In this paper, based on the experimental data of laser - arc hybrid plate butt welding, a BP neural network was employed to establish a prediction model between the hybrid - welding process parameters, namely welding current I/A, laser power P/W, welding blunt height D/mm, welding angle α/º, welding gap d/mm, and welded joint tensile strength. Subsequently, the multi - population genetic algorithm (MPGA) was utilized to optimize the internal topology of the BP neural network, aiming to enhance the prediction accuracy. The results indicate that the prediction error of the optimized neural - network model for tensile strength is less than 6%. According to the established BP neural - network model, taking the maximum tensile strength of the welded joint as the objective function, the genetic algorithm (GA) was used to optimize the welding process parameters with the range A. Finally, the optimal tensile strength of the weld joint was obtained as 1.441 MPa. The combination of hybrid - welding process parameters is as follows: blunt edge of 3.1 mm, welding angle of 51º, welding gap of 0.37 mm, welding current of 200 A, and laser power of 2700 W. Based on the hybrid - welding process parameters optimized by the genetic algorithm, a plate - butt - welding experiment was conducted on the welding test platform. The hybrid - welding conditions were kept unchanged, and the welded sample was processed and tested for tensile strength. The test results indicated that the tensile strength of the welded sample corresponding to the optimized process parameters was 1.35 MPa. This value is higher than the maximum tensile strength of 1.309 MPa in the welded samples of the orthogonal test.
Key-words:
BP neural network; Multi-population genetic algorithm; Maximum tensile strength of sample joint; Optimization of welding process parameters
1. Introduction
Compared with arc welding and laser welding alone, laser - arc hybrid welding exhibits obvious advantages. It has greater penetration, excellent bridging performance, high efficiency, a faster welding speed, lower cost, and less residual stress. In comparison with laser welding, the bridging performance of laser - arc hybrid welding is significantly enhanced due to the addition of an arc. In single - laser welding, since the weld width is merely about 2.5 mm, it demands higher tooling accuracy during the laser - welding process. In arc welding, as the welding depth is only around 1 - 3 mm, the methods of multi - pass welding and bevelling are often employed in the welding of medium - and thick - plates to meet the requirements. Owing to these advantages, laser - arc hybrid welding occupies an irreplaceable position in the manufacturing industry.
The mechanical properties of hybrid - welded joints are mainly influenced by the combination of welding process parameters, including laser power and welding current. The welding gap, blunt edge, and welding angle determine the pre - welding dimensions and ultimately affect the fusion ratio of the base material. Different fusion ratios will lead to different welding - joint qualities. During the process of laser - arc hybrid plate surfacing welding, given that numerous welding parameters are involved and there are strong couplings among each parameter, the variation of any parameter may have a substantial impact on the mechanical properties of the hybrid - welding sample. To this end, many domestic and foreign scholars have conducted extensive research on the relationship between the parameters and the mechanical properties of the sample.
At home and abroad, there are two main approaches for optimizing hybrid - welding process parameters. The first is to employ various experimental - design methods. Through testing, these methods approximate the influence of welding parameters on welding quality, and ultimately obtain a better parameter combination for welding - joint performance. For instance, Feng et al. [1] applied lase micro-welding to achieve non - contact connection structures, which is suitable for the encapsulation treatment between alloys. To improve the comprehensive performance of the titanium alloy TA2/stainless steel 316L composite plate in mechanical power connection structures, they conducted a series of experiments and finally got a optimal combination of welding parameters. Li et al. [2] conducted the laser-arc welding to optimize the tensile strength. The micro-structure was analyzed by optical microscope and scanning electron microscope. The research results show that with the increase of laser power, the incomplete penetration phenomenon of the weld disappears, the porosity tendency decreases, and the tensile strength of the welded joint increases. Qin et al. [3] Select the welding process parameters (laser power, welding speed, glass fiber content) as the influencing factors, and choose the welding quality (weld shear strength, weld width) as the response values. The accuracy of the model is verified through the analysis of variance table and the residual probability plot, and the interactive effects of different combinations of welding process parameters on the welding quality are explored. The optimal welding process parameters of the glass - fiber - reinforced composite material were determined respectively with the objectives of the best welding quality and the minimum welding cost.
The second approach is to use a simulation method to simulate the welding process and then apply some optimization techniques to obtain a favorable combination of welding parameters. For example, Huang et al. [4]. Aiming at the problem of the optimal mechanical properties of M20 friction - type high - strength bolt connections, a multi - parameter and multi - objective optimization design study was carried out. First, a numerical analysis method for the performance of friction - type high - strength bolt connections was established and verified. Finally, based on the MOGA genetic algorithm, the values of design parameters for giving full play to the bolt performance were calculated and analyzed. Hua [5] used the LSSVM method to simulate and predict the tensile strength of welded joints and took advantage of AFSA's excellent optimization ability to optimize the friction - welding process parameters. The main indices of welded joints include joint tensile strength (impact work) and weld appearance. The finite - element method is based on theory to complete the simulation of the welding process. However, the actual hybrid - welding process is more complex and variable. As a result, the optimized process parameters can only serve as a reference for welding tests, and thus comprehensive optimization cannot be carried out. Although LSSVM has good nonlinear - mapping capabilities, the large number of hybrid - welding - process parameters leads to low accuracy of the prediction model. Therefore, most scholars use neural networks to establish a prediction model between hybrid - welding process parameters and weld mechanical properties. Hong Yanwu, Han, Ronghao, Parimi, Satish, and others [6-11] [18-20] used neural networks to predict weld mechanical properties, as well as weld morphology and size. Nevertheless, the training of neural networks typically requires a large amount of training data. If the training - sample data is scarce, the prediction accuracy will be significantly reduced or may even become impossible. Consequently, simply using neural networks necessitates a large number of hybrid - welding tests to obtain a vast amount of training data to enhance the prediction accuracy, resulting in a substantial increase in research costs.
Based on the above problems, this paper utilizes the powerful nonlinear mapping ability of the BP neural network to establish a prediction model for hybrid welding process parameters and the mechanical properties of weld joints. The weight thresholds within the neural network are initialized, and the initialized values are binary - encoded. The encoded binary values are iteratively optimized as individuals in the genetic algorithm population [12-15] to address the issues of premature convergence and local convergence of the BP neural network, so as to obtain a neural network model with high prediction accuracy.
However, the process of optimizing the neural network using the genetic algorithm requires training the corresponding neural network of each individual once with training data to calculate the fitness value of the corresponding individual. Due to the large population size and slow optimization speed, it takes a relatively long time to obtain the final neural model. To solve these problems, this paper employs a multi - population genetic algorithm (MPGA), which has a strong global optimization ability and a fast optimization speed, to replace the GA.
Many scholars have applied MPGA in many different fields. Wang et al. [16] applied MPGA to optimize the improved Stanley controller to achieve better tracking performance of two - wheeled tractors. Jingcheng Wang et al. [6] proposed an MPGA - based program to determine the wind speed - direction design. The results of the MPGA - based program can significantly improve the performance of the sector - by - sector method. Zhou et al. [7] proposed a train set cycle optimization model aiming to minimize the total connection time and maintenance cost and designed an efficient multi - population genetic algorithm (MPGA) to solve the model.
In this paper, a multi - population genetic algorithm (MPGA) is employed to optimize the internal parameters of the topological structure of the BP neural network. Based on the optimized prediction model, the combination of welding process parameters is regarded as the optimization parameter of the genetic algorithm (GA). Eventually, the combination of process parameters that results in the maximum tensile strength of the welded - sample joint within the specific range of each welding process parameter is obtained.
2. Laser-Arc Hybrid Welding Test Platform and Tensile Test Platform
In the hybrid welding experiments, the self-developed hybrid device platform is shown in Figure 1. The Nd: YAG solid-state laser of TrumPF company in Germany and the MIG/MAG welder of Panasonic YD-350AG2HGE with the maximum welding current of 350A are used for paraxial recombination. The laser was focused through a 220 mm focusing mirror to obtain a 0.5 mm diameter spot. The amount of defocus is -2 mm. The protection gas of the metal active-gas welding (MAG) is a mixture of 10% CO2+90% Ar with a flow rate of 17L/min. The test material was 150mm×30mm×6mm low-alloy high-nitrogen steel plate, and the welding was performed by plate butt welding. A stainless steel wire with a diameter of 1.2 mm was used, the dry protrusion length was 12 mm, and the arc welding pitch inclination was 60º. After welding, the weld section was obtained by computer numerical control (CNC) wire cutting. Then the tensile strength of welded sample was tested to obtain the corresponding tensile strength data. Under the welding test system platform, the MAG voltage is set at 25V and the welding speed is 1.2m/min. Taking the blunt height D, welding gap d, welding angle α, laser power P, and welding current I as the parameters of the hybrid welding process, 28 welding experiments were performed with the range of welding parameters D ∈ (2,4)mm, d ∈ (0.1,0.8)mm, α∈(30,60)°, P∈(2300,2800)W, I ∈ (200,280)A to get 28 welding specimens, which were applied to do the tensile test to get their tensile strength data (Table 1).

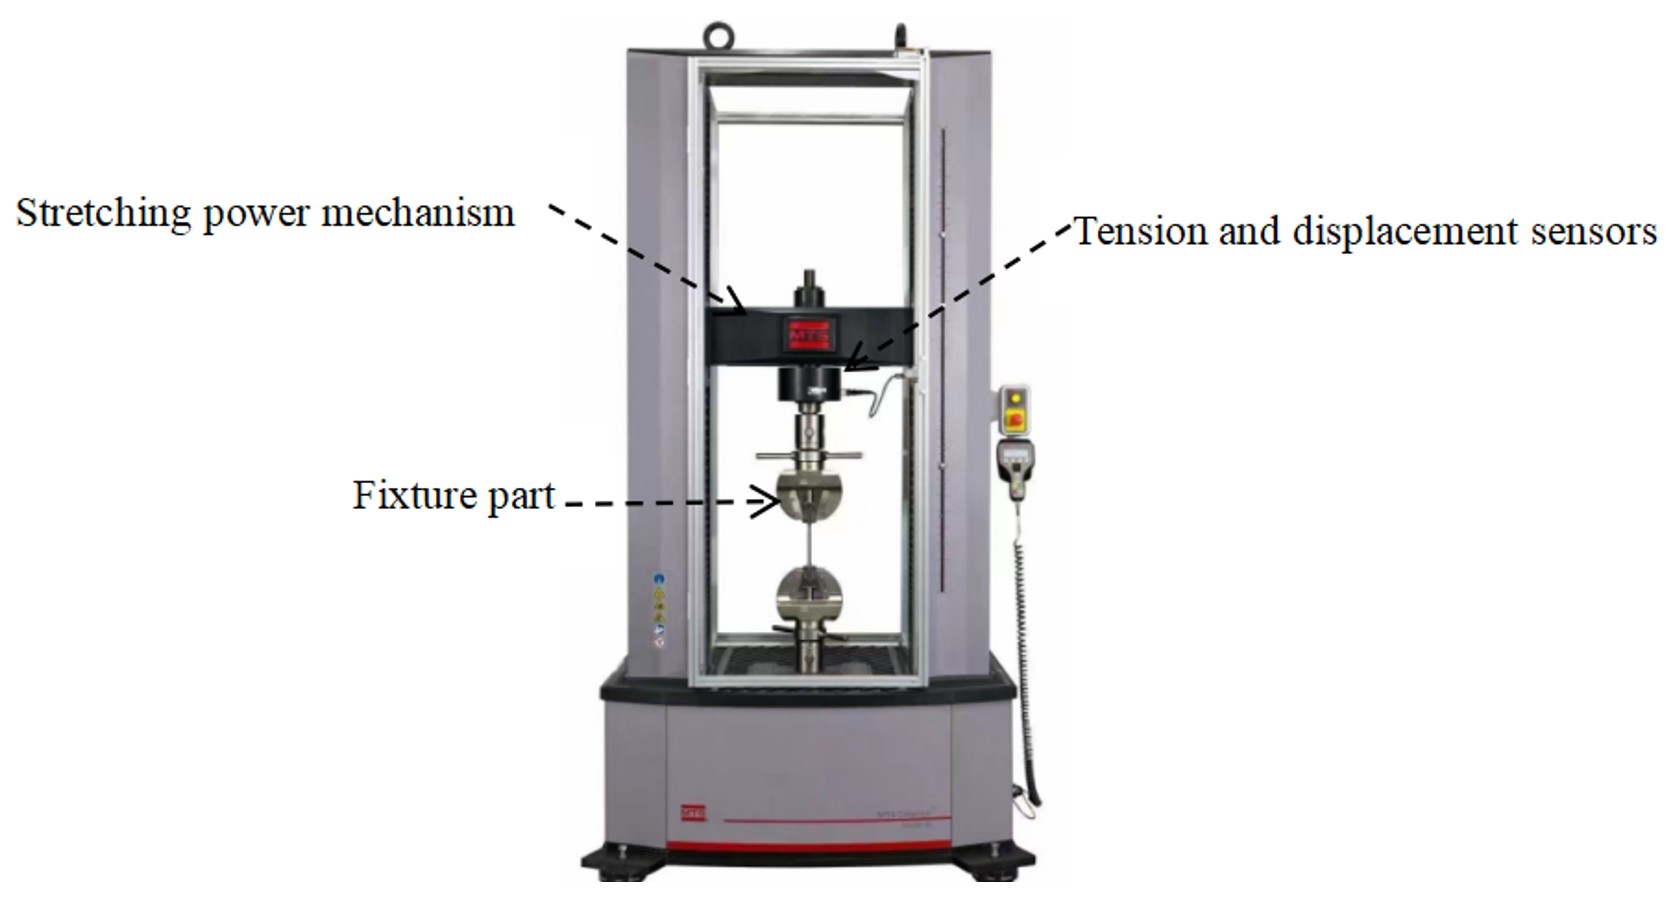
The tensile test will be carried on the tensile test platform shown in the Figure 2. The tensile test specimens were fixed in the fixture part and then gradually stretched through the hydraulic equipment on the tensile test platform. The stretching deformation and tension data are transmitted to the computer via sensors and are then saved.

3. Research Methodology
3.1. The flow chart of optimization of BP neural network
The internal weights and thresholds of the BP neural network determine its final prediction result. Optimizing the BP neural network with the Genetic Algorithm (GA) involves continuously adjusting the internal weight - thresholds based on the error of neural - network prediction, aiming to obtain a BP neural network with high accuracy in tensile - strength prediction. The process of the genetic algorithm optimizing the neural network is shown in Figure 3.

The optimization of the internal weight thresholds of the BP neural network is mainly divided into the following three modules: calculating the number of neurons in the BP neural network topology, training the neural network and calculating the prediction error, and decoding the internal weight thresholds of the neural network and optimizing them using the genetic algorithm.
3.2. Determining the topology structure of the neural network for the relationship between the hybrid welding process parameters and the tensile strength of the sample
The principal steps for the implementation of the neural network are as follows.
-
The predictive neural network for the tensile strength of welded joints in this paper employs the frequently - used three - layer BP neural network, consisting of the input layer, the hidden layer, and the output layer.
-
In the topology of neural networks, Formula 1 [17] can be used to calculate the number of hidden layer neurons.
where and represent the number of neurons in the input layer and hidden layer, respectively.
3.3. Initialization of the weight threshold of the BP neural network
According to the neural network topology constructed above, the initial weights and thresholds of the neural network are randomly set within the range of [-0.5, 0.5]. Since the initial weights and threshold values have a significant impact on the final training convergence result of the neural network, all the weights and threshold values are concatenated into a string, which serves as the optimal individuals of the genetic optimization algorithm. The string is presented in Figure 4.

3.4. Training and testing the errors of neural network
3.4.1. The training of neural network
Twenty - two groups were randomly selected from twenty - eight groups of hybrid welding tests. The corresponding welding process parameters and the tensile strength values of welded joints were utilized as the training data for the neural network. The number of training iterations was set to 100, the training termination error was set at 0.01, and the self - learning rate was set to 0.1.
3.4.2. Testing the prediction accuracy of the the trained neural network
After obtaining a well - trained neural network, the hybrid welding test data of groups 25 - 28 are used for testing. The welding process parameters are input into the trained neural network to predict the corresponding tensile - strength values, and the prediction error is calculated using the test data. The calculation formula is shown in Formula 2.
where: denotes the predicted tensile strength degree and denotes the actual measured tensile strength.
3.5. Optimization of BP neural network by MPGA
3.5.1. Population initialization
Based on the neural network topology, all the weight and threshold values are combined into a string to serve as the population individual of the genetic algorithm. Each value in the string is encoded using a 10 - bit binary code. The population size can be set within the range from 30 to 60. The number of populations can be set as 3.
3.5.2. Population individual fitness function
The fitness value of a population individual serves as an important basis for evaluating the superiority of an individual during the genetic - algorithm optimization process. Each individual in the population is decoded, and the decoded values are assigned to a newly - created BP neural network. The hybrid - welding process parameters of groups 23 - 24, including blunt edge (d/mm), welding gap (c/mm), notch angle (a/º), laser power (P/W), and welding current (I/A), are taken as inputs. The calculated prediction - error results are used as the individual fitness, and the formula is presented in Formulas 3 and 4.
where: is the fitness value corresponding to the individual and the prediction error of the corresponding neural network after compiling the corresponding individual.
3.5.3. MPGA optimization operator
3.5.3.1. Crossover operator and mutation operator
After calculating the fitness of each individual using the above formula, the crossover and mutation operators shown in Figure 5 are applied to iterate over the individuals, ensuring the diversity of population individuals. The process of the crossover and mutation operators is presented as follows. Commonly the crossover possibility and mutation possibility can be respectively set with the range (0.6,0.7) and (0.01,0.05).

3.5.3.2. Immigration operator
In the optimization process of the multi - population genetic algorithm, the iterative optimization processes of each population exist independently. However, the optimal individuals of each population can be exchanged via the transfer operator. Based on the fitness value, the migration operator introduces the best chromosomes from a specific population into other populations, thus realizing the exchange of chromosomes among populations. The migration operator can effectively address the local - convergence issue and shorten the optimization time.
3.5.4. Genetic algorithm parameter settings
The genetic algorithm employs the genetic toolbox developed by Sheffield. In this toolbox, the codes for selection, crossover, and mutation operations are all self - contained. The migration operator is independently developed by this project, and the fitness function is independently compiled in accordance with Formulas 2 and 3. The population size and number of populations determine the computational amount of which each computation represent a time of training of BP neural network. Taking the computational amount and accuracy into account, the parameters are set as in Table 2.
4. Experimental Results
4.1. The topology structure of the prediction BP neural network
The input parameters of the prediction neural network are five hybrid welding process parameters (blunt edge height, welding gap, welding angle, welding current, and laser power). So, the number of neurons in the input layer is 5. The output parameter is the tensile strength of the welding joint, so the number of neurons in the output layer is 1. According to the formula, we can calculate the number of neurons in the hidden layer, which is 11. The topology structure of the prediction neural network is 5 - 11 - 1.
Based on the above - mentioned neural network topology structure, the numbers of connection weights between the input layer and the hidden layer and between the hidden layer and the output layer are 5 × 11 = 55 and 11 × 1 = 11 respectively. The numbers of threshold values of the hidden layer and the output layer are 11 and 1 respectively. Table 3 shows the numbers of weight thresholds in the neural network.
Number of weight thresholds of neural network for tensile strength prediction of weld joints.
Given that the length of the string consisting of weights and thresholds is 78, each individual thus forms a binary string with a length of 780. As depicted in the figure below, bits 1 - 550 represent the decoding of the connection weights between the input layer and the hidden layer, bits 551 - 660 represent the decoding of the threshold values of the hidden layer, bits 661 - 770 represent the decoding of the connection weights between the hidden layer and the output layer, and bits 771 - 780 represent the decoding of the threshold values of the output layer. The schematic diagram of individual chromosome and MGPA population are shown in Figure 6 and 7.


4.2. The training and testing of BP neural network
The training data of 22 groups of welding process parameters and tensile strength are shown in Table 4 below.
Matlab software was used to program and create the above BP neural network structure, and the training data were imported into the neural network for training. The training regression fitting results were shown in the figure below. The corresponding test error is calculated according to Formula 1, and the relative error is calculated as shown in the following table.
It can be observed from Figure 8 that the fitting effect of the BP neural network trained with the set parameters is less than ideal, with the regression coefficient being only 0.82. The process parameters of the two selected groups of test samples were input into the trained neural network to obtain the predicted tensile strength. Subsequently, the test error was calculated by comparing the predicted values with the test data, as presented in Table 5.

The prediction error of the two groups of samples is large, and the subsequent process parameter optimization study cannot be carried out, so it is necessary to use a genetic algorithm to optimize the BP neural network.
4.3. Optimized BP neural Network Prediction Accuracy verification
After 40 generations of iterative optimization of all population individuals, the individual with the highest fitness 0.098 was obtained and selected as the weight - thresholds for the optimal tensile - strength prediction neural network model. The weight - thresholds of the neural network topology were then assigned through decoding. The welding process parameters of the remaining four groups of test samples were input into the optimized neural network to test its prediction accuracy. The hybrid welding process parameters of these four groups of test samples are presented in Table 6. The presented welding process parameters were input into the optimized neural network to obtain the corresponding predicted tensile - strength values of the welded joints. Subsequently, the predicted tensile - strength values were compared with the tensile - strength values obtained from the tensile tests, as shown in Table 7.
As can be observed from Table 7, the error accuracy between the predicted and measured values of the welded - joint tensile strength is within 5%. Owing to certain inevitable errors, such as those in the welding test and the measurement of tensile strength, it proves extremely challenging to acquire a globally optimal neural network model. Therefore, the optimized neural network model can serve as a mapping model for welding process parameters and tensile strength. By inputting different welding process parameters, the corresponding tensile - strength values can be obtained. Based on this, the optimization of welding process parameters based on the tensile - strength mechanical properties of welds is carried out.
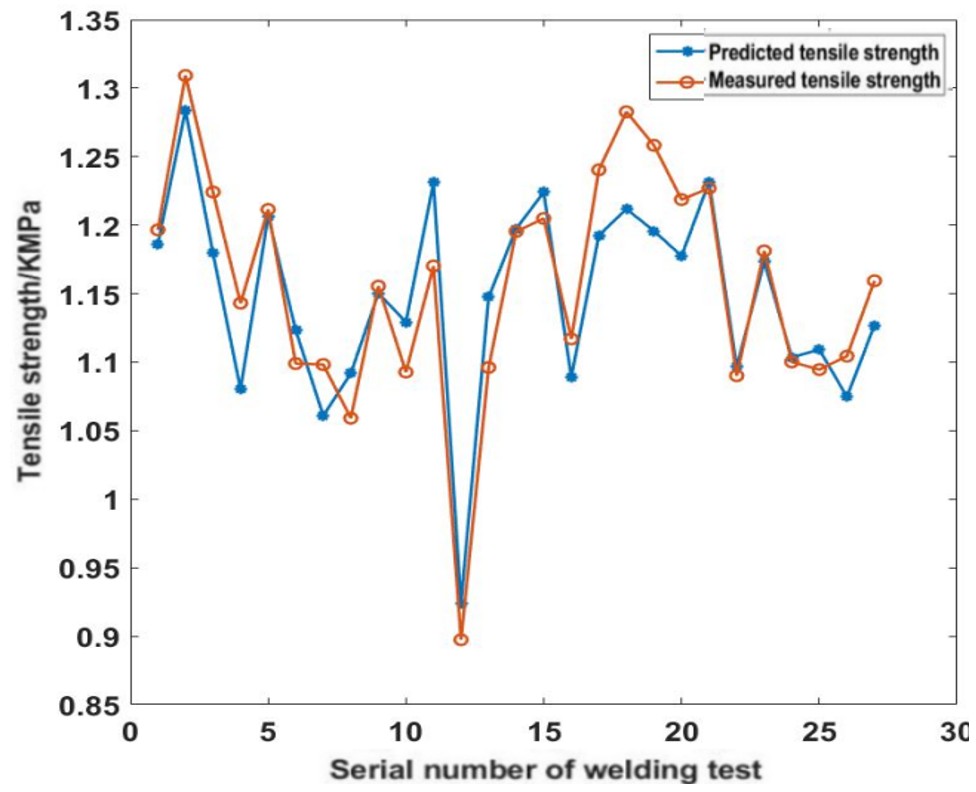
All 28 groups of welding parameters were input into the optimized neural network, and the corresponding predicted tensile - strength values were obtained and compared with the values measured in the test, as depicted in Figure 9.

As can be observed from the figure above, among all samples, the prediction error of sample No. 18 is the largest. Its error value is 0.07, and the relative error is 5.8%. Therefore, the optimized BP neural network exhibits high prediction accuracy, with an error accuracy of less than 6%. Consequently, it can serve as a generalized mapping model for the subsequent optimization of hybrid welding process parameters.
4.4. Influence of welding process parameters on mechanical properties
Mechanical properties are inherent characteristics of the material itself. Since the welding wire and the workpiece base material are different, during the welding process, different welding parameters will cause the fusion ratio of the base material within the weld (S base material /S weld) to vary. Different fusion materials will thus have different mechanical properties. The variation tr end of the mechanical properties of the welded joint with the fusion ratio is shown in Figure 10.

It can be seen from Figure 8 that the tensile strength mechanical property parameters of the fusion ratio between 0.52 and 0.55 and between 0.59 and 0.65 change almost synchronously with the increase of the fusion ratio, and the change trend is opposite between 0.55 and 0.59. In order to obtain good comprehensive mechanical properties, it is necessary to optimize the research according to the tensile strength prediction model to obtain the optimal combination of hybrid welding process parameters.
5. Maximum Tensile Strength Optimization Model and Test Verification
Based on the above - optimized BP neural network prediction model, optimizing the welding process parameters, namely blunt edge height D, welding gap d, welding Angle α, laser power P, and welding current I is a multi - parameter optimization problem. In this paper, GA is employed to optimize the hybrid welding process parameters. This algorithm simultaneously adopts multiple independent approaches with different evolutionary mechanisms and conducts the migration of excellent individuals among different populations, which can effectively mitigate the contradiction between individual diversity and convergence within populations. The algorithm features good global search ability, high optimization speed, and strong adaptability in a dynamically changing environment.
5.1. Optimization model of maximum tensile strength process parameters
where: is the welding process parameter of laser arc hybrid welding, is the tensile strength of welded sample, f is the “virtual” function of neural network model optimized by genetic algorithm; Is the selection range of welding process parameters. GA was used to optimize the combination of welding process parameters with the objective function shown in Formula 5. Set optimization variables as blunt edge (D/mm), welding gap (d/mm), welding angle (a/º), laser power (P/W), welding current (I/A) with the range shown as Formula 8: ,,,,. The tensile strength is set as the fitness value of a individual, which can be calculated with Formulas 6 and 7. The welding process parameters were optimized through the above optimization model, and the optimization iteration process was shown in Figure 11. The optimized maximum tensile strength value and corresponding hybrid welding process parameters were compared with the welding process parameters that obtained the maximum tensile strength in 28 groups of orthogonal hybrid welding tests shown in Table 8.

5.2. Hybrid welding test with optimal welding process parameters and numerical verification of tensile strength
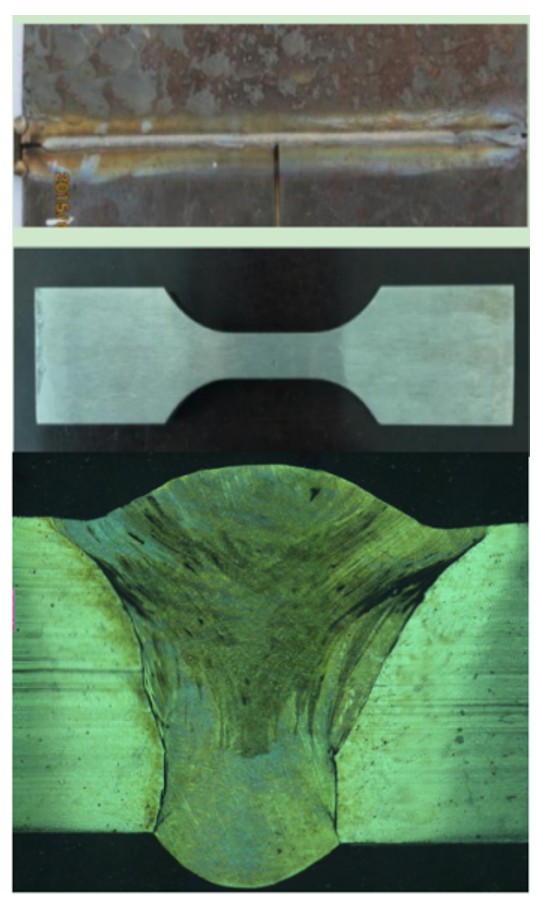
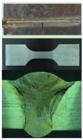
Through the optimization of welding process parameters, the welding parameters that result in the maximum tensile strength are as follows: a blunt edge of 3.1 mm, a welding angle of 51º, a welding gap of 0.37 mm, a welding current of 200 A, and a laser power of 2700 W. First, a high - strength steel plate with dimensions of 150 mm × 30 mm × 7 mm is obtained by wire cutting. Then, the steel plate is processed according to the optimized welding angle and the height of the blunt edge. The cut steel plate is installed on the self - designed welding test platform. The welding current of the welding machine is adjusted to 200 A, the laser power is set to 2700 W, and the gap between the two plates is adjusted to approximately 0.37 mm. The KUKA robotic arm is set to determine the welding path and welding height for the welding test, and the welding sample shown in the following figure is obtained. The welding template is cut on the wire - cutting machine into the shape specified for the tensile test. After grinding, the smooth - surfaced tensile test sample and its cross-sectional diagram of the welded specimen are finally obtained shown in Figure 12.
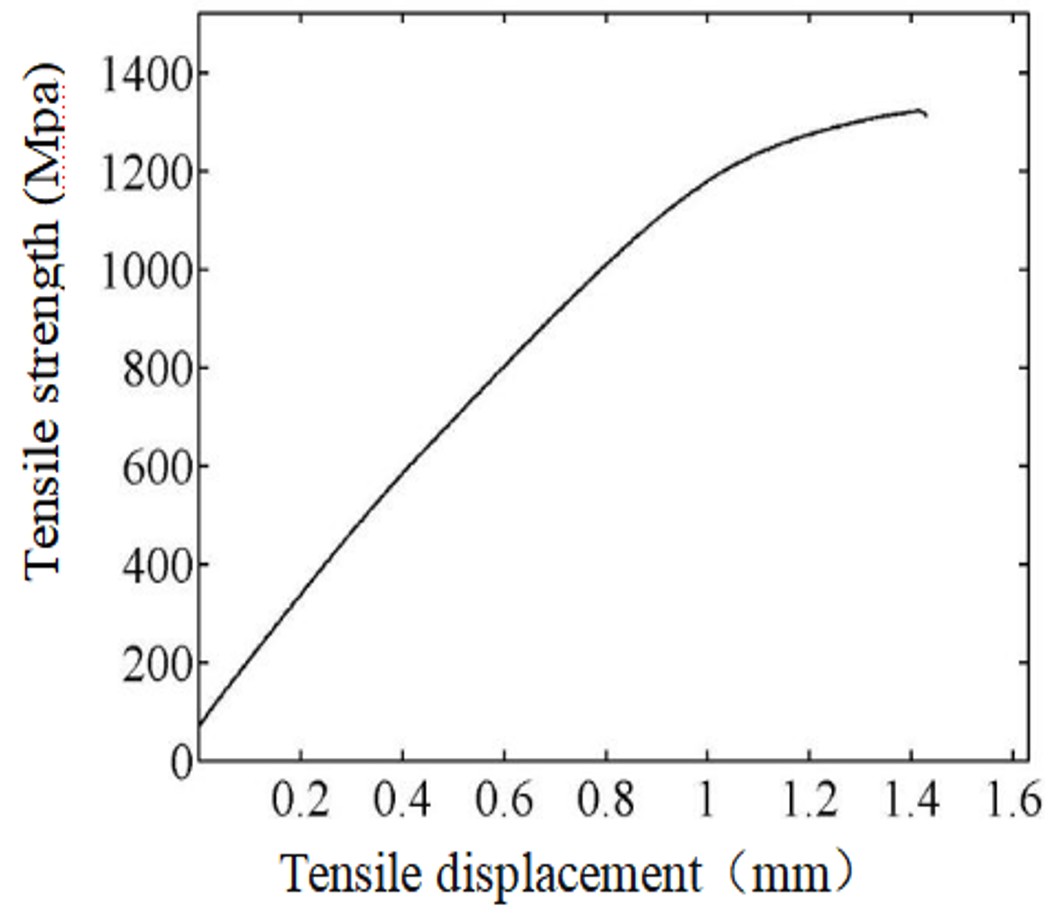
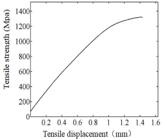
The data during the tensile-test process were meticulously recorded, as depicted in Figure 14 below. The curve graph can show the deformation displacement of the specimen as the tensile force increases. The tensile force at the moment when the specimen fractures is the maximum tensile strength of the specimen. Upon examining the graph, it was evident that the specimen underwent fracture when the maximum deformation displacement reached approximately 1.43 mm. Concurrently, the tensile strength at this critical point was measured to be 1.35 KMPa. The experimental findings demonstrate that the process-parameter optimization approach grounded in tensile strength can remarkably enhance the mechanical properties of the welded specimens.
The smooth-face tensile test specimen is fixed on the tensile test platform to have the tensile test. The pictures of the specimens during the test and after the test are shown in Figure 13.

6. Conclusions
-
This paper employs the multi - population genetic algorithm to decode and optimize the initial weight thresholds within the BP neural network. As a result, a BP neural network prediction model with relatively high precision for laser - arc hybrid welding process parameters and welded - joint tensile strength can be obtained. Experimental results demonstrate that the error accuracy between the tensile strength of the welded joint predicted by the optimized neural network model and the measured value is less than 6%.
-
In this paper, the tensile strength of the welded joint is taken as the objective function for the optimization of laser - arc hybrid welding process parameters, and the genetic algorithm is utilized to optimize the combination of hybrid welding process parameters. Through experiments, the tensile strength reaches 1.35 KMPa, which is significantly higher than the maximum tensile strength of 1.309 KMPa in the 28 - group orthogonal tests. Consequently, optimizing the welding process parameters based on the tensile strength of welded joints is of great practical significance.
Statements and Contributions
The authors declare that all data supporting the findings of this study are publicly available.
-
How to cite:
Hong Y, de Ocampo AL, Tan W, Zhong M, Li S. The research on optimization of laser-arc hybrid welding process parameters based on neural networks for maximum tensile strength of weld joint. Rev. Soldag. Insp. 2025;30:e3013. https://doi.org/10.1590/0104-9224/SI30.13
-
Funding
National Youth Science Foundation Project (51305044); Guangdong College Students Science and Technology Innovation Cultivation Special Fund Project (pdjh2022b1047).
References
- 1 Feng J, Zhang J, Chen Z. Parameter optimization and performance analysis of high repetition frequency laser welding of TA2/316L composite plate. Applied Laser. 2022;42(8):0001.
- 2 Li X, Dai X, Guo Z. Research on laser-arc hybrid welding process, microstructure and properties of 40Mn steel for vehicle axles. Applied Laser. 2024;1(9):8.
- 3 Qin P, Qian L, Huang J, Qiao H, Wang C. Optimization of laser transmission welding process parameters for glass fiber reinforced PBT based on response surface methodology. Welding Journal. 2023;(3):39-46.
- 4 Huang S, Huang L, Zhuo S. Research on optimization of design parameters of friction - type high - strength bolts based on MOGA genetic algorithm. Technology of Highway and Transport. 2023;39(5):81-87.
- 5 Hua C. Optimization of friction welding process parameters based on LSSVM and AFS. Transactions of the China Welding Institution. 2008;29(12):5. http://doi.org/10.3321/j.issn:0253-360X.2008.12.027.
-
6 Wang J, Quan Y, Gu M. Estimation of directional design wind speeds via multiple population genetic algorithm. Journal of Wind Engineering and Industrial Aerodynamics. 2021;210:104534. http://doi.org/10.1016/j.jweia.2021.104534
» http://doi.org/10.1016/j.jweia.2021.104534 -
7 Zhou Y, Zhou L, Wang Z, Wu J. Application of multiple-population genetic algorithm in optimizing the train-set circulation plan problem. Complexity. 2017;2017:3717654:1-3717654:14. http://doi.org/10.1155/2017/3717654
» http://doi.org/10.1155/2017/3717654 - 8 Liu S, Hong Z, Yan S. Effect of CO2 laser-MAG arc composite welding process parameters on droplet transition characteristics and weld morphology. Chinese Journal of Lasers. 2010;(12):8.
-
9 Lu Q, Hong D, Tan K, Xiang C. Welding quality prediction of rail AC flash welding based on BP artificial neural network. Transactions of the China Welding Institution. 2005;26(5):4. http://doi.org/10.3321/j.issn:0253-360X.2005.05.017
» http://doi.org/10.3321/j.issn:0253-360X.2005.05.017 - 10 Li C, Wang J, Yu S. Research on the dynamic behavior of laser stripes in GTAW molten pool and the method for predicting penetration. Jixie Gongcheng Xuebao. 2024;60(6):236-244.
- 11 Liang T, Yu L, Yang W. Optimization of TIG weld size prediction model based on BP neural network based on genetic algorithm. Journal of Shanghai Jiaotong University. 2013;47(11):1690-1696.
-
12 Hong Y. Prediction of the weld morphology and morphology symmetry degree in laser-arc hybrid welding. Applied Laser. 2022;42(6):7. http://doi.org/10.14128/j.cnki.al.20224206.013
» http://doi.org/10.14128/j.cnki.al.20224206.013 -
13 Han R, Song G, Liu X, Zhang Z, Liu L. The mathematical model for the prediction and optimization of weld bead geometry in all-position low-power pulsed laser-MAG hybrid welding. International Journal of Advanced Manufacturing Technology. 2023;126(11-12):5245-5258. http://doi.org/10.1007/s00170-023-11465-3
» http://doi.org/10.1007/s00170-023-11465-3 - 14 Parimi SK. Nonlinear improved adaptive optimized grey model for real-time monitoring and control of weld bead geometry in robot-assisted wire arc additive manufacturing. Communications on Applied Nonlinear Analysis. 2024;32(2s):408-422.
-
15 Dong Z, Wei Y, Zhan X, Wei Y. Genetic algorithm and neural network were combined to optimize the prediction model of mechanical properties of welded joints. Transactions of the China Welding Institution. 2007;28(12):4. http://doi.org/10.3321/j.issn:0253-360x.2007.12.017
» http://doi.org/10.3321/j.issn:0253-360x.2007.12.017 -
16 Wang L, Zhai Z, Zhu Z, Mao E. Path tracking control of an autonomous tractor using improved stanley controller optimized with multiple-population genetic algorithm. Actuators. 2022;11(1):22. http://doi.org/10.3390/act11010022
» http://doi.org/10.3390/act11010022 - 17 Zhang Q, He X. An improved method for selecting the number of nodes in BP neural network and its application. Journal of Xi’an Polytechnic University. 2008;22(4):4. http://doi.org/10.3969/j.issn.1674-649X.2008.04.023.
- 18 Lu Q, Hong D, Tan K. Welding joint quality prediction of rail AC flash welding based on BP artificial neural network. Transactions of the China Welding Institution. 2005;26(5):65-68.
- 19 Yu X, Hua S, Zhao X, Gavrilov A. Prediction of weld width based on artificial neural network. Transactions of the China Welding Institution. 2005;26(5):17-19.
- 20 Yi L, Wu G, Li C. Design of artificial neural network for optimization of CO2 welding process parameters. Hot Working Technology. 2008;37(5):93-95.
-
Editor:
Cleiton Carvalho Silva.