 Molecular characterization of two inbred-lines population of Psidium guajava L.
ABSTRACT
Guava, prized for its economic potential, is grown across Brazil. Addressing the challenge of limited cultivars, the Universidade Estadual do Norte Fluminense Darcy Ribeiro (UENF) launched a program to select promising genotypes, aiming to introduce new high-quality cultivars in the north and northwest Rio de Janeiro state. This study uses microsatellite markers to identify divergent genotypes for future crosses to assess the genetic diversity of guava genotypes from the first and second self-fertilization (S1 and S2) populations. From S1, 94 genotypes, and S2, 98 genotypes were selected across ten inbred lines based on morpho-agronomic traits. The molecular characterization utilized 21 polymorphic microsatellite markers to assess genetic parameters, calculate distances, analyze clustering, and determine the structure of each population. In S1, the average number of alleles (NA) per locus was 2.57, with higher expected heterozygosity (He) than observed heterozygosity (Ho), indicating more homozygous alleles. Unweighted Pair-Group Method with Arithmetic Mean (UPGMA) clustering formed five distinct groups, with Bayesian analysis identifying two groups. S2 had 2.23 alleles per locus, with lower genetic variability and four UPGMA groups. Simple sequence repeat (SSR) markers effectively discriminate genetic variability, which promotes guava breeding. Bayesian inference delineated clear genotype structures in both populations, highlighting potential advancements in breeding these inbred lines.
Keywords
SSR markers; genetic diversity; inbreeding
Introduction
Guava (Psidium guajava L.) is a fruit tree native to South America, widely distributed across Brazil. Despite thriving guava production nationwide, the Paluma cultivar dominates approximately 70 % of areas under cultivation on account of its efficient rooting of cuttings, robust vigor, and strong market acceptance (Pereira and Kavati, 2011).
In recent years, guava production has surged from 297,400 t in 2009 to 525,393 t in 2021, with Rio de Janeiro state ranking as the third-largest national producer, yielding an average of 23.8 t, up 9.3 t from 2018, as reported by IBGE (2021). Edaphoclimatic conditions, favorable soil, and proximity to port facilities favor guava cultivation. However, limited cultivar options persist, with only 18 registered in the National Cultivar Registry (RNC) and no specific cultivar tailored to the conditions in Rio de Janeiro.
To address this, the Universidade Estadual do Norte Fluminense Darcy Ribeiro (UENF) evaluates genetic divergence and inbreeding in guava inbred lines to develop superior genotypes with fixed alleles. Inbred guava lines cultivated from successive self-fertilizations free from inbreeding depression offer a promising way forward.
Given the perennial nature of guava, molecular markers provide a robust means for identifying genetic variation, overcoming limitations of both morphological and biochemical markers. Microsatellite markers, or simple sequence repeat (SSRs), are particularly advantageous because their abundance, codominant nature, multiallelic properties, robustness, and reproducibility (Zanella et al., 2017).
Microsatellite markers are crucial for characterizing S1 and S2 inbred lines, enabling genotype selection, tracking genetic variability, and exploring population structure. Combining molecular characterization with morpho-agronomic data facilitates the selection of genotypes suitable for fresh consumption and industrial processes, and advances cultivar development goals.
Given this context, we sought to estimate the variability and genetic structure between the genotypes of inbred lines S1 and S2 of guava using SSR microsatellite markers, indicating the most divergent genotypes for future crossings essential to continuing the UENF guava genetic breeding program.
Materials and Methods
Experimental design
The experiment was conducted at the experimental station on Ilha Barra do Pomba, which belongs to the UENF and is located in Itaocara, in the northwestern region of Rio de Janeiro state, Brazil (21°38’39” S, 42°03’30” W, altitude 77 m). The climate in this region is classified as Aw type, featuring an average annual temperature of approximately 22 °C and an average annual precipitation of 1297 mm. It is part of the Paraíba do Sul River Basin, as described by Alvares et al. (2013).
Origin and selection of genetic material
The experiment comprised two populations, both products of self-fertilization (Ambrósio et al., 2021). The first population (S1) comprised 18 families of inbred-lines, from which the most promising genotypes were selected for subsequent self-fertilization to form the second population (S2) with ten families of inbred-lines. Population S1 had 540 4-year-old plants, from which the most productive genotypes were identified. Specifically, eight genotypes from inbred line 11 and nine from inbred lines 1, 4, 6, 7, 8, 9, 10, and 17 were selected, together with eleven genotypes from inbred line 12. Cultivars Paluma, Pedro Sato, and Cortibel were included as controls, resulting in 94 genotypes selected from the S1 population. For sampling, new leaves were collected from the shoot after pruning.
The S2 population comprised 300 two-year-old plants, from which the most productive genotypes were identified. The selection criteria resulted in the choice of six genotypes from inbred line 1, one from inbred line 2, 16 from inbred line 3, 11 from inbred line 4, 19 from inbred line 5, 17 from inbred line 6, six from inbred line 7, five from inbred line 8, four from inbred line 9, and ten from inbred line 10. Cultivars Paluma, Pedro Sato, and Cortibel were again used as controls, bringing the total to 98 genotypes selected from the S2 population. Additional young leaves were collected for sampling.
Extraction of genomic material
The extraction processes were conducted at the Laboratório de Melhoramento Genético Vegetal (LMGV), at the Centro de Ciências e Tecnologia Agroalimentar (CCTA) at the UENF.
Genomic DNA was extracted from 188 genotypes, including the three controls: Paluma, Pedro Sato, and Cortibel. The extraction protocol was adapted from Doyle and Doyle (1990). DNA quantification was performed using a 1 % agarose gel in 1× TAE buffer (Tris, Sodium Acetate, EDTA, pH 8.0), with the 100-bp lambda marker (100 ng μL–1) from Invitrogen. Gel staining was conducted with a 1:1 ratio of Gel Red™ and BlueJuice™.
The resulting images were documented using the Mini Bis Pro system (Bio-Imaging Systems). Based on the visual information obtained, the DNA concentrations in the samples were estimated by comparing them with the 100-bp lambda marker. Samples were then diluted to achieve a working concentration of 10 ng μL–1.
Primer screening
Forty-seven pairs of SSR microsatellite primers, developed explicitly for P. guajava (GuavaMap, 2008), were tested. The primer screening process focused on determining the most effective annealing temperatures, which ranged from 48 to 60 °C, following the guidelines proposed by Silva et al. (2021). From this screening, 21 primers exhibiting polymorphism were selected for further analysis.
Polymerase chain reaction (PCR)
The PCR reagent mixture was prepared with a total volume of 13 μL per sample. This mixture consisted of 2 μL of DNA at a concentration of 10 ng μL–1, 1.5 μL of 10× Buffer (NH4SO4), 1.5 μL of MgCl2 at 25 mM, 1.5 μL of dNTPs (deoxynucleotide triphosphates) at 2 mM, 1 μL of primer mix (F + R) at 5 μM, and 0.12 μL of Taq-DNA polymerase at 5 U μL–1 (Invitrogen).
PCR amplification was carried out using Applied Biosystems/Veriti 96-well thermocyclers. The program consisted of 35 cycles, incorporating the following steps: an initial denaturation at 94 °C for 4 min, cycle denaturation at 94 °C for 2 min, annealing at the primer-specific temperature for 1 min, cycle extension at 72 °C for 2 min, and a final extension at 72 °C for 10 min, followed by holding at 4 °C.
The amplified PCR products were diluted at a ratio of 6 μL of sample to 18 μL of Buffer E from the DNF 900 kit. These diluted samples were then analyzed using a capillary electrophoresis system (Fragment Analyzer - Advanced Analytical Technologies Inc.), capable of separating amplified fragments ranging from 35 to 500 bp with a resolution of approximately 2 bp. Each electrophoresis run lasted approximately 3h30 min, at a voltage setting of 8 kW.
Statistical analysis
Statistical analyses were performed on both the S1 and S2 populations. The data derived from the amplification of SSR primers were converted into a numerical matrix representing each allele per locus. This matrix assigned values ranging from one to the maximum number of alleles (NA) to distinguish homozygous (11, 22, 33) and heterozygous (12, 13, 23) forms. Genetic dissimilarity matrices were computed using unweighted and weighted indices, and the Smouse-Peakall index (Peakall and Smouse, 2012), employing GENES software (Cruz, 2013). A dendrogram was subsequently generated from the genetic dissimilarity matrix using the Unweighted Pair-Group Method with Arithmetic Mean (UPGMA) approach, facilitated by R software.
The numerical matrix data were then analyzed using PowerMarker v3.5 software (Liu and Muse, 2005), which facilitated the estimation of the following measures of genetic diversity: NA per locus, expected heterozygosity (He, Eq. 1), observed heterozygosity (Ho, Eq. 2), polymorphism information content (PIC), and the fixation index (F) at the individual level. This was calculated using the following expression:
where Xi: frequency of allele i; K: NA.
The Ho was estimated by the formula below:
where Nij: number of heterozygotes at each locus; n: total number of individuals studied.
The PIC was calculated using the following expression (Eq. 3):
where : primer informativeness; ΣΣ pi2 pj2: frequency of allele p in primer j.
The F, which estimates the average inbreeding coefficient, can be determined by the following expression (Eq. 4):
where Hef: frequency of heterozygotes; Hof: frequency of homozygous individuals.
Analysis of population structure
To examine the population structure of the genetic materials, a Bayesian clustering algorithm-based method, employing Structure software version 2.3.4 (Pritchard et al., 2000), was used. For this analysis, the “no admixture/independent allele frequencies” model was selected. The procedure included a burn-in period of 250,000 iterations, succeeded by a Markov Chain Monte Carlo extension of 750,000 iterations. Ten simulations were conducted to verify the consistency of cluster numbers, with K values ranging from one to ten.
The ΔK statistical test was conducted using the “Structure Harvester” tool, adhering to the guidelines set forth by Evanno et al. (2005). This approach evaluates the mean and standard deviation of the estimated Logarithm of the Probability of the data (LnP(D)) across each of the ten iterations for every K value. The ΔKi values were determined using the equation (Eq. 5):
where i denotes the number of simulated groups, extending from i = 1 to i = 10, and ABS signifies the absolute value.
For each K, an ΔK value is calculated, with the highest value indicating the optimal K. Upon identifying the optimal ΔK, we selected the simulation that exhibited the lowest LnP(D) value from the ten simulations conducted to derive it. Each color in the resulting graph symbolizes a potentially structured individual group.
Results
Characterization of inbred lines in the guava S1 population
To characterize the 94 genotypes within ten inbred S1 inbred lines, 21 polymorphic loci were employed. Genetic variability assessments, detailed in Table 1, revealed 54 alleles, with variations ranging from two to four alleles per locus and an average of 2.57 alleles per locus. Predominantly, the He surpassed the Ho, except for locus mPgCIR039, where the opposite was observed. The mean He and Ho values were 0.403 and 0.227, respectively.
The PIC, an index indicative of the discriminatory capacity of the loci, ranged from 0.287 (mPgCIR240) to 0.459 (mPgCIR030), averaging at 0.303. These findings demonstrate substantial genetic diversity within the S1 population, notably identifying primers mPgCIR030 and mPgCIR174 as being particularly efficacious in discriminating genetic variability.
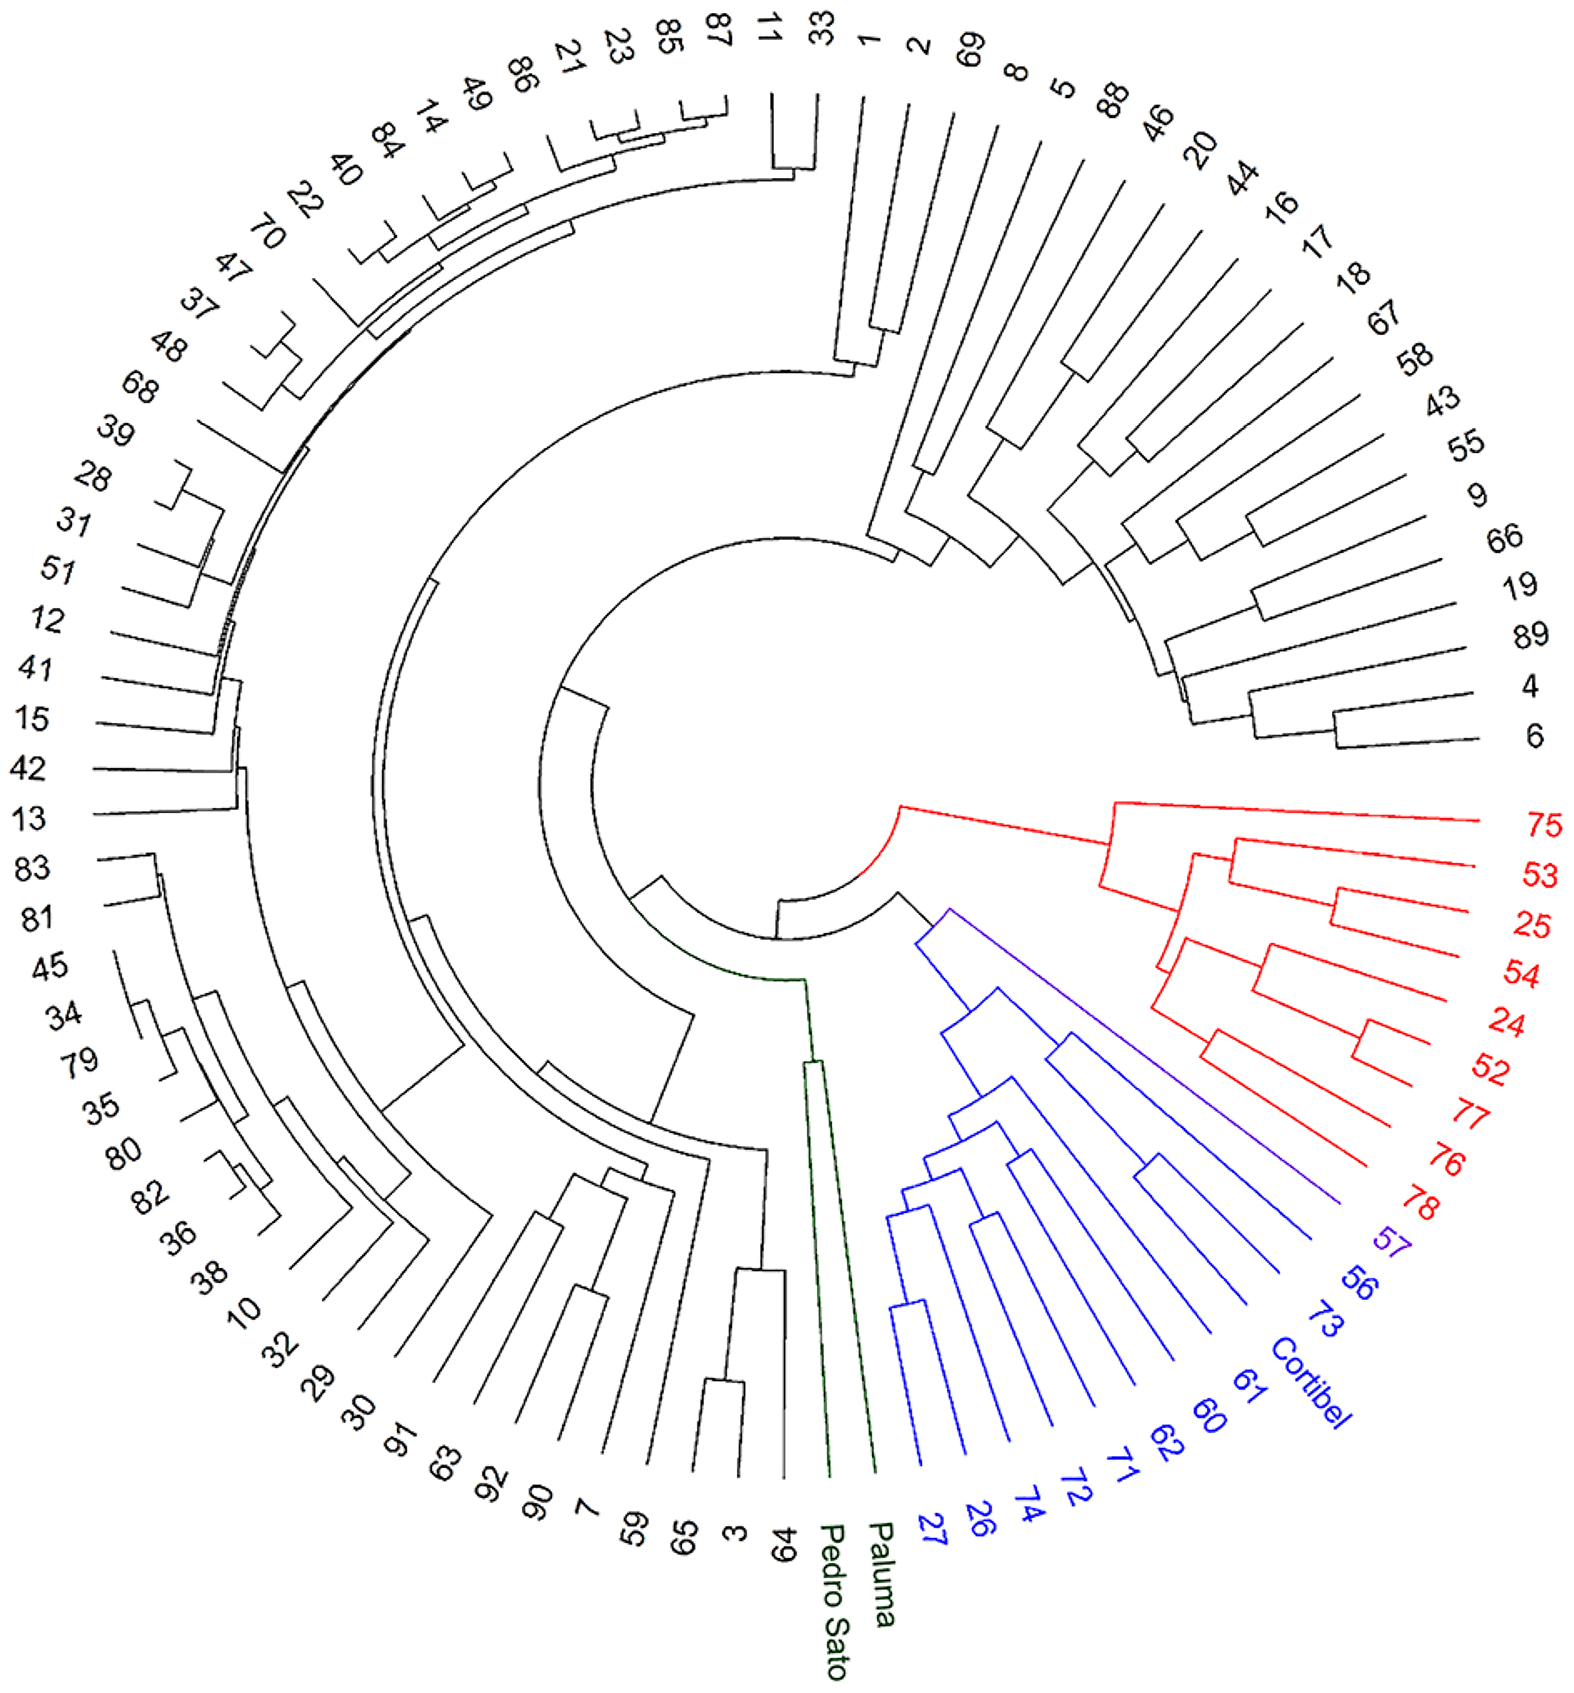
The dendrogram, derived from the genetic dissimilarity matrix via the Weighted Index, demonstrated an optimal cophenetic correlation coefficient of 0.82 (Figure 1), revealing the formation of five distinct groups per the criteria proposed by Mojena (1977).

– Dendrogram of genetic dissimilarity between 94 guava genotypes from the S1 population, obtained by the Unweighted Pair-Group Method with Arithmetic Mean (UPGMA) method, via simple sequence repeats (SSR) markers. Group 1 in black (71 genotypes), Group 2 in blue (11 genotypes), Group 3 in purple (one genotype), Group 4 in red (10 genotypes) and Group 5 in green (two genotypes).
In the first group, 75.53 % or 71 genotypes of the genotypes studied were characterized by desirable morpho-agronomic traits related to various parameters such as fruit weight, fruit length, fruit diameter, peel thickness, mesocarp thickness, endocarp thickness, pulp weight, yield, and Brix.
Group 2, comprising 11 (9.57 %) genotypes, exhibited superior morpho-agronomic traits compared to the first group, with higher means across the traits above. A solitary genotype, number 57, constituted the third group, distinguished by its pronounced genetic dissimilarity.
The fourth group, accounting for 11.70 % or ten genotypes alongside the Cortibel control, indicated closer genetic affinity with this control, particularly marked by higher yield-per-plant performance. Two control varieties, Pedro Sato and Paluma, formed the fifth group, representing 2.13 %.
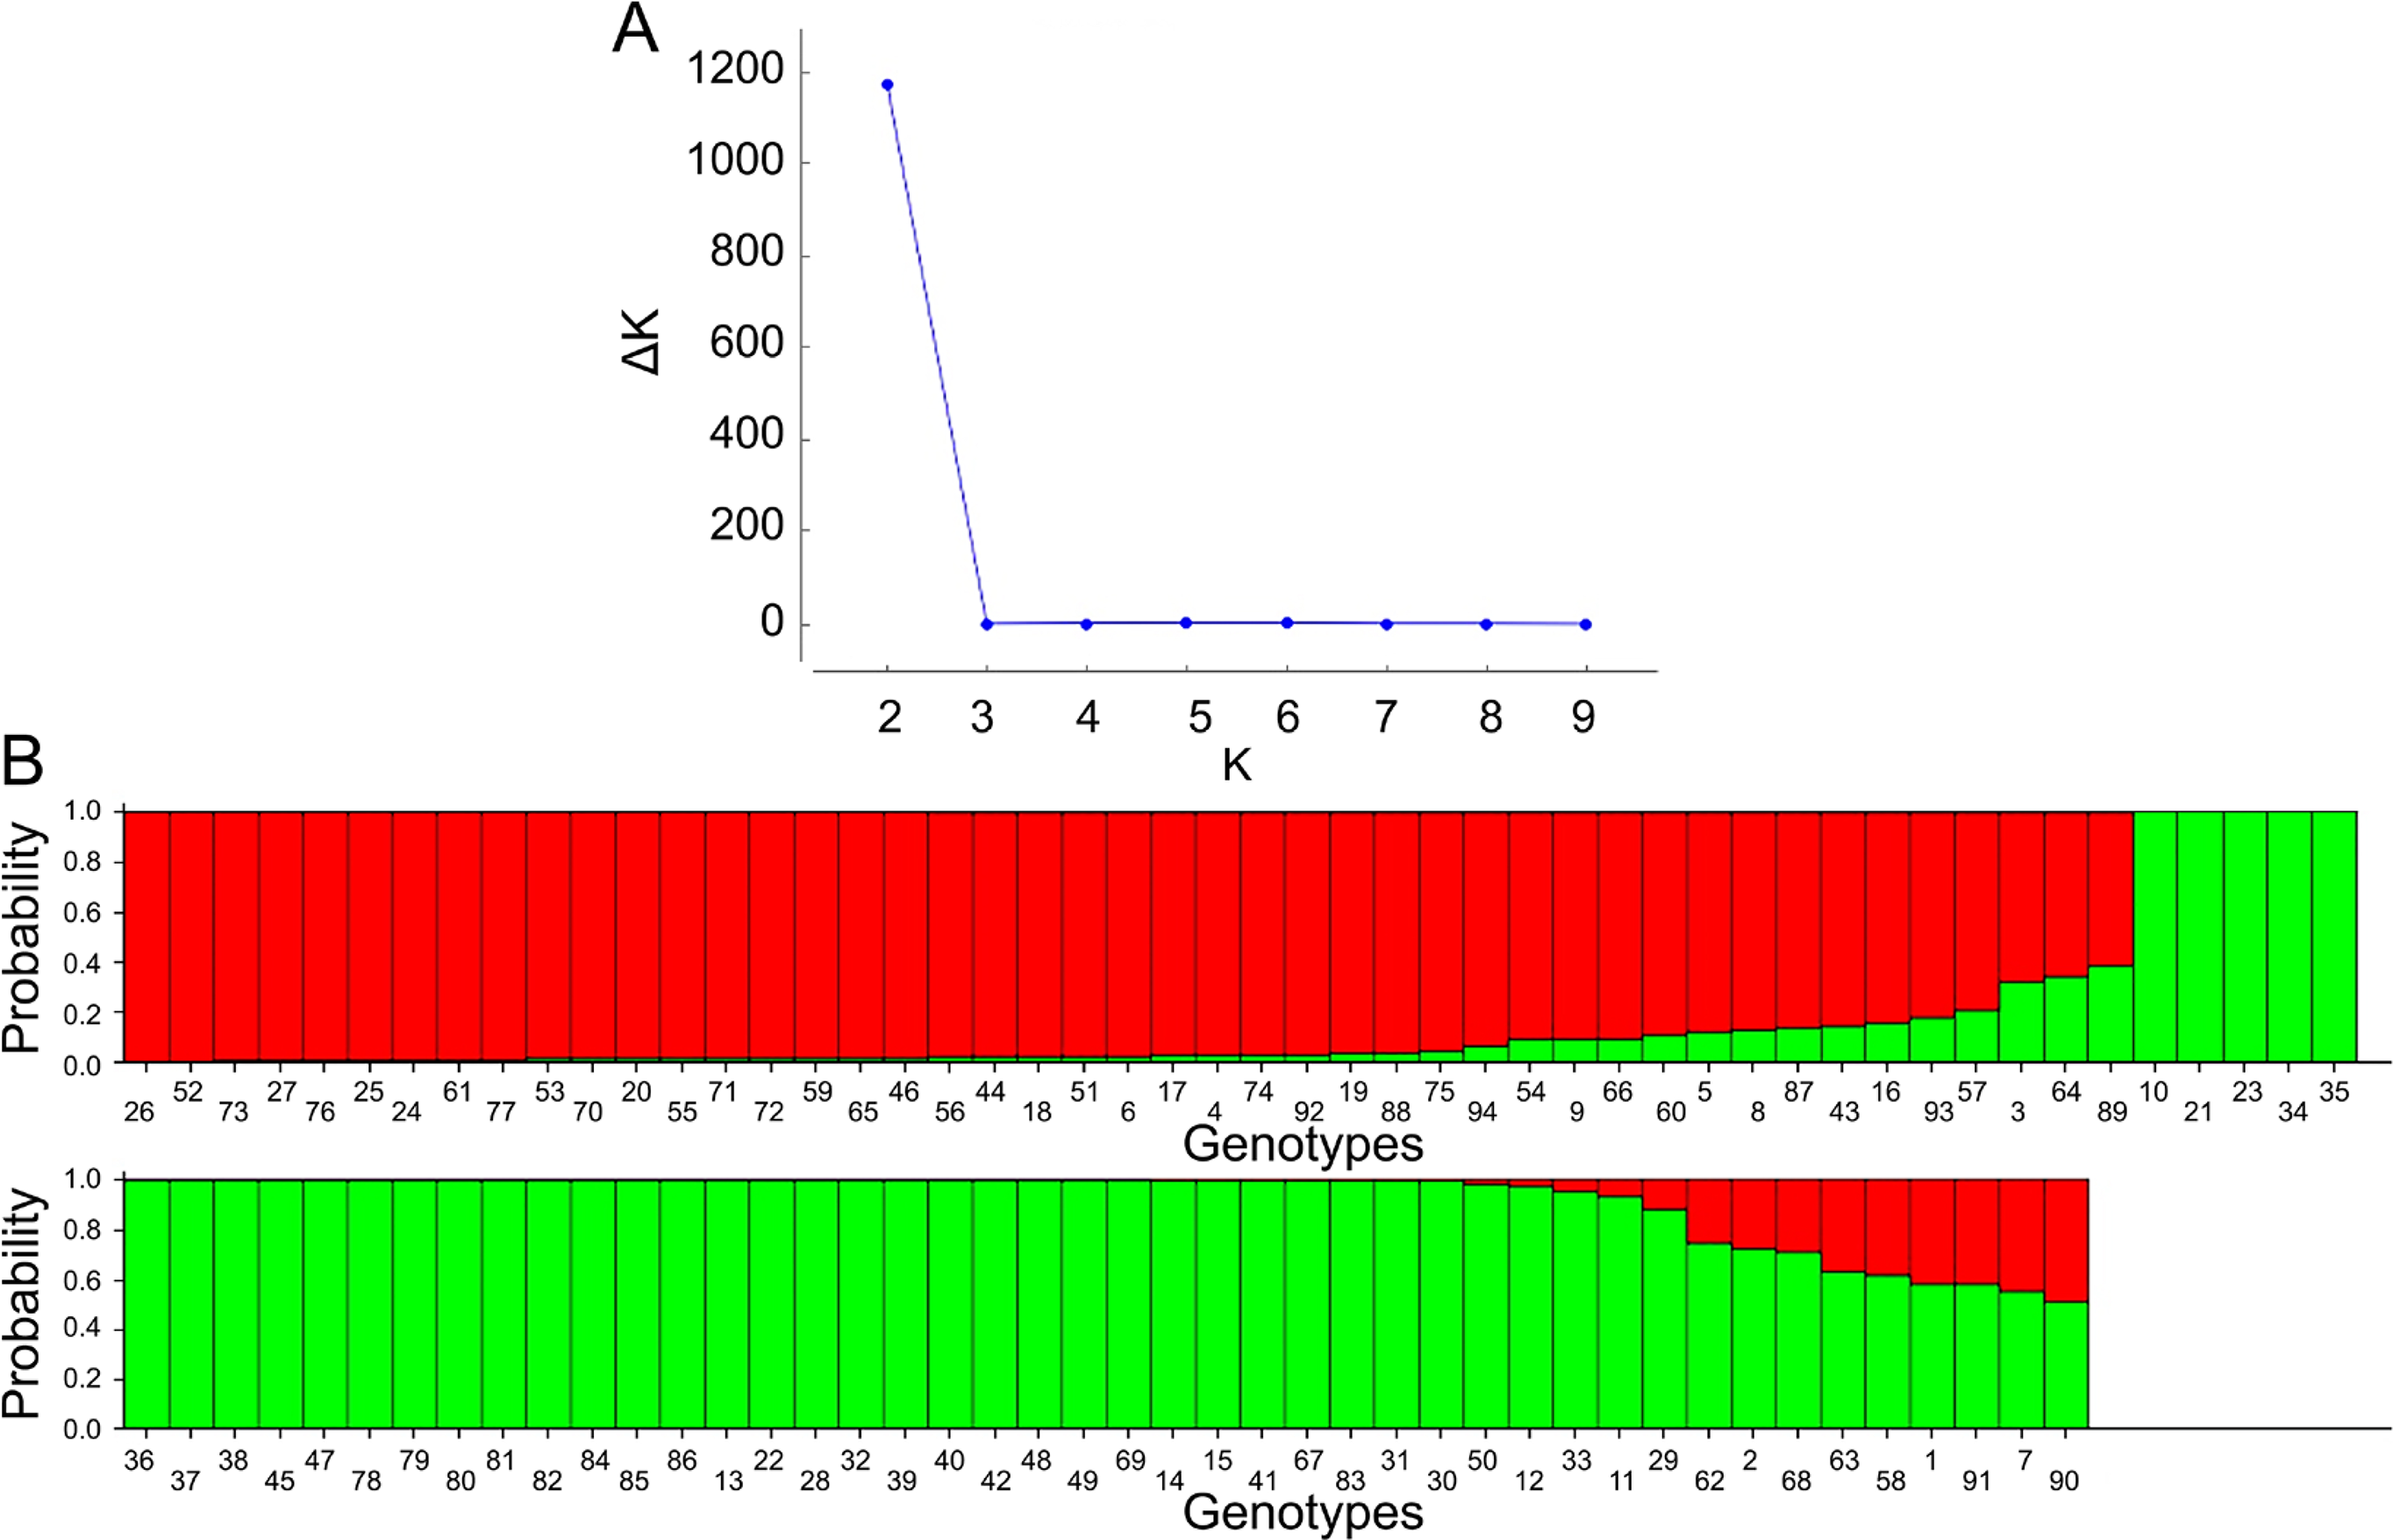
The structure of the population was scrutinized using Bayesian methodology, following the framework of Evanno et al. (2005) through Structure software. The allele matrix facilitated inferences regarding the population structure of the 94 genotypes examined. The Δk value suggested the presence of two well-defined populations. Bayesian analysis clustering (Figure 2) allocated 43 genotypes plus the control cultivars Paluma, Pedro Sato, and Cortibel to Group 1, while Group 2 consisted of 51 genotypes.
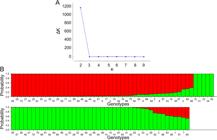
– A) ΔK peak plot illustrating the optimal number of genetic clusters; B) Cluster generated through Bayesian inference for 91 genotypes from population S1 and three cultivars: Paluma (92), Pedro Sato (93), and Cortibel 1 (94). Genotypes are depicted along the horizontal axis, with each genetic group represented by a distinct color. K = number of alleles.
Inbred lines of guava population S2
Twenty-one polymorphic loci were utilized to characterize the 98 genotypes across ten inbred lines S2. Genetic variability analysis, as presented in Table 2, identified 47 alleles, with variations ranging from two to three alleles per locus and an average of 2.23 alleles per locus. The Ho values were consistently lower than He, averaging 0.420 and 0.185, respectively. The PIC ranged from 0.170 (mPgCIR203) to 0.474 (mPgCIR174), averaging 0.333, indicating moderate discrimination among the loci assessed.
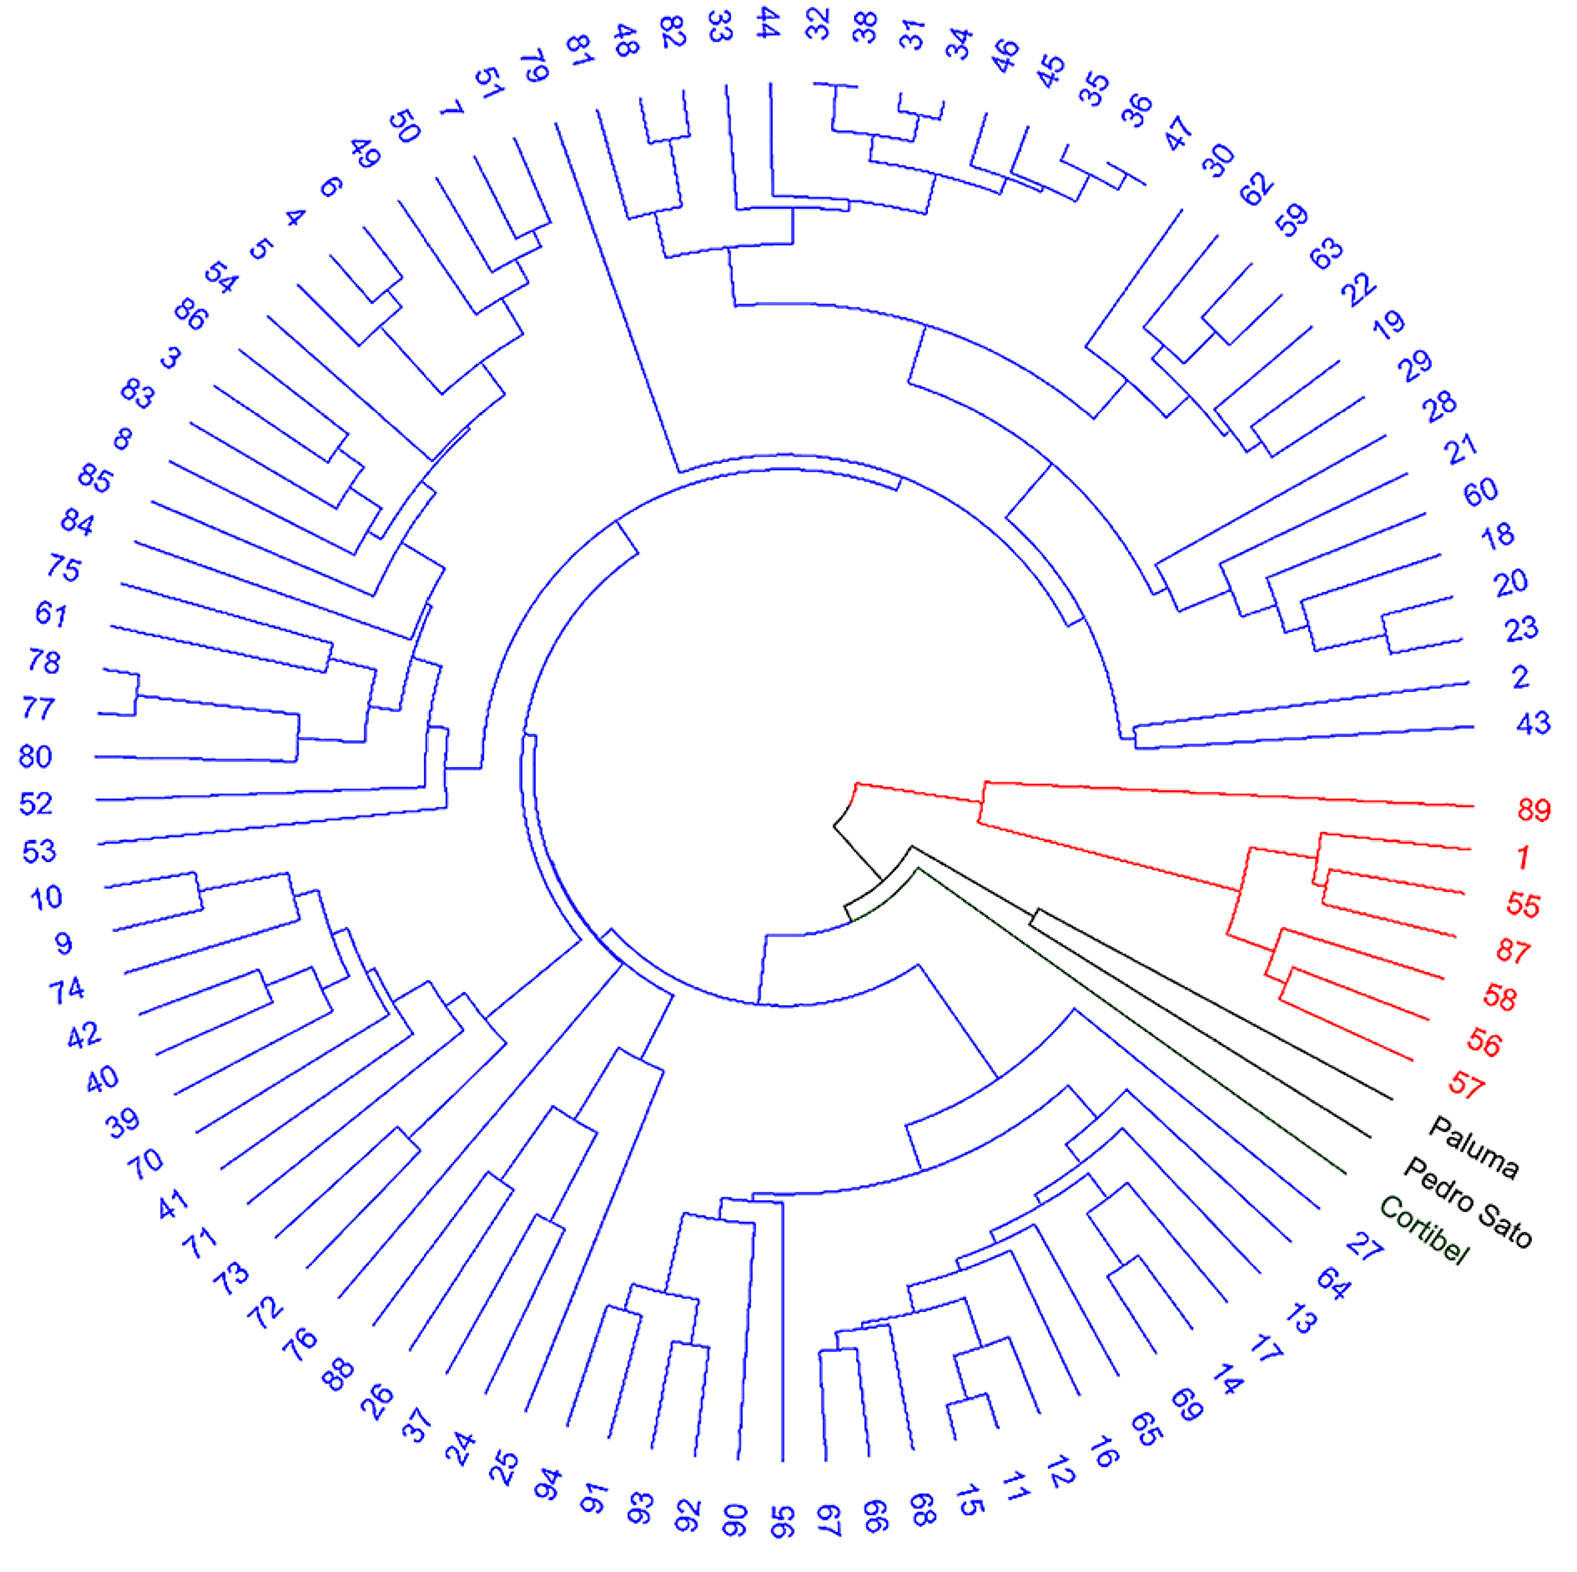
The genetic diversity within the 98 guava genotypes of the S2 population was evaluated using a genetic dissimilarity matrix and the Weighted Index, yielding a cophenetic correlation coefficient of 0.86. A dendrogram was generated using the UPGMA hierarchical clustering method, revealing four distinct groups by the cutoff criteria proposed by Mojena (1977) (Figure 3).

– Dendrogram of genetic dissimilarity among 98 guava genotypes from the S2 population, obtained by the Unweighted Pair-Group Method with Arithmetic Mean (UPGMA) method, via simple sequence repeats (SSR) markers. Group 1 in blue (88 genotypes), Group 2 in red (eight genotypes), Group 3 in black (two genotypes), Group 4 in green (one genotype).
Group 1 encompassed 89.80 % of the genotypes analyzed, totaling 88 genotypes. This group consisted of genotypes exhibiting higher means for the morpho-agronomic traits of fruit diameter, peel thickness, yield, and Brix. Group 2, accounting for 7.14 % of the genotypes, consisted of seven genotypes. These were distinguished by their morpho-agronomic traits, particularly fruit weight, fruit length, mesocarp thickness, endocarp thickness, and pulp weight.
The remaining groups consisted solely of the control cultivars employed in the study. Group 3, accounting for 2.04 %, comprised exclusively of the Paluma and Pedro Sato controls. The fourth group, representing 1.02 % of the total, included only the Cortibel control, which exhibited greater genetic variability than the other genotypes analyzed.
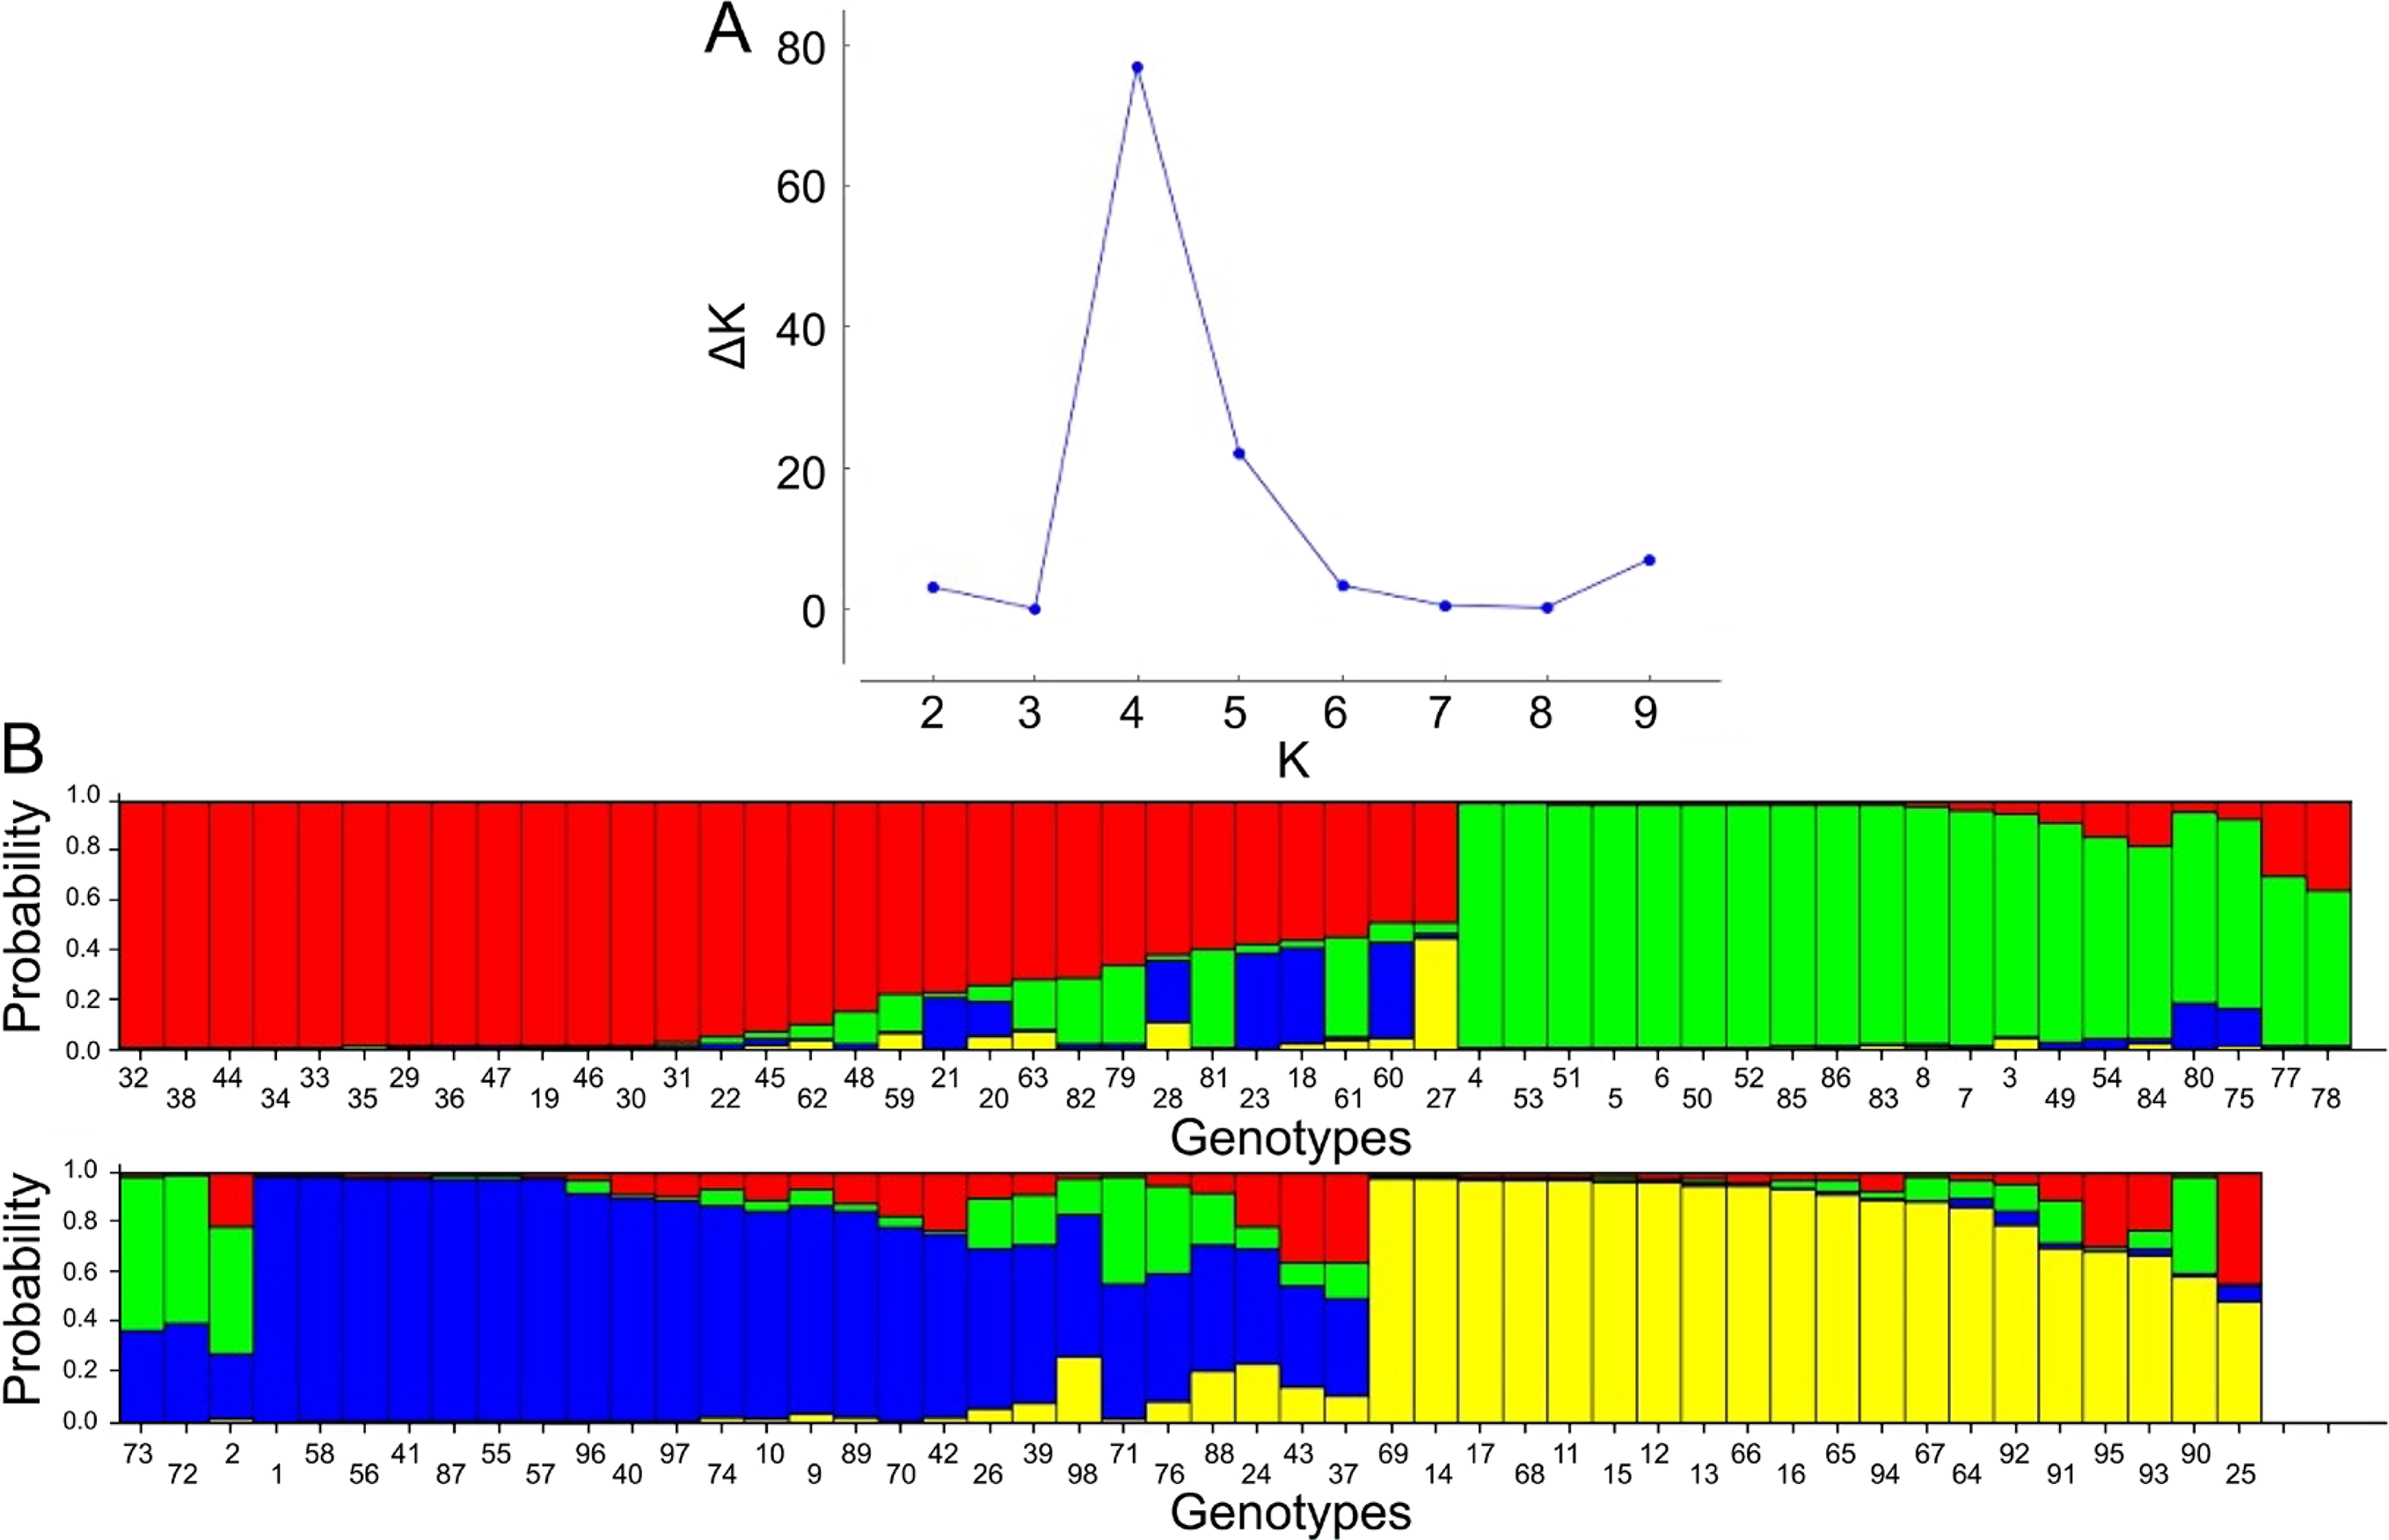
The population structure was examined using a Bayesian method in line with the guidelines set by Evanno et al. (2005). The ΔK value suggested the existence of four well-defined populations. Bayesian analysis-derived clustering (Figure 4) distributed 30 genotypes into Group 1 and 23 into Group 2. Group 3 comprised 25 genotypes, while Group 4 contained 20 genotypes. The emergence of these four groups indicates significant allelic differentiation among the analyzed genotypes.

– A) ΔK peak plot demonstrating the optimal number of genetic clusters; B) Clustering via Bayesian inference for 94 genotypes from population S2 and three cultivars: Paluma (96), Pedro Sato (97), and Cortibel 1 (98). The genotypes are represented along the horizontal axis, with each genetic group denoted by a distinct color. K = number of alleles.
Discussion
Utilizing molecular markers in breeding programs is an excellent tool, allowing for exploring genetic variability and identifying superior alleles within populations. In this study, the 21 polymorphic microsatellite loci detected 54 alleles in the S1 population and 47 alleles in the S2 population of inbred lines. In contrast, others identified 112 alleles using 48 microsatellite loci in full-sib populations (Silva et al., 2021) and found 96 alleles with 45 loci in guava full-sib families (Oliveira et al., 2022). The allele count indicates the polymorphism rate of the selected loci, thereby enhancing the reliability of the results.
In both populations, four alleles for the loci mPgCIR030 and mPgCIR166 were identified with low frequencies of 0.016 and 0.349 in population S1 and 0.011 and 0.005 in population S2, respectively. Other authors have also reported rare alleles in guava populations, which are responsible for maintaining high genetic variability under natural conditions (Kumar et al., 2020). The low frequency of these alleles suggests a risk of their loss during generational advancement in the development of inbred lines.
The Ho and He values of the loci suggest that the microsatellite loci effectively revealed genetic variability among the genotypes. The average Ho and He values were 0.227 and 0.403 for the S1 population and 0.180 and 0.412 for the S2 population, respectively, with Ho being lower than He. This indicates a predominance of homozygous genotypes in the population. The reduction in average Ho value in population S2 was anticipated and is associated with the methods of population management. Obtaining inbred lines in guava is feasible, as evidenced by the lack of severe inbreeding depression (Krause et al., 2021).
As regards the fixation of loci in the studied populations, only locus mPgCIR035 showed complete fixation in the S1 population and locus mPgCIR091 in the S2 population. The other loci exhibited varying degrees of fixation in both populations. Notably, locus mPgCIR039 showed a negative value (–0.478) in population S1, indicating that alleles for this locus were not becoming fixed, whereas in population S2, the same locus exhibited a fixation value of 0.955. This variation in fixation values may be attributed to the different genotypes selected and characterized in populations S1 and S2. Regarding the PIC, all loci displayed values below 0.5, classifying them as low to moderately informative (Botstein et al., 1980).
The analysis of genetic variability among the genotypes in population S1 revealed distinct Ho values, suggesting effective locus discrimination. Concerning inbreeding levels, utilizing 21 microsatellite loci, 47 genotypes were identified with inbreeding values surpassing the mean. In population S2, 52 genotypes exhibited inbreeding values above the mean. Genotypes exceeding the mean inbreeding values are deemed suitable for advancing generations due to their partial or complete allele fixation at the analyzed loci, potentially reducing the time required to obtain inbred lines.
Cluster analysis of population S1, conducted using UPGMA (Figure 1) and Bayesian inference (Figure 2) methods, revealed genetic variability, corroborating the descriptive analysis outcomes of the loci and population. The dendrogram illustrated the formation of five unique groups, providing a basis for selecting genetically diverse genotypes for subsequent crossing phases. Conversely, Bayesian inference suggested an optimal K value of 2, signifying the division into two groups when genotypes share significant portions of the analyzed genomic regions, as observed in this study (Oliveira et al., 2022).
In population S2, the UPGMA (Figure 3) and Bayesian inference (Figure 4) methods yielded more favorable results, delineating four distinct groups and demonstrating more effective genetic differentiation among the genotypes. Compared to population S1, a decrease in allele sharing among genotypes was observed, thereby enhancing the potential for biparental crosses.
Genotype selection in populations S1 and S2 was guided by criteria such as inbred family, genetic variability, allele fixation, and yield-related data from studies conducted by the laboratory team (Ambrósio et al., 2021). Therefore, the following genotypes were selected for population S1: 52, 53, 75, 51, and 74 (family 1); 17, 66, 19, 65, and 18 (4); 8, 58, 90, 56, and 7 (6); 45, 4, 87, 46, and 6 (7); 26, 27, 73, 72, and 60 (8); 79, 81, 35, 36, and 34 (9); 67, 69, 62, 68, and 2 (10); 38, 37, 29, 32, and 31 (11); 47, 48, 21, 49, and 84 (12); and 13, 14, 40, 83, and 15 (17). For population S2, the following genotypes were selected: 58, 87, 57, 56, 55, and 1 (family 1); 2 (2); 84, 53, 83, 52, and 86 (3); 41, 40, 73, 42, and 71 (4); 95, 14, 93, 92, and 69 (5); 79, 19, 77, 22, and 78 (6); 89, 25, 26, 88, and 37 (7); 29, 30, 43, 28, and 27 (8); 32, 38, 31, and 33 (9); and 44, 34, 45, 35, and 36 (10).
The microsatellite markers effectively revealed genetic diversity within both populations, highlighting the need for further self-pollination cycles to reduce genetic variation among genotypes within the same family.
The analysis of population structure showed allele sharing among the guava full-sib families studied. However, successive self-pollination cycles are progressively reducing this allele sharing between families.
Acknowledgments
This study was financed in part by the Fundação Coordenação de Aperfeiçoamento de Pessoal de Nível Superior (CAPES) – Finance Code 001. This study was financed by Fundação Carlos Chagas Filho de Amparo à Pesquisa do Estado do Rio de Janeiro (FAPERJ) – Finance Code E-26/010.001454/2019. This study was financed by Conselho Nacional de Desenvolvimento Científico e Tecnológico (CNPq).
References
-
Alvares CA, Stape JL, Sentelhas PC, Gonçalves JLM, Sparovek G. 2013. Köppen's climate classification map for Brazil. Meteorologische Zeitschrift 22: 711-728. https://doi.org/10.1127/0941-2948/2013/0507
» https://doi.org/10.1127/0941-2948/2013/0507 -
Ambrósio M, Viana AP, Ribeiro RM, Preisigke SC, Cavalcante NR, Silva FA, et al. 2021. Genotypic superiority of Psidium guajava S 1 families using mixed modeling for truncated and simultaneous selection. Scientia Agricola 78: e20190179. https://doi.org/10.1590/1678-992X-2019-0179
» https://doi.org/10.1590/1678-992X-2019-0179 - Botstein D, White RL, Skolnick M, Davis RW. 1980. Construction of a genetic linkage map in man using restriction fragment length polymorphisms. American Journal of Human Genetics 32: 314-331.
-
Cruz CD. 2013. GENES: a software package for analysis in experimental statistics and quantitative genetics. Acta Scientiarum 35: 271-276. https://doi.org/10.4025/actasciagron.v35i3.21251
» https://doi.org/10.4025/actasciagron.v35i3.21251 - Doyle JJ, Doyle JL. 1990. Isolation of plant DNA from fresh tissue. Focus 12: 13-15.
-
Evanno G, Regnaut S, Goudet J. 2005. Detecting the number of clusters of individuals using the software STRUCTURE: a simulation study. Molecular Ecology 14: 2611-2620. https://doi.org/10.1111/j.1365-294X.2005.02553.x
» https://doi.org/10.1111/j.1365-294X.2005.02553.x -
GuavaMap. 2008. Improvement of Guava: Linkage mapping and QTL analysis as a basis for marker-assisted selection. Available at: http://cordis.europa.eu/project/id/15111 [Accessed Feb 05, 2024]
» http://cordis.europa.eu/project/id/15111 - Instituto Brasileiro de Geografia e Estatística [IBGE]. 2021. Produção Agrícola Municipal. IBGE, Rio de Janeiro, RJ, Brazil (in Portuguese).
-
Krause W, Cavalcante NR, Viana AP, Ambrósio M, Santos EA, Vieira HD. 2021. Genetic variability in inbred guava families mediated by agronomic traits. Functional Plant Breeding Journal 3: 61-71. http://doi.org/10.35418/2526-4117/v3n2a5
» http://doi.org/10.35418/2526-4117/v3n2a5 -
Kumar C, Kumar R, Singh SK, Goswami AK, Nagaraja A, Paliwal R, et al. 2020. Development of novel g-SSR markers in guava (Psidium guajava L.) cv. Allahabad Safeda and their application in genetic diversity, population structure and cross species transferability studies. Plos One 15: e0237538. http://doi.org/10.1371/journal.pone.0237538
» http://doi.org/10.1371/journal.pone.0237538 -
Liu K, Muse SV. 2005. PowerMarker: an integrated analysis environment for genetic marker analysis. Bioinformatics 21: 2128-2129. https://doi.org/10.1093/bioinformatics/bti282
» https://doi.org/10.1093/bioinformatics/bti282 -
Mojena R. 1977. Hierarchical grouping methods and stopping rules: an evaluation. The Computer Journal 20: 359-363. https://doi.org/10.1093/comjnl/20.4.359
» https://doi.org/10.1093/comjnl/20.4.359 -
Oliveira JAVS, Santos EA, Viana AP, Walter FHB, Ribeiro RM. 2022. Genetic-molecular characterization in guava full-sib progeny. Bragantia 81: e3322. https://doi.org/10.1590/1678-4499.20210267
» https://doi.org/10.1590/1678-4499.20210267 -
Peakall R, Smouse PE. 2012. GenAlex 6.5: genetic analysis in Excel: population genetic software for teaching and research; an update. Bioinformatics 28: 2537-2539. https://doi.org/10.1093/bioinformatics/bts460
» https://doi.org/10.1093/bioinformatics/bts460 - Pereira FM, Kavati R. 2011. Contribution of the Brazilian scientific research in the development of some fruit trees of subtropical climate. Revista Brasileira de Fruticultura 33: 92-108 (in Portuguese, with abstract in English).
-
Pritchard JK, Stephens M, Donnelly P. 2000. Inference of population structure using multilocus genotype data. Genetics 155: 945-959. https://doi.org/10.1093/genetics/155.2.945
» https://doi.org/10.1093/genetics/155.2.945 -
Silva FA, Viana AP, Correa CCG, Santos EA, Oliveira JAVS, Andrade JDG, et al. 2021. Bayesian ridge regression shows the best fit for SSR markers in Psidium guajava among Bayesian models. Scientific Reports 11: 13639. https://doi.org/10.1038/s41598-021-93120-z
» https://doi.org/10.1038/s41598-021-93120-z - Zanella CM. 2017. Marcadores genéticos baseado em DNA. p. 12-18. In: Turchetto-Zolete AC, Turchetto C, Zanella CM, Passaia G. eds. Marcadores moleculares na era genômica: metodologias e aplicações. Sociedade Brasileira de Genética, Ribeirão Preto, SP, Brazil (in Portuguese).
-
Data availability statement
The data generated and analyzed during this study will be available upon reasonable request to the corresponding author.
-
Declaration of use of AI Technologies
I declare that our team does not employ artificial intelligence (AI) technologies in the creation, development, or execution of our projects and articles. Our work is driven entirely by human experience and traditional methods, without the integration of AI tools or systems.
Edited by
-
Edited by:
Leonardo Oliveira Medici
The data generated and analyzed during this study will be available upon reasonable request to the corresponding author.