 Nonlinear models in the comparison of nitrogen fertilizers applied to coffee
ABSTRACT
Nitrogen (N) is essential to the fertilization of coffee. The fertilizer most used to meet this demand is urea, although it has high rates of N loss due mainly to ammonia volatilization. To reduce this loss, fertilizers with increased efficiency have emerged. Thus, the aim was to select the most appropriate nonlinear regression model to describe N loss attributable to ammonia volatilization in slow- and controlled-release fertilizers applied to coffee plants and to compare the different fertilizers based on the parameters of the selected model. The data studied are controlled-release fertilizers: urea + sulfur + polymer (U+S+P), urea + plastic resin (U+PR), urea + polymer insoluble in water (U+PIW) and slow-release fertilizer: urea formaldehyde (UF) applied to coffee. The Gompertz, Brody, and von Bertalanffy Logistics models were fit by the least squares method. The goodness of fit was assessed using the adjusted coefficient of determination, mean absolute deviation, and Akaike's information criterion. The von Bertalanffy model was the most appropriate for describing the data in most cases. After selecting the best model for the means, the parameters of the von Bertalanffy model were estimated again for each repetition of treatments. With the repetitions of the parameter estimates of these models, the F test of analysis of variance (ANOVA) and Tukey's test were applied. In the F test, p < 0.05 for all parameters. In the Tukey's test, the UF fertilizer reached the asymptote more quickly and presented a lower accumulated loss of N in the coffee tree. The fertilizers U+S+P and U+PIW have later inflection points (IP).
Keywords:
analysis of variance; nitrogen loss; regression; urea
Introduction
Coffee (Coffea arabica L.) is an important agricultural commodity for export in several countries. Brazil is the largest producer and exporter of beans on the planet, responsible for approximately 30 % of world production. Due to the economic importance of the beverage, increasing its productivity, quality and sustainability is a top priority (Voltolini et al., 2020).
Nitrogen (N) fertilization is essential to a crop achieving adequate yield. Nitrogen is the macronutrient most required by coffee plants, being essential to plant growth, flowering, fruiting and overall health. The fertilizer most used to meet this demand is urea, although it has high rates of water loss, mainly through ammonia volatilization (Santos et al., 2023).
Innovations such as slow- and controlled-release fertilizers have emerged to reduce losses. Slow-release fertilizers are products derived from the condensation of urea with aldehydes, and controlled-release fertilizers are those coated with organic or inorganic materials capable of controlling the release of nutrients through a physical barrier or by diffusion. These fertilizers are applied only once saving time and labor (Freitas et al., 2022).
In addition, slow-release fertilizers have reduced N loss in fertilizers. They are more sustainable, thereby contributing to the reduction in environmental impacts compared to conventional fertilization and reducing the emission of gases that cause greenhouse effects such as carbon dioxide and nitrous oxide (Lawrencia et al., 2021).
The pattern of accumulated loss of N by volatilization has a sigmoidal appearance (Trenkel, 2010), and nonlinear regression models well described this shape. These models are widely used in the description of biological growth (Fernandes et al., 2022; Mendonça et al., 2017; Souza et al., 2022; Teixeira et al., 2021) and in comparisons between parameters to analyze the influence of treatment groups in designed experiments. Correct comparisons between treatments are one of the main objectives of applied statistics in agricultural experimentation, and treatments can influence the pattern of asymptotic curves (Carvalho et al., 2018).
Thus, the objective was to first select the most appropriate nonlinear regression model to describe N loss due to ammonia volatilization (NH3) in slow- and controlled-release fertilizers applied to coffee and second, to compare the different fertilizers based on the parameters of the selected model.
Materials and Methods
The data analyzed were sourced from Freitas et al. (2022). The study was carried out in Lavras, Minas Gerais state, at coordinates (21°14’06" S, 45°00’00" W, altitude 910 m), during the 2015/2016 growing season.
Experimental design
The experiment was implemented in Aug 2015 in the Catuaí Vermelho cultivar field, line 144, aged six years, spaced 3.7 m between rows and 0.7 m between plants, totaling 3,861 plants ha–1.
A randomized block design with four treatments and three replicates was used. Each experimental unit was 10 m long and had 14 plants, with the ten central plants used for the evaluations. The plots were delineated along the planting row using the double border system between the useful rows of the experiment.
Characterization of fertilizers
The treatments were controlled-release fertilizers urea + sulfur + polymer (U+S+P), urea + plastic resin (U+PR), urea formaldehyde (UF), and urea + polymer insoluble in water (U+PIW); for more details, see Freitas et al. (2022). All fertilizers were applied at a rate of 300 kg of N ha–1 once in Nov only.
The loss of N by ammonia volatilization due to soil application of the different treatments was evaluated. A total of 37 samples were collected on the 1st, 2nd, 3rd, 4th, 5th, 7th, 9th, 12th, 15th, 19th, 24th, 32nd, 38th, 43rd, 47th, 53rd, 59th, 66th, 73rd, 80th, 88th, 97th, 104th, 111th, 117th, 123rd, 130th, 138th, 145th, 152nd, 166th, 173rd, 180th, 187th, 195th, 202nd and 208th days after fertilizer application.
Methodology
The nonlinear models Logistic Eq. (1), Gompertz Eq. (2), Brody Eq. (3) and von Bertalanffy Eq. (4) models were fitted to data on average accumulated N loss by volatilization from each of the four treatments:
where i = 1, 2, …, 37; Yi the i-th observation of the accumulated N loss (kg ha–1) at time i; A is the horizontal asymptote of the functions; B the abscissa of the inflection point (IP), except the Brody model, whose curve shape does not have an IP. K is an index associated with growth speed according to Silva et al. (2021); xi represents the days after fertilizer application i = 1, 2, …, 37, and εi the random error associated with the i-th observation, which is assumed to be independent, homoscedastic and identically distributed, where εi ∼ N (0, σ2).
After the initial adjustments, using the ordinary least squares method, residual vector analysis was carried out to verify the assumptions of normality using the Shapiro-Wilk (SW) test, constant variance using the Breusch-Pagan (BP) test and independence using the Durbin-Watson (DW) test.
In case of violation of the assumption of independence, autoregressive parameters of order m (AR(m)) were included, the AR order "m" was defined based on the significant lags presented in the graphs of the partial autocorrelation function. Thus, εi is given by:
where λi is white noise. In this case, the parameters were re-estimated using the generalized least squares method and to verify the significance of the parameters, the t test was applied.
The following criteria were used to compare the goodness of fit that best describes the data: Akaike information criterion (AIC), adjusted coefficient of determination (), and mean absolute deviation (MAD).
After selecting the most appropriate model, individual adjustment were made for each replicate, making a total of 12 adjustments. Analysis of variance (ANOVA) was carried out using the parameter estimates according to the method proposed by Carvalho et al. (2010) to verify the possible existence of a difference between the estimates of the parameters of the curves of each fertilizer described by nonlinear models.
The analyses of this study were carried out using the R statistical software program (2022, version 4.1.3) with the aid of the "nlme", "car", "lmtest" and "qpcR" packages. For comparison purposes, the nominal significance level adopted was 1 %.
Results
Selection of the nonlinear model
Considering the significance level of 1 %, the analyses indicated that the homoscedasticity assumption was not satisfied in certain fertilizers studied, for example, for all the adjustments made with the fertilizer (U+S+P), see Table 1.
Residual analysis for the fitted models showing the p-values of the tests: Shapiro-Wilk (SW), Durbin-Watson (DW) and Breusch-Pagan (BP) for the description of the accumulated average loss of nitrogen of fertilizers.
Additionally, there was a violation of the normality assumption. For example, in the four models for the UF treatment, the SW test had p < 0.01. Furthermore, all models presented dependent residuals because the DW test showed p < 0.01 in all cases (Table 1).
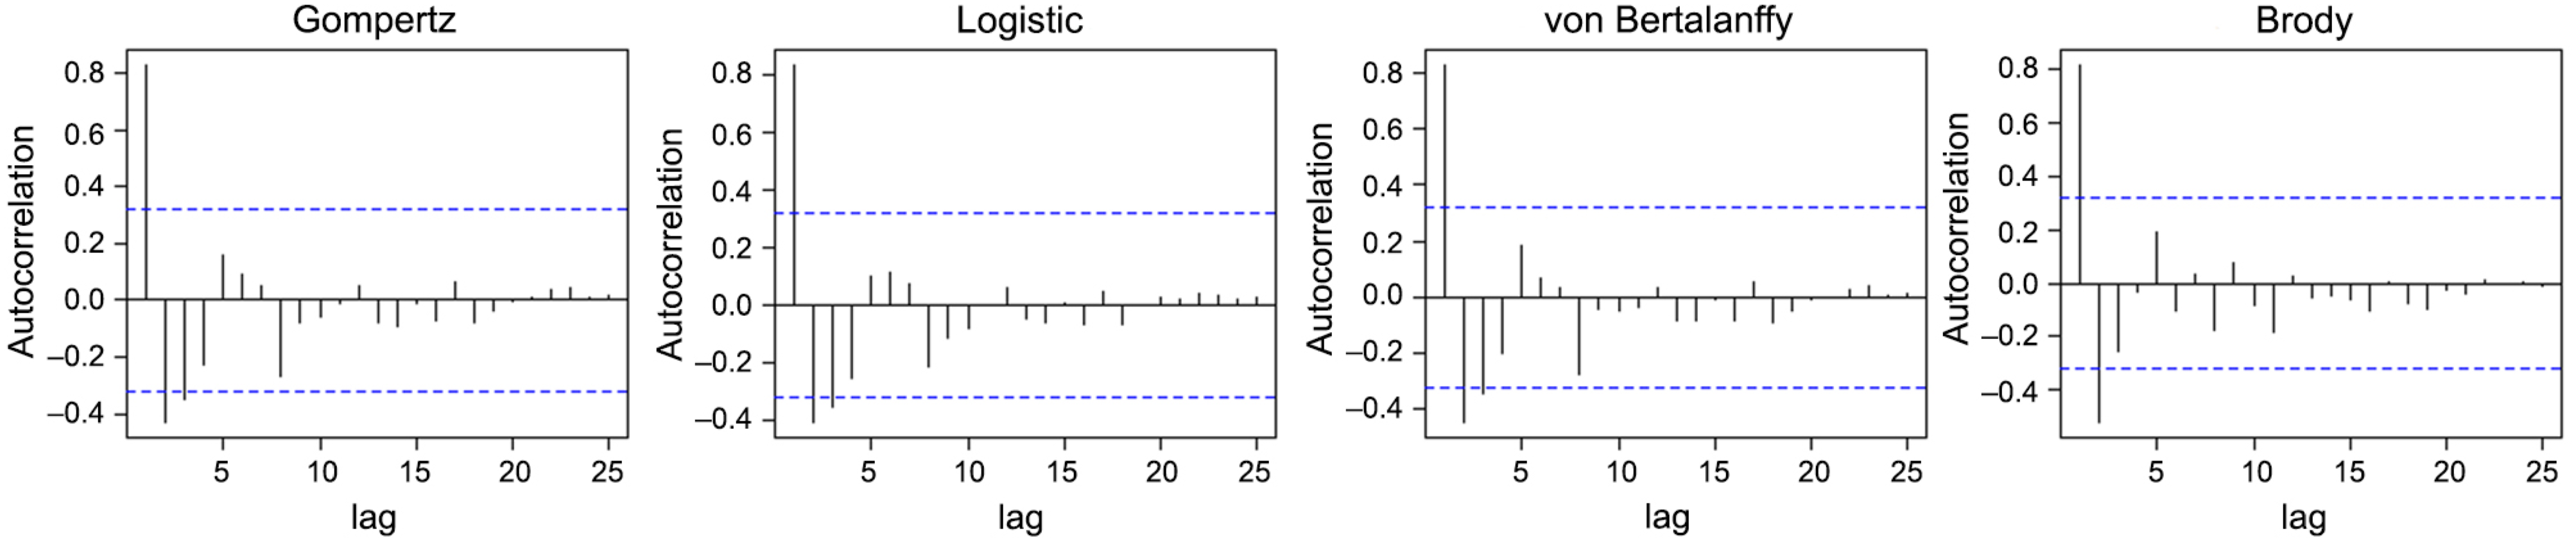
To correct residual autocorrelation, autoregressive terms of first, second and third order were incorporated into the models. These orders were defined according to the significant lags presented in the graphical analysis of the partial autocorrelation function (Figures 1-3). The models were re-estimated using generalized least squares, and all assumptions about residuals have been satisfied.


Partial autocorrelation graph of residues from the urea + urea + polymer insoluble in water treatment.
In general, the von Bertalanffy model best described the data sets, as in most cases, this model had lower values for AIC and MAD and higher values for . For example, in the U+PIW treatment, the AIC ranged from 78.5060 (von Bertalanffy model) to 100.8851 (Logistic model), see Table 2. The estimates of the parameters and the respective standard errors of the von Bertalanffy model are in Table 3.
Evaluators of the goodness of fit for selecting the best model to describe the accumulated average loss of nitrogen of fertilizers.
Estimates of the von Bertalanffy model parameters with autoregressive parameters of order m (AR(m)), when necessary, and standard error in parentheses of the accumulated average loss of nitrogen in fertilizers.
Comparison between parameter estimates
The von Bertalanffy model was adjusted to each of the 12 data sets resulting from the experiment, as shown in Figure 4. Analysis of variance (ANOVA) with the parameter estimates was used to analyze whether there were truly significant differences between them. The assumption of normality was confirmed in all individual adjustments using the SW test (p > 0.01 in all cases). Tukey's test was applied to compare the effects of the treatments in the experiment, and the results are shown in Figure 5. The minimum significant difference (MSD) of parameter A was 14.76845, of parameter B was 7.74579, and of parameter K was 0.1895516.

Graphic representation of the accumulated nitrogen loss for all replicates of all fertilizers. U+S+P = urea + sulfur + polymer; U+PR = urea + plastic resin; UF = urea formaldehyde; U+PIW = urea + polymer insoluble in water.

Graphic representation of the Tukey's test for the parameters of the von Bertalanffy model. Parameter A = horizontal asymptote; Parameter B = abscissa of the inflection point; Parameter K = index associated with growth speed. UF = urea formaldehyde; U+S+P = urea + sulfur + polymer; U+PIW = urea + polymer insoluble in water; U+PR = urea + plastic resin.
According to the Tukey's test, the maximum asymptotic accumulated loss (A) was higher under the U+PR and U+PIW treatments, with no significant difference between the two fertilizers, and lower under the UF treatment (Figure 5).
As regards the abscissa of the inflection point (B), the fertilizers U+S+P and U+PIW (Figure 5) were seen to be equal to each other and presented higher estimates of B; that is to say, they were the two treatments that took the longest to reach the IP.
The N loss grew at an accelerated rate up to the IP, and from the IP onwards, it continued to increase but at a slower pace, tending to stabilization. In parameter B, the loss of U+S+P fertilizer grew at an accelerated rate for approximately 11 days until reaching the IP. Then it began to grow more slowly until stabilization while in the fertilizer U+PIW stabilization is reached in approximately five days (Figure 5).
Additionally, it was found that the UF treatment had a higher estimate for the K parameter and that, therefore, the accumulated loss of N by ammonia volatilization reached the asymptote more quickly in this fertilizer (Figure 5).
Discussion
Basic assumptions about residuals are essential to making reliable inferences about the parameters. However, the assumption of homoscedasticity is commonly violated in studies that describe the curve's behavior over time, as occurred in this study and in the studies by Mangueira et al. (2022) and Ribeiro et al. (2018).
The autoregressive parameters ϕm, with m = 1, 2, and 3, indicated that there was a dependence between the observations over time, which was natural as the response variable was the accumulated loss of N over time, i.e., the measurement of one day depended on the previous day.
There are ways in the literature to circumvent the absence of a residual normality problem, though this was not the focus of this study; thus, the adjustments that violated this assumption were not used in the selection of the best model according to the methodology addressed by Silva et al. (2020).
For a better application of the treatment comparison method, it is necessary to use parameter estimates from a single model for all replicates of the treatments. This approach prevents the treatment effect from being confused with the effect of the model's intrinsic characteristics (e.g., the latest or earliest IP).
Several studies have used the von Bertalanffy model, which best fits the data in most treatments, to describe development. For example, research has used the model to describe the growth curve of meat-producing mammals, cattle and aquatic invertebrate species, according to Fernandes et al. (2019), Alves et al. (2020) and Lee et al. (2020), respectively.
Parameter estimate A representing the maximum accumulated asymptotic loss, UF, presented the lowest accumulated loss of N in coffee due to ammonia volatilization. It is among the most widely used slow-release fertilizers worldwide, with excellent physical properties and controlled release rates, improving soil permeability and increasing the penetration capacity of crop roots (Guo et al., 2018).
The reduction in the asymptotic loss of N by volatilization may contribute to increasing the agronomic efficiency of N fertilizers because losing fewer nutrients will lead to greater availability of resources to be absorbed by the plant. This indicates that these fertilizers take longer to reach the maximum daily loss (which occurs in the IP). This information is of practical interest for the most appropriate crop management and may help producers identify the best time to apply these fertilizers.
Parameter B represents the abscissa of the IP, from which the growth rates changed from increasing to decreasing. This parameter must be analyzed considering the effect of the others under the curve over time. In this context, we found that U+PR achieved the highest asymptotic accumulated loss and UF the lowest. However, the two fertilizers presented equal B estimates, which shows that parameters A and B are not necessarily correlated. No works with similar applications were found in the literature. This article is one of the pioneers in this type of analysis.
As regards the estimates of the growth rate (K), the lower the value of this parameter was, the slower the upper asymptote was reached. Parameters K and A had an inversely proportional relationship; therefore, the UF fertilizer had the highest growth rate and consequently the lowest accumulated loss of N.
According to the methodology proposed by Carvalho et al. (2010), ANOVA with parameter estimates was used to analyze whether significant differences existed between them. This method is efficient, as it considers the entire behavior of the characteristic under study over time; furthermore, the method can be applied to compare any parameter of nonlinear regression models. In this context, the application of the Tukey's test (Figure 5) indicated that the maximum accumulated asymptotic loss (A) is greater in the treatments U+PR and U+PIW, with no significant difference between the two fertilizers. The loss is lower in the treatment with UF. Similar results have been found in studies by Freitas et al. (2022).
Most studies do not consider all the information present in the data. In general, the parameters are compared via the parameters’ confidence interval or even by performing ANOVA only on the last observation, as in the studies by Senra et al. (2022), Jane et al. (2020) and Minato et al. (2020).
The nonlinear von Bertalanffy model provided good estimates for the parameters, as they are chosen as the most appropriate model for describing the accumulated loss of N due to ammonia volatilization over the days after application to coffee. The parameter equality method made it possible to identify treatments with less N loss, indicating significant differences between fertilizers. UF reached asymptote more quickly and had the lowest accumulated loss of N in coffee due to ammonia volatilization compared to the others studied. Furthermore, the fertilizers U+S+P and U+PIW have a later IP compared to the others, which can help in planning the application of these fertilizers.
Acknowledgments
We thank the Fundação de Amparo à Pesquisa do Estado de Minas Gerais (FAPEMIG) for financial support.
Data availability statement
Data will be available upon request via email.
References
-
Alves RFS, Pereira KD, Carneiro APS, Emiliano PC, Carneiro PLS, Malhado CHM, et al. 2020. Nonlinear mixed effects models for comparing growth curves for Guzerá cattle. Revista Brasileira de Saúde e Produção Animal 21: e210132020. https://doi.org/10.1590/S1519-9940210132020
» https://doi.org/10.1590/S1519-9940210132020 -
Carvalho LR, Pinho SZ, Mischan MM. 2010. Methods to verify parameter equality in nonlinear regression models. Scientia Agricola. 67: 218-222. https://doi.org/10.1590/S0103-90162010000200014
» https://doi.org/10.1590/S0103-90162010000200014 -
Carvalho LR, Mischan MM, Passos JRS, Pinho SZ. 2018. The use of contrasts in multivariate nonlinear mixed models to compare treatments in longitudinal factorial experiments. Brazilian Journal of Biometrics 36: 880-890. https://doi.org/10.28951/rbb.v36i4.314
» https://doi.org/10.28951/rbb.v36i4.314 -
Fernandes FA, Fernandes TJ, Pereira AA, Meirelles SLC, Costa AC. 2019. Growth curves of meat-producing mammals by von Bertalanffy's model. Pesquisa Agropecuária Brasileira 54: e01162. https://doi.org/10.1590/S1678-3921.pab2019.v54.01162
» https://doi.org/10.1590/S1678-3921.pab2019.v54.01162 -
Fernandes TJ, Pereira AA, Bueno Filho JSS, Muniz JA. 2022. Bayesian estimation of nonlinear models parameters in the description of growth coffee fruits. Brazilian Journal of Biometrics 40: 393-406. https://doi.org/10.28951/bjb.v40i4.623
» https://doi.org/10.28951/bjb.v40i4.623 -
Freitas T, Bartelega L, Santos C, Dutra MP, Sarkis LF, Guimarães RJ, et al. 2022. Technologies for fertilizers and management strategies of N-fertilization in coffee cropping systems to reduce ammonia losses by volatilization. Plants 11: 3323. https://doi.org/10.3390/plants11233323
» https://doi.org/10.3390/plants11233323 -
Guo Y, Zhang M, Liu Z, Tian X, Zhang S, Zhao C, et al. 2018. Modeling and optimizing the synthesis of urea-formaldehyde fertilizers and analyses of factors affecting these processes. Scientific Reports 8: 4504. https://doi.org/10.1038/s41598-018-22698-8
» https://doi.org/10.1038/s41598-018-22698-8 -
Jane SA, Fernandes FA, Muniz JA, Fernandes TJ. 2020. Nonlinear models to describe height and diameter of sugarcane RB92579 variety. Revista Ciência Agronômica 51: e20196660. https://doi.org/10.5935/1806-6690.20200062
» https://doi.org/10.5935/1806-6690.20200062 -
Lawrencia D, Wong SK, Low DYS, Goh BH, Goh JK, Ruktanonchai UR, et al. 2021. Controlled release fertilizers: a review on coating materials and mechanism of release. Plants 10: 238. https://doi.org/10.3390/plants10020238
» https://doi.org/10.3390/plants10020238 -
Lee L, Atkinson D, Hirst AG, Cornell SJ. 2020. A new framework for growth curve fitting based on the von Bertalanffy growth function. Scientific Reports 10: 7953. https://doi.org/10.1038/s41598-020-64839-y
» https://doi.org/10.1038/s41598-020-64839-y -
Mangueira RAF, Savian TV, Leandro RA. 2022. Definition of nutritional requirements for zinc in broilers using Bayesian methodology. Brazilian Journal of Biometrics 40: 50-60. https://doi.org/10.28951/bjb.v40i1.540
» https://doi.org/10.28951/bjb.v40i1.540 -
Mendonça AR, Calegario N, Silva GF, Chaves e Carvalho SPC. 2017. Growth and yield models for eucalyptus stands obtained by differential equations. Scientia Agricola 74: 364-370. https://doi.org/10.1590/1678-992X-2016-0035
» https://doi.org/10.1590/1678-992X-2016-0035 -
Minato EA, Cassim BMAR, Besen MR, Mazzi FL, Inoue TT, Batista MA. 2020. Controlled-release nitrogen fertilizers: characterization, ammonia volatilization, and effects on second-season corn. Revista Brasileira de Ciência do Solo 44: e0190108. https://doi.org/10.36783/18069657rbcs20190108
» https://doi.org/10.36783/18069657rbcs20190108 -
Ribeiro RA, Souza FAC, Muniz JA, Fernandes TJ, Moura RS. 2018. Growth curve for height at withers of Mangalarga Marchador horses with heterocedasticity. Arquivo Brasileiro de Medicina Veterinária e Zootecnia 70: 272-278 (in Portuguese, with abstract in English). https://doi.org/10.1590/1678-4162-9322
» https://doi.org/10.1590/1678-4162-9322 -
Santos C, Pinto SIC, Guelfi D, Rosa SD, Fonseca AB, Fernandes TJ, et al. 2023. Corn cropping system and nitrogen fertilizers technologies affect ammonia volatilization in Brazilian tropical soils. Soil Systems 7: 54. https://doi.org/10.3390/soilsystems7020054
» https://doi.org/10.3390/soilsystems7020054 -
Senra JFB, Silva JA, Ferreira A, Esposti MDD, Silva UR, Milheiros IS, et al. 2022. Selection of non-linear models and the study of conilon coffee fruit growth. Research, Society and Development 11: e21511427093 (in Portuguese, with abstract in English). https://doi.org/10.33448/rsd-v11i4.27093
» https://doi.org/10.33448/rsd-v11i4.27093 -
Silva ÉM, Tadeu MH, Silva VF, Pio R, Fernandes TJ, Muniz JA. 2020. Description of blackberry fruit growth by nonlinear regression models. Revista Brasileira de Fruticultura 42: e-177. https://doi.org/10.1590/0100-29452020177
» https://doi.org/10.1590/0100-29452020177 -
Silva ÉM, Fruhauf AC, Silva EM, Muniz JA, Fernandes TJ, Silva VF. 2021. Evaluation of the critical points of the most adequate nonlinear model in adjusting growth data of ‘green dwarf’ coconut fruits. Revista Brasileira de Fruticultura 43: e726. https://doi.org/10.1590/0100-29452021726
» https://doi.org/10.1590/0100-29452021726 -
Souza FAC, Fernandes TJ, Ribeiro RA, Cunha FO, Meirelles SLC, Moura RS, et al. 2022. Growth predictability models in Mangalarga Marchador horses. Ciência Rural 52: e20210161. https://doi.org/10.1590/0103-8478cr20210161
» https://doi.org/10.1590/0103-8478cr20210161 -
Teixeira GL, Fernandes TJ, Muniz JA, Souza FAC, Moura RS, Melo RMPS. 2021. Growth curves of campolina horses using nonlinear models. Livestock Science 251: 104631. https://doi.org/10.1016/j.livsci.2021.104631
» https://doi.org/10.1016/j.livsci.2021.104631 - Trenkel ME. 2010. Slow- and Controlled-Release and Stabilized Fertilizers: An Option for Enhancing Nutrient Use Efficiency in Agriculture. International Fertilizer Industry Association, Paris, France.
-
Voltolini GB, Silva LC, Alecrim AO, Castanheira DT, Resende LS, Rezende TT, et al. 2020. Soil chemical attributes in coffee growing with different agronomic techniques. Coffee Science 15: e151689. https://doi.org/10.25186/.v15i.1689
» https://doi.org/10.25186/.v15i.1689
Edited by
-
Edited by:
Luiz Alexandre Peternelli