 Bayesian regional heritability mapping for genomic-wide associations across multiple chromosomal regions
ABSTRACT
Regional heritability mapping (RHM) employs mixed-model and single-genomic region approaches for Genome-Wide Association Studies (GWAS). Although it utilizes marker groups and possesses a high detection power for identifying markers associated with target phenotypes, the significant linkage disequilibrium (LD) among markers limits the RHM's capacity to estimate the effects of one genomic region simultaneously. This constraint may hinder its capacity to detect complex associations or relationships among various genomic regions. Within a Bayesian framework, RHM can operate with multiple structured covariance matrices and can incorporate several genomic regions into a single model, effectively utilizing the LD present in these regions. In this study, our objectives were: (i) to propose the simultaneous estimation of multiple genomic region effects using a Bayesian model; (ii) to compare the efficiency of this simultaneous estimation with that of the single-region estimation using simulated data, focusing on the detection of significant genomic regions for phenotypes characterized by diverse genetic architectures; and (iii) to demonstrate the applicability of these models in breeding programs, particularly applying them to rice data. The results indicated that the simultaneous estimation of genomic region effects using the Bayesian approach offered greater detection power for more complex traits in simulated data. In the rice dataset, the simultaneous estimation method identified more regions than those previously reported in the literature, as well as newly uncovered genomic regions that deserve further investigation in post-GWAS analyses. This methodology holds promise for exploring and applying new genomic regions associated with target traits.
Keywords:
Oryza sativa; molecular markers; detection power; false positives; simulation
Introduction
Genome-Wide Association Studies (GWAS) have emerged as one of the most promising applications of molecular markers over the past two decades (Uffelmann et al., 2021). The primary objective of GWAS is to identify causal genetic variants within the genome that influence specific traits, thereby enhancing our understanding of their genetic architecture. These identified markers can subsequently be utilized in molecular breeding strategies, including marker-assisted selection, gene mining, and editing. The most straightforward GWAS methodology employs regression techniques on single markers to evaluate the association between phenotypes and markers (Ziegler et al., 2008; Resende et al., 2014). However, this approach encounters statistical challenges, including the need for large samples, an elevated false-positive ratio, and limited detection power (Fernando et al., 2004).
To address these limitations, research focusing on groups of markers, referred to as genomic regions, has gained notable prominence in GWAS (Fernando et al., 2017; Lima et al., 2022). These approaches tend to capture a larger proportion of genetic variance and uncover more intricate relationships between markers (Moore et al., 2010). One notable method is the Regional Heritability Mapping (RHM), which employs mixed models (Nagamine et al., 2012). Although RHM has been utilized across various species (Resende et al., 2018; Al Kalaldeh et al., 2019; Suela et al., 2022), it assesses the effects of a single genome region at a time, which may hinder its capacity to detect complex associations and elevate the risk of false positives by overlooking the linkage disequilibrium (LD) between regions (Klein et al., 2005).
In this context, one proposal is to simultaneously estimate the effects of multiple neighboring regions within the GWAS model. However, there is a need for more comprehensive literature on studies employing an approach similar to RHM for the joint estimation of these regions. Conducting a simultaneous analysis could enhance the detection power of associated regions; however, the Restricted Maximum Likelihood/Best Linear Unbiased Prediction (REML/BLUP) approach, when utilizing several structured covariance matrices, may encounter convergence issues if over-parameterized (Bates et al., 2015). Conversely, Bayesian methods demonstrate robustness against such over-parameterization issues (Gamerman and Lopes, 2006).
To address the proposed simultaneous analysis of multiple neighboring genomic regions using a Bayesian model, we structured this study into two sections. The first section focuses on simulating three traits and genetic architectures to assess the detection of genomic regions. In the second section, we utilize rice data as a biological model to illustrate the applicability of our proposed model and compare its detection efficiency with that of single-genomic-region models.
Materials and Methods
Simulated data
Genotypic and phenotypic datasets from an F2 population were simulated using the AlphaSimR package (version 1.0.4) (Gaynor et al., 2021). The simulation considered traits with high (h2 = 0.50), moderate (h2 = 0.30), and low (h2 = 0.10) heritabilities, corresponding to three distinct genetic architectures corresponding to 3, 10, and 100 quantitative trait loci (QTLs), respectively. The QTLs were randomly distributed, as illustrated in Table 1, with no QTLs placed on the last two chromosomes.
Description of scenarios with the proportion of variation in quantitative trait loci (QTL) explained by single nucleotide polymorphisms (), genetic architecture, number of QTLs, and additive heritability ().
Individuals were created with diploid genomes consisting of a genome length of 12 Morgans and 12 simulated chromosomes of equal size. A total of 3,000 simulated markers were randomly distributed across the chromosomes, with each chromosome containing 250 single nucleotide polymorphisms (SNPs). This resulted in three distinct scenarios, each repeated ten times, involving a sample of 1,000 individuals. For each scenario, the proportion of QTL variation explained by the SNPs () was determined and calculated using the expression outlined by Goddard et al. (2011):
where n is the number of SNPs and nQtl is the number of QTLs. The scenarios used for data simulation, along with the proportion of genetic variation explained by the SNPs, are presented in Table 1.
Rice data
The genotypic and phenotypic dataset utilized in this study was derived from rice [Oryza sativa (L.)], as outlined by Ammiraju et al. (2006) and Zhao et al. (2011). The data is available at http://www.ricediversity.org/data/sets/44kgwas/. A total of 11 phenotypic traits were measured from 413 rice accessions (34°29’49.9" N, 91°33’39.3" W, altitude 64 m), which were genotyped for 44,100 SNP markers. Quality control was performed on the genotypic markers, applying a call rate threshold of 70 % and a low frequency for the rarest allele (Minor Allele Frequency - MAF) of less than 1 %, as detailed by Zhao et al. (2011). Markers that did not meet these criteria were removed, leaving 36,901 markers for analysis.
The phenotypic traits assessed in the study included: i) flag leaf length (FLL); ii) flag leaf width (FLW); iii) panicle number per plant (PNPP); iv) primary panicle branch number (PPBN); v) plant height (PH); vi) panicle length (PL); vii) florets per panicle (FPP); viii) blast resistance (BR); ix) panicle fertility (PF); x) protein content (PC); xi) seed number per panicle (SNPP). The phenotypes were adjusted for population structure using four principal components, as outlined by Zhao et al. (2011).
Genomic regions
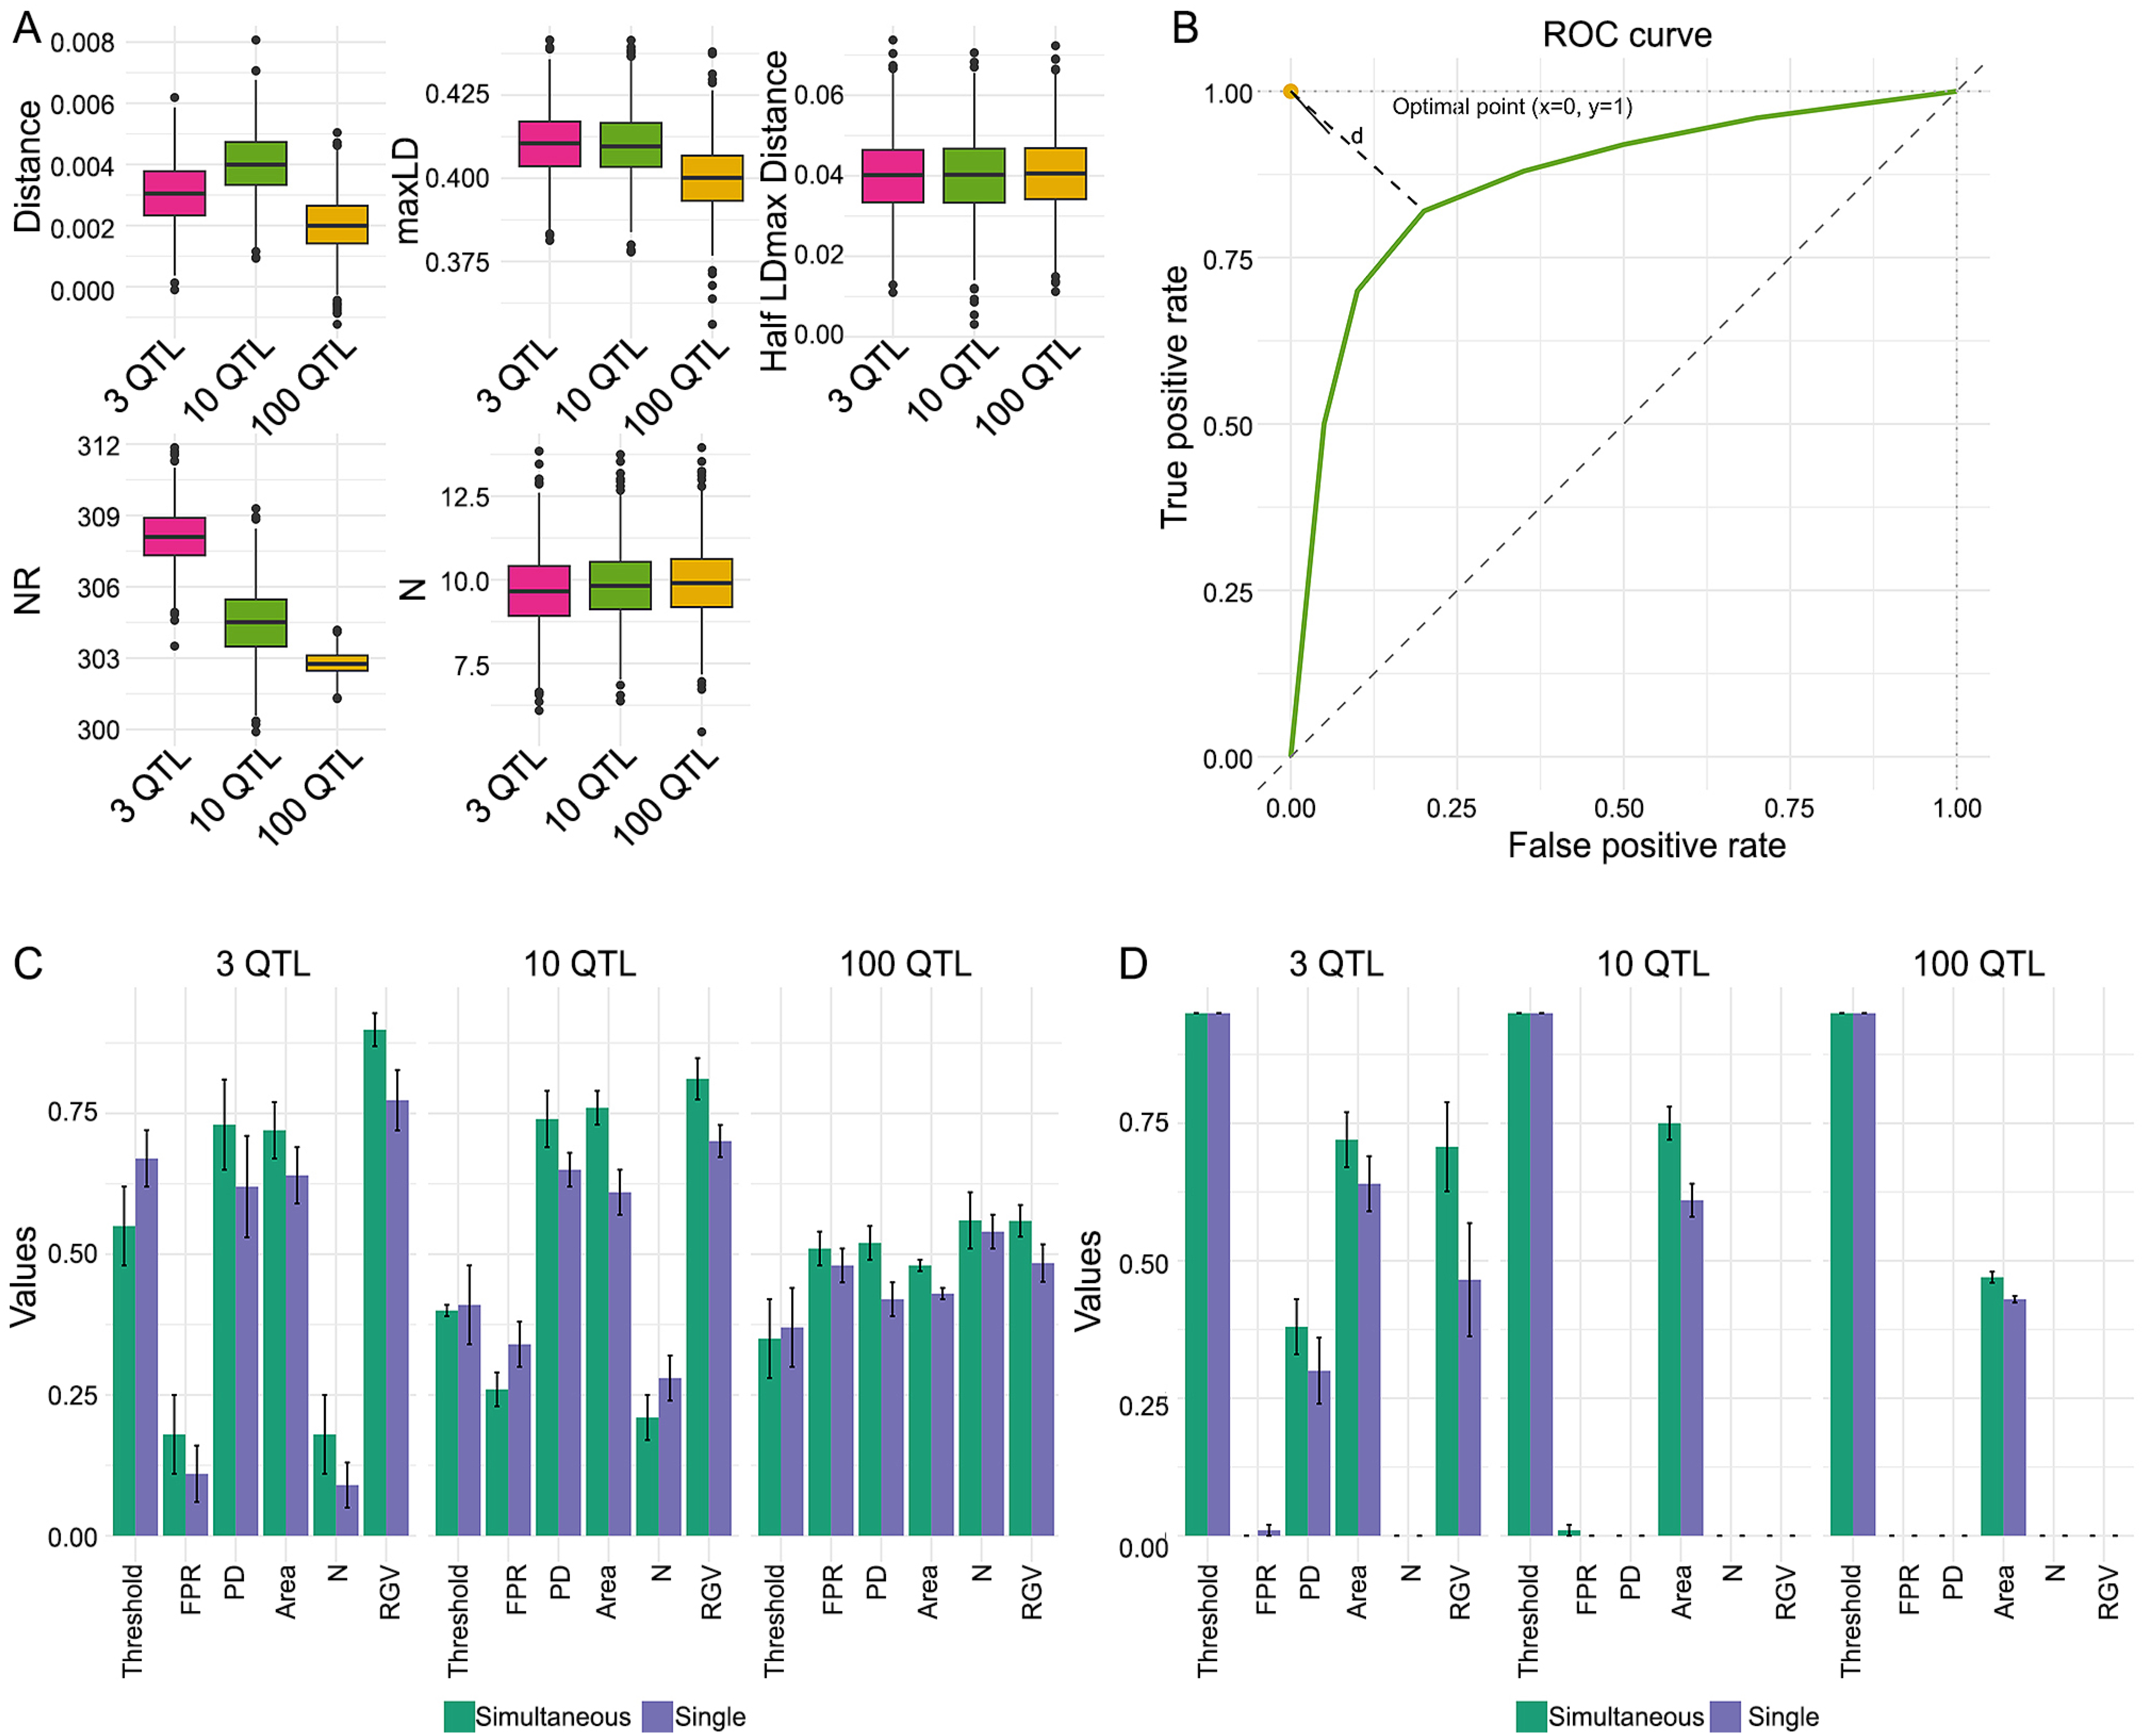
This study established genomic regions of specified sizes based on the average LD between markers. By analyzing the decay of the LD curve, the region sizes were defined as the distance at which LD reaches half of its maximum value. This approach is consistent with other methods employed by Kim et al. (2007), Vos et al. (2017), and Suela et al. (2022). The number of regions and markers within each region, derived from the analysis of half-maximum LD decay across all simulated scenarios, is presented in Figure 1A. For the rice data, the region size corresponding to half the maximum LD value was determined to be 0.21 Mb, a finding also reported by Suela et al. (2022).
(A) Statistics related to genotypic data for the scenarios: mean and standard error of the distance between markers, given in Morgans (Distance), maximum linkage disequilibrium per chromosome (maxLD), distance associated with half of the maximum LD (Half LDmax Distance), number of regions (NR), and number of markers (N) per region. (B) Graphical representation of the Receiver Operating Characteristic (ROC), where the optimal threshold is the point that minimizes the Euclidean distance (d) between the curve and the ideal point (x = 0, y = 1), where the false positive rate is equal to 0 % and the detection power is 100 %; (C and D) Means and standard errors for false positive rate (FPR), detection power (PD), area under the ROC (Area), percentage of associated regions on chromosomes 11 and 12 (N (%)), and percentage of recovered genetic variance (RGV) for the scenarios evaluated with simultaneous and single estimations, for both (C) the optimal threshold and (D) the 0.95 threshold. QTL = quantitative trait loci.
Bayesian approach model
This study proposes a model to simultaneously estimate the effects of multiple neighboring genomic regions:
where y is the vector of phenotypic values (N × 1, where N is the number of individuals); 1 is a vector with the same dimension as y and values equal to 1; µ represents the overall mean; rk is the vector of random additive genetic effects for individuals relative to the k-th region, representing the portion of the total additive genetic value explained by the k-th region (k = 1,2, …, Kj and j = 1,2,…,12 where Kj is the total number of regions on the j-th chromosome); Zk is the design matrix that relates the individual to their phenotypic values. In this study, since each individual has a unique ‘y’ value, Zk is an identity matrix and is the same for all regions; e is the vector of random errors, with , where is the residual variance and I denotes the identity matrix.
The data distribution and prior distributions for the previous model are defined as follows:
…
…
where is the variance associated with the k-th region (k = 1,2, …, Kj), srk, dfrk, se, dfe are hyperparameters, with s being the scale parameter and df the degrees of freedom defined according to Azevedo et al. (2022).
In this study, the model terms associated with the genomic regions differ only in the probability distribution of rk, particularly in the covariance matrix of that distribution. Consequently, the covariance matrix differs, leading to variations in the genomic relationship matrix and the additive genetic variances for each region. This suggests that distinct genomic regions contribute to different portions of the total genetic variation. This concept arises from the idea that two genetically identical individuals carry the same genotype at the causal QTLs, which are presumed to be in LD with the molecular markers.
The following expression gives the additive relationship matrix of the k-th region:
whereWrk is the marker incidence matrix of the k-th region, pki is the allelic frequency associated with the i-th SNP (i = 1, 2, …, nk where nk is the number of SNPs in the k-th region).
Markov Chain Monte Carlo (MCMC) algorithms are employed to derive marginal posterior distributions (Gamerman and Lopes, 2006). This method generates values from a probability distribution via a Markov Chain process. The values of the marginal posterior distributions are indirectly generated through a class of distributions known as full conditional posterior distributions (FCPD). According to the theory of Markov Chains, it can be demonstrated that once equilibrium is reached, generating values from an FCPD is equivalent to generating values from the marginal posterior distribution of the parameter. Given that the assumed distribution for the data and the prior distributions assigned to the parameters are Normal and scaled inverted Chi-squared distributions, which are conjugate, we conclude that the FCPD represents a known probability distribution. As a result, values can be generated directly from the FCPD; thus, the Gibbs Sampler MCMC algorithm (Geman and Geman, 1993) is applicable.
For the analyses, 300,000 iterations were conducted, with a burn-in of 20,000 and a thinning interval of 10. Convergence diagnosis was evaluated using the criterion proposed by Geweke (1992).
Selection by Window Posterior Probability of Association (WPPA)
To determine if the k-th region is associated with the trait of interest, the proportion of genetic variance explained (PGVE) was used and is defined as:
where represents the proportion of genetic variance explained by the i-th region on the j-th chromosome in the t-th iteration, denotes the posterior mean of the genetic variance of the i-th region on the j-th chromosome (i = 1,2, …, Kj) and Kj is the number of regions on the j-th chromosome. In situations where , it indicates the presence of a causative mutation within the i-th region on the j-th chromosome, as it exhibits greater variance than the average variance of all regions.
The WPPA measure was computed as the ratio between the number of iterations where is greater than one and the total number of iterations. When WPPA exceeds the designated threshold, the evaluated region is considered associated with the trait of interest (Peters et al., 2012; Bennewitz et al., 2017). Although the threshold value is typically selected subjectively, previous literature suggests thresholds such as the one proposed by Fernando and Garrick (2013) and Fernando et al. (2017), which is set at 0.95. In this study, we also assessed the optimal threshold that balances the false positive rate and detection power.
For each scenario, a Receiver Operating Characteristic (ROC) curve, as proposed by Metz (1978), was constructed. In this curve, the x-axis represents the false-positive rate, which indicates how often a region is mistakenly identified as associated when it is not in linkage disequilibrium with the QTL. Conversely, the y-axis represents detection power, defined as the ability to correctly identify a QTL in the population when it genuinely exists; that is, asserting that the effect of a region is associated with the phenotype when that region is indeed in linkage disequilibrium with the QTL. The ROC curve was generated using threshold values ranging from 0 to 1, with increments of 0.01.
The optimal threshold for WPPA is defined as the point that minimizes the Euclidean distance between the ROC curve and the ideal point for GWAS (x = 0, y = 1), where the false-positive rate is 0, and the detection power is 1 (Figure 1B). This method for identifying the optimal point of the ROC curve was described by Perkins and Schisterman (2006).
Comparison of methodologies
Simulated data
To compare the efficiency of estimating the effects of genomic regions, both simultaneously and individually, the following measures were calculated:
-
The power of detection is defined as the ratio of the number of regions considered associated with the trait to the total number of regions influencing the trait.
-
The false-positive rate is calculated as the ratio between the number of regions mistakenly considered associated that do not affect the trait, and those that are not.
-
The percentage of captured genetic variance is obtained as the ratio between the sum of the posterior means of the genetic variances of the associated regions and the posterior mean of the total genetic variance.
-
The area under the curve was obtained between false-positive rates and the power of detection (ROC curve).
-
The percentage of regions detected as associated on chromosomes 11 and 12 (without QTLs) was calculated as the ratio of the number of regions considered associated by the model to the total number of regions on these chromosomes.
Thus, the procedure that offers the most incredible power of detection, the lowest false-positive rate, the highest percentage of captured genetic variance, the largest area under the curve, and the smallest number of regions identified as associated with chromosomes without QTLs will be considered more efficient.
Real data
To illustrate the application of the proposed models in breeding programs, we utilized real data from rice (O. sativa). To examine the relationships among various rice traits, we conducted a correlation analysis. For the GWAS analysis, a threshold of 0.95 was selected to ascertain the association of specific regions with the phenotype of interest. This threshold was selected based on its prior use in several studies, including those by Fernando and Garrick (2013) and Fernando et al. (2017). We compared the locations (chromosome and position) of the SNPs in the genome. We identified regions with previously reported QTLs in the literature, referencing the Q-TARO database (https://dbarchive.biosciencedbc.jp/en/qtaro/data-1.html) and the Gramene QTL database (https://archive.gramene.org/qtl/).
Computational resources
All computational routines were performed using R software version 4.1.2. For data simulation, the AlphaSimR package version 1.0.4 (Gaynor et al., 2021) was employed, with code based on Batista et al. (2021). The calculation of LD was conducted using the LD.decay function from the Sommer package (Covarrubias-Pazaran, 2016) along with the computational routine implemented in GenomicLand (Azevedo et al., 2019). For Bayesian analyses and convergence assessment, the BGLR package version 1.0.9 (Pérez and de los Campos, 2014) and the Coda package version 0.19-4 (Plummer et al., 2006) were utilized, respectively.
Results
Simulated data
The results regarding the false-positive rate, detection power, area under the ROC curve, and the percentages of regions associated with chromosomes 11 and 12, as well as the percentage of genetic variance captured by the Bayesian model, are presented. This analysis includes both the estimation of single-region effects and the simultaneous estimation of multiple-region effects, utilizing both the optimal threshold (Figure 1C) and the threshold of 0.95 (Figure 1D).
In the scenario where traits are governed by only 3 QTLs of significant effects (Figure 1C), the optimal thresholds for WPPA were determined to be 0.55 (± 0.07) for simultaneous estimation and 0.67 (± 0.05) for single estimation. Both approaches, simultaneous and single, exhibited comparable false-positive rates, power of detection, ROC area, and percentages of associated regions on chromosomes 11 and 12. However, the simultaneous approach achieved a higher percentage of recovered genetic variance, successfully capturing a substantial portion of it.
In the scenario involving traits controlled by 10 QTLs (Figure 1C), both approaches yielded remarkably similar optimal thresholds, with values of 0.40 (± 0.01) for simultaneous estimation and 0.41 (± 0.07) for single estimation. Simultaneous estimation demonstrated enhanced performance in terms of power of detection and area under the ROC curve, although it had a slightly inferior false-positive rate. However, the percentage of associated regions on chromosomes 11 and 12 was comparable to that observed with a single estimation.
In the scenario characterized by numerous markers of minor effect controlling traits, commonly known as the infinitesimal scenario (Figure 1C), optimal thresholds were identified at 0.35 (± 0.07) for simultaneous estimation and 0.37 (± 0.07) for single estimation. These values are lower than those observed in other scenarios, indicating that a balance between power and false positives can be achieved with lower threshold values as the complexity of the trait increases, primarily due to a rise in the number of QTLs. Similar to the scenario involving 10 QTLs, simultaneous estimation demonstrated enhanced performance in terms of detection power and area under the ROC curve.
In scenarios similar to those previously discussed, but with a threshold of 0.95 as proposed by Fernando and Garrick (2013) and Fernando et al. (2017), the analysis of the scenarios involving 10 and 100 QTL yielded power and false-positive rates close to 0, rather than utilizing the optimal point illustrated in Figure 1B. However, for 3 QTL, the detection power reached moderate values (above 0.30), which is significantly lower than those discussed earlier, based on the threshold established by the ROC curve. In the same conditions, the false positive ratios for both approaches were close to 0. Nevertheless, across all scenarios, when considering every possible threshold ranging from 0 to 1 in increments of 0.01, the ROC area displayed moderate to high values, with the simultaneous approach achieving higher values for the scenarios involving 10 and 100 QTLs.
Rice data
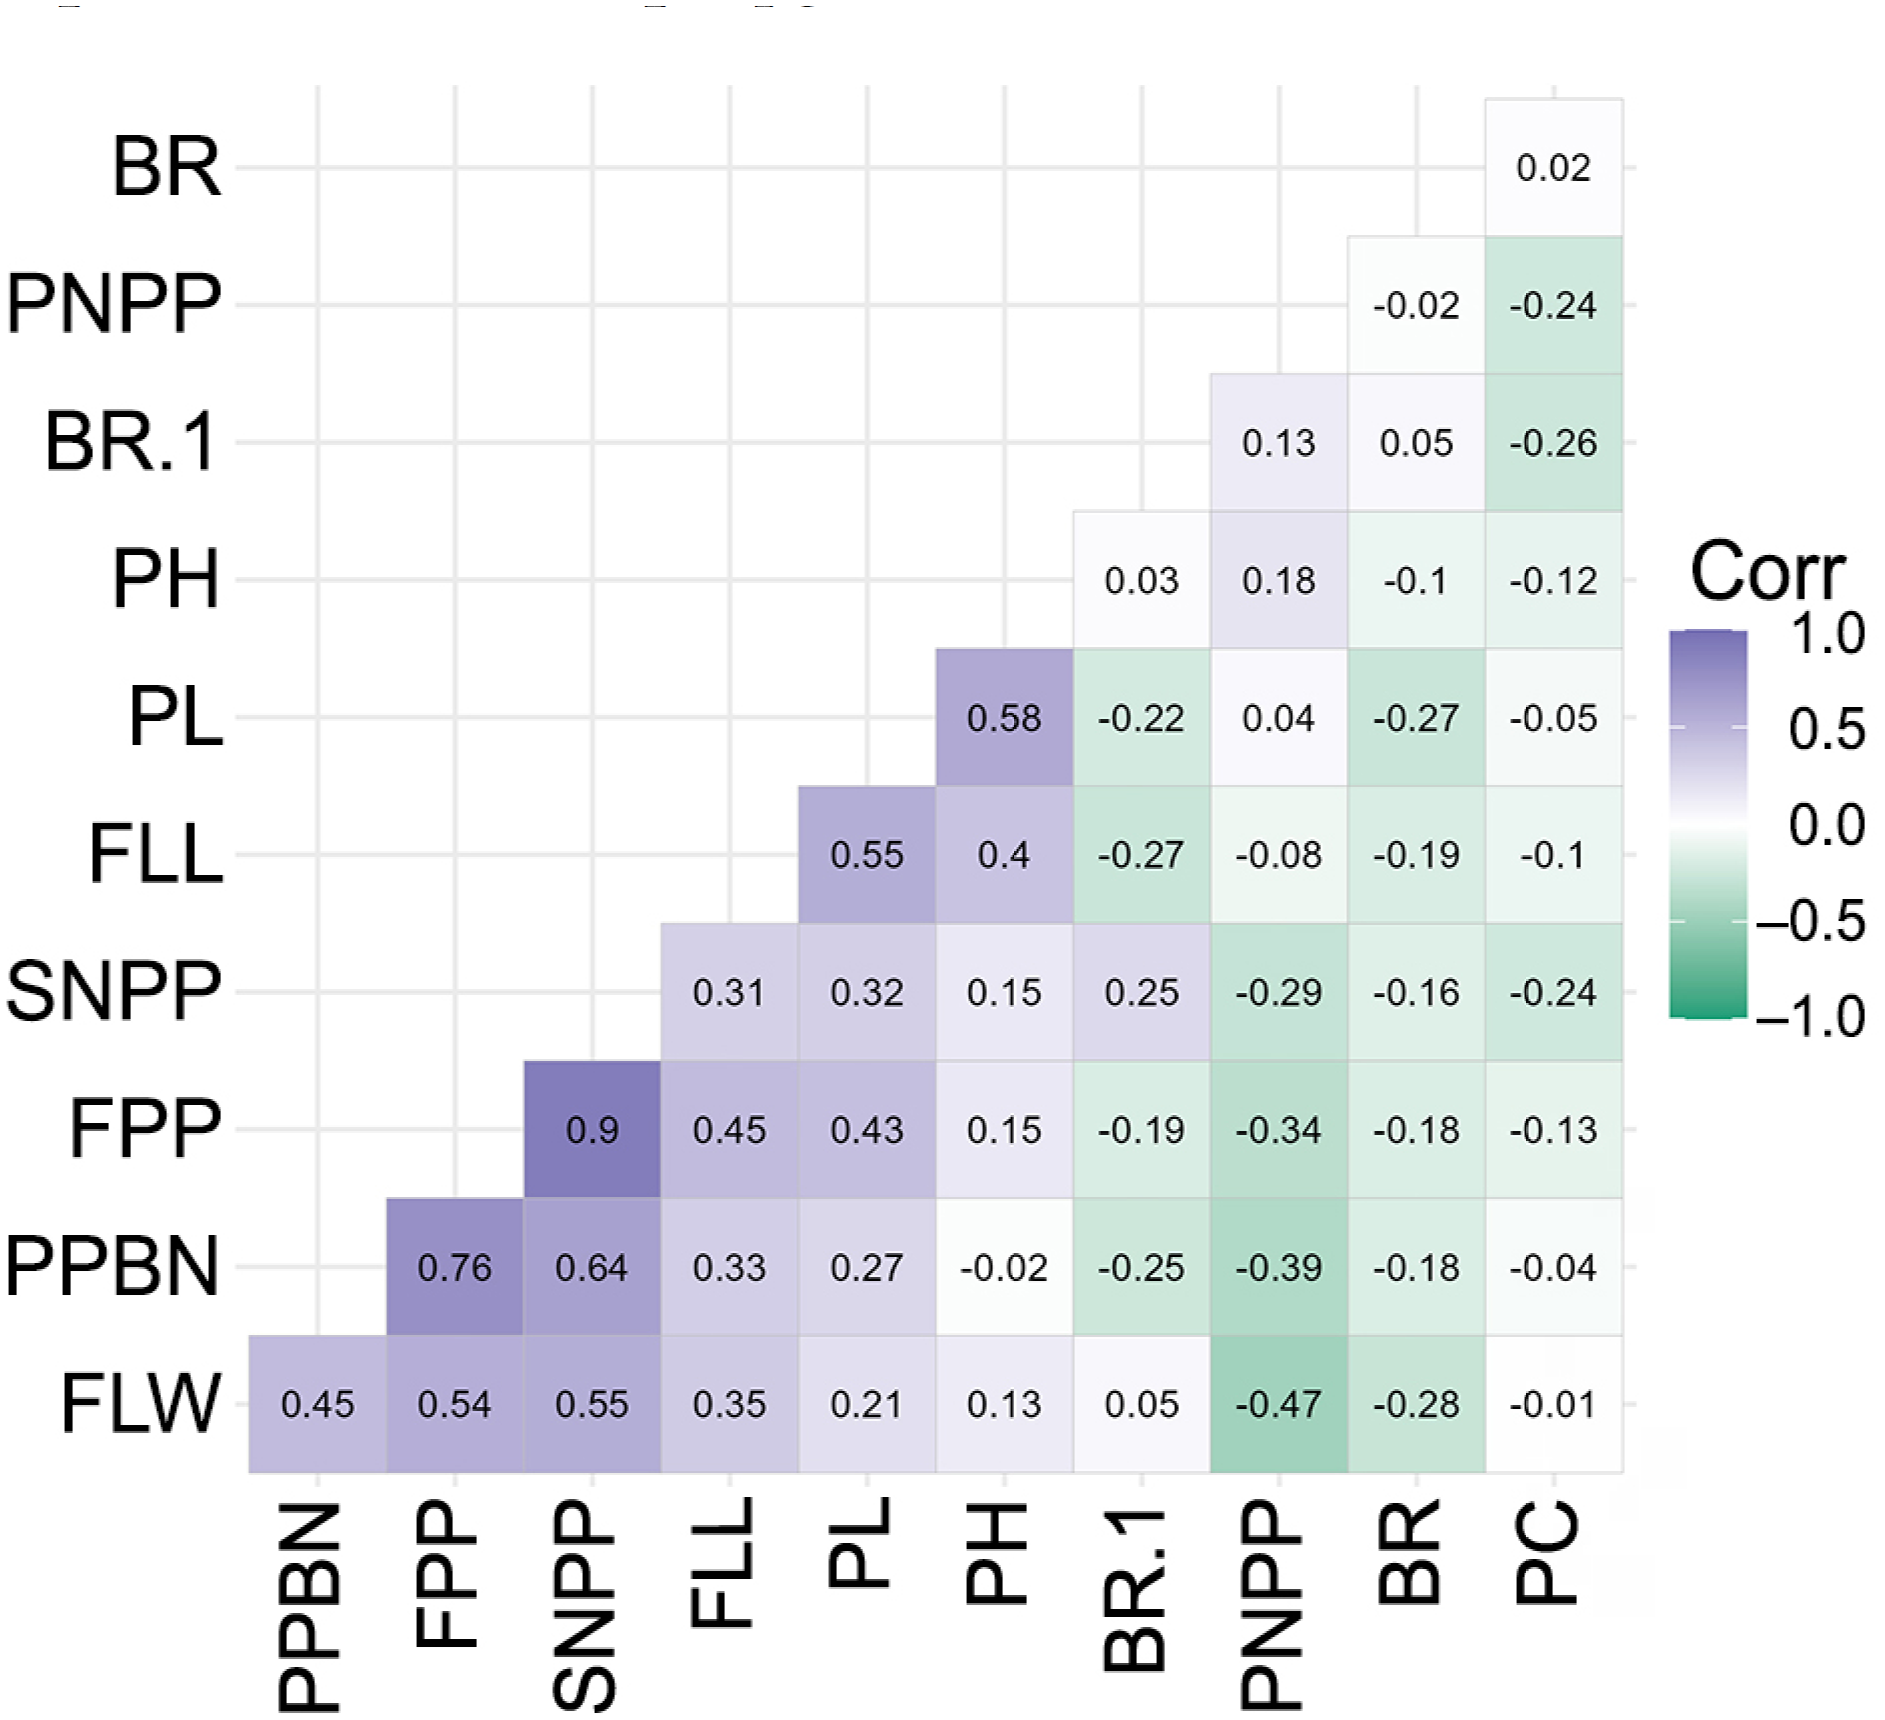
To demonstrate the application of the proposed model, real rice data containing phenotypic information for 11 traits were utilized. The correlation plot shown in Figure 2 illustrates that yield-related traits exhibit moderate positive and negative correlations (PPBN, FPP, SNPP, PL, PH, PF, and PNPP). In contrast, blast resistance and protein content reveal either no correlation or a moderate negative correlation with other traits. Additionally, traits related to plant morphology (FLL and FLW) display correlations that range from moderate negative to moderate positive.
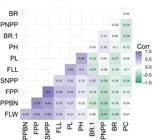
The correlation (Corr) plot illustrates the relationships among rice traits. The color scale ranges from purple, indicating a high positive correlation, to green, indicating a high negative correlation, with white representing non-correlation. FLL = flag leaf length; FLW = flag leaf width; PNPP = panicle number per plant; PPBN = primary panicle branch number; PH = plant height; PL = panicle length; FPP = florets per panicle; BR = Blast resistance; PF = panicle fertility; PC = protein content; SNPP = seed number per panicle.
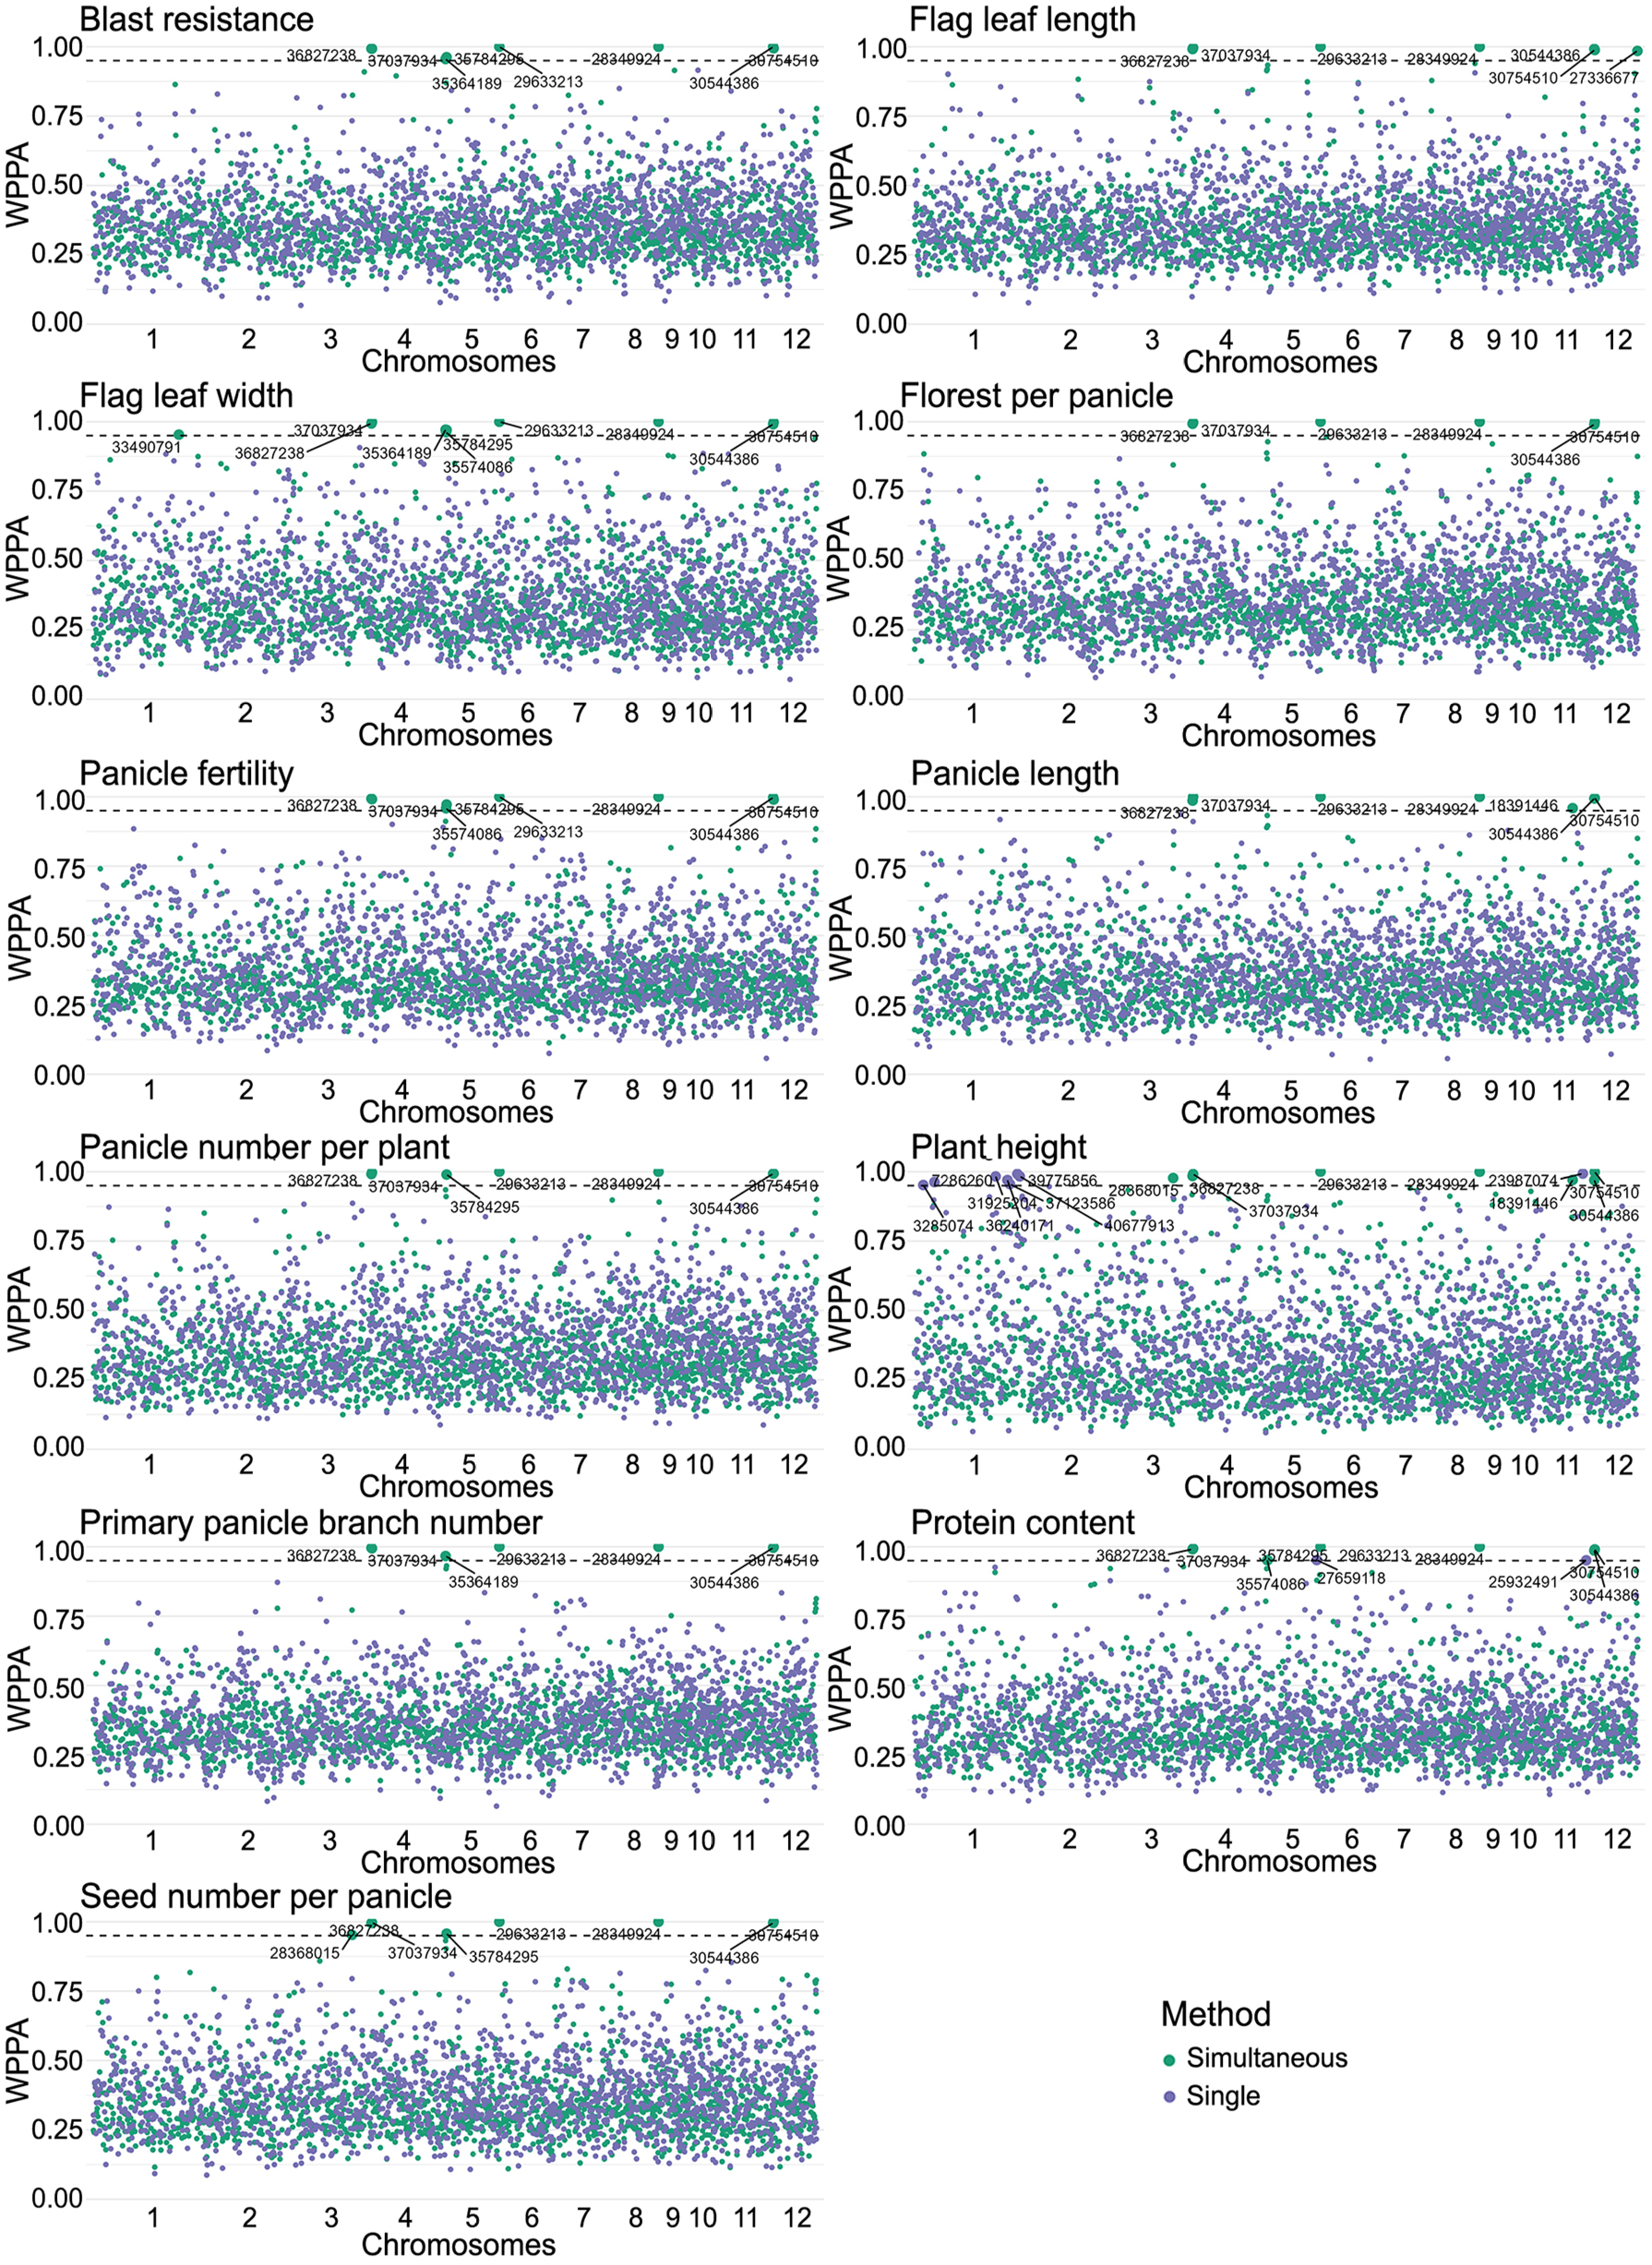
Estimates of genomic region effects were obtained using both single estimation and simultaneous estimation approaches. The WPPA values, along with the corresponding chromosomes and initial positions of the regions, were plotted on a Manhattan plot, as illustrated in Figure 3. We utilized a stringent threshold value of 0.95, validated through simulated data, to identify significant markers for the traits under investigation. Consequently, the single estimation approach identified significant markers solely for plant height (PH) and panicle count (PC), while the simultaneous estimation approach detected significant markers for all assessed traits. The limited detection of markers was anticipated, considering that the simulated data indicated a detection power approaching 0 for traits with 10 and 100 QTLs at the threshold of 0.95. The rice traits assessed are expected to exhibit polygenic inheritance.
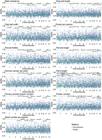
Manhattan plots of rice phenotypic traits using single estimation and simultaneous estimation of genomic region effects. Markers are plotted according to chromosome and position in the genome. The color of the points represents the posterior probability of association within the Window Posterior Probability of Association (WPPA). The horizontal line represents the chosen threshold of 0.95. Markers highlighted in green were significant in simultaneous estimation, while those in purple were significant in single estimation.
Discussion
Simulated data
The results from GWAS Bayesian models vary according to the selection criteria used, such as WPPA and the posterior probability of inclusion, as well as the specified threshold value. Among the various selection criteria, research has demonstrated that the WPPA criterion yields a more favorable outcome by effectively reducing false positives without impairing the detection power of GWAS, as reported by Lima et al. (2022). Typically, efforts to minimize false positives in GWAS lead to a compromise in detection power, as discussed by Schmid and Bennewitz (2017). In our study, we found that the threshold value varied according to the genetic architecture; specifically, a larger number of QTLs corresponded to lower threshold values as indicated by the ROC curve, a trend also observed in most scenarios evaluated by Azevedo et al. (2022).
When analyzing the differences in power values for scenarios with 3, 10, and 100 QTLs, and considering the threshold indicated by the ROC curve (Figure 1C), we observe a power reduction accompanied by an increase in the number of QTLs. This reduction supports the conclusion that genetic architecture and heritability significantly influence detection power (Shin and Lee, 2015). In their research, the authors observed a significant increase in power when assessing oligogenic traits with higher heritability, as these traits exhibit less complexity compared to polygenic traits. Our study demonstrated superior power values for simultaneous approaches in scenarios with a larger number of QTLs, indicative of more polygenic traits. This model can detect greater complexity associated with traits that involve LD among neighboring regions (Klein et al., 2005). However, in case of oligogenic inheritance, employing the simultaneous model does not offer any advantages.
A similar pattern is observed when considering a threshold of 0.95 (Figure 1D). In this context, the scenario with three major effect QTLs (an oligogenic trait) was the only one that exhibited a non-zero detection power in both approaches, along with a false positive ratio close to zero. However, the threshold values derived from the ROC curves (Figure 1C) appear to strike a balance between high true positive rates and low false positive rates for polygenic traits, which represent the majority of traits evaluated in breeding programs. In instances where the threshold value of 0.95 does not reveal significant associations, lowering this threshold may help identify regions, albeit with a moderate increase in false positive rates. Based on simulated results, we can consider adjusting the thresholds from 0.95 to any value above 0.5 and assessing a range of threshold values, similar to the approach used by Oliveira et al. (2023) in their exploration of quantiles in quantile regression. Identifying potential candidate regions can assist molecular breeders in making informed decisions.
Rice data
Given the challenges associated with applying the ROC curve to real data due to unknown true associations, a threshold of 0.95 was established for WPPA in the rice dataset. This conservative approach aimed to minimize the false-positive rate, as evidenced by simulated data. The intention was to demonstrate the applicability of the two estimation approaches. However, it is essential to conduct further studies to assess various simulated scenarios, including differences in genetic architecture, heritability values, and sample sizes, to improve our understanding of how to select threshold values in real datasets.
By analyzing the 11 phenotypic traits, simultaneous estimation identified a larger number of associated regions. Specifically, this approach detected regions associated with all 11 phenotypic traits. In contrast, a single estimation was limited to identifying associated regions for flag leaf length, plant height, panicle fertility, protein content, and resistance to blast disease.
The analysis indicated that simultaneous estimation primarily identified the same associated regions on chromosomes 3, 8, and 11 across the evaluated phenotypic traits. This finding suggests the presence of pleiotropic effects among these traits, which is further supported by the observation that most of them exhibit moderate genetic correlation (Figure 2). Pleiotropy can contribute to genetic correlation since a single gene product may affect multiple traits, thereby influencing more than one trait, or because it is part of a metabolic pathway with multiple downstream effects (Wagner and Zhang, 2011). The significance of pleiotropy in GWAS analysis has been examined by Chebib and Guillaume (2021), who concluded that pleiotropic loci are generally more detectable, thereby enhancing the true discovery rates.
Interestingly, the results obtained through simultaneous estimation differ from those reported in the study by Suela et al. (2022), which utilized the RHM method based on a mixed model and single-region approaches applied to the same rice dataset. This discrepancy suggests a potential complementarity between the methods. The differences may stem from the distinct estimation approaches used: Suela et al. (2022) employed a BLUP/REML framework without any prior information, whereas our study adopted a Bayesian approach that incorporates prior information regarding the scale parameter of the inverted-scale chi-square prior distribution for variance components, as described by Pérez and de los Campos (2014).
However, these discrepancies may also stem from the differing assumptions of single-region versus multiple-region models. When analyzing a single region, the proportion of genetic variance it accounts for may be insufficient for that region to be considered significant, resulting in false negatives and reduced detection power. In such instances, the presence of LD between regions can be beneficial. Previous studies have shown that evaluating each variant individually may not be sufficient, as methods that consider the cumulative effects of multiple variants within a gene can enhance power, particularly when several variants are associated with a trait (Lee et al., 2014). By estimating the effect of one region while considering the influence of others, we can uncover more complex interrelationships among regions.
On the other hand, in situations where regions are in high LD, using multiple-region models during estimation may dilute the effects, thereby preventing any region from being detected as associated. Future studies should consider strategies such as LD pruning to mitigate this issue.
Only the single Bayesian estimation could identify an overlapping region for PH (31925204 – 40677913) in comparison to the authors’ findings, highlighting significant genes associated with PH. Notable examples include the QTLph1 region (39,470,000 – 42,710,000 bp) documented by Ishimaru et al. (2004), the Semidwarf1 gene (Sd1; 38,382,382 bp) reported by Ashikari et al. (2002), Monna et al. (2002), and Spielmeyer et al. (2002), as well as the Ph1 gene (37,866,252 bp), as reported by Kovi et al. (2011).
Simultaneous estimation identified an associated region on chromosome 8 for plant height (PH), corresponding to the same region where Huang et al. (1996) identified a QTL. This alignment can be attributed to the ability of simultaneous estimation to capture regions near those documented in existing literature. Similarly, this method also identified a region on chromosome 3 that is close to the QTL reported by Li et al. (2003) for plant height (PH). In contrast, single estimation, which also considered PH, identified the QTL described by Thomson et al. (2003).
In the analysis of panicle number per plant, simultaneous estimation revealed regions on chromosome 8 that are close to those identified by Ishimaru et al. (2001) and Lanceras et al. (2004). For panicle length (PL), simultaneous estimation detected adjacent regions on chromosomes 8 and 3, which correspond to the findings of Kobayashi et al. (2003) and Hittalmani et al. (2003), respectively. However, single estimation did not identify any associated regions for these two traits. Additionally, for other traits such as flag leaf width, flowers per panicle, flag leaf length, and seed number per panicle, none of the detected regions were associated with any annotated genes or QTLs in the databases.
In conclusion, the results demonstrate that the simultaneous estimation of genomic region effects using a Bayesian approach yields satisfactory outcomes for the simulated data. This method exhibits at least the same level of efficiency as single estimations and proves to be superior in the context of more complex phenotypes. Although the choice of threshold presents a limitation for these approaches, we found that lowering the threshold values can enhance the power of detecting significant regions, albeit with an accompanying increase in the false-positive rate. In our analysis of the real rice dataset, simultaneous estimation successfully identified a larger number of regions previously reported in the literature, outperforming the single estimation method. Additionally, this approach uncovered new genomic regions in the rice dataset, highlighting its potential for application, discovery, and investigation of novel genomic regions associated with phenotypic traits. This approach is particularly relevant for post-GWAS analyses and holds promise for future genetic breeding research across other species.
Data availability statement
The data are publicly accessible online.
Acknowledgments
The authors are grateful for the financial support granted by the Fundação de Amparo à Pesquisa do Estado de Minas Gerais (FAPEMIG), the Coordenação de Aperfeiçoamento de Pessoal de Nível Superior (CAPES) – funding code 001, and the Conselho Nacional de Desenvolvimento Científico e Tecnológico (CNPq).
References
-
Al Kalaldeh M, Gibson J, Lee SH, Gondro C, van der Werf JHJ. 2019. Detection of genomic regions underlying resistance to gastrointestinal parasites in Australian sheep. Genetics Selection Evolution 51: 37. https://doi.org/10.1186/s12711-019-0479-1
» https://doi.org/10.1186/s12711-019-0479-1 -
Ammiraju JS, Luo M, Goicoechea JL, Wang W, Kudrna D, Mueller C, et al. 2006. The Oryza bacterial artificial chromosome library resource: construction and analysis of 12 deep-coverage large-insert BAC libraries that represent the 10 genome types of the genus Oryza Genome Research 16: 140-147. https://doi.org/10.1101/gr.3766306
» https://doi.org/10.1101/gr.3766306 -
Ashikari M, Sasaki A, Ueguchi-Tanaka M, Itoh H, Nishimura A, Datta S, et al. 2002. Loss-of-function of a rice gibberellin biosynthetic gene, GA20 oxidase (GA20ox-2, led to the rice ‘Green Revolution’. Breeding Science 52: 143-150. https://doi.org/10.1270/jsbbs.52.143
» https://doi.org/10.1270/jsbbs.52.143 -
Azevedo CF, Nascimento M, Fontes VC, Silva FF, Resende MDV, Cruz CD. 2019. GenomicLand: software for Genome-Wide Association Studies and genomic prediction. Acta Scientiarum. Agronomy 41: e45361. https://doi.org/10.4025/actasciagron.v41i1.45361
» https://doi.org/10.4025/actasciagron.v41i1.45361 -
Azevedo CF, Lima LP, Nascimento M, Nascimento ACC. 2022. Bayesian methods for genomic association of chromosomic regions considering the additive-dominance model. Crop Breeding and Applied Biotechnology 22: e418422310. https://doi.org/10.1590/1984-70332022v22n3a33
» https://doi.org/10.1590/1984-70332022v22n3a33 -
Bates D, Kliegl R, Vasishth S, Baayen H. 2015. Parsimonious mixed models. In: arXiv Preprints. https://arxiv.org/abs/1506.04967
» https://arxiv.org/abs/1506.04967 -
Batista LG, Gaynor RC, Margarido GRA, Byrne T, Amer P, Gorjanc G, et al. 2021. Long-term comparison between index selection and optimal independent culling in plant breeding programs with genomic prediction. PLoS One 16: e0235554. https://doi.org/10.1371/journal.pone.0235554
» https://doi.org/10.1371/journal.pone.0235554 -
Bennewitz J, Edel C, Fries R, Meuwissen THE, Wellmann R. 2017. Application of a Bayesian dominance model improves power in quantitative trait genome-wide association analysis. Genetics Selection Evolution 49: 7. https://doi.org/10.1186/s12711-017-0284-7
» https://doi.org/10.1186/s12711-017-0284-7 -
Chebib J, Guillaume F. 2021. Pleiotropy or linkage? Their relative contributions to the genetic correlation of quantitative traits and detection by multitrait GWA studies. Genetics 219: iyab159. https://doi.org/10.1093/genetics/iyab159
» https://doi.org/10.1093/genetics/iyab159 -
Covarrubias-Pazaran G. 2016. Genome-assisted prediction of quantitative traits using the R package sommer. PLoS ONE 11: e0156744. https://doi.org/10.1371/journal.pone.0156744
» https://doi.org/10.1371/journal.pone.0156744 -
Fernando RL, Nettleton D, Southey BR, Dekkers JCM, Rothschild MF, Soller M. 2004. Controlling the proportion of false positives in multiple dependent tests. Genetics 166: 611-619. https://doi.org/10.1534/genetics.166.1.611
» https://doi.org/10.1534/genetics.166.1.611 - Fernando RL, Garrick D. 2013. Bayesian methods applied to GWAS. p. 237-274. In: Gondro C, van der Werf J, Hayes B. eds. Genome-Wide Association Studies and genomic prediction. Humana Press, Totowa, NJ, USA.
-
Fernando R, Toosi A, Wolc A, Garrick D, Dekkers J. 2017. Application of whole-genome prediction methods for genome-wide association studies: a Bayesian approach. Journal of Agricultural, Biological and Environmental Statistics 22: 172-193. https://doi.org/10.1007/s13253-017-0277-6
» https://doi.org/10.1007/s13253-017-0277-6 - Gamerman D, Lopes HF. 2006. Markov Chain Monte Carlo: Stochastic Simulation for Bayesian Inference. CRC Press, Boca Raton, FL, USA.
-
Gaynor RC, Gorjanc G, Hickey JM. 2021. AlphaSimR: an R package for breeding program simulations. G3: Genes, Genomes, Genetics 11: jkaa017. https://doi.org/10.1093/g3journal/jkaa017
» https://doi.org/10.1093/g3journal/jkaa017 -
Geman S, Geman D. 1993. Stochastic relaxation, Gibbs distributions, and the Bayesian restoration of images. Journal of Applied Statistics 20: 25-62. https://doi.org/10.1080/02664769300000058
» https://doi.org/10.1080/02664769300000058 - Geweke J. 1992. Evaluating the accuracy of sampling-based approaches to the calculation of posterior moments. p. 625-631. In: Bernardo JM, Berger JO, Dawid AP, Smith AFM. eds. Bayesian statistics. Oxford University Press, Oxford, UK.
-
Goddard ME, Hayes BJ, Meuwissen TH. 2011. Using the genomic relationship matrix to predict the accuracy of genomic selection. Journal of Animal Breeding and Genetics 128: 409-421. https://doi.org/10.1111/j.1439-0388.2011.00964.x
» https://doi.org/10.1111/j.1439-0388.2011.00964.x -
Hittalmani S, Huang N, Courtois B, Venuprasad R, Shashidhar HE, Zhuang JY, et al. 2003. Identification of QTL for growth- and grain yield-related traits in rice across nine locations of Asia. Theoretical and Applied Genetics 107: 679-690. https://doi.org/10.1007/s00122-003-1269-1
» https://doi.org/10.1007/s00122-003-1269-1 -
Huang N, Courtois B, Khush GS, Lin HX, Wang GL, Wu P, et al. 1996. Association of quantitative trait loci for plant height with major dwarfing genes in rice. Heredity 77: 130-137. https://doi.org/10.1038/hdy.1996.117
» https://doi.org/10.1038/hdy.1996.117 -
Ishimaru K, Yano M, Aoki N, Ono K, Hirose T, Lin SY, et al. 2001. Toward the mapping of physiological and agronomic characters on a rice function map: QTL analysis and comparison between QTLs and expressed sequence tags. Theoretical and Applied Genetics 102: 793-800. https://doi.org/10.1007/s001220000467
» https://doi.org/10.1007/s001220000467 -
Ishimaru K, Ono K, Kashiwagi T. 2004. Identification of a new gene controlling plant height in rice using the candidate-gene strategy. Planta 218: 388-395. https://doi.org/10.1007/s00425-003-1119-z
» https://doi.org/10.1007/s00425-003-1119-z -
Kim S, Plagnol V, Hu TT, Toomajian C, Clark RM, Ossowski S, et al. 2007. Recombination and linkage disequilibrium in Arabidopsis thaliana Nature Genetics 39: 1151-1155. https://doi.org/10.1038/ng2115
» https://doi.org/10.1038/ng2115 -
Klein AP, Tsai YY, Duggal P, Gillanders EM, Barnhart M, Mathias RA, et al. 2005. Investigation of altering single-nucleotide polymorphism density on the power to detect trait loci and frequency of false positive in nonparametric linkage analyses of qualitative traits. BMC Genomic Data 6: S20. https://doi.org/10.1186/1471-2156-6-S1-S20
» https://doi.org/10.1186/1471-2156-6-S1-S20 -
Kobayashi S, Fukuta Y, Sato T, Osaki M, Khush GS. 2003. Molecular marker dissection of rice (Oryza sativa L.) plant architecture under temperate and tropical climates. Theoretical and Applied Genetics 107: 1350-1356. https://doi.org/10.1007/s00122-003-1388-8
» https://doi.org/10.1007/s00122-003-1388-8 -
Kovi MR, Zhang Y, Yu S, Yang G, Yan W, Xing Y. 2011. Candidacy of a chitin-inducible gibberellin-responsive gene for a major locus affecting plant height in rice that is closely linked to Green Revolution gene sd1 Theoretical and Applied Genetics 123: 705-714. https://doi.org/10.1007/s00122-011-1620-x
» https://doi.org/10.1007/s00122-011-1620-x -
Lanceras JC, Pantuwan G, Jongdee B, Toojinda T. 2004. Quantitative trait loci associated with drought tolerance at reproductive stage in rice. Plant Physiology 135: 384-99. https://doi.org/10.1104/pp.103.035527
» https://doi.org/10.1104/pp.103.035527 -
Lee S, Abecasis GR, Boehnke M, Lin X. 2014. Rare-variant association analysis: study designs and statistical tests. American Journal of Human Genetics 95: 5-23. https://doi.org/10.1016/j.ajhg.2014.06.009
» https://doi.org/10.1016/j.ajhg.2014.06.009 -
Li ZK, Yu SB, Lafitte HR, Huang N, Courtois B, Hittalmani S, et al. 2003. QTL × environment interactions in rice. I. Heading date and plant height. Theoretical and Applied Genetics 108: 141-153. https://doi.org/10.1007/s00122-003-1401-2
» https://doi.org/10.1007/s00122-003-1401-2 -
Lima LP, Azevedo CF, Resende MDV, Nascimento M, Silva FF. 2022. Evaluation of Bayesian methods of genomic association via chromosomic regions using simulated data. Scientia Agricola 79: e20200202. https://doi.org/10.1590/1678-992X-2020-0202
» https://doi.org/10.1590/1678-992X-2020-0202 -
Metz CE. 1978. Basic principles of ROC analysis. Seminars in Nuclear Medicine 8: 283-298. https://doi.org/10.1016/S0001-2998(78)80014-2
» https://doi.org/10.1016/S0001-2998(78)80014-2 -
Monna L, Kitazawa N, Yoshino R, Suzuki J, Masuda H, Maehara Y, et al. 2002. Positional cloning of rice semidwarfing gene, sd-1: rice "Green Revolution gene" encodes a mutant enzyme involved in gibberellin synthesis. DNA Research 9: 11-17. https://doi.org/10.1093/dnares/9.1.11
» https://doi.org/10.1093/dnares/9.1.11 -
Moore JH, Asselbergs FW, Williams SM. 2010. Bioinformatics challenges for genome-wide association studies. Bioinformatics 26: 445-455. https://doi.org/10.1093/bioinformatics/btp713
» https://doi.org/10.1093/bioinformatics/btp713 -
Nagamine Y, Pong-Wong R, Navarro P, Vitart V, Hayward C, Rudan I, et al. 2012. Localising loci underlying complex trait variation using regional genomic relationship mapping. PLoS One 7: e46501. https://doi.org/10.1371/journal.pone.0046501
» https://doi.org/10.1371/journal.pone.0046501 -
Oliveira GF, Nascimento ACC, Azevedo CF, Celeri MO, Barroso LMA, Sant’Anna IC, et al. 2023. Population size in QTL detection using quantile regression in genome-wide association studies. Scientific Reports 13: 9585. https://doi.org/10.1038/s41598-023-36730-z
» https://doi.org/10.1038/s41598-023-36730-z -
Pérez P, de los Campos G. 2014. Genome-wide regression and prediction with the BGLR statistical package. Genetics 198: 483-495. https://doi.org/10.1534/genetics.114.164442
» https://doi.org/10.1534/genetics.114.164442 -
Perkins NJ, Schisterman EF. 2006. The inconsistency of "optimal" cutpoints obtained using two criteria based on the receiver operating characteristic curve. American Journal of Epidemiology 163: 670-675. https://doi.org/10.1093/aje/kwj063
» https://doi.org/10.1093/aje/kwj063 -
Peters SO, Kizilkaya K, Garrick DJ, Fernando RL, Reecy JM, Weaber RL, et al. 2012. Bayesian genome-wide association analysis of growth and yearling ultrasound measures of carcass traits in Brangus heifers. Journal of Animal Science 90: 3398-3409. https://doi.org/10.2527/jas.2012-4507
» https://doi.org/10.2527/jas.2012-4507 - Plummer M, Best N, Cowles K, Vines K. 2006. CODA: convergence diagnosis and output analysis for MCMC. R News 6: 7-11.
- Resende MDV, Silva FF, Azevedo CF. 2014. Estatística Matemática, Biométrica e Computacional: Modelos Mistos, Multivariados, Categóricos e Generalizados (REML/BLUP), Inferência Bayesiana, Regressão Aleatória, Seleção Genômica, QTL-GWAS, Estatística Espacial e Temporal, Competição, Sobrevivência. Editora Suprema, Visconde do Rio Branco, MG, Brazil (in Portuguese).
-
Resende RT, Resende MDV, Azevedo CF, Silva FF, Melo LC, Pereira HS, et al. 2018. Genome-wide association and regional heritability mapping of plant architecture, lodging and productivity in Phaseolus vulgaris G3: Genes, Genomes, Genetics 8: 2841-2854. https://doi.org/10.1534/g3.118.200493
» https://doi.org/10.1534/g3.118.200493 -
Schmid M, Bennewitz J. 2017. Genome-wide association analysis for quantitative traits in livestock - a selective review of statistical models and experimental designs. Archives Animal Breeding 60: 335-346. https://doi.org/10.5194/aab-60-335-2017
» https://doi.org/10.5194/aab-60-335-2017 -
Shin J, Lee C. 2015. Statistical power for identifying nucleotide markers associated with quantitative traits in genome-wide association analysis using a mixed model. Genomics 105: 1-4. https://doi.org/10.1016/j.ygeno.2014.11.001
» https://doi.org/10.1016/j.ygeno.2014.11.001 -
Spielmeyer W, Ellis MH, Chandler PM. 2002. Semidwarf (sd-1, "Green Revolution" rice, contains a defective gibberellin 20-oxidase gene. Proceedings of the National Academy of Sciences 99: 9043-9048. https://doi.org/10.1073/pnas.132266399
» https://doi.org/10.1073/pnas.132266399 -
Suela MM, Azevedo CF, Nascimento M, Nascimento ACC, Resende MDV. 2022. Regional heritability mapping and genome-wide association identify loci for rice traits. Crop Science 62: 839-858. https://doi.org/10.1002/csc2.20706
» https://doi.org/10.1002/csc2.20706 -
Thomson MJ, Tai TH, McClung AM, Lai XH, Hinga ME, Lobos KB, et al. 2003 Mapping quantitative trait loci for yield, yield components and morphological traits in an advanced backcross population between Oryza rufipogon and the Oryza sativa cultivar Jefferson. Theoretical and Applied Genetics 107: 479-493. https://doi.org/10.1007/s00122-003-1270-8
» https://doi.org/10.1007/s00122-003-1270-8 -
Uffelmann E, Huang QQ, Munung NS, Vries J, Okada Y, Martin AR, et al. 2021. Genome-wide association studies. Nature Reviews Methods Primers 1: 59. https://doi.org/10.1038/s43586-021-00056-9
» https://doi.org/10.1038/s43586-021-00056-9 -
Vos PG, Paulo MJ, Voorrips RE, Visser RGF, van Eck HJ, van Eeuwijk FA. 2017. Evaluation of LD decay and various LD-decay estimators in simulated and SNP-array data of tetraploid potato. Theoretical and Applied Genetics 130: 123-135. https://doi.org/10.1007/s00122-016-2798-8
» https://doi.org/10.1007/s00122-016-2798-8 -
Wagner GP, Zhang J. 2011. The pleiotropic structure of the genotype-phenotype map: the evolvability of complex organisms. Nature Reviews Genetics 12: 204-213. https://doi.org/10.1038/nrg2949
» https://doi.org/10.1038/nrg2949 -
Zhao K, Tung CW, Eizenga GC, Wright MH, Ali ML, Price AH, et al. 2011. Genome-wide association mapping reveals a rich genetic architecture of complex traits in Oryza sativa Nature Communication 13: 467. https://doi.org/10.1038/ncomms1467
» https://doi.org/10.1038/ncomms1467 -
Ziegler A, König IR, Thompson JR. 2008. Biostatistical aspects of genome-wide association studies. Biometrical Journal 50: 8-28. https://doi.org/10.1002/bimj.200710398
» https://doi.org/10.1002/bimj.200710398
Edited by
-
Edited by:
Thomas Kumke