 Potential of soybean [Glycine max (L.) Merrill] progenies from southern Brazil
ABSTRACT
This work aims to characterize and estimate soybean genotypes’ productive potential and industrial quality, understand the associations between traits and identify genotypes for a breeding program. Four collections totaling 301 genotypes were used, and ten quantitative characteristics were analyzed, including the mass of one hundred seeds (100 SW, where SW stands for seed weight), protein content (PC), oil content (OIL), fiber (FIB), ash content (ASH), palmitic acid (PA), stearic acid (SA), oleic acid (OA), linoleic acid (LA), linolenic acid (LNA). Descriptive analysis, Tukey's test, Lilliefors statistics, and Pearson correlation were applied. The Euclidean distance matrix generated a network of correlations, and Venn Diagrams analyzed the most promising genotypes. The analyses showed that 100 SW, an average of 15.66 %, was low. Among the seed constituents, only PC was less, with an average of 33.40 % associated with a variability of 2.02. PC and OIL presented possible polygenic control of an additive nature. The strongest correlation was between PC and OIL, with a value of −0.7. The 100 SW correlated positively with PC but negatively with FIB, indicating negligible and weak correlations, with values of 0.18 and 0.31, respectively. Collections 3 and 4 individually presented the lowest and the highest number of high-intensity interactions, respectively. The diagrams underscored the difficulty of simultaneously highlighting genotypes with superior performance considering multiple characteristics. It is concluded that except for collection 3, the genotypes presented low PC and low variability requiring the inclusion of favorable allelic forms, and genotypes with superior performance were identified on account of the characteristics 100 SW and PC or 100 SW and OIL.
Keywords:
commercial characteristics; collections; variability
Introduction
Soybean is a grain that originated in China more than 5,000 years ago. As a legume species, soybeans have high protein quality, which makes their products a significant source of plant-based proteins (Qin et al., 2022). Currently, Brazil is the world's largest producer of soybeans. Furthermore, breeding programs advance yearly in the country, mainly, selecting genotypes according to their commercial and agronomic characteristics (Carvalho et al., 2021; Carvalho et al., 2023). Furthermore, the physiological characteristics of soybeans show high correlation with the plant's productivity, making it the target of breeding programs that use indirect selection (Todeschini et al., 2019).
Data in the literature indicate that soybeans contain approximately 40 % protein and 20 % oil on a dry basis (Berhow et al., 2020). However, obtaining soybean genotypes with high productivity and industrial quality encounters a series of problems. One of these problems, of a genetic nature, is associated with an unfavorable relationship between protein concentration and grain productivity or between protein and oil concentrations. The other concern is the economic aspect since the producer receives for the quantity produced and not for the protein and oil content (OIL) of the produced grains.
Considering the above, assessing the productive potential of soybeans and their industrial quality characteristics is of great interest to breeders. When expressed, the productive and quality potential of soybean crops takes into account the environmental and genetic components and the resulting interaction between them (Herrera et al., 2020). Furthermore, for the sustainable cultivation of the crop, genotypes with higher grain quality and productivity levels are also necessary (Finoto et al., 2021). Therefore, the present work aimed to characterize and estimate the productive potential and quality of soybean genotypes [Glycine max (L.) Merrill] and understand the associations between a number of agronomic characteristics and others representative of industrial quality, and point out possible genotypes that meet the needs of the breeding program.
Materials and Methods
Genetic material used
The genetic material comes from the Programa de Melhoramento Genético from the Universidade Regional do Noroeste do Estado do Rio Grande do Sul (UNIJUÍ). A nutraceutical experiment was carried out in the municipality of Campos Borges, in the state of Rio Grande do Sul, Brazil, with a humid subtropical climate. It is located at coordinates 28°52’31" S, 53°00’55" W, and altitude 459 m. The design was augmented blocks, for which four collections were tested. Detailed information on the four collections of the study is provided in Table 1. The first collection, Campos Borges (CB), comprised 154 individuals. The second collection, control cultivars (CC), included 22 cultivars. The third collection, comprising advanced F4 and F7 lines, consists of 87 individuals. Finally, the fourth collection, base population (F2), representing the base population, was made up of 32 individuals. In total, there were 301 genotypes.
Identification of the progenies and the number of individuals corresponding to each one. F2 is the base population; Campos Borges (CB), control cultivars (CC), and F4 and F7 are segregant, with F4 and F7 being advanced lines.
Phenotypic data obtained from ten quantitative traits were collected and transformed into a table of means.
Evaluated agronomic traits
The ten traits analyzed were mass of one hundred seeds (g) (100 SW, where SW stands for seed weight) which represents one of the primary components of grain production and other characteristics of industrial quality as follows: protein content (PC %), oil content (OIL %), fiber (FIB %), ash content (ASH %), palmitic acid (PA %), stearic acid (SA %), oleic acid (OA %), linoleic acid (LA %), and linolenic acid (LNA %). All traits were represented as a percentage of dry weight.
Initially, 100-g samples of soybean seeds were dried at 105 °C to correct the moisture to 13 %. This value, 13 %, is the moisture content recommended for grain storage, which, will also avoid mechanical and latent damage and pests since seeds harvested with moisture above 13 % tend to suffer mechanical and latent damage, while those harvested below 13 % tend to suffer immediate damage (Lorini et al., 2020).
After drying, the samples were ground to obtain a fine and homogeneous powder, which was then subjected to sieving using 5 mm sieves. Subsequently, 55-g samples were used to evaluate the following characteristics in spectrophotometers: PC, OIL, FIB, ASH, PA, SA, OA, LA, LNA. The analyses used a SpectraStar™ XT NIR series spectrophotometer from Unity® Scientific. The device was calibrated with five samples to obtain the study parameters.
Descriptive statistics
The GENES software was used to perform a descriptive analysis of the traits containing information on the means, standard deviation, variance, coefficient of variation, and minimum and maximum values, referring to the soybean genotypes (Cruz, 2016).
For each variable, the statistics are calculated as follows:
N = total number of data
Average
Minimum value
Maximum value
Coefficient of variation
Variance () of the data, given by:
Standard deviation (), given by:
Association between characteristics
The data were submitted to a Pearson correlation analysis, as described in Eq. (1) below:
where,
The correlation coefficient is adimensional, and its absolute value is between 1 and −1, i.e., −1 ≤ r ≤ 1. A null correlation index, equal to 0, does not indicate a lack of correlation between the variables, only that there is no linear correlation between them. The significance of the correlation assessed by the t-test is given by the Eq. (3) below, given that the hypothesis that the correlation coefficient is equal to 0:
in which it is associated with n − 2 degrees of freedom and at a significance level α at 1 or 5 % probability.
Network of correlations
The correlation matrix was analyzed through the correlation network, which used the Euclidean distance matrix, in which Yij represents the observation in the ith genotype (clone, genotype, cultivar, lineage, etc.) for the jth trait and defines the distance between the pair of genotypes i and i′ by means of Eq. (4):
The Euclidean distance matrix was generated using Pearson's correlation, which measures the linear relationship between two variables and is defined by Eq. (5):
where, ry1y2 = Pearson's linear correlation between Y1 and Y2; S12 = sample covariance between the dependent variables Y1 and Y2; sample variance of the dependent variable Y1, and = sample variance of the dependent variable Y1.
The thickness and intensity of the border color were controlled by a crop value of 0.3, which means that only |r_ij| ≥ 3 have their lines highlighted. In addition, positive correlations were highlighted by the color green and negative correlations by the color red. In addition, proportionally, the greater the thickness of the border, the greater the correlation between the variables (Epskamp et al., 2012). The thickness and intensity of the border color were controlled by a crop value of 0.3, which means that only |r_ij| ≥ 3 had their lines highlighted. In addition, positive correlations were highlighted by the color green and negative correlations by the color red. In addition, proportionally, the greater the thickness of the border, the greater the correlation between the variables.
Results
The estimates referring to the total set of available genotypes, regardless of their origin, designated in this work as a working collection, are shown in Table 2.
Notably the present study involves a characteristic directly related to grain production: the mass of 100 seeds, and the others refer to the quality of the grains. Thus, it appears that 100 SW (g) (Table 2) varied from 12.33 to 21.48 g with an average of 15.66 g. Through descriptive analysis, it is possible to verify the coefficient of variation below 30 % for all characteristics except LNA, which presented high heterogeneity, since the coefficient of variation was 66.04 %. Furthermore, only PC was low among the seed constituents, with an average of 33.40 % associated with a variability of 2.02.
PC (%) ranged from 29.2 to 36.41 %, averaging 33.41 %. As for the OIL characteristic, the variation was between 16.59 and 21.37, with an estimated general average of 19.07 %. FIB (%) ranged from 5.15 to 6.54 % with an average of 5.8798 %. Another characteristic under study was the ASH (%), which varied from 4.99 to 5.51 % with an average of 5.1562 %. Palmitic, stearic, oleic, linoleic, and linolenic fatty acids had average concentrations of 10.07, 4.15, 22.89, 59.25 and 2.48 %, respectively.
The fatty acid profile of soybean seeds showed discrepancies regarding their coefficient of variation estimates. Among these characters, the highest coefficient of variation estimate was for LA, corresponding to 66.04 %.
The 100 SW characteristics and FIB content showed distribution curves that do not approach a normal distribution, as they present a p-value that reflects the significance of the D statistic of the Lilliefors test, and both can be seen in Figure 1A and 1D, respectively. The FIB characteristic was the one that distanced the most from the normality standard, demonstrating the rejection of the normality test through the Lilliefors D statistic, a certain asymmetry, and a curve with a high kurtosis pattern. The PC and OIL characteristics, Figure 1B and 1C respectively, presented a distribution with a typical normal pattern.

Representation of the Lilliefors test, being: A) mass of one hundred seeds (100 SW, where SW stands for seed weight); B) protein content (PC); C) oil content (OIL); and D) fiber (FIB). Black line represents the observed frequency curve; and the red line represents the expected frequency curve.
Considering the particular interest of this study in using genotypes from collection 3, the genotypes were represented by segregating lines in F4 and F7 conducted by the breeding program UNIJUÍ. A good characterization of this collection and a comparison of relative performance in relation to the three other collections with genotypes used in this experiment are essential (Table 4).
Descriptive analysis of the individual potential of ten quantitative traits measured in soybean genotypes in four different collections.
PC presented a general average of 33.40 % (Table 2), higher in the collection of interest (collection 3) compared to the general average of the four collections, 34.29 %, ranging between 31.05 and 36.41 %. This value differed from the other collections according to Tukey's test. The same collection performed close to the general average of the collections in terms of OIL (general average of 19.07 %, according to Table 2) with an average of 19 %, ranged between 17.16 and 20.12 %. The highest value was found in collection 2, reaching an estimated 19.44 %.
Collection 3 had the lowest FIB content (%) of the four collections evaluated. Furthermore, ASH, PA and EA were at the highest levels compared to the other collections evaluated. For ASH, the average value found was 5.16. Oleic, linoleic, and linolenic fatty acids also had relatively low average concentrations in collection 3, with values of 23.01, 59.90 and 1.89 %, respectively.
Information about the variability within each collection is presented in Table 5. It addresses the general screening of elite lines from the breeding program. These results identify potential parents, sources of alleles, and candidates for release. Comparatively, collection 3 did not show higher values for any measured characteristic. Additionally, the essential results of the relationships between the soybean characteristics studied are presented in Table 6. Several approaches to interpreting correlation coefficients exist, including a suggested interpretation based on magnitude ranges. According to this interpretation, a correlation between 0.00 and 0.10 is negligible; between 0.10 and 0.39 is weak; between 0.40 and 0.69 is moderate; between 0.70 and 0.89 is strong; and between 0.90 and 1.00 is very strong (Schober et al., 2018). The first analysis highlighted the associations between the 100 SW characteristic, which is a primary component of grain production, with the other representatives of grain quality. Thus, it appears that 100 SW presented a positive correlation with PC with an estimate of 0.18, and a negative correlation with FIB, −0.31.
Descriptive analysis of the variability manifested in ten quantitative traits measured in soybean genotypes from different collections.
Estimates of Pearson's correlation coefficients among ten quantitative characteristics of soybean. The indices in bold are significant at 1 % probability by the t-test.
This study estimated a high and negative correlation between PC and OIL, with an estimate of −0.70. The PC also showed a negative correlation of −0.28 with FIB, and a positive correlation with ASH and OA, values of 0.39 and 0.24, respectively. FIB correlated negatively with ASH and OA, −0.39 and −0.28, and positively with LA 0.19.
LA correlated negatively with LNA at a value of −0.58. A positive correlation index could also be observed between PA and LNA, with an estimate of 0.43. High negative correlation was also observed between PA and OA with an estimate of −0.68. Negative correlation between LA and ASH, OA and LNA was also observed, with values of −0.51, −0.52 and −0.58 respectively. Correlations were also found between PA and SA and between SA and OA, with values of 0.20 and 0.12 respectively.
In addition to the general correlation network, individual correlation networks (Figure 2) for each collection were analyzed to verify whether the correlations found separately differed. An interesting fact is that collection 4 presented the highest number of high-intensity positive or negative interactions, while collection 3 presented the lowest.

Networks of correlations representing each collection individually. Green and red lines represent positive and negative correlations, respectively. A) Campos Borges collection; B) control cultivars collection; C) segregating collection; and D) base population collection. 100 SW = mass of one hundred seeds, where SW stands for seed weight; PC = protein content; OIL = oil content; FIB = Fiber; ASH = ash content; PA = palmitic acid; SA = stearic acid; OA = oleic acid; LA = linoleic acid; LNA = linolenic acid.
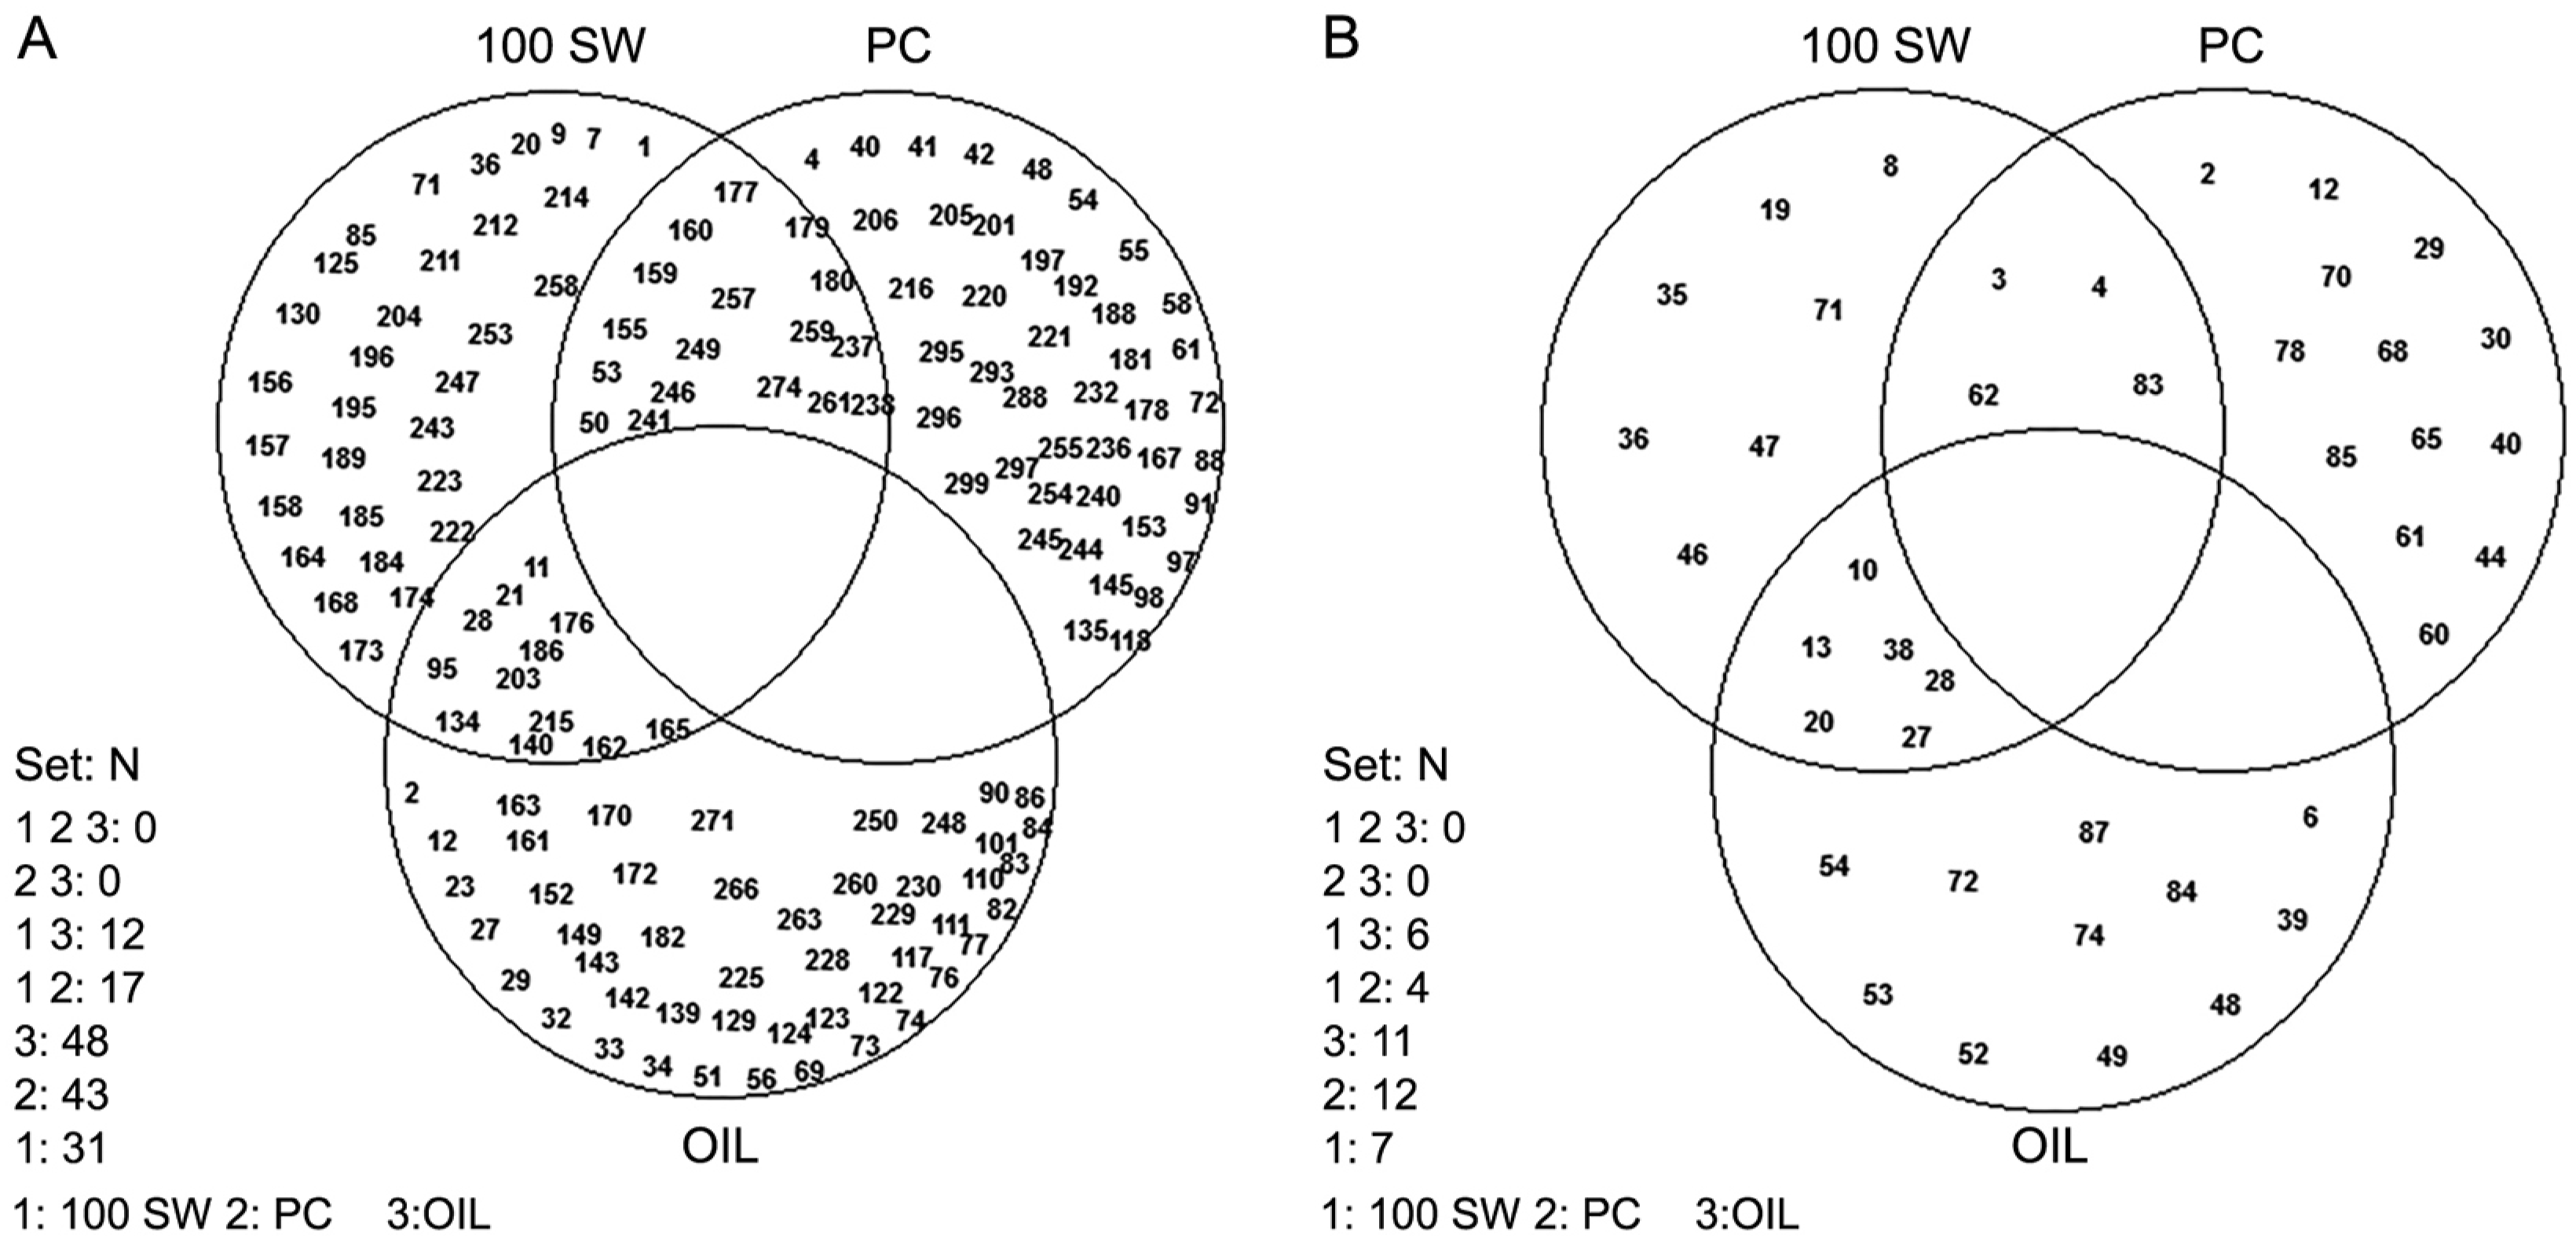
The graphical analysis presented by the Venn Diagram (Figure 3) demonstrates the best genotypes selected for three characteristics of interest, namely 100 SW, PC, and OIL. No genotype was found to be highly efficient for the three traits and efficient in PC and oil.

Venn diagram depicting the best genotypes for mass of one hundred seeds (100 SW, where SW stands for seed weight), number of genotypes (N), protein content (PC) and oil content (OIL). A) for the four collections studied (20 % from top subjects); B) for collection 3 individually (20 % of senior individuals).
Discussion
Breeding programs emphasizing increasing the concentration of protein or oil in the grain must also prioritize increasing productivity, i.e., how many kilos of protein or liters of oil are produced per hectare. A productivity of 1,000 kg ha−1 of soybeans with 30 % protein will result in 300 kg of protein ha−1. The same protein level can be achieved with genotypes containing approximately 40 % protein, at a productivity of 750 kg ha−1. Therefore, a joint assessment of these attributes is necessary.
The work collection (Table 2) presented an average 100 SW, a relatively low productive characteristic. This fact reveals that the breeder's efforts can increase this average value to other levels to adjust it to the market average.
Our PC values were lower than those found in other studies. In the literature, studies present estimates with PC ranging from 39.15 to 39.70 %, with an average of 39.59 % in three different experiments and variation between the experiments (Kurasch et al., 2017); PC with an average value of 41.60 % in a wild population (Zhou et al., 2019), and another study with a general average PC of 39.1 % (Del Conte, 2020). Thus, in the present work, it appears that PC values are below expectations for the technological quality of soybeans, which is referenced as being 38 % (Lorini et al., 2020), with the aggravating factor where the maximum value manifested by a number of genotypes was 36.41. Therefore, the breeding program must invest efforts in establishing combinations between parents with favorable allelic forms so that transgressives that better meet industrial requirements can be found when segregating populations.
The average value for OIL was within the expected range, which was close to 19 % (Lorini et al., 2020). Studies such as Kurasch et al. (2017) corroborate this result, fiding the OIL varying between 18.55 and 18.73 % and an average of 18.075 % in three different experimental tests and a series between tests. Zhou et al. (2019) found the OIL to be an average of 15.26 %, and Del Conte et al. (2020) found an average of 19.1 %.
Soy protein FIB, or soy FIB, is a textile FIB extracted from the seed residue after oil extraction. These FIBs have beneficial effects on health, as they are responsible for reducing cholesterol and blood glucose levels and influencing intestinal regulation. Our results are close to the values found by Fachi et al. (2020), 5.57 %, and of the values provided by Valadares Filho et al. (2023) which is 5.30 % for the average FIB content for soybeans. Additionally, a study found the ASH to be between 5.30 and 5.59 % (Ciabotti et al., 2019). Lorini et al. (2020) argues the deviation from the estimate by 5 %. This justifies the result we found.
The composition of fatty acids in soybean seeds may be associated with their domestication process (Abdelghany et al., 2020). Furthermore, the variation of different fatty acids in soybean seeds is mainly related to the longer period of effective deposition during the seed filling (Tamagno et al., 2020). During this period, the plant presents a greater supply of nitrogen, prolonging leaf senescence and maintaining the supply of carbon to the reproductive sink regions. The differences in fatty acid concentrations can also be explained by different biochemical pathways to achieve the fatty acid profile or by the individual influence that each biochemical pathway suffers from the environment (Tamagno et al., 2020).
The fatty acid content (%) remained within the expected range. Previous studies found the fatty acid profile of PA, SA, OA, LA, and LNA, on average, for 11 cultivars and lines, with estimates ranging from 10.37 and 12.30 %, 3.58 and 4.13 %, 17.89 and 31.87 %, 47.36 and 58.31 % and LNA varying between 6.17 and 7.80 %, respectively (Ciabotti et al., 2019). In our study, the highest coefficient of variation was for LNA, a result consistent with those reported by previous studies, such as Abdelghany et al. (2020) with a value of 14.6 % and Tamagno et al. (2020) with 6,562 %.
In addition to the statistics summarized in Table 3, the distribution of values for each characteristic (Figure 1) provides other important information. The characteristic distribution pattern of normality and symmetry of the data is informative since it is typical of polygenic characteristics, which corresponds to the action of controlling genes, and is primarily of an additive nature. On the other hand, the asymmetric pattern may indicate the action of smaller numbers of genes and, in the main, the strong influence of effects attributed to dominance in controlling characteristics.
Statistically, when the kurtosis value is greater than 3, as manifested by a genotype, the data distribution becomes higher, with a funneled pattern and values concentrated close to the average value. It is said that this probability function is leptokurtic, or that the distribution has heavier tails than the standard of normality. In the context of genetic improvement, there is restricted variability and greater difficulty in finding in populations segregating the advancement of hybrid combinations of tested genotypes, transgressive that can overcome the limits established by the parents.
The PC and OIL characteristics present possible predominantly additive polygenic control, since they presented a curve that approaches the normal distribution (Figure 1B and C). A small degree of asymmetry was detected for the PC characteristic, indicating the presence of some gene of more significant effect, with manifestation of a certain degree of dominance.
The information presented can be useful in prediction exercises reflecting the difficulty of the activity in improvement programs. Thus, as an illustration, considering the existence of the normality standard and the mean and variance values equal to 33.40 and 2.02, respectively, it was quantified that the probability of obtaining values in the current population within a more ambitious limit, established between 36 and 40 %, will be 3.37 %. A higher margin of success should be pursued by implementing a base population enriched with favorable alleles so that these limits are more easily achieved by selection.
In another approach added to the study, the particular interest of using genotypes from collection 3, represented by segregating lines in F4 and F7 conducted by the breeding program UNIJUÍ, was considered. A good characterization of this collection and comparing relative performance to three other collections with genotypes used in this experiment are essential.
Soy is an essential caloric-protein food to reduce weight. It is also a good quality protein alternative for vegetarians and has a lipid fraction rich in polyunsaturated fatty acids and carbohydrates with prebiotic activity. There is interest in soybean cultivars having an average PC of between 36 and 40 %. However, there are reports of reaching contents above 45 % in the case of special cultivars used in genetic crossings as a source of high PC. Collection three had a higher PC average than the other collections, but still slightly lower than desired (Table 4). Other studies have found a maximum PC of 39.15 % in three different assays with a variation between assays (Kurasch et al., 2017); an average PC of 41.60 % in a wild population (Zhou et al., 2019); and also an average PC of 39.1 % (Del Conte et al., 2020). Increasing this PC to 38 % is desirable as has been highlighted (Lorini et al., 2020).
The oil is used as a raw material by industry to produce refined oil, hydrogenated fats, margarine, and mayonnaise, among other products. It has also been used in industrial products such as paints, lubricants, solvents, plastics, and resins (Erhan, 2005). More recently, it has been the main raw material for biodiesel production. Collection 3 has a value close to the other collections.
The FIB content of the collection of interest was the lowest among all collections. A highlight is that it presented a value close to that found by Fachi et al. (2020), 5.57 %, and the values provided by Valadares Filho et al. (2023), which is 5.30 % for the average FIB content for soybeans. The ASH was within what was expected from the proximate composition of soybean seeds, which varies by 5 % (Lorini et al., 2020). Furthermore, the fatty acid content (%) also remained within the expected range.
The low variability manifested for the PC and OIL characteristics is a warning to include contributions from parents. Since they can be a source of alleles favorable to these characteristics, they complement those already existing in the collection of interest. Quantifying the potential and variability of genotypes in recurrent collections is essential to guiding programs in search of new genotypes for gene complementation purposes.
An additional approach in this study refers to the correlation between the quality and productivity characteristics studied. The positive correlation between 100 SW and PC indicates that in the indirect selection process, when selecting the 100 SW trait, PC will also be selected, and the FIB content trait will be reduced. A work found a strong and negative correlation of −0.99 between FIB and 100 SW and a negative correlation between 100 SW and PC of −0.24 (He et al., 2021). These estimates differ from those found in this study.
Association information between quality characteristics is also valuable. Several authors have corroborated our correlation results between PC and OIL, finding similar values for this correlation estimate, which is well known around the world (Kurasch et al., 2017; Jiang et al., 2018; Del Conte et al., 2020; Sobko et al., 2020). Although the negative correlation in question has been known for many decades, the specific biochemical mechanisms are still not correctly understood (Kurasch et al., 2017). Certain explanations are widely accepted in scientific circles to account for this phenomenon. First, negative correlation estimates may be related to differences in fatty acid biosynthetic pathways (Patel et al., 2004). Another is that an existing competition for carbon can partly explain this negative correlation since oil and protein biosynthetic pathways share some biochemical steps of carbon metabolism (Sugimoto et al., 1989). Furthermore, studies suggest that both characteristics are controlled by the same gene or group of genes (Diers et al., 1992), which was later proven by Lestari et al. (2013), who mapped these genes.
Our work found some discrepant correlation with authors who worked with nearby collections. An example is the negative correlation between FIB and PC. A research study found correlation of 0.38 between PC and FIB (Carvalho et al., 2021), the opposite value to that found in our study. Others found positive correlation of 0.251 between FIB and ASH (He et al., 2021), while Santana et al. (2023) found negative and weak correlation between these characteristics. Finally, other scientists have found 0.38 (Fachi et al., 2020), a value discrepant from that found in this study. The hypothesis is that when using different collections, the general correlation between them may differ due to variability.
The positive correlation found between PA and LA indicates that as PA concentrations increase, LA concentrations follow the same direction. Positive correlation was observed between PA and LA, with values of 0.2 and 0.336. Additionally, high negative correlation was observed between PA and OA, with values of −0.16 and −0.388. The authors who reported these correlations are Abdelghany et al. (2020) and Zhou et al. (2019). This negative association can be explained by the direct association of fatty acids with their biosynthesis in lipid pathways (Woyann et al., 2019).
We found negative correlation of LA with ASH, OA and LNA. Such negative correlations of OA and LA were also found ranging from −0.47 to −0.54 in three different populations in studies such as Cardinal and Burton (2007), and even more significant in the study by Abdelghany et al. (2020), with a value of −0.85, and in Zhou et al. (2019) −0.830. Between LA and LNA Zhou et al. (2019) found 0.297. Between OA and LNA Zhou et al. (2019) found −0.750. The strong negative correlation found between OA, LA and LNA can be explained in part by the location of their enzymes (FAD2 and FAD3) within the endoplasmic reticulum, enzymes responsible for their conversions (Zhou et al., 2019). The correlations found between PA and SA and between SA and OA can be explained by the presence of possible enzymes and their competition for substrates within the fatty acid biosynthetic pathway (Zhou et al., 2019).
The correlation networks referring to the collections individually (Figure 2) assessed whether they differ from each other. In a first individual visualization, the greater number of correlations of greater intensity found within collection 4, and a smaller number within collection 3, were already expected. This is because the base population, collection 4, of the breeding program (Figure 2D) was not subjected to selection cycles, thus maintaining many correlations between its characteristics. The opposite could also be observed, as collection 3 (Figure 2C), these being the advanced lines in F4 and F7, have already been subjected to selection cycles, thereby reducing the evident correlations between the characteristics, since over the years’ cycles, certain characteristics are selected over others.
Based on information from the four collections, the 100 SW characteristic is positioned distantly, demonstrating its low association with the other characteristics studied, which reflect the industrial quality of soybeans (Figure 2). An exception is manifested in collection 2 (Figure 2B), involving the 100 SW and the LA component with a positive and significant association.
It is also worth mentioning that the negative correlation between protein and oil in soybean seeds is well known in the literature. The negative association between these two characteristics is evident in all correlation networks. In collection 2 this association was of a greater magnitude, as evidenced by the thickness of the connection between these variables in the green line used in the network connection (Figure 2B). However, as shown in Figure 2, this negative association can manifest itself with different intensities in different collections. The blocks of correlations involving the characteristics OA, LA, LNA, whose manifestation is consistently positive, stand out. This block includes the PA characteristic with a negative association consistent with LNA.
The diagrams presented, involving all four collections or particularizing the three collections that involve segregants, agree that is difficult to highlighting genotypes with the best performance when considering the 100 SW, PC and OIL characteristics simultaneously. In these diagrams, the intersection of these three sets results in an empty set (Figure 3A and B). The negative correlation between PC and OIL characters (equal to −0.70 in all collections and −0.73 in collection 3) provided an empty set at the intersection between sets of the 20 % best performers for these characteristics of interest.
Considering the focus, in terms of concentration of efforts of the breeding program, in collection 3, it is recommended to invest in the potential of genotypes 3, 4, 62 and 83 with better performance for the 100 SW and PC characteristics. Other genotypes with outstanding performance are also available in the other collections evaluated and can be incorporated into the genetic improvement program.
If the interest is the increase in the OIL associated with higher 100 SW, attention should be paid to genotypes 10, 13, 20, 27, 28 and 38 of collection 3, which performed well according to both traits.
The genotypes evaluated showed outstanding potential in terms of PC, reaching an average value of 33.40 % with a maximum of 36.41 %. Of the four assessed collections, the one involving genotypes from segregating populations showed 34.29 % PC, with low variability requiring additional efforts to include more favorable allelic forms using genotypes from other collections.
The association between PC and OIL was ratified as negative. The correlation found was −0.70, considering all collections.
Strong performing genotypes were identified that meet characteristics of interest such as 100 SW and PC or 100 SW and OIL. However, the intersection of genotypes with the best simultaneous performances for these three traits is empty, mainly determined by the negative association between OIL and PC.
Acknowledgments
To the Universidade Regional do Noroeste do Estado do Rio Grande do Sul (UNIJUÍ), for making the database available. Fundação de Amparo à Pesquisa do Estado de Minas Gerais (FAPEMIG), Coordenação de Aperfeiçoamento de Pessoal de Nível Superior, Brazil (CAPES), and the Conselho Nacional de Desenvolvimento Científico e Tecnológico (CNPq) for the financial support.
Data availability statement
The authors declare that they cannot or choose not to specify which data were used in the article.
References
-
Abdelghany AM, Zhang S, Azam M, Shaibu AS, Feng Y, Li Y, et al. 2020. Profiling of seed fatty acid composition in 1025 Chinese soybean accessions from diverse ecoregions. Crop Journal 8: 635-644. http://dx.doi.org/10.1016/j.cj.2019.11.002
» http://dx.doi.org/10.1016/j.cj.2019.11.002 -
Berhow MA, Singh M, Bowman MJ, Price NPJ, Vaughn SF, Liu SX. 2020. Quantitative NIR determination of isoflavone and saponin content of ground soybeans. Food Chemistry 317: 126373. http://dx.doi.org/10.1016/j.foodchem.2020.126373
» http://dx.doi.org/10.1016/j.foodchem.2020.126373 -
Cardinal AJ, Burton JW. 2007. Correlations between palmitate content and agronomic traits in soybean populations segregating for the fap1 fap nc, and fan alleles. Crop Science 47: 1804-1812. http://dx.doi.org/10.2135/cropsci2006.09.0577
» http://dx.doi.org/10.2135/cropsci2006.09.0577 -
Carvalho IR, Silva JAG, Loro MV, Sarturi MVDR, Hutra DJ, Lautenchleger F. 2021. Soybean canonical nutraceutical interrelations and their reflections on breeding. Agropecuária Catarinense 34: 67-75. https://doi.org/10.52945/rac.v34i3.1155
» https://doi.org/10.52945/rac.v34i3.1155 -
Carvalho IR, Silva JAG, Moura NB, Ferreira LL, Lautenchleger F, Souza VQ. 2023. Methods for estimation of genetic parameters in soybeans: an alternative to adjust residual variability. Acta Scientiarum. Agronomy 45: e56156. https://doi.org/10.4025/actasciagron.v45i1.56156
» https://doi.org/10.4025/actasciagron.v45i1.56156 -
Ciabotti S, Juhász ACP, Mandarino JMG, Costa LL, Corrêa AD, Simão AA, et al. 2019. Chemical composition and lipoxygenase activity of soybean (Glycine max L. Merrill.) genotypes, specific for human consumption, with different tegument colours. Brazilian Journal of Food Technology 22: e2018003. https://doi.org/10.1590/1981-6723.00318
» https://doi.org/10.1590/1981-6723.00318 -
Del Conte MV, Carneiro PCS, Resende MDV, Silva FL, Peternelli LA. 2020. Overcoming collinearity in path analysis of soybean [Glycine max (L.) Merr.] grain oil content. PLOS ONE 15: e0233290. https://doi.org/10.1371/journal.pone.0233290
» https://doi.org/10.1371/journal.pone.0233290 - Cruz CD. 2016. Genes Software: extended and integrated with the R, Matlab and Selegen. Acta Scientiarum. Agronomy 38: 547-552.
-
Diers BW, Keim P, Fehr WR, Shoemaker RC. 1992. RFLP analysis of soybean seed protein and oil content. Theoretical and Applied Genetics 83: 608-612. https://doi.org/10.1007/BF00226905
» https://doi.org/10.1007/BF00226905 -
Epskamp S, Cramer AOJ, Waldorp LJ, Schimittmann VD, Borsboom D. 2012. qgraph: network visualizations of relationships in psychometric data. Journal of Statistical Software 48: 1-18. https://doi.org/10.18637/jss.v048.i04
» https://doi.org/10.18637/jss.v048.i04 -
Erhan SZ. 2005. Industrial Uses of Vegetable Oils. 1ed. AOCS Publishing, New York, USA. https://doi.org/10.4324/9781003040248
» https://doi.org/10.4324/9781003040248 -
Fachi SM, Carvalho IR, Silva JAG, Ferreira CD, Barbosa MH, Magano DA, et al. 2020. Multivariate selection of nutritional aspects of soybean in an F5 segregating family. Genetics and Molecular Research 19: gmr18423. http://dx.doi.org/10.4238/gmr18423
» http://dx.doi.org/10.4238/gmr18423 -
Finoto EL, Soares MBB, Correia AN, Albuquerque JAA, Silva ES. 2021. Sowing times in adaptation, stability, productivity, and oil and protein contents of soybean genotypes. Revista Caatinga 34: 799-812. https://doi.org/10.1590/1983-21252021v34n407rc
» https://doi.org/10.1590/1983-21252021v34n407rc -
He Y, Shim YY, Shen J, Kim JH, Cho JY, Hong WS, et al. 2021. Aquafaba from Korean soybean II: physicochemical properties and composition characterized by NMR analysis. Foods 10: 2589. https://doi.org/10.3390/foods10112589
» https://doi.org/10.3390/foods10112589 - Herrera GC, Poletine JP, Brondani ST, Barelli MAA, Silva VP. 2020. Adaptability and stability of soybean lineages in Brazil´s southern region through mixed modeling. Journal of Agronomic Sciences 9: 185-202 (in Portuguese, with abstract in English).
-
Jiang G, Chen P, Zhang J, Florez-Palacios L, Zeng A, Wang X, et al. 2018. Genetic analysis of sugar composition and its relationship with protein, oil, and FIB in soybean. Crop Science 58: 2413-2421. https://doi.org/10.2135/cropsci2018.03.0173
» https://doi.org/10.2135/cropsci2018.03.0173 -
Kurasch AK, Hahn V, Leiser WL, Starck N, Würschum T. 2017. Phenotypic analysis of major agronomic traits in 1008 RILs from a diallel of early European soybean varieties. Crop Science 57: 726-738. https://doi.org/10.2135/cropsci2016.05.0318
» https://doi.org/10.2135/cropsci2016.05.0318 -
Lestari P, Van K, Lee J, Kang YJ, Lee S. 2013. Gene divergence of homeologous regions associated with a major seed protein content QTL in soybean. Frontiers in Plant Science 4: 176. https://doi.org/10.3389/fpls.2013.00176
» https://doi.org/10.3389/fpls.2013.00176 - Lorini I, Silveira JM, Oliveira MA, Mandarino JMG, Henning AA, Krzyzanowski FC, et al. 2020. Harvest and post-harvest of grains. p. 317-345. In: Seixas CDS, Neumaier N, Balbinot Junior AA, Krzyzanowski FC, Leite RMVBC. eds. Soybean production technologies. Embrapa Soja, Londrina, PR, Brazil (in Portuguese, with abstract in English).
-
Patel M, Jung S, Moore K, Powell G, Ainswoth C, Abbott A. 2004. High-oleate peanut mutants result from a MITE insertion into the FAD2 gene. Theoretical and Applied Genetics 108: 1492-1502. https://doi.org/10.1007/s00122-004-1590-3
» https://doi.org/10.1007/s00122-004-1590-3 -
Qin P, Wang T, Luo Y. 2022. A review on plant-based proteins from soybean: health benefits and soy product development. Journal of Agriculture and Food Research 7: 100265. https://doi.org/10.1016/j.jafr.2021.100265
» https://doi.org/10.1016/j.jafr.2021.100265 -
Santana DC, Teodoro LPR, Baio FHR, Santos RG, Coradi PC, Biduski B, et al. 2023. Classification of soybean genotypes for industrial traits using UAV multispectral imagery and machine learning. Remote Sensing Applications - Society and Environment 29: 100919. https://doi.org/10.1016/j.rsase.2023.100919
» https://doi.org/10.1016/j.rsase.2023.100919 -
Schober P, Boer C, Schwarte LA. 2018. Correlation coefficients: appropriate use and interpretation. Anesthesia & Analgesia 126: 1763-1768. http://dx.doi.org/10.1213/ane.0000000000002864
» http://dx.doi.org/10.1213/ane.0000000000002864 -
Sobko O, Stahl A, Hahn V, Zikeli S, Claupein W, Gruber S. 2020. Environmental effects on soybean (Glycine max (L.) Merr) production in central and south Germany. Agronomy 10: 1847. https://doi.org/10.3390/agronomy10121847
» https://doi.org/10.3390/agronomy10121847 -
Sugimoto T, Tanaka K, Monma M, Kawamura Y, Saio K. 1989. Phosphoenolpyruvate carboxylase level in soybean seed highly correlates to its contents of protein and lipid. Agricultural and Biological Chemistry 53: 885-887. https://doi.org/10.1080/00021369.1989.10869369
» https://doi.org/10.1080/00021369.1989.10869369 -
Tamagno S, Aznar-Moreno JA, Durrett TP, Prasad PVV, Rotundo JL, Ciampitti IA. 2020. Dynamics of oil and fatty acid accumulation during seed development in historical soybean varieties. Field Crops Research 248: 107719. https://doi.org/10.1016/j.fcr.2020.107719
» https://doi.org/10.1016/j.fcr.2020.107719 -
Todeschini MH, Milioli AS, Rosa AC, Dallacorte LV, Panho MC, Marchese JA, et al. 2019. Soybean genetic progress in South Brazil: physiological, phenological and agronomic traits. Euphytica 215: 124. https://doi.org/10.1007/s10681-019-2439-9
» https://doi.org/10.1007/s10681-019-2439-9 -
Valadares Filho SC, Machado PAS, Furtado T, Chizzotti ML, Amaral HF. 2023. CQBAL 4.0. Brazilian tables of food composition for ruminants 2018 (in Portuguese, with abstract in English). Available at: www.cqbal.com.br [Accessed Apr 10, 2024]
» www.cqbal.com.br -
Woyann LG, Meira D, Zdziarski AD, Matei G, Milioli AS, Rosa AC, et al. 2019. Multiple-trait selection of soybean for biodiesel production in Brazil. Industrial Crops and Products 140: 111721. https://doi.org/10.1016/j.indcrop.2019.111721
» https://doi.org/10.1016/j.indcrop.2019.111721 -
Zhou Z, Lakhssassi N, Cullen MA, El Baz A, Vuong TD, Nguyen HT, et al. 2019. Assessment of phenotypic variations and correlation among seed composition traits in mutagenized soybean populations. Genes 10: 975. https://doi.org/10.3390/genes10120975
» https://doi.org/10.3390/genes10120975
Edited by
-
Edited by:
Leonardo Oliveira Medici