 The addition of molybdenum to urea changes its characteristics and can react with N-(n-butyl) thiophosphoric triamide
ABSTRACT
The development or blending of new products represents a common practice of improvement for the efficiency of existing commercialized fertilizers. The physicochemical characteristics of new formulations differ from those of raw materials. These characteristics directly influence the quality of the fertilizer, as they can alter the storage and application requirements. It is hypothesized that molybdenum (Mo) can be added to urea without affecting urea characteristics and N-(n-butyl) thiophosphoric triamide (NBPT) efficacy. The objective of this study was to characterize the addition of Mo sources and rates to urea treated or not with NBPT at 530 mg per kg of urea. A total of 30 fertilizers were formulated by combining three factors: three types of urea (untreated urea, NBPT-coated urea, and NBPT-incorporated urea), two sources of Mo (ammonium molybdate and Mo trioxide), and five rates of Mo (0, 1.5, 3.0, 6.0 and 12.0 g kg–1 N). Unless the degradation rate of NBPT was not measured, the granules were evaluated in terms of nutrient content salinity, hardness, hygroscopicity, and angle of repose. The physical quality of the fertilizer was affected at Mo rates exceeding 6 g kg–1 N, particularly with soluble Mo sources, resulting in the formation granules with lower hardness and higher hygroscopicity. The addition of ammonium molybdate (Am) was observed to exert a lesser impact on the characteristics of the granules, particularly at Mo rates below 6 g kg–1 N. The interaction between Mo and NBPT remains unclear, and further research is necessary to elucidate the underlying mechanism and the stability of the inhibitor.
Keywords
nitrogen; nanoparticles; hygroscopicity; salinity; fertilizers
Introduction
The quantitative yield of agricultural products has increased significantly over the past 80 years, with nitrogen fertilizers representing a significant contributing factor. The global trade of nitrogen (N) is 118,763 Tg (FAO, 2021), and there are numerous sources from which this nutrient can be supplied to plants. The variability of sources and the need to increase the efficiency of fertilizers, which currently stands at less than 50 %, has required the industry to improve them (Trenkel, 2010). This has resulted in various formulations and characteristics (Guelfi, 2017).
In Brazil, urea is the most utilized and researched fertilizer (IFA, 2018). It is the most cost-effective source of N but exhibits the most substantial losses, primarily through volatilization, reaching 32 % (Trenkel, 2010; Silva et al., 2017). The enzyme urease is present in large quantities in plant waste. This enzyme hydrolyzes urea, forming ammonium, which is then converted into ammonia and potentially volatilizes to the atmosphere. Consequently, the search for new products has been driven forward, including urea-bearing chemical inhibitors (Mira et al., 2017), polymer coating (Xu et al., 2013), and the addition of micronutrients (Cancellier et al., 2016; Rech et al., 2017). The use of N-(n-butyl) thiophosphoric triamide (NBPT), a chemical that inhibits urease (Pan et al., 2016), has been shown to result in significantly reduced N losses from urea, with reductions of up to 50 % reported (Silva et al., 2017).
It has been reported that molybdenum (Mo), a nutrient that plays a role as a cofactor of nitrate reductase, has the potential to inhibit the activity of the urease enzyme (Tabatabai, 1977). Nevertheless, the precise mechanism by which this inhibition occurs remains unclear. Consequently, the addition of Mo to urea fertilizers may exert a dual effect on plants: firstly, reducing the loss of N and enhancing its availability for absorption, and secondly, increasing the absorption rate by modulating N metabolism. However, it is important to note that product mixtures can alter the chemical and physical properties of fertilizers, often leading to a reduction of the critical moisture content or granule hardness.
The physical properties of fertilizers are often overlooked in academic research, with greater focus on how plants respond to newly formulated mixtures. An understanding of the physical properties of handling, transport, and application can facilitate the interpretation of results related to fertilizer use efficiency by plants. The hardness of a fertilizer is related to its resistance to abrasion and the quality of the coating formed around it. Conversely, wet fertilizers can melt even at low humidity, forming blocks that cannot be distributed.
These gaps prompted an investigation into the physicochemical characteristics of a new series of urea + NBPT + Mo fertilizers. Therefore, we hypothesize that Mo can be added to urea at a maximum rate of 6 g kg–1 N, regardless of the source of urea employed. The rate was determined in accordance with the most recent fertilizer guideline for sugarcane. This study aims to characterize laboratory-produced urea treated with NBPT and Mo sources, thereby providing a foundation for future studies on formulation and its impact on fertilizer efficiency.
Materials and Methods
Experimental site and design
The study used a 3 × 2 × 5 factorial design, wholly randomized with three repetitions. The factors under investigation were as follows: (i) three types of urea, namely common urea, urea with NBPT coating, and urea with NBPT incorporation (granulated) into the granules; and (ii) two sources of Mo, specifically ammonium molybdate (soluble - solubility product constant (kps): 430 g L–1, 54.4 % of Mo) and nanoparticulate molybdenum trioxide (low solubility–kps: 1 g L–1, 66.7 % of Mo); and (iii) five rates of Mo: 0, 1.5, 3.0, 6.0, and 12.0 g kg–1 N (Table 1). All sources used were pure analysis reagents.
Molybdenum (Mo) was incorporated into the urea granules using the same process employed for NBPT. In the first two types of urea, namely untreated urea and NBPT-coated urea, Mo was coated, while in the third type, Mo was incorporated into the granule. In fertilizers containing Mo and NBPT, the coating was initially applied using NBPT, followed by adding adhesive and Mo in that order. However, two strategies were employed for the incorporation of Mo. Ammonium molybdate (Am) was added to a urea solution and subsequently dried and granulated, while Mo trioxide (Mt) was added to the powder. The trioxide was homogenized with urea by progressive dilution of a constant mass to ensure uniformity.
The molybdenum was coated onto the granule using the adherent Pearl Forti product in a proportion of 13 mL kg–1 of N. When the urea was also treated with NBPT, it was applied before the Mo application. The NBPT used was provided by KochTM Agronomic Services. The rate used for the coating of urea was 530 mg of NBPT per kg of urea, following commercial products.
Measurements
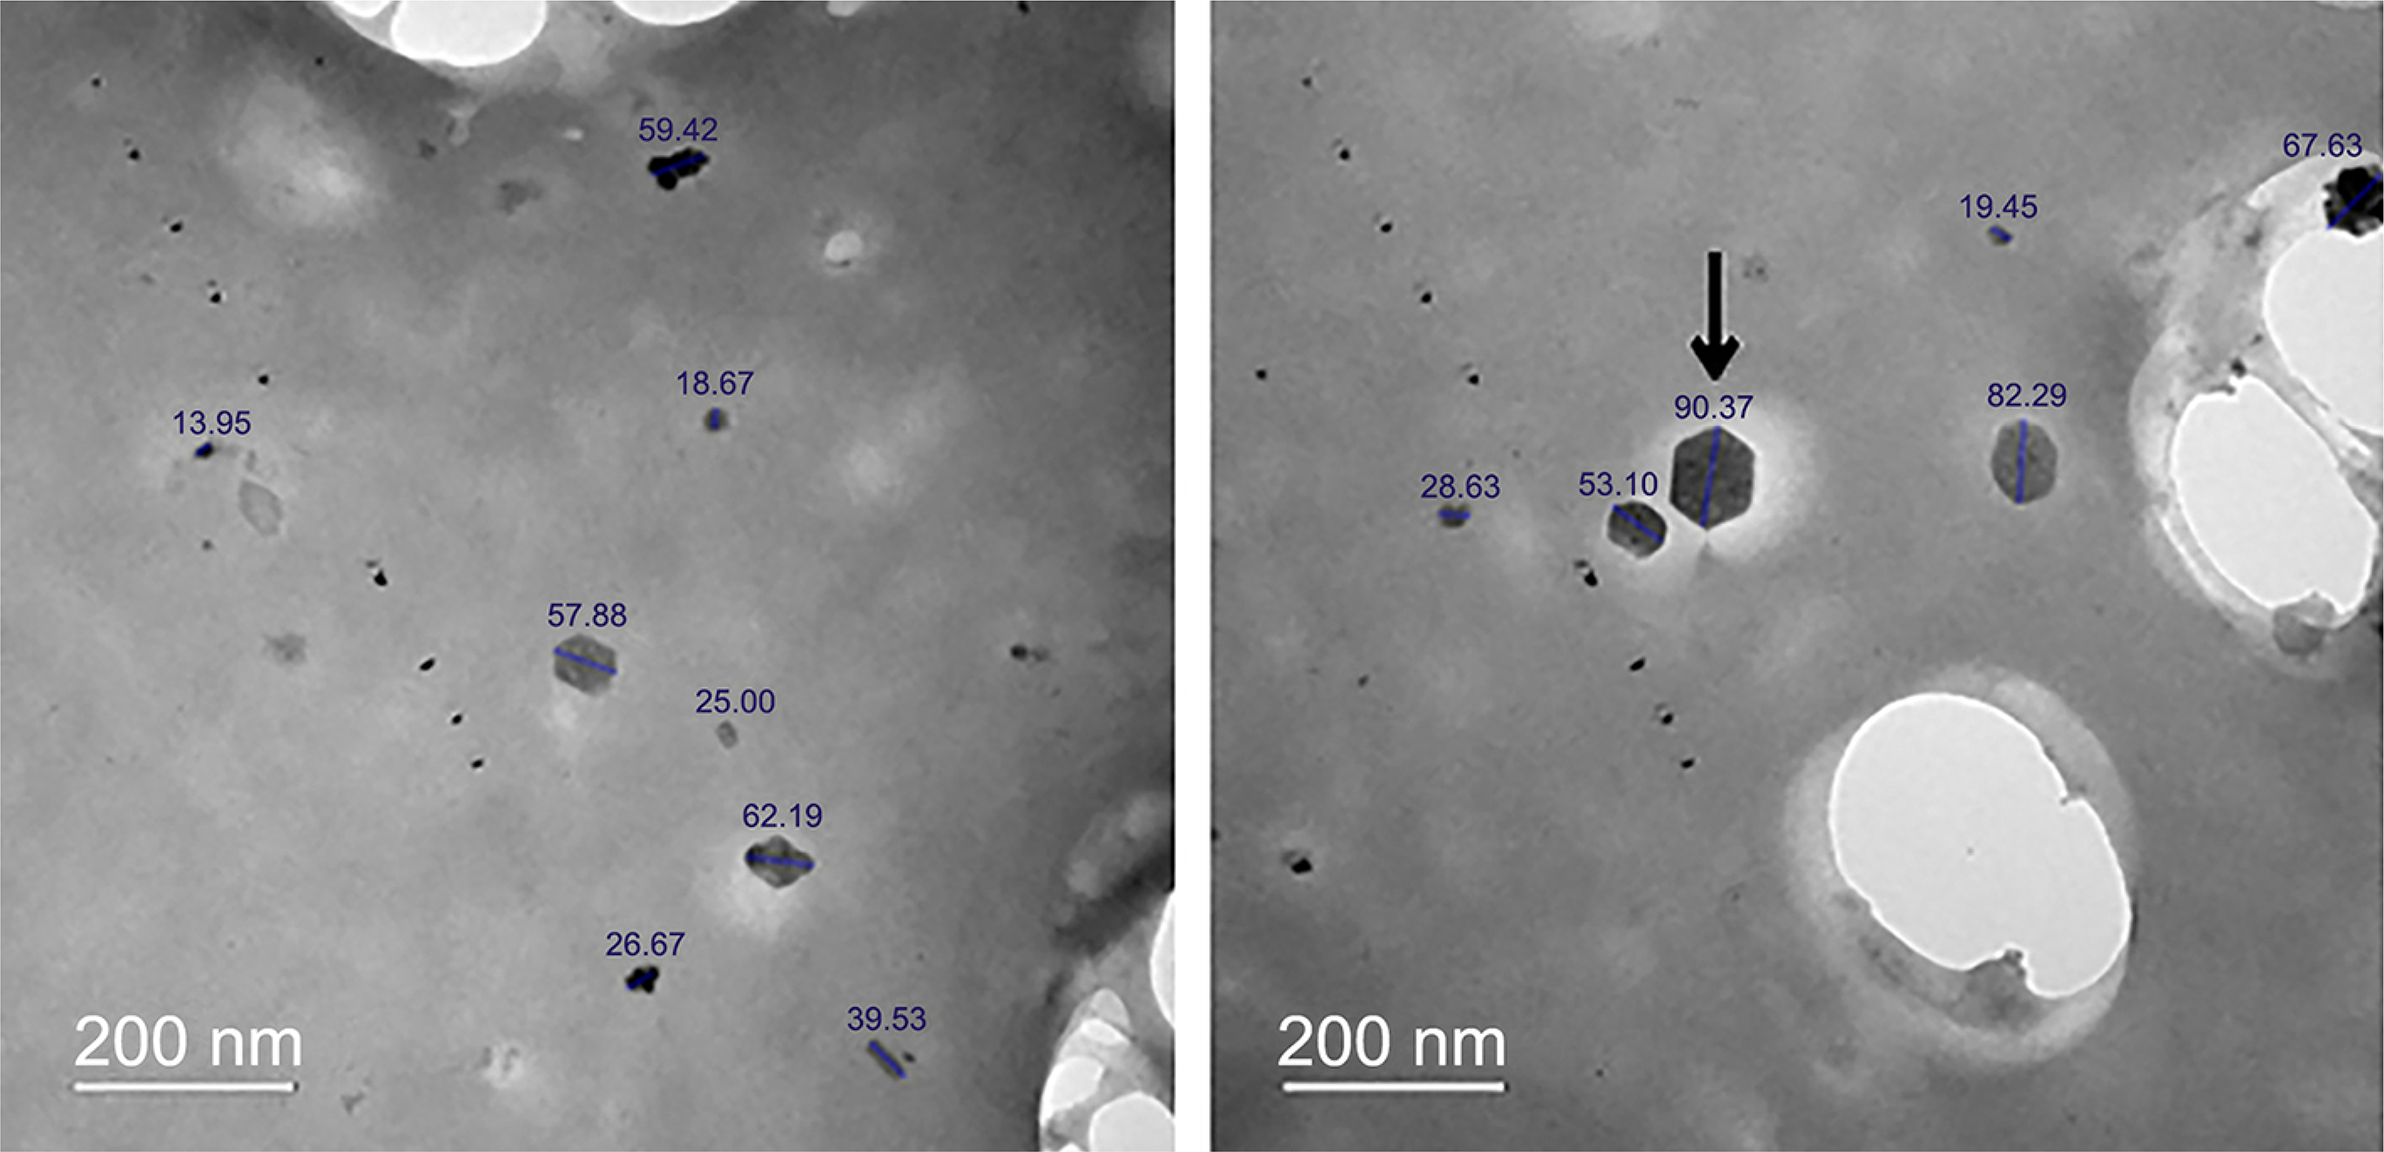
The initial step was to ascertain the dimensions of the nanoparticles, which were measured through the dynamic light scattering technique, as outlined by Hackley and Clogston (2011). For the measurements, an aliquot of 1 mL of Mt suspension was transferred to a seven-polystyrene cuvette and directly loaded into the equipment. The granules exhibited an average particle size of 64.10 nm, thus meeting the criteria for classification as nanofertilizers (Figure 1).

– Scanning electron microscope images of molybdenum trioxide for nanoparticle characterization. The numbers on both blades indicate the longest particle length. The arrow indicates a particle.
The total N content of the fertilizers was determined by wet digestion (Kjeldahl) using H2SO4, CuSO4.5H2O, NA2SeO3, K2SO4, and Raney’s alloy in a block digester for 5 h, followed by steam distillation and titration with standardized H2SO4 (Alcarde, 2009; MAPA, 2017). The atomic absorption spectrometric method (MAPA, 2017) determined the total Mo content, whereby the samples underwent acid digestion using hydrochloric acid (HCl). The amount of Mo in the granule was expressed as a function of the amount added using the Eq. (1) below:
where % of Mo is the percentage of molybdenum recovered in the determination, Mou is the amount of Mo determined after digestion, and Moe is the amount of Mo added (Table 1).
The salinity of the fertilizer was determined using the MAPA (2017) method. First, 1 g of each fertilizer was weighed and placed in a 100 mL volumetric flask. The volume was completed with deionized water, and the solution was shaken until the samples were dissolved and homogenized. After this process, the solution was transferred to a beaker and rested for 10 min to determine the conductivity.
The determination of hygroscopicity was conducted in accordance with the methodology proposed by Alcarde et al. (1992) and subsequently adopted by Faria et al. (2014). For each sample, 10 g of each fertilizer was added to a Petri dish (4 cm in diameter and 1 cm high). The fertilizers were subjected to a 24-h drying process at 50 °C in an oven in order to obtain their dry mass. Subsequently, the samples were introduced to desiccators with relative air humidity levels of 38, 55, 76, 86, and 92 %. The desired humidity levels were achieved by adding sulfuric acid in varying concentrations. At each humidity level, the samples were weighed at 3, 6, 12, 24, and 48 h after placement in the desiccator. The amount of water absorbed was calculated in relation to the weight of the dry sample, that is, after 24 h in the oven.
The hardness of the fertilizer granules was evaluated in accordance with the procedures outlined in the Manual for the Determination of Physical Properties of Fertilizers (IFDC, 1986) using an Ethink Technology compression and traction meter, model 298 DGP. Each treatment comprised 21 granules, with seven granules analyzed per repetition. The fertilizer was poured at a constant speed to determine the resting angle, which was used to calculate the height and length of the heap. The resting angle was then calculated using trigonometric equations. The angle is equivalent to the tangent inverse, obtained by height divided by the length of the heap (MAPA, 2017).
Following the preparation of the fertilizers, a reaction was observed, as evidenced by a change in coloration. Specifically, a blue hue was formed between urea, Mo and NBPT. The Fourier-transform infrared (FTIR) analysis was conducted on six fertilizers to identify any changes that may have occurred. The fertilizers subjected to analysis were untreated urea, NBPT-coated urea, NBPT-coated urea + Am600, NBPT-incorporated urea + Am600, NBPT-coated urea + Mt600, and NBPT-incorporated urea + Mt600. The FTIR spectra of the fertilizers were obtained using an FTIR instrument (FT/IR-4100, Jasco Inc.). The pellets of fertilizer were prepared for analysis, and the infrared spectra were recorded in transmission mode within the range of 4000-400 cm–1. This analysis was conducted with the average Mo rate, as the hypothesis is that the reaction remains consistent with only a change in intensity.
Data processing and statistical analysis
The statistical analysis was performed using the R statistical computing environment (version 4.0.0) and the Python programming language (version 3.8.3). The assumptions of homogeneity of variance and normality of residues were evaluated through the implementation of the Bartlett and Shapiro-Wilk tests, respectively. Outliers were removed when identified by the Grubbs test, based on a normal distribution calculated from the most extreme data point.
The mean experimental data for the hardiness, saline index, response angle, and hygroscopicity were analyzed using the k-means clustering algorithm (unsupervised learning). The data were separated into two clusters (cluster 1: 60 observations; cluster 2: 30 observations) by the Silhouette method, which is based on a comparison of tightness and separation (Rousseeuw, 1987). The Euclidean distance was employed to quantify the dissimilarity between the observations and a given cluster. A total of 90 samples were subjected to k-means testing, a fundamental technique in machine learning due to its simplicity in organizing complex data. The k-clustering algorithm was selected due to the absence of pre-existing group labels. The mean values of the aforementioned variables within each cluster were compared using a t-test (p ≤ 0.05) in addition to a Pearson correlation analysis (p ≤ 0.05).
The hardiness, saline index, angle of repose, and hygroscopicity (at 38, 55, 76, 86, and 92 % of humidity) were subjected to an analysis of variance (ANOVA) based on the F-test. In instances where the F-test yielded a statistically significant result (p ≤ 0.05), the means of fertilizers treated or not with NBPT and Mo sources were subjected to a least significant difference (LSD) test with Bonferroni correction (p ≤ 0.05). Additionally, Mo rates were analyzed using regression techniques, specifically quadratic and linear models.
Results
Visual aspect of the fertilizers
Some products exhibited visual alterations three days following the granulation and coating processes. The base of all formulated compounds was urea, which was white and devoid of impurities (untreated urea + Am, untreated urea + Mt) (Figure 2). An adhesive was required to bind Mo to urea, which exhibited a slight yellow hue. This process resulted in yellowish granules, regardless of the source and rate of Mo, as illustrated in Figure 2. These granules were observed in untreated urea + Am150-1200 and untreated urea + Mt150-1200 samples.

– Visual aspect of formulated nitrogen fertilizers formulated with or without N-(n-butyl) thiophosphoric triamide (NBPT) (U = Untreated urea; Uc = NBPT-coated urea; Ui = NBPT-incorporated urea), molybdenum (Mo) sources (Am = ammonium molybdate; Mt = molybdenum trioxide) and rates (0, 1.5, 3.0, 6.0, and 12.0 g kg–1 N).
The combination of urea, adhesive, NBPT, and Am resulted in the formation of green products, exhibiting slight yellowing and elevated Mo rates in the granules. In contrast, urea treated with Mt resulted in products with a bluish coloration, which was more intense as the Mo rate increased (Figure 2). The observed coloration changes following the production process suggest unexpected chemical reactions. The same reactions were observed for urea treated with Mt and NBPT incorporated in the granules, but to a lesser extent, indicating that the process was more intense between Mt and NBPT when both additives were located in the outer layer of the granule.
To elucidate the changes in functional groups resulting from the addition of NBPT and Mo, FTIR was employed to assess the NBPT oxidation (Figure 3). The transmittance of the untreated urea differs from that of the other fertilizers, exhibiting distinct bands within the amides group region (1600 ± 50 cm–1). It is possible to suggest the formation of specific bonds in the fertilizers that underwent a color change. The FTIR spectra revealed notable changes in the absorption bands of the organic phosphates group region (1350-1250 cm−1) compared to NBPT-coated urea and NBPT-coated urea + Mt600, as illustrated in Figure 3. Another point of interest is in the region between 1420 and 1370 cm–1, where the organic sulfates (S = O) group can identify reduced NBPT. As the same band is observed with low energy in untreated urea, it can be assumed that the reduction in absorption energy observed in the S = O indicates the interaction between the NBPT and Mo, particularly with Mt.

– Fourier-transformed infrared analysis with spectra of the untreated urea (U), NBPT-coated urea (Uc), NBPT-coated urea + Am600 (UcAm600), NBPT-incorporated urea + Am600 (UiAm600), NBPT-coated urea + Mt600 (UcMt600), NBPT-incorporates urea + Mt600 (UiMt600), formulated fertilizers. Functional groups identified were: 1650 ± 50 cm–1 = asymmetric (C = O) of amides - a region of urea groups; 1350-1250 = organic phosphates (P = O) - group belonging to oxidized NBPT; 1420-1370 = organic sulfates (S = O) - a group for identifying reduced N-(n-butyl) thiophosphoric triamide (NBPT). Am = ammonium molybdate; Mt = molybdenum trioxide.
Fertilizer characterization
The angle of repose exhibited three notable double interactions (p ≤ 0.05; Figure 4A-C). Adding Mo rates to both sources of Mo and NBPT treated-urea exhibited linear responses in the angle of repose (R2 > 0.36; p < 0.001). This resulted in an increase of 11, 13, 25, and 22 %, when comparing the control to the rate of 12 g kg–1 N, respectively. These results were obtained using the general average in untreated urea, NBPT-coated urea, Am, and Mt. However, the incorporation of NBPT into urea yielded a quadratic response, with an optimal Mo rate of 7 g kg–1 N (Figure 4A). The angle of repose was consistently higher for Mt, with a 13 % increase compared to Am (Figure 4B). The combination of Mt with NBPT-treated urea resulted in a greater angle of repose, with an increase of 11, 5, and 15 % in U (untreated urea), Uc (NBPT-coated urea), and Ui (NBPT-incorporated urea), respectively, compared with the associations of Am and types of urea (Figure 4C).

– Angle of repose of nitrogen (N) fertilizers formulated with or without N-(n-butyl) thiophosphoric triamide (NBPT) (U = Untreated urea; Uc = NBPT-coated urea; Ui = NBPT-incorporated urea), molybdenum (Mo) sources (Am = ammonium molybdate; Mt = molybdenum trioxide) and rates (0; 1.5; 3.0; 6.0; 12.0 g kg–1 N). There were three double-interactions between A) NBPT-treated urea and Mo rates, B) sources and rates of Mo, and C) NBPT-treated urea and Mo sources (p ≤ 0.05), according to the regression test (p ≤ 0.05; Mo rates), and the least significant difference test with Bonferroni correction (p ≤ 0.05; Mo sources, uppercase letter; treated-urea, lower case). Llinear models; Qquadratic models;Nsnon significant effects; R2 = coefficient of determination. Vertical bars represent the standard error of the mean.
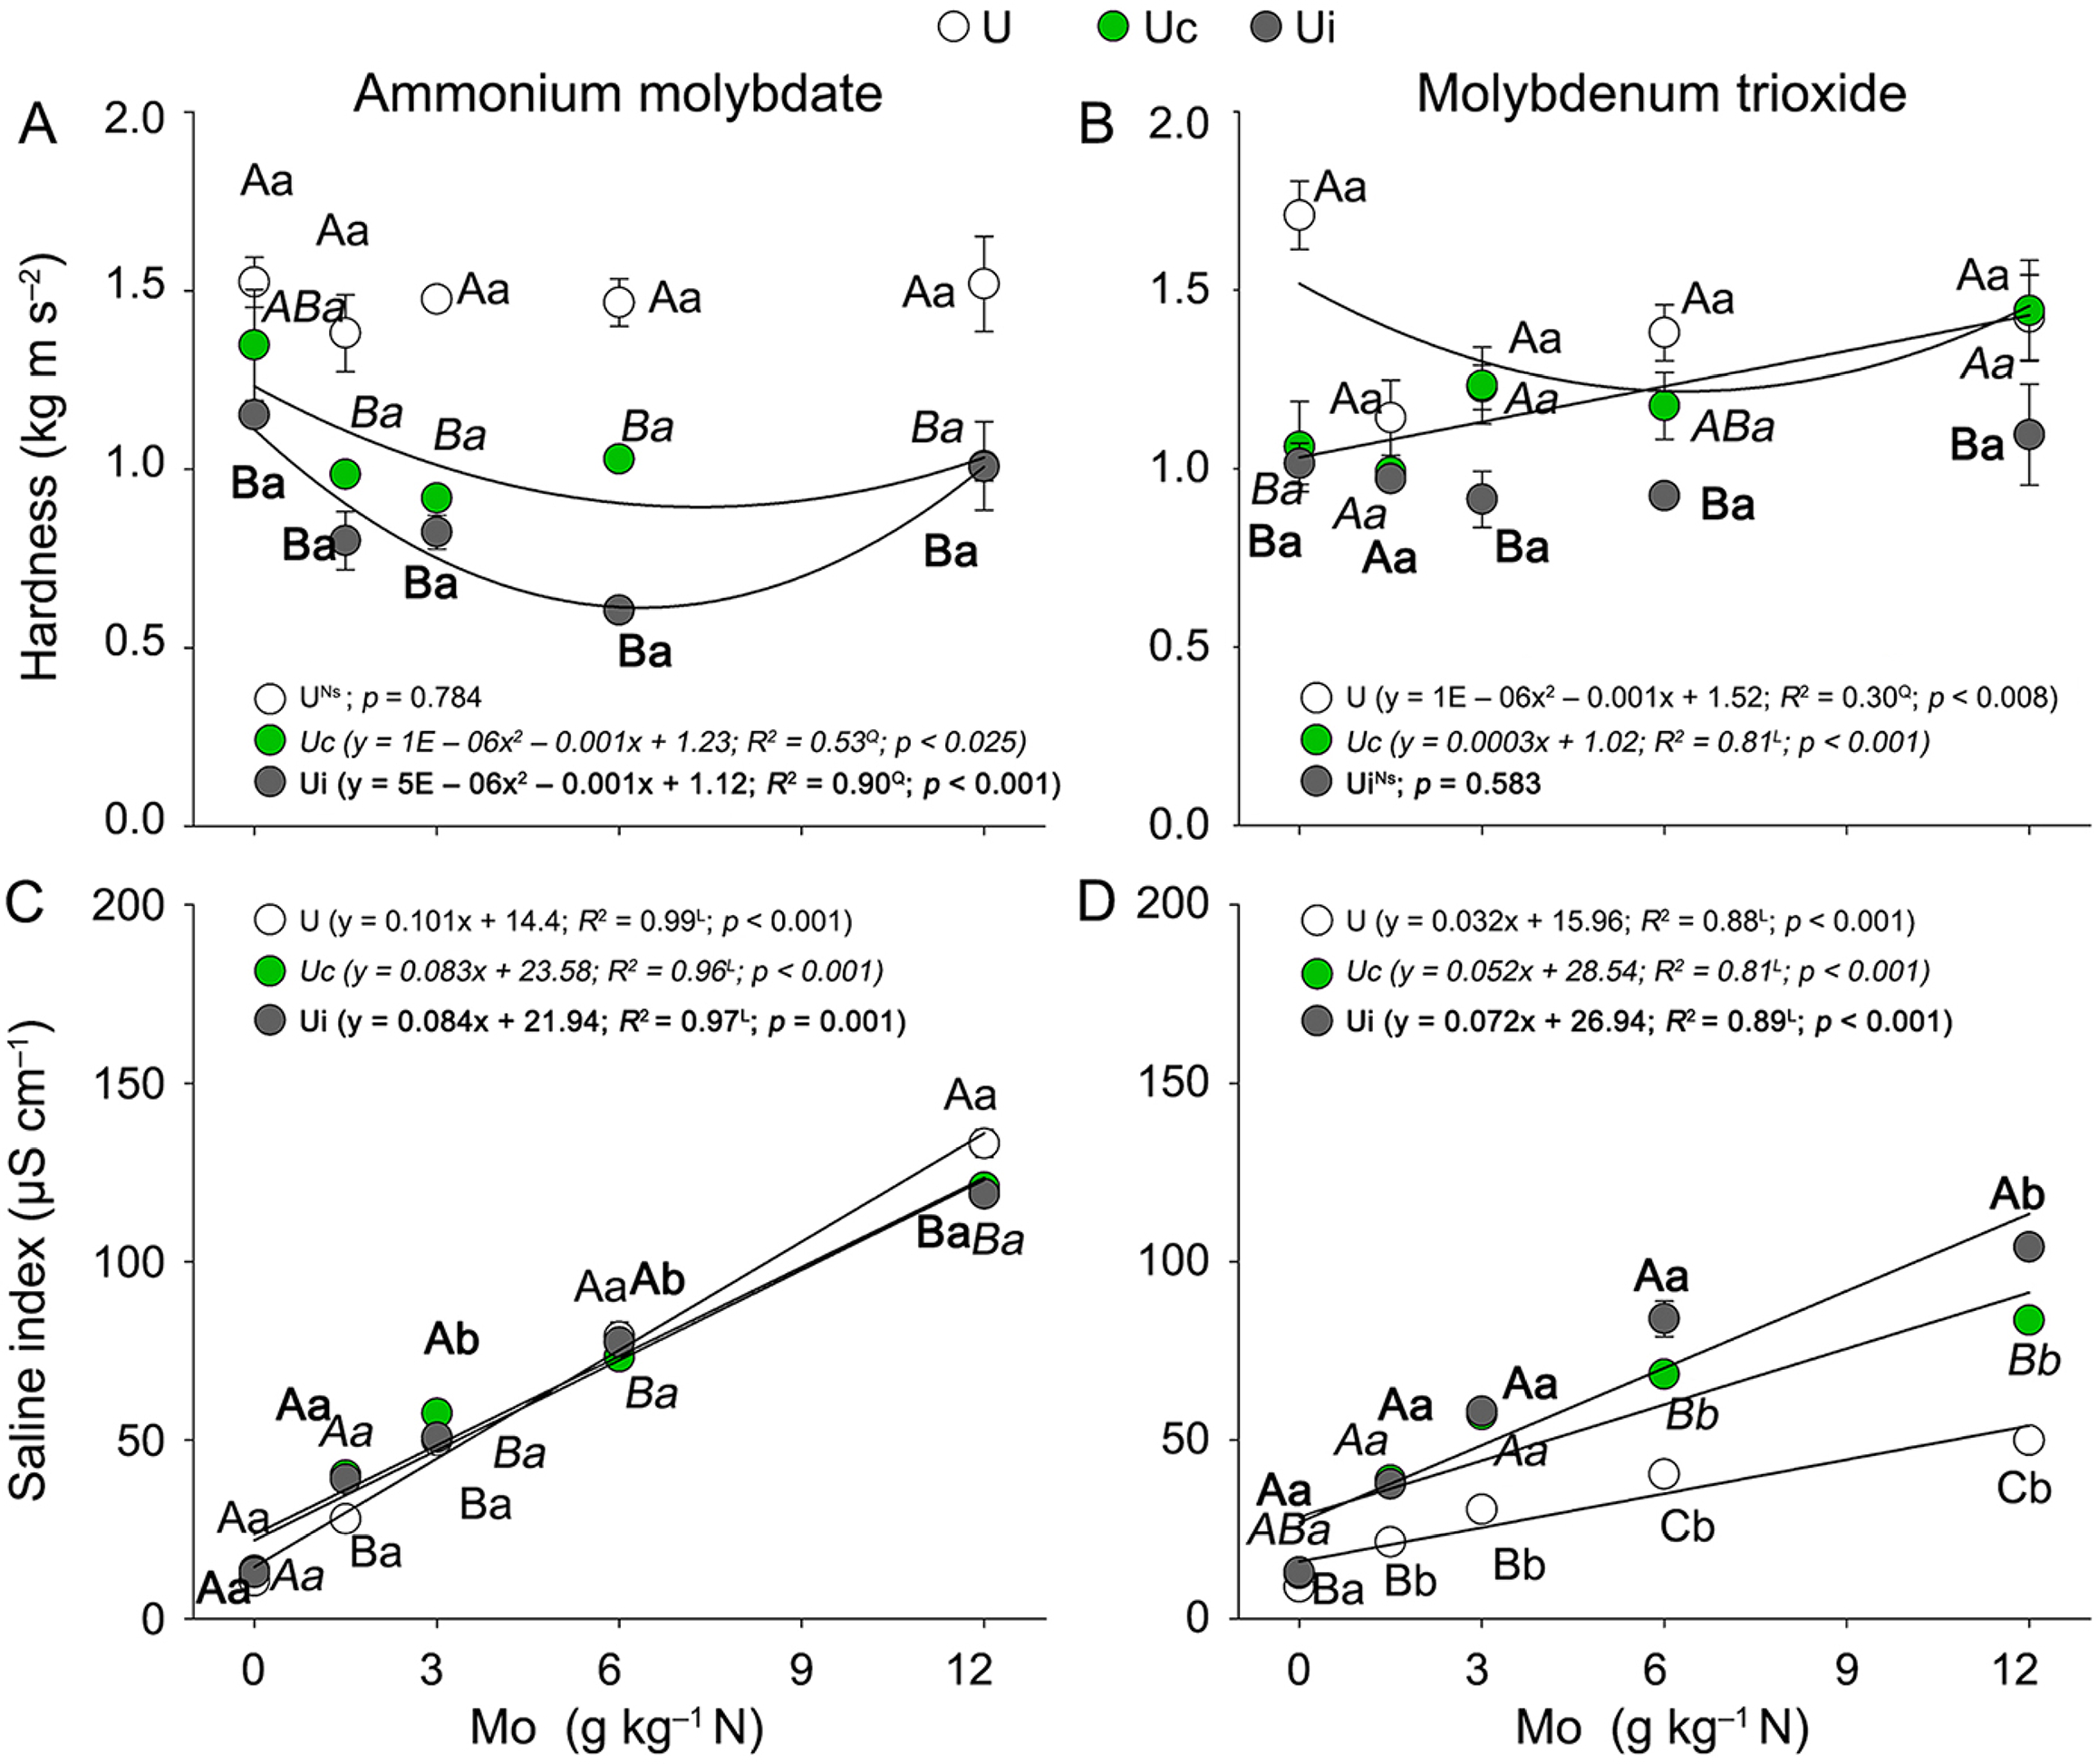
The hardiness, saline index, and hygroscopicity at 38, 55, 76, and 86 % humidity demonstrated a triple interaction (p ≤ 0.05; Figures 5A-D and 6A-J). In Am, the untreated urea exhibited a higher level of hardiness with an average value of 1.5 kg m s–2 (Figure 5A and B). The NBPT-coated urea and NBPT-incorporated urea exhibited quadratic responses, with the highest reduction in hardiness observed at Mo rates of 9 and 11 g kg–1 N, respectively (Figure 5A). In Mt, the untreated urea and NBPT-coated urea demonstrated higher hardiness, representing an increase of 23 % compared to NBPT-incorporated urea (Figure 5B).

– A and B) Hardiness, C and D) saline index of nitrogen (N) fertilizers formulated with or not N-(n-butyl) thiophosphoric triamide (NBPT) (U = Untreated urea; Uc = NBPT-coated urea; Ui = NBPT-incorporated urea), molybdenum (Mo) sources (ammonium molybdate and molybdenum trioxide) and rates (0; 1.5; 3.0; 6.0; 12.0 g kg–1 N). The effect of Mo rates was tested by the regression test (p ≤ 0.05), and the results were fitted by ). Llinear models; Qquadratic models; Nsnon-significant effects; R2 = coefficient of determination. NBPT-treated urea and sources of Mo were tested by the least significant difference test with Bonferroni correction (p ≤ 0.05), and results were represented by uppercase and lowercase letters, respectively. Symbols represent the mean value, while vertical bars represent the standard error of the mean.
The saline index demonstrated a notable increase with the application of Mo rates (Figure 5C and D). In the case of Mt, a clear distinction was observed in the saline index of NBPT-treated urea, which exhibited a higher index than NBPT-incorporated urea, followed by NBPT-coated urea, and untreated urea with a general mean of 59, 52, and 30 µS cm–1, respectively (Figure 5D). The saline index exhibited minimal variation in Am, with an overall mean ranging from 59 to 61 µS cm–1 (Figure 5C).
The hygroscopicity of fertilizers was observed to average –3.1, 3.7, 29.3, 48.7, and 39.3, respectively, in 38, 55, 76, and 86 to 92 % humidity (Figure 6A-J). Specifically, the hygroscopicity of the untreated urea was higher in Am than that of Mt, across all rates of Mo. Furthermore, in both sources of Mo, the hygroscopicity of the untreated urea was observed to be higher than that of the NBPT-coated urea and NBPT-incorporated urea (Figure 6A and B). The humidity of 55 % exhibited minimal variation between Am and Mt (Figure 6C and D). As humidity increased from 76 to 86 %, the hygroscopicity of the untreated urea decreased in all associations, with an overage of 14 and 24, respectively, and a decrease of 55 and 44 % compared to NBPT-coated urea and 66 and 69 % compared to NBPT-incorporated urea (Figure 6E-H). Conversely, the hygroscopicity of NBPT-incorporated urea was observed to be higher in all rates and sources of Mo, with a general average of 42 and 78, and an increase of 25 and 45 % compared to Uc, respectively, in the humidity range of 76 to 86 %. An exception is observed in the case of Am and Mt, where NBPT-coated urea exhibited a higher degree of humidity in the Mo rates of 3.0 (86 % humidity) and 3.0 and 6.0 (76 % humidity), respectively, as illustrated in Figure 6E-H. Notably, no treatments demonstrated a discernable impact from the humidity of 92 %, with a general average of 39 (Figure 6I and J).
Formulated fertilizer clusters
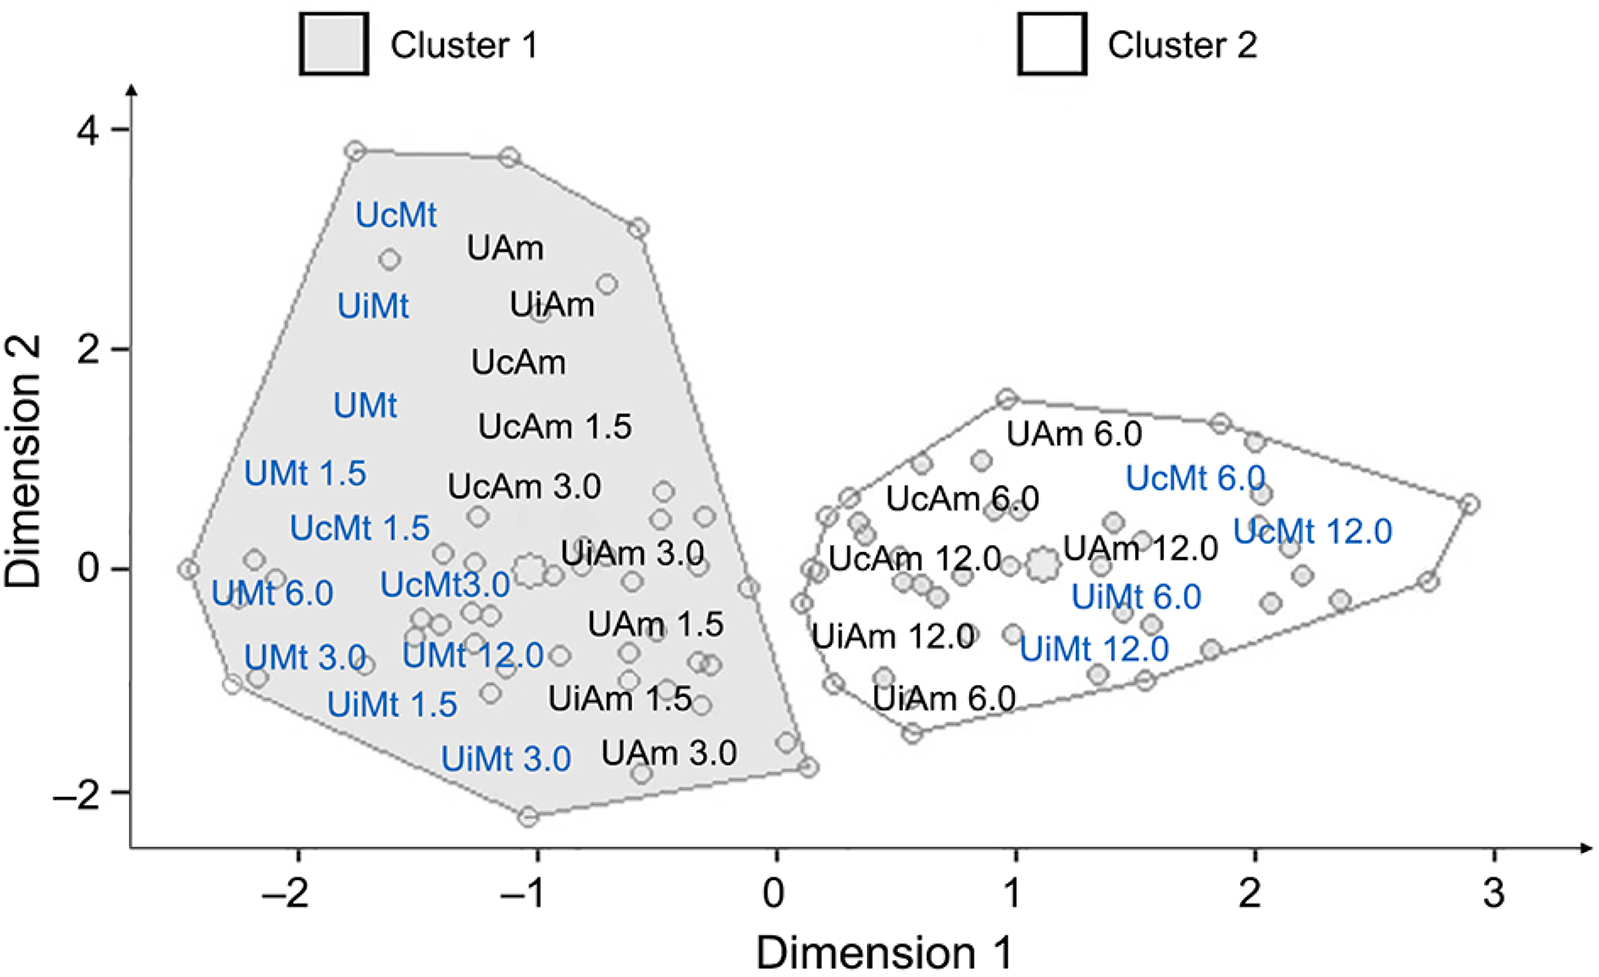
The one-dimensional plane formed with two clusters, which collectively accounted for a sum of squares of 63 %, was represented by the sum of 24,328 and 19,824, respectively, in clusters 1 and 2 (Table 2). The high values of the sum of squares indicated a high degree of variability within cluster 1, which was composed of all treatments with treated urea and sources of Mo at the rates of 1.5 and 3.0 g kg–1 of N, as well as the untreated urea, NBPT-coated urea, and NBPT-incorporated urea. In contrast, Mo-treated urea at 6.0 and 12.0 g kg–1 N were associated with cluster 2 (Figure 7).

– Distribution of nitrogen fertilizers formulated with or without N-(n-butyl) thiophosphoric triamide (NBPT) (U = Untreated urea; Uc = NBPT-coated urea; Ui = NBPT-incorporated urea), molybdenum (Mo) sources (Am = ammonium molybdate; Mt = molybdenum trioxide) and rates (0, 1.5, 3.0, 6.0, and 12.0 g kg–1 N) in clusters 1 and 2. A total of 90 observations were separated into 60 and 30 observations in clusters 1 and 2, respectively. Labels in black and blue represent the Am and Mt, respectively.
Cluster 2 exhibited superior averages of the saline index, angle of repose, and hygroscopicity, with an overall mean of 94 µS cm–1, 33.2°, and 28 %, respectively. These values were considered 64, 10, and 23 % higher than the respective averages in cluster 1. Hardiness exhibited no discernable difference between the clusters, with a general average of 1.2 and 1.1 kg m s–2 in cluster 1 and 2, respectively (Table 2).
In cluster 1, a negative correlation was observed between hardiness and saline index (r = –0.34; p ≤ 0.05) and hygroscopicity (r = –0.41; p ≤ 0.05). This indicates that increased hardiness was associated with decreased saline index and hygroscopicity. Conversely, a positive correlation was observed between the angle of repose and the saline index (r = 0.53; p ≤ 0.05), while a negative correlation was evident between the angle of repose and hygroscopicity (r = –0.34; p ≤ 0.05). Therefore, the increase in the angle of repose had a beneficial influence on the saline index, whereas it negatively impacted on hygroscopicity. Notably, in cluster 2, no correlation was observed between hardiness, saline index, angle of repose, and hygroscopicity (Table 3).
Discussion
The visual characteristics of the fertilizers, including their color formation, were influenced by the presence of nanoparticles and the mode of their addition. Adding Mt to NBPT-treated urea resulted in the formation of a blueish color, particularly at high Mo rates (Figure 2). It is crucial to highlight that the NBPT molecule contains phosphorous (N-(n-butyl) thiophosphoric triamide), which is well-established to react with Mo (Crouch and Malmstadt, 1967). A number of potential reactions between Mo and P were identified, with the reaction rate dependent on the Mo rate, oxidation state, pH, and medium reaction (Nagul et al., 2015). Furthermore, the reaction between Mo and P is dependent upon their ratio (Mo:P), which is intense above 12:1, with the rate of 6.0 g of Mo a relation between the elements of 8.6, while in the rate of 3.0 g of Mo, the relation was only 4.3, making the reaction unfeasible (van Veen et al., 1986). Specifically, adding Mt to NBPT-treated urea resulted in an intense blue coloration. However, it is not possible to infer whether a new molecule was formed from the reaction of this micronutrient and NBPT-derived P, as the degradation of the urease inhibitor was not assessed. Furthermore, there is uncertainty regarding the effect of Mo on NBPT. Therefore, caution is recommended when combining Mo and NBPT until further knowledge is required. Future research must address the role of Mo on NBPT stability, as well as the efficiency of the molecule in mitigating ammonia losses from urea. Conversely, in treatments without blue coloring, the lack of S and P (no NBPT added), even when the adherent was used (Figure 2), evidenced the suggested interaction of Mo and NBPT.
Many studies have been conducted to assess the efficacy of nano fertilizers in delivering nutrients to plants. The majority of these studies have focused on evaluating the performance of the particles after they have been absorbed or applied to the plants (Lin and Xing, 2007; Stampoulis et al., 2009; Lin and Xing, 2008; Shah and Belozerova, 2009; Taran et al., 2014; Thomas et al., 2017). The colorimetric reaction indicated that the use of nanofertilizers can result in chemical interactions among additives. In favorable environmental conditions, nanoparticles exhibit high reactivity due to their large specific surface area (Dreizin, 2009; Mudunkotuwa et al., 2012; Faivre and Bennet, 2016). Additionally, they are commonly utilized as reaction catalysts. In this instance, the reaction between the nanoparticles and NBPT rendered the mixture infeasible. The FTIR results did not exhibit a clear distinction between the treatments, which differed from the findings of McCarty et al. (1989). In their study, the authors reported alterations to the NBPT structure, specifically at the urease inactivation site, and the absence of peaks for P and S (Figure 3). However, it is possible to verify minor spectral changes, which suggest modifications to existing structures.
The physicochemical changes that occur can result in a reduction in the quality of the fertilizer, an increase in the complexity of the transport and application processes and alterations in the utilization of the plants depending on the stability of the compound formed (Faria et al., 2014). The angle of repose is primarily affected by the granules’ shape, size, and coating (Rutland and Polo, 1951), a phenomenon that was also observed in this experiment. This is because alterations in the coating material and the method of adding NBPT to urea influenced the response to this variable. Moreover, it was determined that the flow of the granules produced with Am could be classified as free flow. In contrast, those with Mt were classified as easy flow (Gaylord and Gaylord, 1984), indicating that the mixture of Am with urea exhibited the most favorable physical characteristics., This finding was also observed for the other parameters.
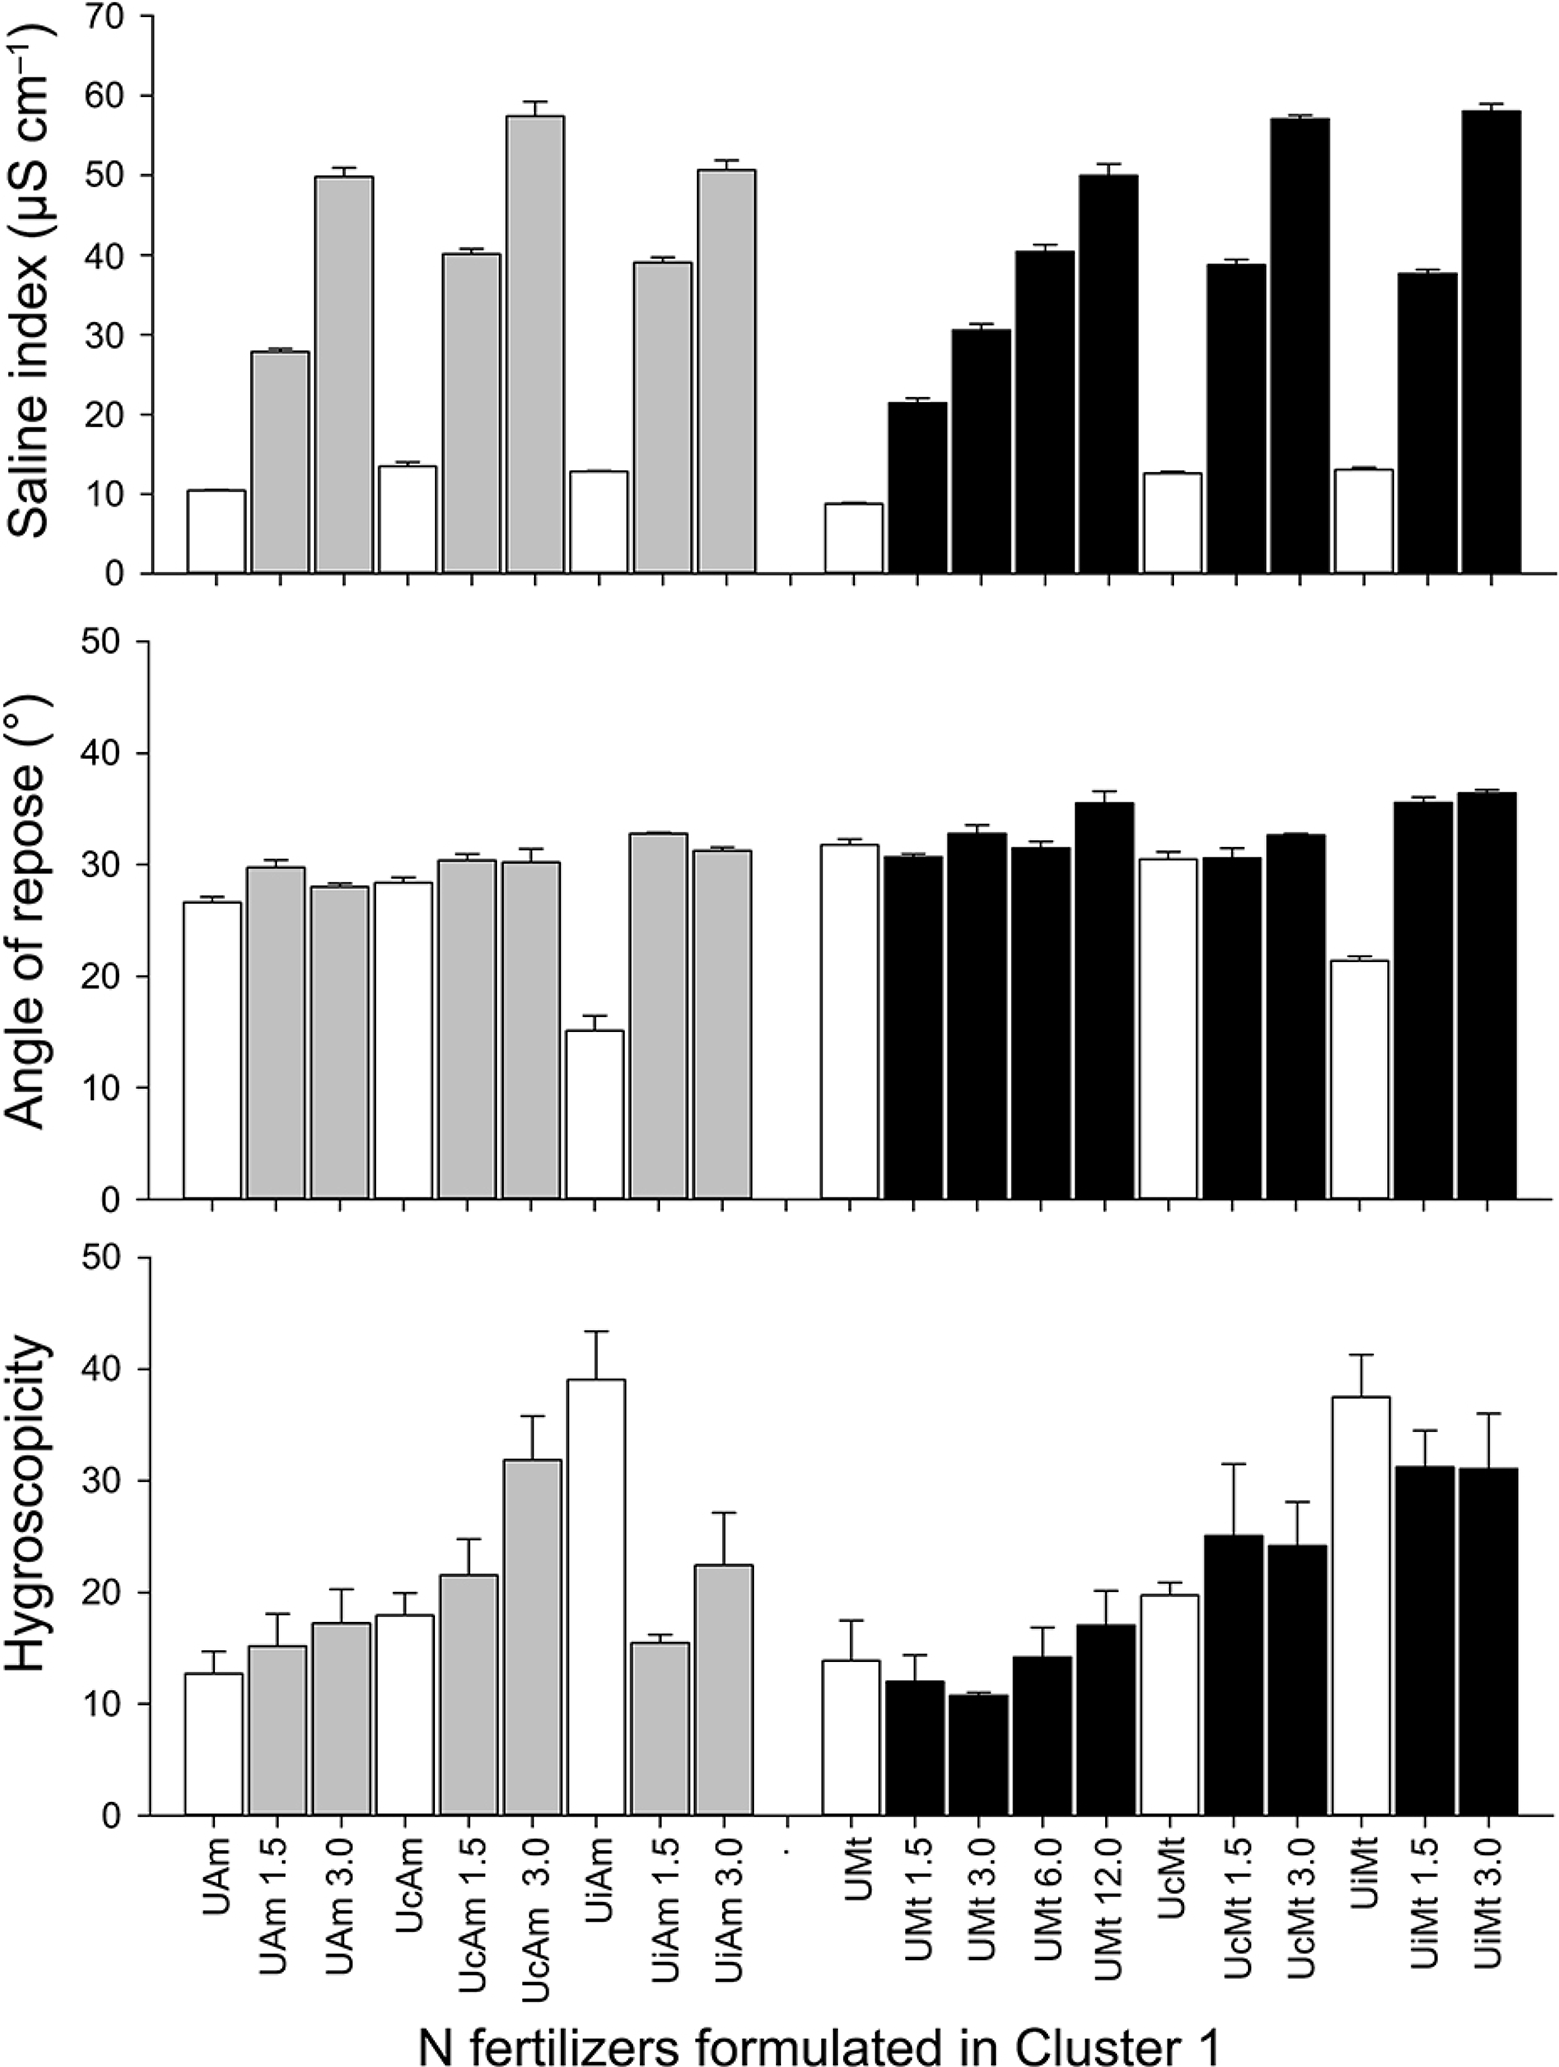
Given that the benchmark N commercial urea exhibits a saline index below 30 µS cm–1, an angle of repose exceeding 25°, and a hygroscopicity of less than 20, these attributes align with those typically observed in common urea. The Am urea in conjunction with untreated urea at 1.5 g kg–1 N and Mt in conjunction with untreated urea at 1.5 and 3.0 g kg–1 N are presented as highly efficacious fertilizers capable of supplying both N and Mo to plants. In the event that increased Mo rates are required, the data demonstrate that Mt represents a superior Mo source when associated with untreated urea, exhibiting favorable characteristics with regard to the angle of repose and hygroscopicity, although with a saline index exceeding 30 µS cm–1 (Figure 8). The data indicate that rates exceeding 6.0 g Mo resulted in lower hardness and a higher angle of repose, thereby rendering transportation and application of these products more challenging. Furthermore, elevated salinity and hygroscopicity, or lower critical moisture, were observed, suggesting that these products possess a greater capacity to absorb moisture from the environment. When application is made near the root, this may result in root dehydration (Mahmoud et al., 2020).
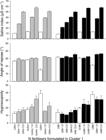
– Nitrogen (N) fertilizers formulated with or without N-(n-butyl) thiophosphoric triamide (NBPT) (U = Untreated urea; Uc = NBPT-coated urea; Ui = NBPT-incorporated urea), molybdenum (Mo) sources (Am = ammonium molybdate; Mt = molybdenum trioxide) and rates (0, 1.5, 3.0, 6.0, and 12.0 g kg–1 N). Vertical bars represent the standard error of the mean.
Incorporating additives (i.e., Mo and NBPT) into urea resulted in fertilizer sources exhibiting heightened susceptibility to undesirable changes (Figures 5A-D and 6A-J). This phenomenon can be attributed to the discrepancy in the granule formulation process. The incorporation of NBPT into urea resulted in the granule not undergoing high-temperature drying after granulation due to the thermo-sensitivity of the NBPT molecule. Consequently, the discrepancy between the formulation processes was expected, and further solutions to this bottleneck in the formulation should be sought to incorporate NBPT into the urea granule.
It is feasible to combine Mo with urea without inducing substantial physicochemical modifications, regardless of the source of Mo employed. However, the rate of Mo must not exceed 6.0 g kg–1 N to ensure the viability of the formulated product for utilization and commercialization. The addition of Mo at rates exceeding 6.0 g kg–1 N resulted in a reduction in hardness, increasedsalinity, and enhanced water absorption from the environment, regardless of the Mo source. The formulations of urea with NBPT and Mo demonstrated that Mt underwent an apparent change in the granule color in response to NBPT, with this effect being less pronounced at rates below 6.0 g kg–1 N. Consequently, the formation of this association should be avoided due to the potential for NBPT degradation. It is, therefore, essential to assess ammonia losses, as this analysis can inform the viability of this mixture.

– Hygroscopicity of nitrogen (N) fertilizers formulated with or without N-(n-butyl) thiophosphoric triamide (NBPT) (U = Untreated urea; Uc = NBPT-coated urea; Ui = NBPT-incorporated urea), molybdenum (Mo) sources (Am = ammonium molybdate; Mt = molybdenum trioxide) and rates (0, 1.5, 3.0, 6.0, and 12.0 g kg–1 N at A-B = 38 %, C-D = 55 %, E-F = 76 %, G-H = 86 % and I-J) 92 % of humidity). The effect of Mo rates was tested by the regression test (p ≤ 0.05), and the results were explained by Llinear models; Qquadratic models; Nsnon-significant effects; R2 = coefficient of determination. NBPT-treated-urea and sources of Mo were tested by the least significant difference test with Bonferroni correction (p ≤ 0.05), and the results were represented by uppercase and lowercase letters, respectively. Symbols represent the mean value, while vertical bars represent the standard error of the mean. The red line represents a zero-point.
Acknowledgments
Fundação de Amparo à Pesquisa do Estado de São Paulo (FAPESP – Process 2017/25566-8) funded this project. The second author received a research productivity fellowship from the Conselho Nacional de Desenvolvimento Científico e Tecnológico (CNPq), grant #309061/2020-2. The fourth author is recipient of a research productivity fellowship from the CNPq, grant #306185/2020-2.
References
-
Alcarde JC, Malavolta E, Borges AL, Muniz AS, Veloso CA, Fabrício AC, et al. 1992. Hygroscopicity evaluation of fertilizers and agricultural liming materials. Scientia Agricola 49: 137-144. https://doi.org/10.1590/S0103-90161992000400018
» https://doi.org/10.1590/S0103-90161992000400018 - Alcarde JC. eds 2009. Manual de Análise de Fertilizantes. FEALQ, Piracicaba, SP, Brazil (in Portuguese).
-
Cancellier EL, Silva DRG, Faquin V, Gonçalves BA, Cancellier LL, Spehar CR. 2016. Ammonia volatilization from enhanced-efficiency urea on no-till maize in Brazilian cerrado with improved soil fertility. Agricultural Sciences 40: 133-144. https://doi.org/10.1590/1413-70542016402031115
» https://doi.org/10.1590/1413-70542016402031115 -
Crouch SR, Malmstadt HV. 1967. A mechanistic investigation of molybdenum blue method for determination of phosphate. Analytical Chemistry 39: 1084-1089. https://pubs.acs.org/doi/pdf/10.1021/ac60254a027
» https://pubs.acs.org/doi/pdf/10.1021/ac60254a027 -
Dreizin EL. 2009. Metal-based reactive nanomaterials. Progress in Energy and Combustion Science 35: 141-167. https://doi.org/10.1016/j.pecs.2008.09.001
» https://doi.org/10.1016/j.pecs.2008.09.001 -
Faivre D, Bennet M. 2016. Magnetic nanoparticles line up. Nature 535: 235-236. https://doi.org/10.1038/535235a
» https://doi.org/10.1038/535235a -
Faria LA, Nascimento CAC, Ventura BP, Florim GP, Luz PHC, Vitti GC. 2014. Hygroscopicity and ammonia volatilization losses from nitrogen sources in coated urea. Revista Brasileira Ciência do Solo 38: 942-948. https://doi.org/10.1590/S0100-06832014000300026
» https://doi.org/10.1590/S0100-06832014000300026 -
Food and Agriculture Organization of the United Nations [FAO]. 2021 Fertilizers by nutrient. Available at: http://www.fao.org/faostat/en/#data/RFN [Accessed July 9, 2021]
» http://www.fao.org/faostat/en/#data/RFN - Gaylord EH, Gaylord CN. 1984. Design of steel bins for storage of bulk solids. Prentice-Hall, Hoboken, NJ, USA.
- Guelfi D. 2017. Fertilizantes nitrogenados estabilizados, de liberação lenta ou controlada. Informações agronômicas. IPNI, Piracicaba, SP, Brazil (in Portuguese).
-
Hackley VA, Clogston JD. 2011. Measuring the hydrodynamic size of nanoparticles in aqueous media using batch-mode dynamic light scattering. p. 35-52. In: McNeil SE. ed. Characterization of nanoparticles intended for drug delivery. Humana Press, Totowa, NJ, USA. https://doi.org/10.1007/978-1-60327-198-1_4
» https://doi.org/10.1007/978-1-60327-198-1_4 - International Fertilizer Development Center [IFDC]. 1986. Manual for determining physical properties of fertilizer. Muscle Shoals, Alabama, USA.
-
International Fertilizer Industry Association [IFA]. 2018. Database. Available at: http://ifastat.org/ [Accessed June 10, 2020]
» http://ifastat.org/ -
Lin D, Xing B. 2007. Phytotoxicity of nanoparticles: inhibition of seed germination and root growth. Environmental Pollution 150: 243-250. https://doi.org/10.1016/j.envpol.2007.01.016
» https://doi.org/10.1016/j.envpol.2007.01.016 -
Lin D, Xing B. 2008. Root uptake and phytotoxicity of ZnO nanoparticles. Environmental Science & Technology 42: 5580-5585. https://doi.org/10.1021/es800422x
» https://doi.org/10.1021/es800422x -
Mahmoud AWM , Abdeldaym EA , Abdelaziz SM , El-Sawy MB , Mottaleb SA . 2020. Synergetic effects of zinc, boron, silicon, and zeolite nanoparticles on confer tolerance in potato plants subjected to salinity. Agronomy 10: 19. https://doi.org/10.3390/agronomy10010019
» https://doi.org/10.3390/agronomy10010019 -
McCarty GW, Bremner JM, Chai HS. 1989. Effect of N-(n-butyl) thiophosphoric triamide on hydrolysis of urea by plant, microbial, and soil urease. Biology and Fertility of Soils 8: 123-127. https://doi.org/10.1007/bf00257755
» https://doi.org/10.1007/bf00257755 - Ministério da Agricultura Pecuária e Abastecimento [MAPA]. 2017. Manual de Métodos Analíticos Oficiais para Fertilizantes e Corretivos. MAPA-SDA, Brasília, DF, Brazil (in Portuguese).
-
Mira AB, Cantarella H, Souza-Netto GJM, Moreira LA, Kamogawa MY, Otto R. 2017. Optimizing urease inhibitor usage to reduce ammonia emission following urea application over crop residues. Agriculture, Ecosystems & Environment 248: 105-112. https://doi.org/10.1016/j.agee.2017.07.032
» https://doi.org/10.1016/j.agee.2017.07.032 -
Mudunkotuwa IA, Rupasinghe T, Wu CM, Grassian VH. 2012. Dissolution of ZnO nanoparticles at circumneutral pH: a study of size effects in the presence and absence of citric acid. Langmuir 28: 396-403. https://doi.org/10.1021/la203542x
» https://doi.org/10.1021/la203542x -
Nagul EA, McKelvie ID, Worsfold P, Kolev SD. 2015. The molybdenum blue reaction for the determination of orthophosphate revisited: opening the black box. Analytica Chimica Acta 890: 60-82. https://doi.org/10.1016/j.aca.2015.07.030
» https://doi.org/10.1016/j.aca.2015.07.030 -
Pan B, Lam SK, Mosier A, Luo Y, Chen D. 2016. Ammonia volatilization from synthetic fertilizers and its mitigation strategies: a global synthesis. Agriculture, Ecosystems & Environment 232: 283-289. https://doi.org/10.1016/j.agee.2016.08.019
» https://doi.org/10.1016/j.agee.2016.08.019 -
Rech I, Polidoro JC, Pavinato PS. 2017. Additives incorporated into urea to reduce nitrogen losses after application to the soil. Pesquisa Agropecuária Brasileira 52: 194-204. https://doi.org/10.1590/S0100-204X2017000300007
» https://doi.org/10.1590/S0100-204X2017000300007 -
Rousseeuw PJ. 1987. Silhouettes: a graphical aid to the interpretation and validation of cluster analysis. Journal of Computational and Applied Mathematics 20: 53-65. https://doi.org/10.1016/0377-0427 (87)90125-7
» https://doi.org/10.1016/0377-0427 (87)90125-7 - Rutland DW, Polo J. 1951. Properties of Fertilizers: Fertilizer Dealer Handbook. International Fertilizer Development Centre, Muscle Shoals, AL, USA.
-
Shah V, Belozerova I. 2009. Influence of metal nanoparticles on the soil microbial community and germination of lettuce seeds. Water, Air, and Soil Pollution 197: 143-148. https://doi.org/10.1007/s11270-008-9797-6
» https://doi.org/10.1007/s11270-008-9797-6 -
Silva AGB, Sequeira CH, Sermarini RA, Otto R. 2017. Urease inhibitor NBPT on ammonia volatilization and crop productivity: a meta-analysis. Agronomy Journal 109: 1-13. https://doi.org/10.2134/agronj2016.04.0200
» https://doi.org/10.2134/agronj2016.04.0200 -
Stampoulis D, Sinha SK, White JC. 2009. Assay-dependent phytotoxicity of nanoparticles to plants. Environmental Science & Technology 43: 9473-9479. https://doi.org/10.1021/es901695c
» https://doi.org/10.1021/es901695c -
Tabatabai MA. 1977. Effects of trace elements on urease activity in soils. Soil Biology and Biochemistry 9: 9-13. https://doi.org/10.1016/0038-0717 (77)90054-2
» https://doi.org/10.1016/0038-0717 (77)90054-2 -
Taran NY, Gonchar OM, Lopatko KG, Batsmanova LM, Patyka MV, Volkogon MV. 2014. The effect of colloidal solution of molybdenum nanoparticles on the microbial composition in rhizosphere of Cicer arietinum L. Nanoscale Research Letters 9: 289. https://doi.org/10.1186/1556-276x-9-289
» https://doi.org/10.1186/1556-276x-9-289 -
Thomas E, Rathore I, Tarafdar JC. 2017. Bioinspired production of molybdenum nanoparticles and its effect on chickpea (Cicer arietinum L). Journal of Bionanoscience 11: 153-159. https://doi.org/10.1166/jbns.2017.1425
» https://doi.org/10.1166/jbns.2017.1425 - Trenkel ME. 2010. Slow and Controlled-Release and Stabilized Fertilizer: An Option for Enhancing Nutrient Use Efficiency in Agriculture. International Fertilizer Industry Association, Paris, France.
-
van Veen JAR, Sudmeijer O, Emeis CA, Wit H. 1986. On the identification of molybdophosphate complexes in aqueous solution. Journal of the Chemical Society, Dalton Transactions 9: 1825-1831. https://doi.org/10.1039/DT9860001825
» https://doi.org/10.1039/DT9860001825 -
Xu M, Li D, Li J, Qin D, Hosen Y, Shen H, et al. 2013. Polyolefin-coated urea decreases ammonia volatilization in a double rice system of southern China. Agronomy Journal 105: 277-284. https://doi.org/10.2134/agronj2012.0222
» https://doi.org/10.2134/agronj2012.0222
-
Data availability statement
Data can be available on demand.
-
Declaration of use of AI Technologies
The authors have not used AI Technologies.
Edited by
-
Edited by:
Gabriel Ramatis Pugliese Andrade
Data can be available on demand.