 Field validation of an autonomous evaporation pan controller for smart irrigation management
ABSTRACT:
Efficient irrigation practices can significantly conserve water, and the use of automated controllers is essential for preventing operational errors. Although commercial controllers – especially timers – are widely used for irrigation, localized measurements of evapotranspiration (ET) are crucial for effective scheduling. The evaporation pan (Ep) is a well-known method for estimating ET; however, it requires manual readings. This study aimed to evaluate an automated controller designed to monitor water levels in the pan, assess irrigation requirements, and manage pumps and valves accordingly. The system connected the pan to an auxiliary tank with a floater, which relayed water fluctuations to a potentiometer. A microcontroller then converted this data into Ep and ET values, utilizing oversampling and decimation techniques to enhance resolution, achieving the lowest Ep reading of 0.0095 mm. Comparisons with manual micrometer measurements verified the accuracy of the automated Ep readings, showing discrepancies of less than 0.1 mm. Additionally, the ET measurements obtained by the controller were only 0.23 mm lower than those from a reference weather station. Therefore, in-field operations for irrigation in a pecan orchard demonstrated the controller's effectiveness in estimating water requirements, ultimately contributing to increased nut production and weight. Data transmission via the Internet of Things (IoT) also facilitates remote monitoring of the controller, enabling user interaction through text messages.
Keywords:
IoT; data acquisition; evaporation pan; hook gauge micrometer; irrigation schedule
Conserving irrigation water is crucial for sustainability and requires careful management of irrigation systems, which is essential for expanding the area under irrigation. In Brazil, irrigated crops and orchards cover 8.3 million hectares, and this area is expected to nearly double by 2040 (ANA, 2021).
Human errors in data acquisition, scheduling, and system operation can undermine the effectiveness of manual irrigation control. When errors arise in weather observations, they can subsequently impact irrigation scheduling (Rutland and Dukes, 2014). Thus, irrigation controllers can play a crucial role in promoting water conservation. Studies have indicated that dedicated controllers can lead to savings of 25 % to 45 % in irrigation water usage (Abioye et al., 2021; Jaiswal and Ballal, 2020), although implementing advanced techniques, such as predictive or fuzzy controls, remains challenging in practical applications.
Commercial controllers can operate on timers or utilize historical ET data, which can be adjusted on-site for specific trends (Davis and Dukes, 2010). Additionally, some smart controllers function independently, gathering weather data from in-field sensors to estimate ET (Rutland and Dukes, 2014). These devices can also trigger irrigation through feedback sensors in a closed loop, including soil moisture sensors (Haghverdi et al., 2021; McCready et al., 2009; Vick et al., 2017). Furthermore, signal-based controllers that receive weather or ET data via a network are also commonly used in irrigation systems.
Accurate estimation of ET is essential for managing irrigation in both manual and automated systems. A common method for estimating ET relies on standard Class A pan evaporation, utilizing daily Ep data and an appropriate coefficient (kp) in the formula ET = kpEp (Conceição, 2002; Custódio et al., 2013; Oliveira et al., 2012; Sentelhas and Folegatti, 2003). Evaporation measurements are obtained by assessing the change in water level between two sequential days using a hook gauge micrometer (Allen et al., 1998; Doorenbos and Pruitt, 1977). However, this manually operated instrument cannot be automated or integrated with irrigation controllers and automatic weather stations. This limitation hinders the practical application of the Class A evaporation pan, as highlighted by Stanhill (2002), who also regarded it as the most straightforward and most cost-effective approach to obtaining reference ET.
While commercially available equipment can automatically measure the water level in the pan, the associated costs may hinder widespread adoption. Alternative prototypes for measuring Ep have been developed using 3D printing technology (Tejkl and Kavka, 2021) and ultrasonic sensors (Terzic et al., 2010), yielding satisfactory results but often at a high cost. However, studies have reported promising advances in terms of cost-effectiveness and accessibility by utilizing a floater and a potentiometer to transmit data locally via Zigbee wireless network (Rasin et al., 2009).
Considering that the Internet of Things (IoT) facilitates data management and connects numerous devices, it is crucial to determine Ep automatically – not only to reduce the potential for human error but also to enable data collection from remote locations. IoT has enabled the development of techniques for controlling and scheduling irrigation in various studies (Abioye et al., 2021; Pinto et al., 2021). New methods and formulations for the remote management of irrigation are now available and should be integrated with on-site measurements (Miranda et al., 2005).
Automated controllers are essential devices for small farm operators, as they schedule irrigation and activate the irrigation system. Given this potential, this work evaluates a stand-alone controller designed to automatically measure Ep from a pan and facilitate autonomous irrigation of the landscape.
The controller was designed and tested at the Laboratório de Hidráulica e Irrigação in Cachoeira do Sul, Rio Grande do Sul State, Brazil, located on the campus of the Universidade Federal de Santa Maria. All components were assembled in the laboratory to evaluate the data-acquisition routines and simulate the controller's operational response to irrigation scheduling. Subsequently, the entire system was installed in the field to irrigate a pecan (Carya illinoinensis) orchard during the 2020-2021 and 2021-2022 growing seasons.
The water level was recorded in an auxiliary closed tank linked to the evaporation pan through a 0.5-inch-diameter tube, thus preventing any interference with the evaporation process. The auxiliary tank was equipped with a cover to minimize evaporation and facilitate access to its interior (Figure 1). Furthermore, the entire assembly was enclosed within a protective container to serving as a weather shelter.

Class A evaporation pan during installation with a tube at the bottom to link the auxiliary tank.
A floater level mechanism tracked the fluctuations in the tank's water level, with a rod transferring this motion to the axis of a high-precision 10 kΩ linear-type potentiometer (Figure 1). The rotation of its axis was linearly proportional to the voltage drop across its terminals. The combination of the floater at the potentiometer was selected for its superior sensitivity and stability compared to other previously tested solutions, such as ultrasonic and pressure transmitters.
The voltage signal from the potentiometer was connected to a microcontroller (Atmel AVR ATMega) operating at a voltage of 5 Vdc. The analog-to-digital converter (ADC) within the microcontroller reads the voltage from the potentiometer and converts it into a digital value. A hook gauge micrometer with a least count of 0.02 mm was employed to establish an equation that relates the microcontroller reading to the water level.
The microcontroller's ADC features a resolution of 10 bits, enabling the conversion of 1023 values (from 0 to 210 – 1) over a voltage span of 0-5 Vdc. Theoretically, if the entire micrometer range (70 mm) were utilized, the resolution would be approximately 0.068 mm, which is three times higher than that of the hook gauge. To enhance sensitivity, a routine incorporating oversampling and decimation was implemented. The initial process involved increasing the samples by "n" additional bits, utilizing 4n values of 10 bits, and summing them. Decimation was the subsequent step, in which the accumulated result was scaled by right shifting it "n" times. At the same time, normal averaging can degrade the signal-to-noise ratio; oversampling and decimation utilize fluctuations to enhance resolution. A signal that is oversampled by a factor of 4 uses four adjacent points to create a new data point.
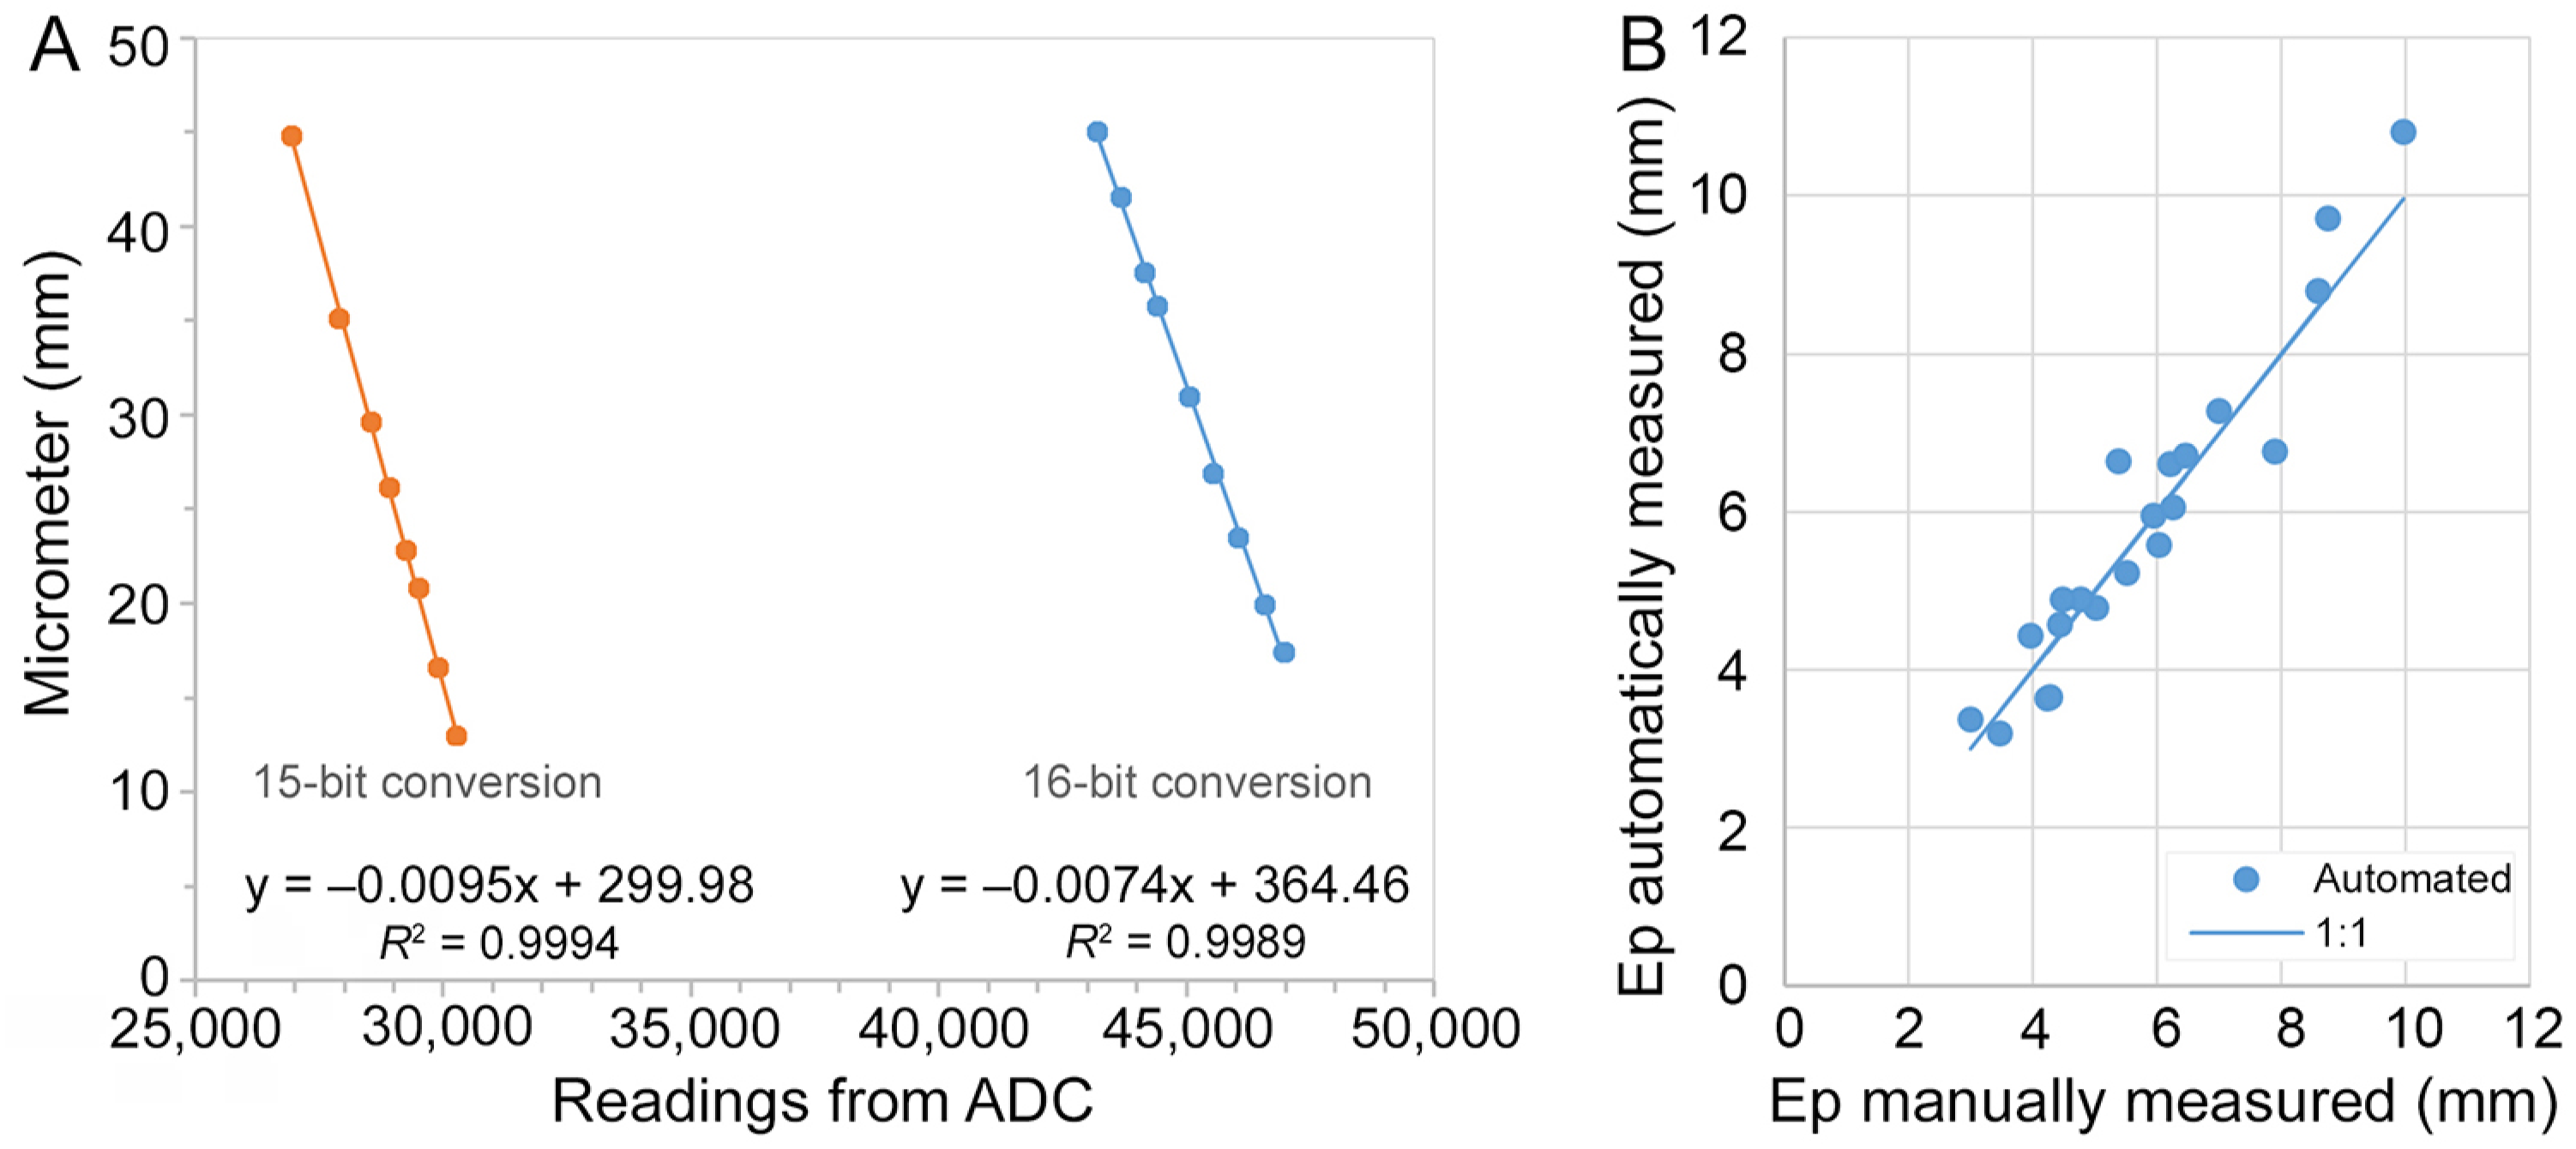
Using 15- and 16-bit signals (n = 5 or 6 additional bits), the least significant level is expected to be approximately 0.002 and 0.001 mm, respectively. The equations derived for automatic measurements yielded comparable water level estimates, as illustrated in Figure 2A, for both the 15-and 16-bit ADC resolutions. In theory, a higher resolution allows for more precise level readings, which is supported by the angular coefficients in the equations. When a 15-bit resolution was implemented through oversampling and decimation, the coefficient measured −0.0095, while it decreased to −0.0074 with 16-bit resolution, indicating a difference of 0.0095 and 0.0074 mm in water level for every digital variation from the ADC.

(A) Calibration equations for 15- and 16-bit resolution of the controller's analog-to-digital converter (ADC), and (B) Evaporation measured with a micrometer gauge vs. automated acquisition. Ep = evaporation pan; R2 = coefficient of determination.
Despite the excellent fitting and sensitivity offered by the 16-bit resolution, the 15-bit level was selected for the controller due to its superior stability during dynamic tests (data not presented). Following adjustments and modifications to the equation, it was calibrated against the hook micrometer. To assess hysteresis error in the sensor, the water level was both increased and decreased, revealing a maximum relative difference of 2.5 % [(micrometer-automatic)/micrometer] during the ascending trial at the minimum level. As a result, the automatic measurements can be considered accurate, exhibiting a low margin of error (Saretta et al., 2018).
The 15-bit equation was programmed into the microcontroller, enabling the determination of water levels at 1-minute intervals. During the field measurements of Ep, the automated micrometer aligned closely with trends observed in the hook gauge (Figure 2B) over several sampled days. The maximum daily Ep recorded by the micrometer was 10 mm, while the system indicated 11 mm. This represents a notably high Ep value for the region during the summer, indicating a substantial water demand from the crop. The average difference between the manual and automated gauges was 0.1 mm, which indicates a strong result.
In field operations, the controller was designed to monitor water levels in the evaporation pan and manage actuators such as solenoids and pumps. It also transmitted data through the Internet of Things (IoT), tracked irrigation failures, and communicated with users via short message service (SMS), as outlined by Pinto et al. (2021). Additionally, the system was capable of receiving instructions and providing feedback, including confirmations and notifications regarding erroneous requests or corrupted messages sent to the user.
The two primary failures to be monitored within the system are pressure fluctuations in the main line and variations in supply voltage that could potentially damage the motor. Poor voltage quality is a common issue in the region throughout the season. Voltage is monitored using diodes and resistors configured in a voltage-divider arrangement, generating a signal below 5 Vdc for the microcontroller's ADC. Pressure in the main line is assessed through a switch that triggers on low-pressure signals. When the pump is operational and this switch signal is off, the user receives an SMS notification to check for possible problems such as a broken pipe, insufficient pump priming, or a clogged filter.
An external battery ensured the microcontroller continued to operate during voltage outages, allowing for uninterrupted data acquisition. The real-time clock DS1307 maintained the date and time within the controller, even in the event of battery depletion. All collected data – such as water level in the pan, voltage, pressure, and a flag indicating the active sector – were securely stored as backups in a text file on a secure digital (SD) card.
The IoT communications facilitated by the controller allowed for remote monitoring of all variables through General Packet Radio Service (GPRS), which transmitted data to the cloud via the ThingSpeak.com platform (Jaiswal and Ballal, 2020; Pinto et al., 2021). This communication was made possible with a GSM800L circuit, which required a subscriber identity module (SIM) for network connectivity in machine-to-machine (M2M) operations, utilizing the Hypertext Transfer Protocol (HTTP) for data transmission.
The controller was installed in a pecan orchard to irrigate young Barton variety trees, which were six years old and spaced 7 m apart. The orchard was planted in a Ultisols Udult in Cachoeira do Sul (29°57’ S, 52°59’ W, altitude 120 m), Rio Grande do Sul State, Brazil. This area is characterized by a humid subtropical climate (Cfa), as classified by Köppen (Wrege et al., 2012). Cachoeira do Sul is the leading pecan-producing municipality in Brazil. Although pecan growers are just starting to invest in irrigation systems, an automated controller could significantly increase production levels.
The controller was used during the 2020-2021 and 2021-2022 pecan growing seasons in the southern hemisphere (Oct-Mar). Irrigation was scheduled daily based on crop evapotranspiration (ETc), considering Ep on the last day, with an average crop coefficient (kp) of 0.70 for local conditions (Conceição, 2002; Sentelhas and Folegatti, 2003). Daily reference evapotranspiration (ETo) was compared with data from an automated weather station (Penman-Monteith) at the Universidade Federal de Santa Maria (UFSM) campus, approximately 8 km away.
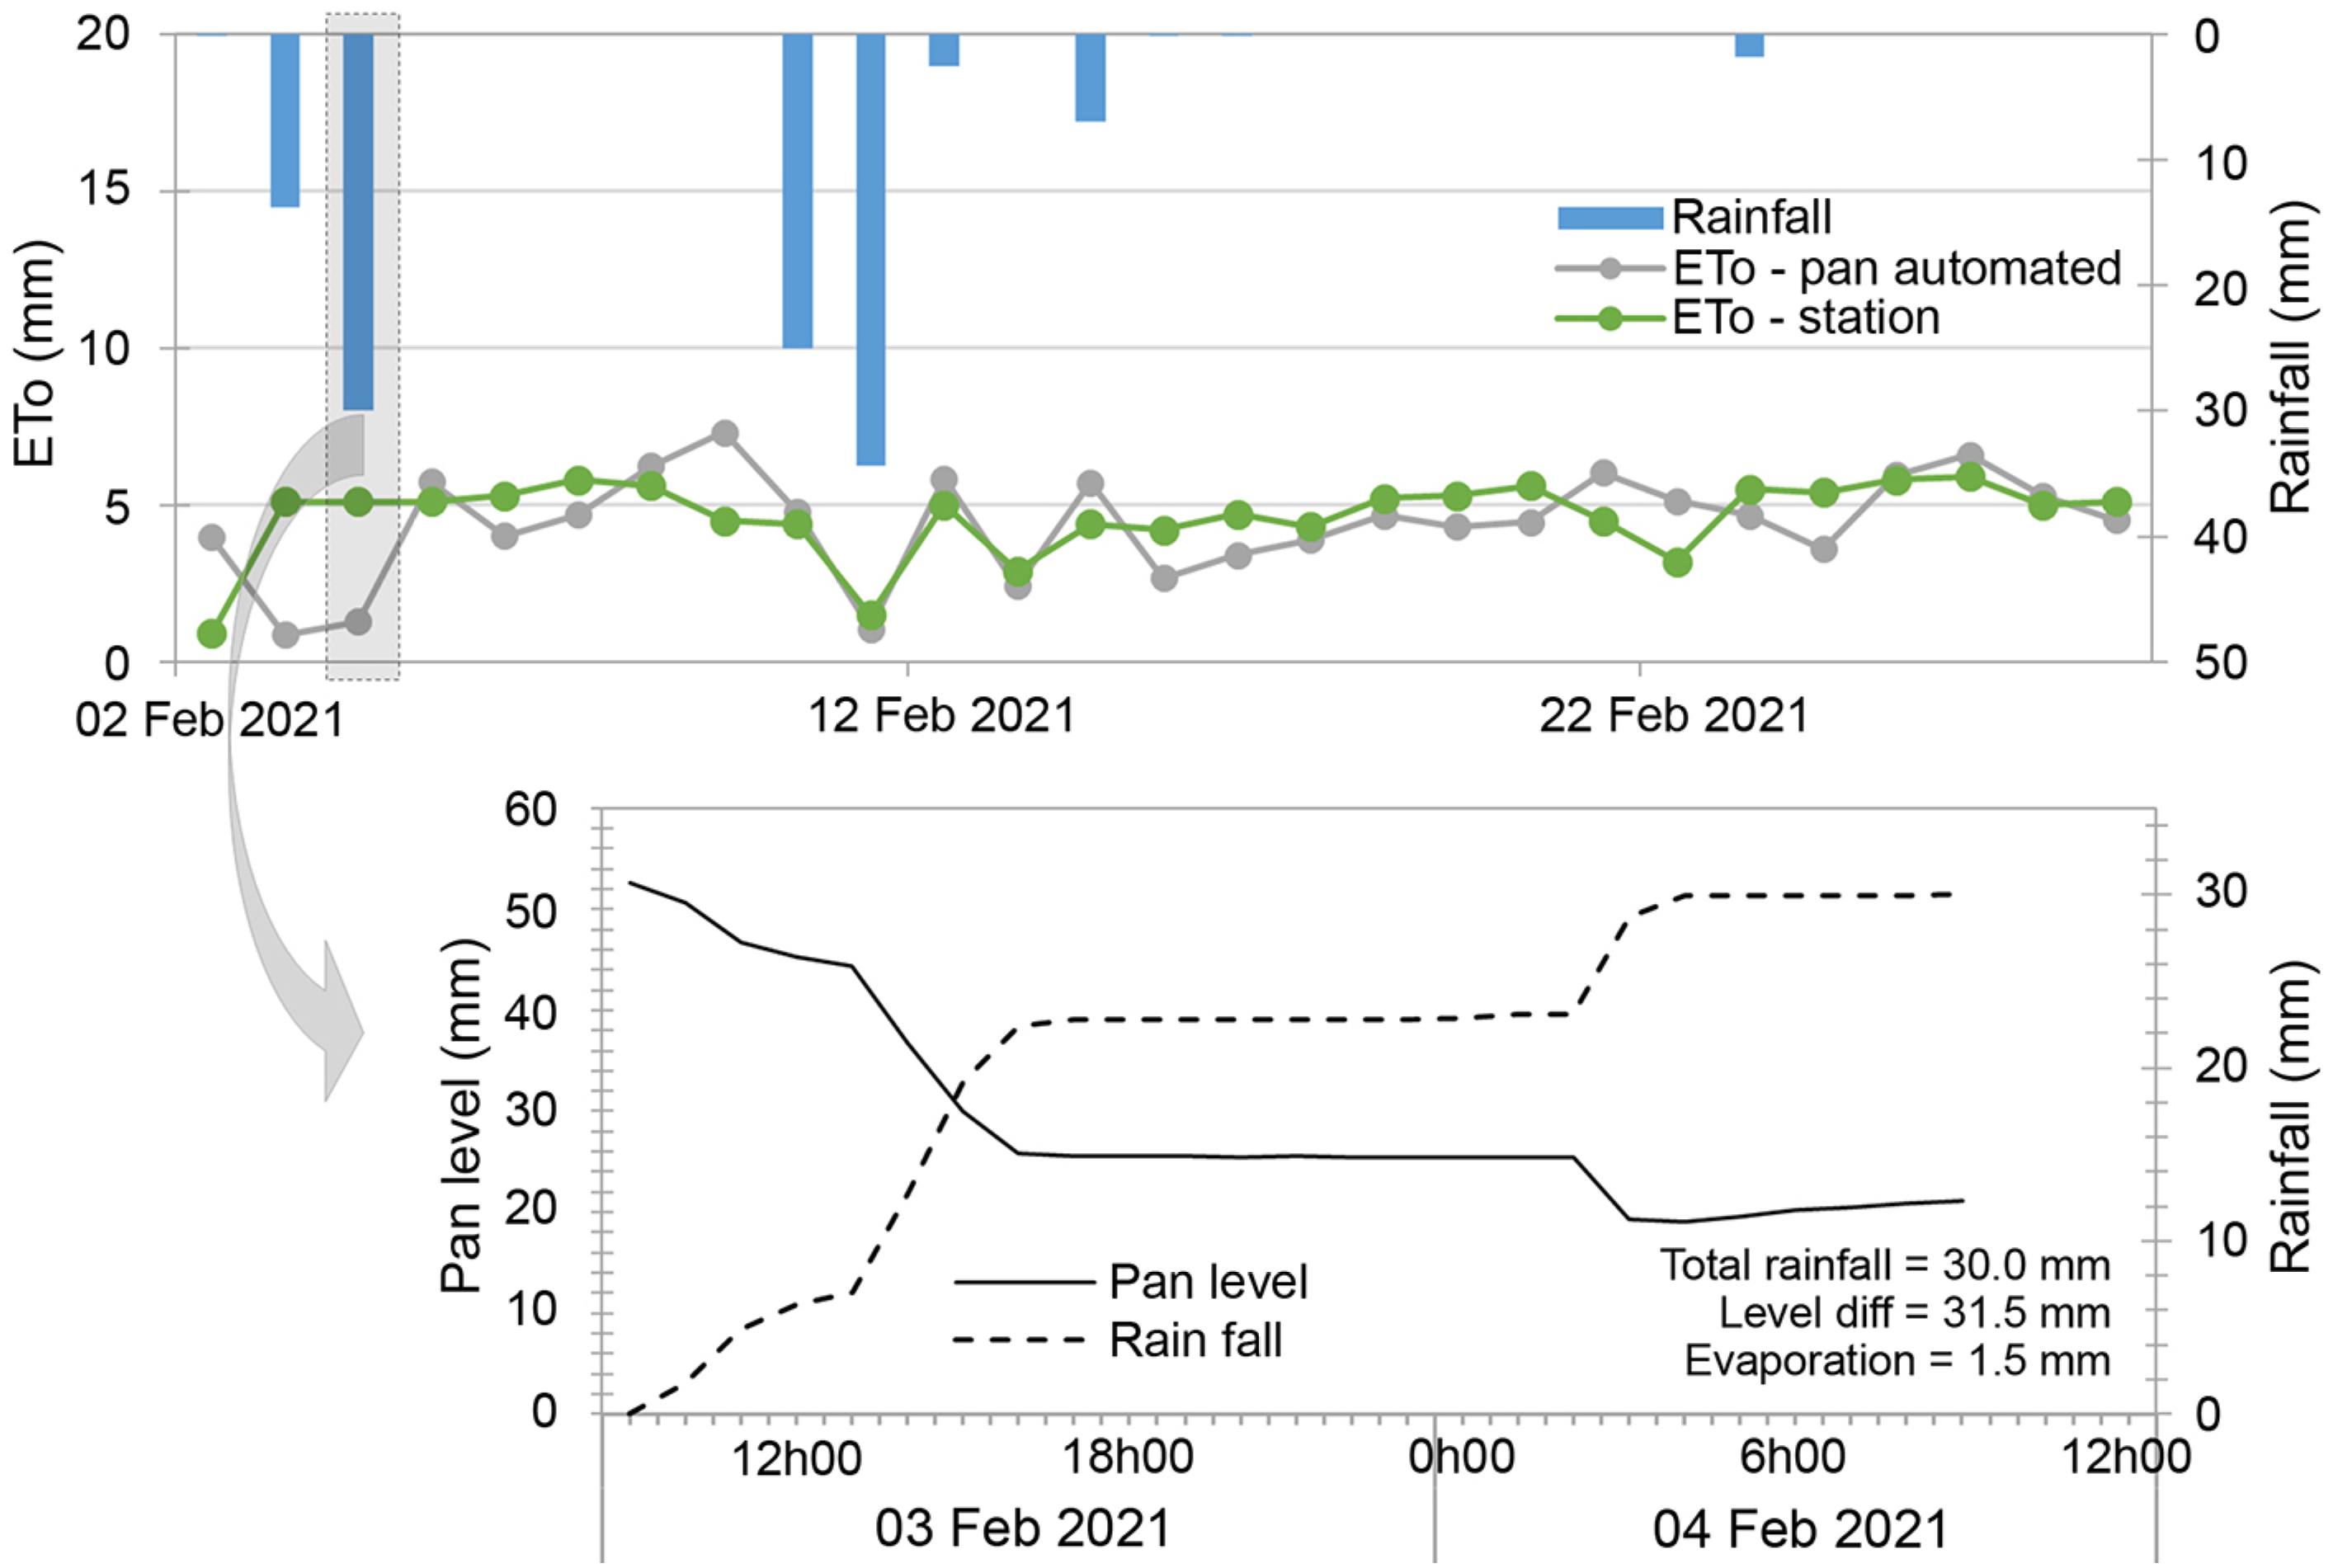
During several rain events, the estimated ETo from the automated Ep was lower than the readings from the campus weather station (Figure 3). This difference was attributed to water spilling from the pan, as the level was kept 50 to 75 mm below the tank's upper edge (Allen et al., 1998; Doorenbos and Pruitt, 1977).

Reference evapotranspiration (ETo) in the campus station, evaporation pan (Ep) and rainfall on-site during Feb 2021 (detailed pan level raising during a rainfall).
For days without rain, the ETo from Ep closely followed the ETo recorded at the station (Figure 3). For instance, in Feb 2021, the average daily ETo at the site was 4.41 mm, compared to 4.64 mm on campus. These differences are acceptable given the local conditions and methods used, confirming the average kp of 0.70. Furthermore, this finding aligns with the results from Haghverdi et al. (2021) and Rutland and Dukes (2014), which indicate a trend of overestimating ET when controllers rely solely on temperature measurements instead of employing standard ET methods.
Comparative studies between smart controllers, whether based on soil moisture or evapotranspiration (ET), and timer-based methods have shown a 21% reduction in weekly irrigation depth (Vick et al., 2017), in addition to numerous benefits, including decreased over-irrigation. Previous findings indicated that ET-based controllers can save between 25 % and 63 % of water (McCready et al., 2009), while those relying on soil moisture sensors reported savings ranging from 11 % to 53 %. A comparison of ET-based and timer-based controllers (Davis and Dukes, 2010) demonstrated satisfactory irrigation performance, despite variations caused by weather conditions. Accurate local ET measurement is essential for water conservation, and an on-site controller should be capable of monitoring weather data. As these studies illustrate, on-site weather monitoring is critical for informed decision-making; therefore, the automatic Ep measurements conducted in this research can be effectively integrated with existing controllers.
Utilizing an irrigation controller in conjunction with IoT technology, a reported reduction of approximately 25 % in water usage was achieved (Abioye et al., 2021). The authors proposed that future improvements should extend control to multiple devices through IoT, a functionality that is also incorporated in the controller developed in this study.
The automated measurements by the Ep system responded promptly to rising water levels caused by rainfall (Figure 3) from 03 Feb 2021 to 04 Feb 2021. This real-time monitoring capability was enabled by the controller's IoT communication, which also facilitated the observation of water level stabilization when the rainfall ceased. In dry summer regions, there is an increased demand for evapotranspiration (ET), leading to more frequent irrigation (Haghverdi et al., 2021). The controller is designed to schedule and initiate irrigation accordingly.
Young pecan trees exhibited a canopy fractional cover (fc) of approximately 10 %. A micro-sprinkler system was installed, featuring emitters that delivered a flow of 60 L h−1 per plant. To determine the irrigation requirements and schedule, crop coefficients (Kc) from Samani et al. (2011) were programmed into the microcontroller's memory. Adjustments for the localized application of water were calculated using a reduction factor defined as [Kl = fc + 0.5 (1 – fc)] (Frizzone et al., 2012).
A randomized block design was employed, featuring three replicates of both irrigated and non-irrigated plants. Each plot consisted of 16 plants, with sampling focused on tree production as well as the weight of nuts and kernels from the four central plants. The results were analyzed using variance analysis and a t-test to assess the response of the irrigated trees.
The current trial focused exclusively on comparing irrigated and non-irrigated treatments using an intelligent controller, deliberately excluding a timer-based treatment. This decision was supported by previous studies that have consistently shown the superior performance of smart controllers over timer-based systems (Davis and Dukes, 2010; McCready et al., 2009; Vick et al., 2017). Given this evidence, incorporating a timer-based condition was considered unnecessary for this study.
During the pecan growing season from 2020 to 2021, the total ETo amounted to 714 mm; however, rainfall reached only 414.5 mm and was unevenly distributed. As a result, the irrigation system was activated for a total of 87.6 h throughout the season, as the Kl factor reduced the ET. In contrast, during the 2021 - 2022 season, irrigation increased to 151.3 h, with ETo measuring 788.6 mm and rainfall totaling 506.6 mm.
Automated irrigation for pecan trees increased crop production compared to non-irrigated conditions during the second year of evaluation (Figure 4A-B). Due to the young trees being in their juvenile stage, their production remained low, which likely contributed to the lack of yield increase per tree during the first year of assessment. However, for the 2021-2022 season, production per tree increased by approximately 80 % with irrigation, further demonstrating that the ET obtained by Ep, measured by the controller, was both effective and reliable.

Young non-irrigated pecan production versus irrigated using the controller during (A) 2020-2021 and (B) 2021-2022 growing seasons. Means with the same letter are not significantly different from each other (p > 0.05 ANOVA followed by t-test).
Irrigation also led to an increase in nut weight from 5.3 to 6.7 g and a rise in kernel weight by approximately 27 % (from 2.6 to 3.3 g) during the first season. Similarly, after the 2021-2022 season, both nut weight and kernel filling exhibited an increase of more than 10 % with irrigation, despite receiving more rainfall than in the previous year. These gains surpassed those reported by De Marco et al. (2021) for irrigated young pecan trees in South America, which utilized an evaporation pan while applying a fixed volume of water every two days.
These increases indicate that the controller accomplished data acquisition, irrigation scheduling, and actuator control. Previous studies have also documented yield increases when irrigation was managed through manual measurements of Ep (Custódio et al., 2013; De Marco et al., 2021; Oliveira et al., 2012). Thus, the controller can significantly assist in this process.
The controller functioned reliably throughout the seasons, although power failures and low voltage alerts were detected at two points, generating notifications to users and necessitating event rescheduling. Four low-pressure alerts were recorded, requiring user intervention; one instance involved loss of pump prime, while three due to filter clogging. Regular operations resumed promptly after these issues were addressed.
Records from the SD card indicate that the controller successfully initiated and halted irrigation without any issues, although some IoT data points were missing due to limited local GPRS connectivity. Future advancements in transmission technology may enhance signal coverage. Additionally, the current scanning interval of one minute could be extended to once an hour or even once a day, as the data is not time-sensitive.
Currently, data loss may limit the full potential of the IoT in certain regions. More than 40 % of the planet experiences a lack of network coverage, attributed to both terrestrial and aerial dead zones. However, these challenges are expected to be addressed by 2030 with the advent of 6 G technology, which aims to provide global coverage for all devices (Singh et al., 2023).
Future enhancements may involve the installation of a drainage valve in the reservoir to prevent overflow during rainfall. A backup system could also be implemented to replenish the water level in the pan, reducing the necessity for manual refills. Additional measures could include the integration of IoT technology for controlling multiple devices or the incorporation of sensors, such as soil moisture sensors, to offer valuable irrigation feedback (Abioye et al., 2021; Jaiswal and Ballal, 2020; Miranda et al., 2005; Pinto et al., 2021).
Declaration of use of AI Technologies
Data availability statements
The data supporting this study's findings are available upon reasonable request to the corresponding author.
Acknowledgments
The author wishes to thank the Conselho Nacional de Desenvolvimento Científico e Tecnológico (CNPq) for the financial support through project n° 439123/2018-6.
I would like to express my gratitude to Edson Ortiz, CEO of the Divinut Company, for allowing the installation of the controller in the commercial orchard and for endorsing the importance of research on pecan crops.
Appreciation is also extended to Professor Gilberto Loguercio Collares from the Universidade Federal de Pelotas (UFPel) for lending the hook gauge micrometer and stilling well, essential equipment for this study.
References
-
Abioye EA, Abidin MSZ, Aman MN, Mahmud MSA, Buyamin S. 2021. A model predictive controller for precision irrigation using discrete lagurre networks. Computers and Electronics in Agriculture 181: 105953. https://doi.org/10.1016/j.compag.2020.105953
» https://doi.org/10.1016/j.compag.2020.105953 -
Agência Nacional de Águas [ANA]. 2021. Atlas irrigação: uso da água na agricultura irrigada. ANA, Brasília, DF, Brazil. Available at: https://www.ana.gov.br/atlasirrigacao/ [Accessed Dec 5, 2024] (in Portuguese).
» https://www.ana.gov.br/atlasirrigacao/ -
Allen RG, Pereira LS, Raes D, Smith M. 1998. Crop evapotranspiration: guidelines for computing crop water requirements. FAO, Rome, Italy. Available at: https://www.fao.org/4/x0490e/x0490e00.htm [Accessed Dec 10, 2024]
» https://www.fao.org/4/x0490e/x0490e00.htm -
Conceição MAF. 2002. Reference evapotranspiration based on class A pan evaporation. Scientia Agricola 59: 417-420. https://doi.org/10.1590/S0103-90162002000300001
» https://doi.org/10.1590/S0103-90162002000300001 -
Custódio AAP, Faria MA, Rezende FC, Morais AR, Leite Junior MCR. 2013. Irrigation management in pruned coffee tree crop. Engenharia Agrícola 33: 55-63. https://doi.org/10.1590/S0100-69162013000100007
» https://doi.org/10.1590/S0100-69162013000100007 -
Davis SL, Dukes MD. 2010. Irrigation scheduling performance by evapotranspiration-based controllers. Agricultural Water Management 98: 19-28. https://dx.doi.org/10.1016/j.agwat.2010.07.006
» https://dx.doi.org/10.1016/j.agwat.2010.07.006 -
De Marco R, Goldschmidt RJZ, Herter FG, Martins CR, Mello-Farias PC, Uberti A. 2021. The irrigation effect on nuts’ growth and yield of Carya illinoinensis Anais da Academia Brasileira de Ciências 93: e20181351. https://doi.org/10.1590/0001-3765202120181351
» https://doi.org/10.1590/0001-3765202120181351 - Doorenbos J, Pruitt WO. 1977. Guidelines for Predicting Crop Water Requirements. FAO, Rome, Italy (FAO Irrigation and Drainage Paper).
- Frizzone JA, Freitas PSL, Rezende R, Faria MA. 2012. Microirrigação: Gotejamento e Microaspersão. EDUEM, Maringá, PR, Brazil (in Portuguese).
-
Haghverdi A, Singh A, Sapkota A, Reiter M, Ghodsi S. 2021. Developing irrigation water conservation strategies for hybrid bermudagrass using an evapotranspiration-based smart irrigation controller in inland southern California. Agricultural Water Management 245: 106586. https://doi.org/10.1016/j.agwat.2020.106586
» https://doi.org/10.1016/j.agwat.2020.106586 -
Jaiswal S, Ballal MS. 2020. Fuzzy inference based irrigation controller for agricultural demand side management. Computers and Electronics in Agriculture 175: 105537. https://doi.org/10.1016/j.compag.2020.105537
» https://doi.org/10.1016/j.compag.2020.105537 -
McCready MS, Dukes MD, Miller GL. 2009. Water conservation potential of smart irrigation controllers on St. Augustinegrass. Agricultural Water Management 96: 1623-1632. https://doi.org/10.1016/j.agwat.2009.06.007
» https://doi.org/10.1016/j.agwat.2009.06.007 -
Miranda FR, Yoder RE, Wilkerson JB, Odhiambo LO. 2005. An autonomous controller for site-specific management of fixed irrigation systems. Computers and Electronics in Agriculture 48: 183-197. https://doi.org/10.1016/j.compag.2005.04.003
» https://doi.org/10.1016/j.compag.2005.04.003 -
Oliveira EL, Faria MA, Evangelista AWP, Melo PC. 2012. Response of Jatropha curcas crop to irrigation and potassium fertilization levels. Revista Brasileira de Engenharia Agrícola e Ambiental 16: 593-598 (in Portuguese, with abstract in English). https://doi.org/10.1590/S1415-43662012000600001
» https://doi.org/10.1590/S1415-43662012000600001 -
Pinto JSS, Camargo LC, Duarte SN. 2021. Development of a low-cost open-source platform connected to the internet for acquisition of environmental parameters and soil moisture. Engenharia Agrícola 41: 338-346. https://dx.doi.org/10.1590/1809-4430-Eng.Agric.v41n3p338-346/2021
» https://dx.doi.org/10.1590/1809-4430-Eng.Agric.v41n3p338-346/2021 -
Rasin Z, Hamzah H, Aras MSM. 2009. Application and evaluation of high power Zigbee based wireless sensor network in water irrigation control monitoring system. IEEE: 548-551. https://doi.org/10.1109/ISIEA.2009.5356380
» https://doi.org/10.1109/ISIEA.2009.5356380 -
Rutland DC, Dukes MD. 2014. Accuracy of reference evapotranspiration estimation by two irrigation controllers in a humid climate. Journal of Irrigation and Drainage Engineering 140: 04014011. https://doi.org//10.1061/(asce)ir.1943-4774.0000720
» https://doi.org//10.1061/(asce)ir.1943-4774.0000720 -
Samani Z, Bawazir S, Skaggs S, Longworth J, Piñon A, Tran V. 2011. A simple irrigation scheduling approach for pecans. Agriculture and Water Management 98: 661-664. https://doi.org/10.1016/j.agwat.2010.11.002
» https://doi.org/10.1016/j.agwat.2010.11.002 -
Saretta E, Camargo AP, Botrel TA, Frizzone JA, Koech R, Molle B. 2018. Test methods for characterising the water distribution from irrigation sprinklers: Design, evaluation and uncertainty analysis of an automated system. Biosystems Engineering 169: 42-56. https://doi.org/10.1016/j.biosystemseng.2018.01.011
» https://doi.org/10.1016/j.biosystemseng.2018.01.011 -
Sentelhas PC, Folegatti MV. 2003. Class A pan coefficients (Kp) to estimate daily reference evapotranspiration (ETo). Revista Brasileira de Engenharia Agrícola e Ambiental 7: 111-115. https://doi.org/10.1590/s1415-43662003000100018
» https://doi.org/10.1590/s1415-43662003000100018 -
Singh PR, Singh VK, Yadav R, Chaurasia SN. 2023. 6G networks for artificial intelligence-enabled smart cities applications: a scoping review. Telematics and Informatics Reports 9: 100044. https://doi.org/10.1016/j.teler.2023.100044
» https://doi.org/10.1016/j.teler.2023.100044 -
Stanhill G. 2002. Is the Class-A evaporation pan still the most practical and accurate meteorological method for determining irrigation water requirements? Agricultural and Forest Meteorology 112: 233-236. https://doi.org/10.1016/S0168-1923(02)00132-6
» https://doi.org/10.1016/S0168-1923(02)00132-6 -
Tejkl A, Kavka P. 2021. Automated low investment cost evaporometers (ALICEs). Applied Science 11: 4986. https://doi.org/10.3390/app11114986
» https://doi.org/10.3390/app11114986 -
Terzic J, Nagarajah CR, Alamgir M. 2010. Fluid level measurement in dynamic environments using a single ultrasonic sensor and support vector machine (SVM). Sensors and Actuators A: Physical 161: 278-287. https://doi.org/10.1016/j.sna.2010.05.005
» https://doi.org/10.1016/j.sna.2010.05.005 -
Vick RL, Grabow GL, Miller GL, Huffman RL. 2017. Water conservation potential of smart irrigation technologies in the Catawba-Wateree River Basin. Journal of Irrigation and Drainage Engineering 143: 04016079. https://doi.org/10.1061/(asce)ir.1943-4774.0001130
» https://doi.org/10.1061/(asce)ir.1943-4774.0001130 - Wrege MS, Steinmetz S, Reisser Júnior C, Almeida IR. 2012. Atlas climático da região Sul do Brasil: estados do Paraná, Santa Catarina e Rio Grande do Sul. Embrapa, Brasília, DF, Brazil (in Portuguese).