
 Factors influencing the prioritization of rival public value positions in Brazilian digital government initiatives
Abstract
Purpose This study aims to identify factors influencing the prioritization of rival public values, with Brazilian state governments as locus. The paper also proposes a conceptual model comprising the intervening factors and their relationships with the public and the value positions.
Design/methodology/approach This exploratory study used a qualitative cross-sectional design. A focus group was used as the method of data collection, with 27 civil servants from 13 Brazilian states, representing all geographic regions, serving as respondents. Data analysis was based on the rhetoric of public managers’ discourses in counterpoint to their practical actions regarding decisions on prioritizing public value positions.
Findings The government side was analyzed; however, the quantitative validation of the theoretical model remains to be conducted in further research.
Research limitations/implications The data analysis revealed that political issues are the primary variable influencing digital government decisions. Therefore, political leadership is the decisive factor driving the choices regarding digital initiatives. It may also indicate why the values adopted differ from those defended by political agents and explain the imperative of efficiency, as political decision-making can interfere with internal factors. The media was the only external factor identified.
Practical implications This research contributes to understanding the factors and variables that influence decision-making regarding digital government projects.
Social implications The study can help in understanding public value positions, promoting transparency, inclusion and improving governance. Government social media efforts are key in cultivating digital participation and engagement. This digital transformation in government is vital, aligning with the growing expectations of digital experiences, thus empowering citizens and enhancing the relationship between government and citizens.
Originality/value The proposed conceptual model makes a relevant theoretical contribution by illustrating the dynamics of prioritizing rival public value positions.
Public value; Value positions; Digital government; e-government; Digital services; Public services
 Thumbnail
 Thumbnail
 Thumbnail
 Thumbnail
 Thumbnail
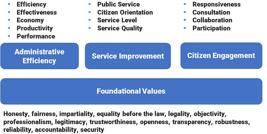
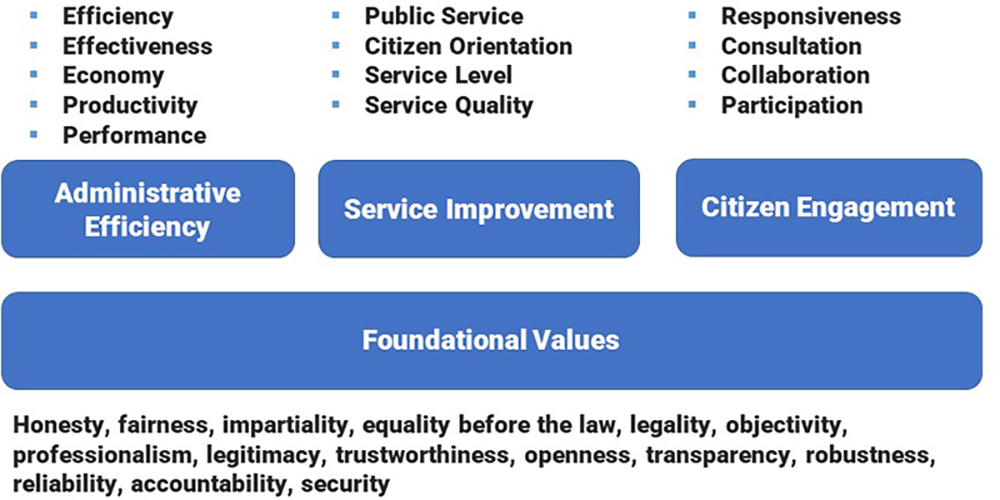 The image consists of a structured layout that categorizes key concepts into four main areas: Administrative Efficiency, Service Improvement, Citizen Engagement, and Foundational Values. The first three areas are presented within rounded rectangles and list various subcategories that relate to each main topic. Under Administrative Efficiency, terms such as Efficiency, Effectiveness, Economy, Productivity, and Performance are listed. Service Improvement includes Public Service, Citizen Orientation, Service Level, and Service Quality. Citizens' Engagement encompasses Responsiveness, Consultation, Collaboration, and Participation. The Foundational Values section is displayed below these categories and includes a comprehensive list of principles: Honesty, fairness, impartiality, equality before the law, legality, objectivity, professionalism, legitimacy, trustworthiness, openness, transparency, robustness, reliability, accountability, and security. Each section is clearly delineated, and the use of bold rectangles for main categories enhances visual organization.
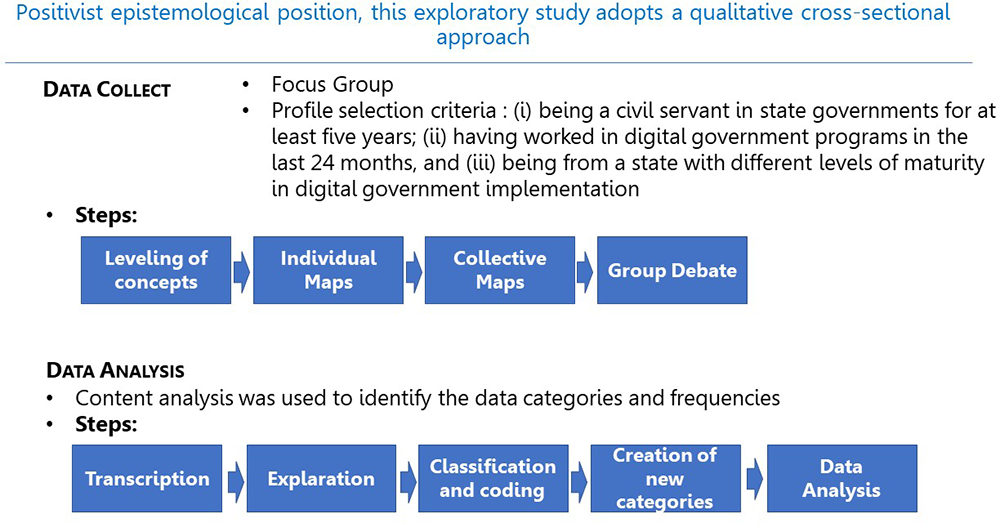 The flowchart illustrates the research design of a qualitative cross-sectional study based on a positivist epistemological position. Data collection involves focus groups, with participants selected as civil servants who have worked in digital government programs within the past 24 months and represent states with varying levels of implementation maturity. The collection steps include levelling of concepts, creation of individual maps, development of collective maps, and group debate. Data analysis follows a structured process involving transcription, exploration, classification and coding, creation of new categories, and final data analysis to identify patterns and frequencies.
 The matrix chart displays five numbered categories and one marked as non-important. Category 1 includes economy; category 2 lists performance and productivity; category 3 includes effectiveness, service level, and efficiency; category 4 lists consultation and service quality; and category 5 includes citizen orientation, public service, and responsiveness. The non-important group, labelled N I, contains collaboration and participation.
 The dot matrix chart lists twelve performance dimensions on the left, including efficiency, effectiveness, economy, productivity, performance, public service, citizen orientation, service level, service quality, responsiveness, consultation, collaboration, and participation. Each row contains a series of coloured dots representing varying levels of intensity or importance across multiple assessment categories. Efficiency and effectiveness show consistently high dot densities, while collaboration and participation exhibit moderate to high variation across the scale. The arrangement visually conveys comparative emphasis on different service performance factors in a structured, multi-category evaluation framework.
 This diagram illustrates various factors influencing public value positions, organized into four main categories: structural factors, public value positions, media factors, and cultural factors. Under structural factors, the elements include political factors, economic factors, personnel factors, and legal factors, depicted in ovals aligned vertically on the left. Public value positions feature three key elements: administrative efficiency, service improvement, and citizen engagement, represented in diamond shapes in the centre. Media factors include a single item, media influences, within an oval on the right, while cultural factors are presented with two items: intraorganizational culture and interorganizational culture, each in oval shapes below media influences. Arrows connecting the elements indicate relationships and interactions among the factors.