 Fabrication of graphene/TiO2 nanocomposites: structural characterization and enhanced ozone detection performance
ABSTRACT
Reliable monitoring of ground-level ozone is critical due to its severe impact on human health and ecosystems. This work presents a systematic investigation into the synthesis of nitrogen-doped graphene/TiO₂ (NGT) nanocomposites via a one-step hydrothermal strategy, specifically tailored for ultra-sensitive ozone detection. Advanced characterization techniques, including X-ray diffraction (XRD), X-ray photoelectron spectroscopy (XPS), and transmission electron microscopy (TEM), confirmed the successful anchoring of anatase TiO₂ nanoparticles (~13 nm) onto nitrogen-doped reduced graphene oxide sheets, resulting in a hierarchical porous structure with a significantly increased specific surface area of 165.3 m²/g. Gas sensing experiments revealed that the optimal NGT-3 composite delivers exceptional performance, exhibiting a high response of 25.8 toward 100 ppb ozone at a relatively low operating temperature of 100 °C. This represents a twelve-fold enhancement compared to the response of 2.1 observed for pure TiO₂. The sensor demonstrated rapid dynamic kinetics with response and recovery times of 18 s and 45 s, respectively, and achieved an ultra-low theoretical detection limit of 1.2 ppb. Additionally, the device showed a dominant response to 100 ppb O₃ over representative interfering gases, including NO₂ and CO, as confirmed by a dedicated selectivity bar chart; only limited cross-sensitivity to NO₂ was observed at comparable ppb levels, while the responses to CO and other tested gases remained much smaller. The superior sensing capabilities are elucidated through the synergistic coupling of p-n heterojunctions at the oxide-carbon interface and the introduction of electron-rich pyridinic nitrogen defects, which significantly lower the activation energy for surface redox reactions.
Keywords:
Hydrothermal synthesis; Chemiresistor; Nitrogen doping; Heterojunction; Sensitivity
1. INTRODUCTION
The detection of atmospheric ozone (O3), a principal component of photochemical smog, is of paramount importance for environmental monitoring and public health protection [1]. While stratospheric ozone provides a crucial shield against harmful ultraviolet radiation, ground-level ozone is a potent oxidant that poses significant risks to human health, causing respiratory illnesses and aggravating conditions such as asthma [2]. It also inflicts substantial damage on agricultural crops and ecosystems. Consequently, the development of reliable, sensitive, and selective sensors for real-time monitoring of trace-level ozone concentrations is a critical scientific and technological challenge [3]. Conventional ozone detection methods, including UV absorption photometry and chemiluminescence, are often expensive, bulky, and not suitable for widespread, distributed deployment. This has spurred intensive research into alternative sensing technologies, with solid-state chemiresistive gas sensors based on semiconductor metal oxides (SMOs) emerging as a particularly promising avenue.
Among various SMOs, titanium dioxide (TiO2) has attracted considerable attention for gas sensing applications owing to its chemical stability, low cost, non-toxicity, and inherent sensitivity to oxidizing and reducing gases. The sensing mechanism of n-type TiO2 relies on the modulation of its electrical resistance upon the adsorption and desorption of gas molecules on its surface [4]. For an oxidizing gas like ozone, adsorbed O3 molecules capture electrons from the TiO2 conduction band, leading to the formation of a wider electron depletion layer (EDL) and a measurable increase in resistance. However, pristine TiO2-based sensors often suffer from significant drawbacks, including high optimal operating temperatures (typically > 200 °C) which increase power consumption and pose safety concerns, as well as relatively low sensitivity, poor selectivity, and slow response and recovery kinetics [5]. These limitations have motivated extensive research into nanostructuring and the formation of composite materials to enhance the sensing performance of TiO2.
The advent of graphene, a two-dimensional monolayer of sp2-hybridized carbon atoms, has revolutionized materials science and opened new frontiers in sensing technology [6,7,8]. Graphene possesses an extraordinary combination of properties, including an ultrahigh theoretical specific surface area (~2630 m2/g), exceptional charge carrier mobility, remarkable mechanical strength, and excellent thermal conductivity [9]. These attributes make it an ideal candidate for integration with SMOs to create advanced nanocomposite sensing materials [10]. The incorporation of graphene or its derivatives, such as reduced graphene oxide (rGO), into a TiO2 matrix can synergistically enhance gas sensing performance through several mechanisms [11,12,13]. First, the high surface area of rGO sheets provides an abundance of active sites for gas molecule adsorption, effectively increasing the sensing surface [14]. Second, the formation of p-n heterojunctions at the interface between p-type rGO and n-type TiO2 can significantly amplify the resistance modulation upon gas exposure by expanding the EDL [15]. Third, the superior electrical conductivity of rGO can facilitate rapid charge transport, leading to faster response and recovery times [16].
Hydrothermal synthesis has been widely recognized as a versatile and effective method for fabricating graphene/TiO2 nanocomposites [17], offering advantages such as low cost, mild reaction conditions, and good control over the product’s morphology and crystallinity [18]. While numerous studies have explored the synthesis of graphene/TiO2 composites, the vast majority have focused on applications in photocatalysis, such as pollutant degradation and water splitting [19]. Although graphene–TiO2 heterostructures have been investigated for gas sensing, especially for oxidizing gases such as NO2, ozone-specific studies on TiO2/graphene systems remain comparatively limited. Accordingly, the novelty of the present work lies not in introducing graphene–TiO2 gas sensing per se, but in establishing a composition-dependent and nitrogen-engineered TiO2/rGO platform for low-ppb ozone detection under a unified experimental framework [20]. Optimizing this ratio is critical, as an insufficient amount of graphene may not provide enough heterojunctions or active sites, while an excessive amount could create electrical short-circuits that bypass the sensing interface, thereby diminishing the sensor response [21].
To further tailor the properties of these nanocomposites and unlock their full sensing potential, heteroatom doping has emerged as a powerful strategy [22]. Doping the graphene lattice with elements like nitrogen (N) can introduce structural defects, modulate the electronic band structure, and create more catalytically active sites for gas adsorption [23, 24]. Nitrogen doping can alter the local charge distribution on the graphene surface [25], which can enhance the interaction with specific gas molecules and facilitate charge transfer processes, thereby boosting both sensitivity and selectivity [26].
This research addresses a more specific gap than previously stated, namely the lack of a composition-optimized and nitrogen-engineered graphene/TiO2 system for ppb-level ozone sensing. Although graphene-modified TiO2 heterostructures have been widely investigated for photocatalysis and for gases such as NH3 and NO2, reports on ozone sensing using TiO2/graphene systems remain limited, and studies that simultaneously compare graphene loading and nitrogen-functionalized graphene within the same TiO2 platform are particularly scarce. In this context, the novelty of the present work lies in establishing a structure–composition–performance relationship across GT-1, GT-3, GT-5, and NGT-3, and in showing that nitrogen-functionalized graphene coupled with TiO2 yields a distinctly stronger ozone response than undoped graphene/TiO2 under otherwise comparable conditions. We employ a facile one-step hydrothermal method to synthesize a series of GT composites with varying nominal graphene precursor loadings (1, 3, and 5 wt%) and an optimized NGT composite. The study provides an exhaustive structural, morphological, and compositional characterization of the synthesized materials using a suite of advanced analytical techniques. Subsequently, the sensing performance of these materials towards ozone is systematically evaluated, focusing on the effects of rGO content, nitrogen doping, and operating temperature. The underlying sensing mechanisms are elucidated by correlating the material properties with the observed sensing performance, providing valuable insights for the rational design of next-generation, high-performance ozone sensors.
2. MATERIALS AND METHODS
2.1. Synthesis of graphene oxide (GO)
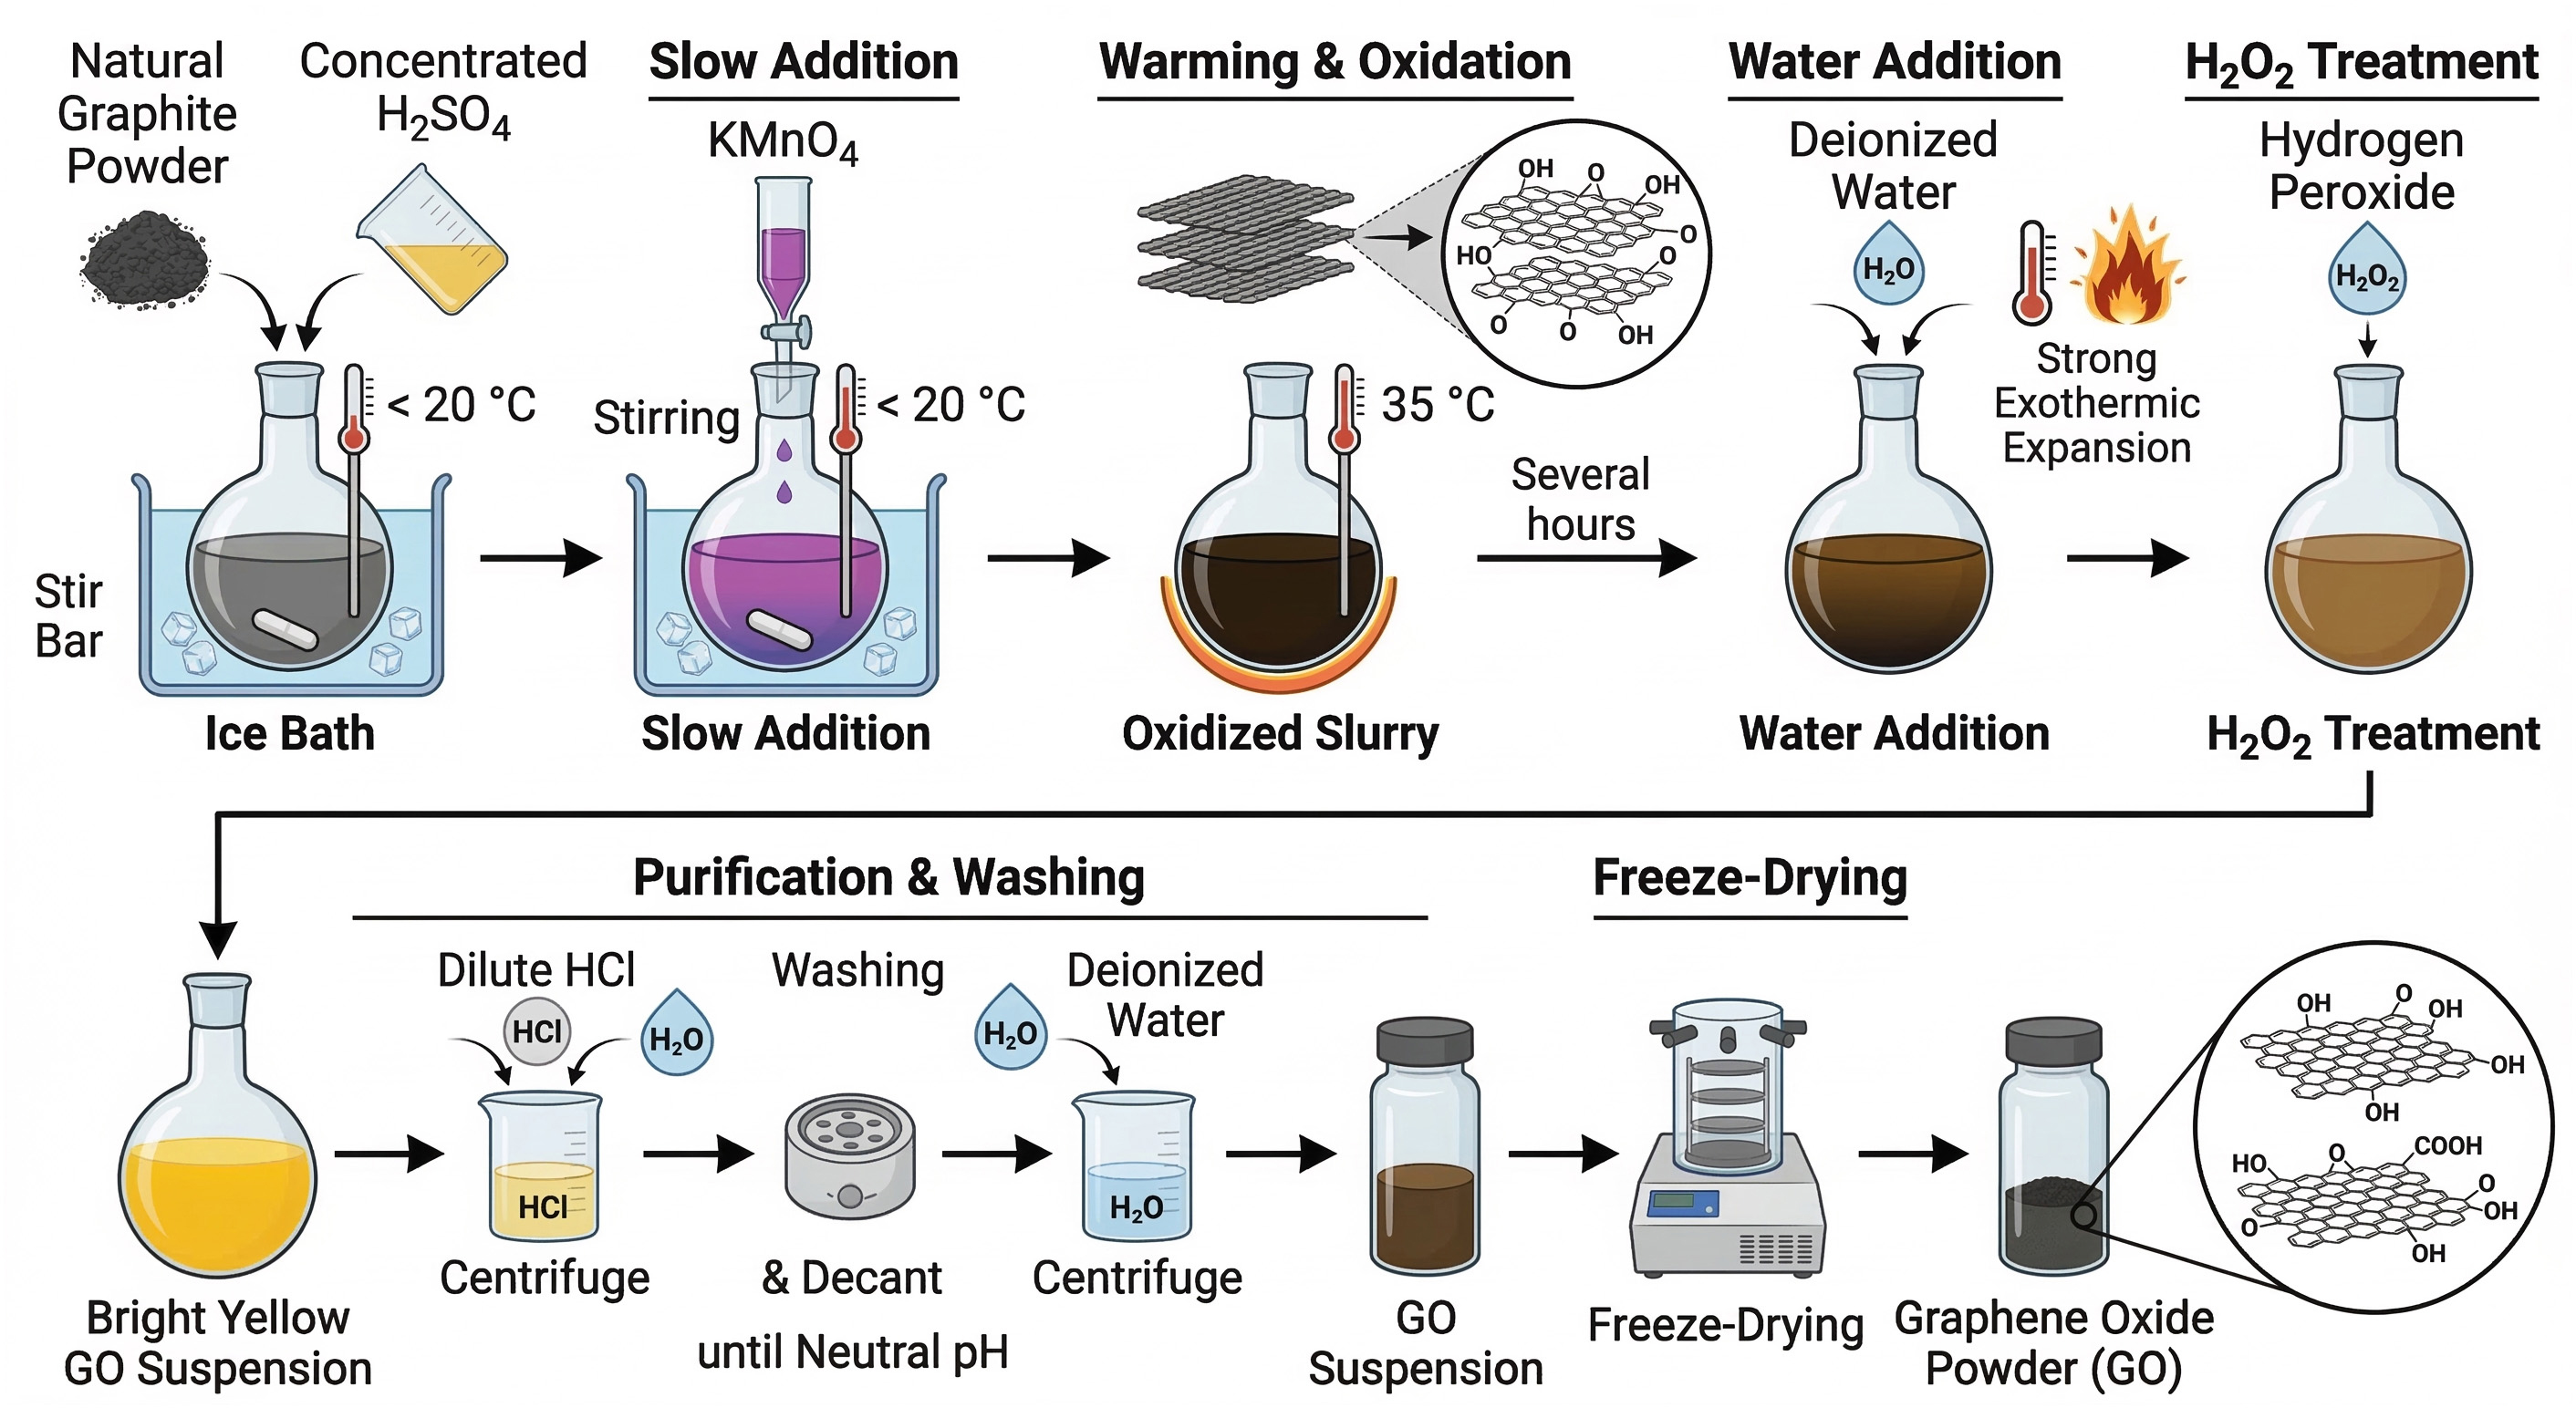
Graphene oxide was synthesized from natural graphite powder via a modified Hummers’ method [27] (Figure 1). In a typical procedure, 2.0 g of graphite powder was added to 50 mL of concentrated H2SO4 in an ice bath with constant stirring. Subsequently, 6.0 g of KMnO4 was slowly added to the suspension, ensuring the temperature was maintained below 20 °C. The mixture was then transferred to a 35 °C water bath and stirred for 2 hours, resulting in a thick, brownish paste. Following this, 100 mL of DI water was slowly added, causing a vigorous exothermic reaction, and the mixture was stirred for another 30 minutes. The reaction was terminated by adding 200 mL of DI water and 20 mL of 30% H2O2, which turned the solution color from dark brown to brilliant yellow. The resulting GO product was repeatedly washed with 5% HCl solution and DI water through centrifugation until the pH of the supernatant became neutral. The final GO powder was obtained after freeze-drying for 48 hours.
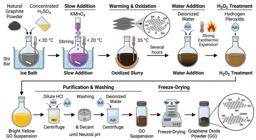
Schematic illustration of GO synthesis via the modified Hummers method, including graphite oxidation, exfoliation, purification, and freeze-drying to obtain GO powder.
2.2. Synthesis of graphene/TiO2 (GT) and N-doped graphene/TiO2 (NGT) nanocomposites
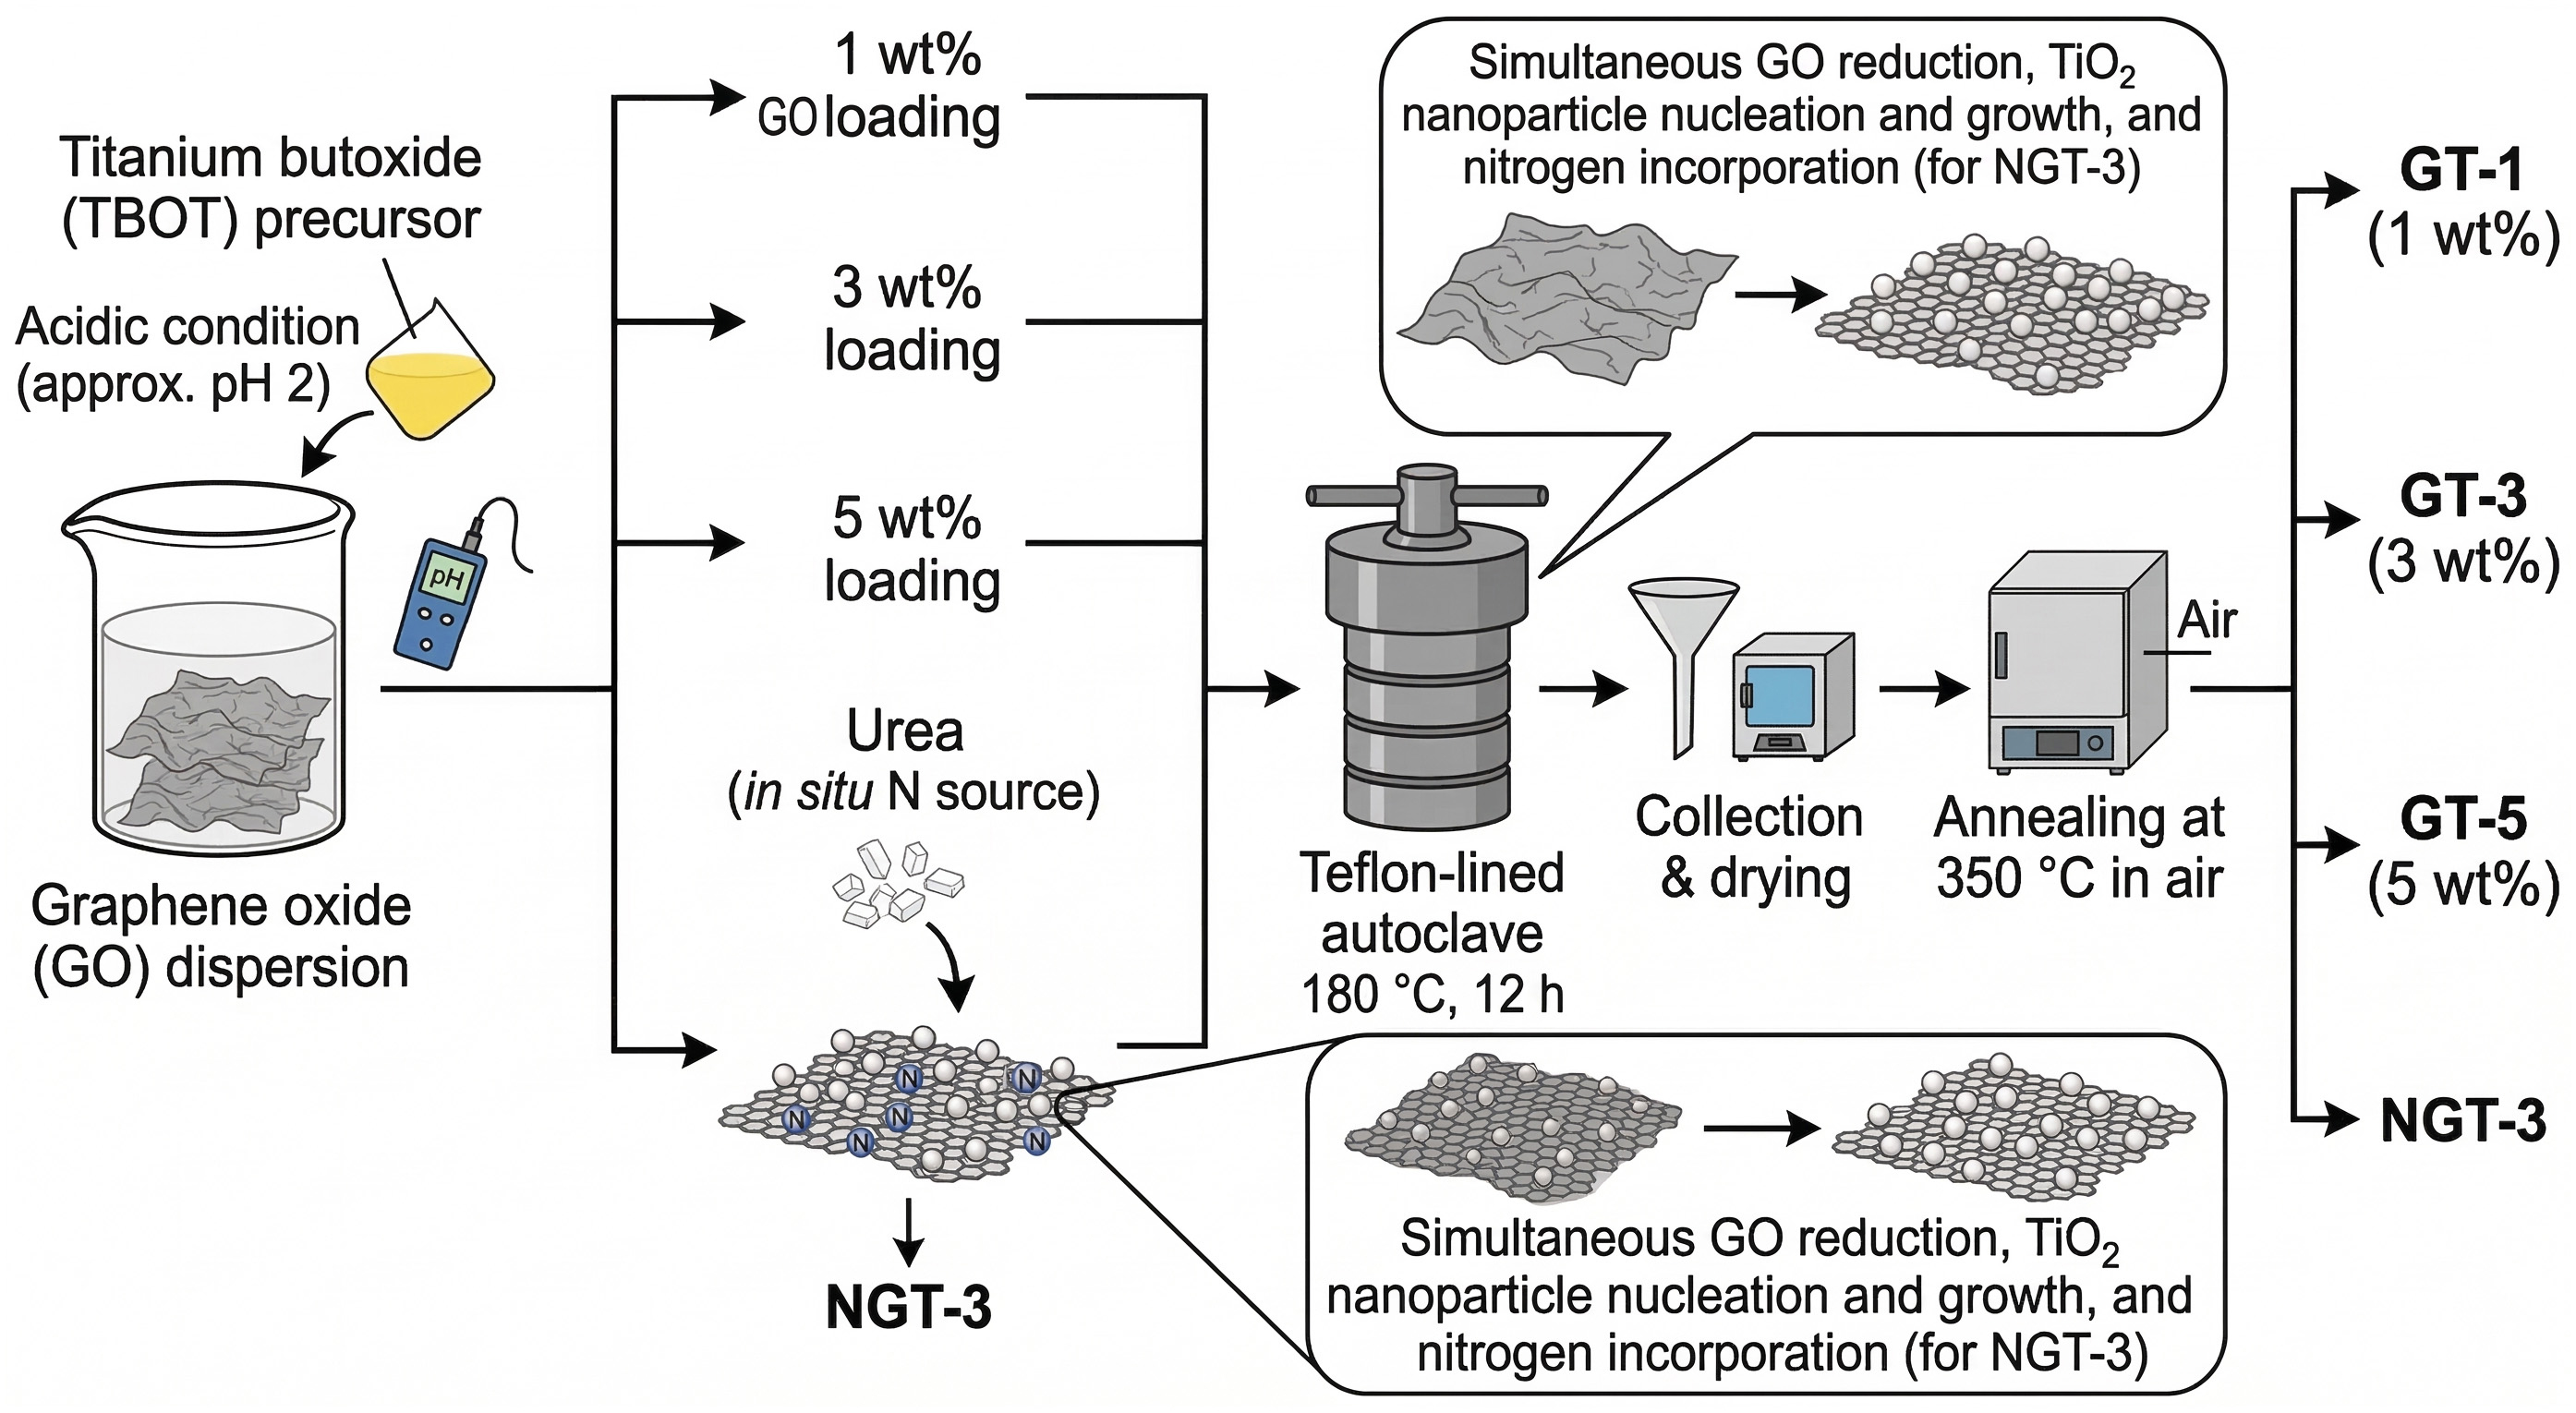
A series of graphene/TiO2 (GT) nanocomposites with varying theoretical precursor graphene loadings (1, 3, and 5 wt% with respect to the initial solids feed) were synthesized using a one-step hydrothermal method (Figure 2). The hydrothermal temperature of 180 °C and duration of 12 h were selected because these conditions are widely used to promote the simultaneous hydrolysis of titanium butoxide, crystallization of anatase TiO2, and reduction/assembly of GO without causing excessive particle growth or severe collapse of the graphene framework. The acidic condition (pH ≈ 2) was used to slow uncontrolled TBOT hydrolysis and to favor homogeneous nucleation of TiO2 on oxygen-containing sites of GO. The graphene loading series of 1, 3, and 5 wt% was designed to identify the balance between heterojunction density and conductive shielding. On this basis, the nitrogen-doped sample was constructed from the GT-3 composition because GT-3 already exhibited the best compromise between dispersion, surface area, and ozone response among the undoped GT series. Urea was selected as a low-cost in situ nitrogen precursor because its hydrothermal decomposition can introduce nitrogen-containing functionalities into the reduced graphene framework while preserving the TiO2 growth process. In the present work, the urea amount for preparing NGT-3 was fixed at 1.0 g based on literature precedent for hydrothermal urea-assisted N-doping of graphene-based materials, rather than through a separate full optimization of urea dosage within this study. This amount was found to yield stable nitrogen incorporation, as later confirmed by XPS, while maintaining the integrity of the TiO2/rGO composite framework [28].
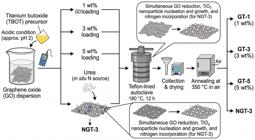
Schematic illustration of the one-step hydrothermal synthesis of GT and NGT nanocomposites, showing precursor mixing, hydrothermal growth of TiO₂ on graphene sheets, in situ urea-assisted nitrogen doping, and post-annealing to obtain the final sensing materials.
2.3. Sensor fabrication and measurement
For sensor fabrication, 20 mg of the synthesized nanocomposite powder was mixed with 0.1 mL of terpineol and a small amount of ethyl cellulose to form a homogeneous paste. This paste was then screen-printed onto an alumina substrate (5 mm × 5 mm) fitted with interdigitated Au electrodes (100 μm gap). The coated substrates were dried at 80 °C for 6 hours and then annealed at 350 °C for 2 hours in air to remove the organic binder. It should be noted that this annealing step may also induce limited surface chemical evolution of the graphene phase. Previous studies have shown that thermally reduced graphene oxide can continue to undergo deoxygenation and structural rearrangement near 350 °C, whereas defective rGO is also more reactive toward oxidation in air than pristine graphitic carbon. In the present system, however, the retained Raman D/G features, the broad graphitic XRD contribution, and the post-treatment XPS/FTIR signatures indicate that the carbon framework remained present after fabrication and that no severe oxidation-induced collapse of the TiO2/rGO heterostructure occurred. Therefore, the sensing behavior discussed here corresponds to the final annealed composite film used in the device. A Ni-Cr alloy heating wire was placed on the backside of the substrate to control the operating temperature [29]. The sensor was placed in a sealed test chamber (1 L volume) equipped with gas inlets and outlets. A Keithley 2450 SourceMeter was used to supply a constant DC voltage (1 V) and record the real-time resistance of the sensor. The operating temperature was controlled by a regulated DC power supply connected to the heater. Ozone gas was generated by a UV lamp ozone generator and diluted with dry synthetic air through calibrated flow control to achieve the desired concentrations. The delivered O3 concentration was continuously verified by an external ozone analyzer (2B Technologies Model 205) before and during sensing experiments, and the deviation between the nominal and analyzer-read concentrations was maintained within ±5% in the 10–200 ppb range. For each sensing condition, at least three independently fabricated devices were measured, and each concentration point was repeated in three consecutive cycles [30]. The sensor response (S) to ozone, an oxidizing gas, was defined as S = (Rg – Ra) / Ra, where Ra and Rg are the sensor’s stable electrical resistance in dry air and in the target gas, respectively. For the 30-day stability test, the baseline resistance in dry air (Ra) was recorded before each 100 ppb O3 exposure cycle so that both baseline drift and response retention could be evaluated over time. The response time (τres) and recovery time (τrec) were defined as the time required for the sensor to reach 90% of its final response and to return to 10% of its original baseline resistance after the target gas was removed, respectively [31].
3. RESULTS AND DISCUSSION
3.1. Structural and morphological characterization of nanocomposites
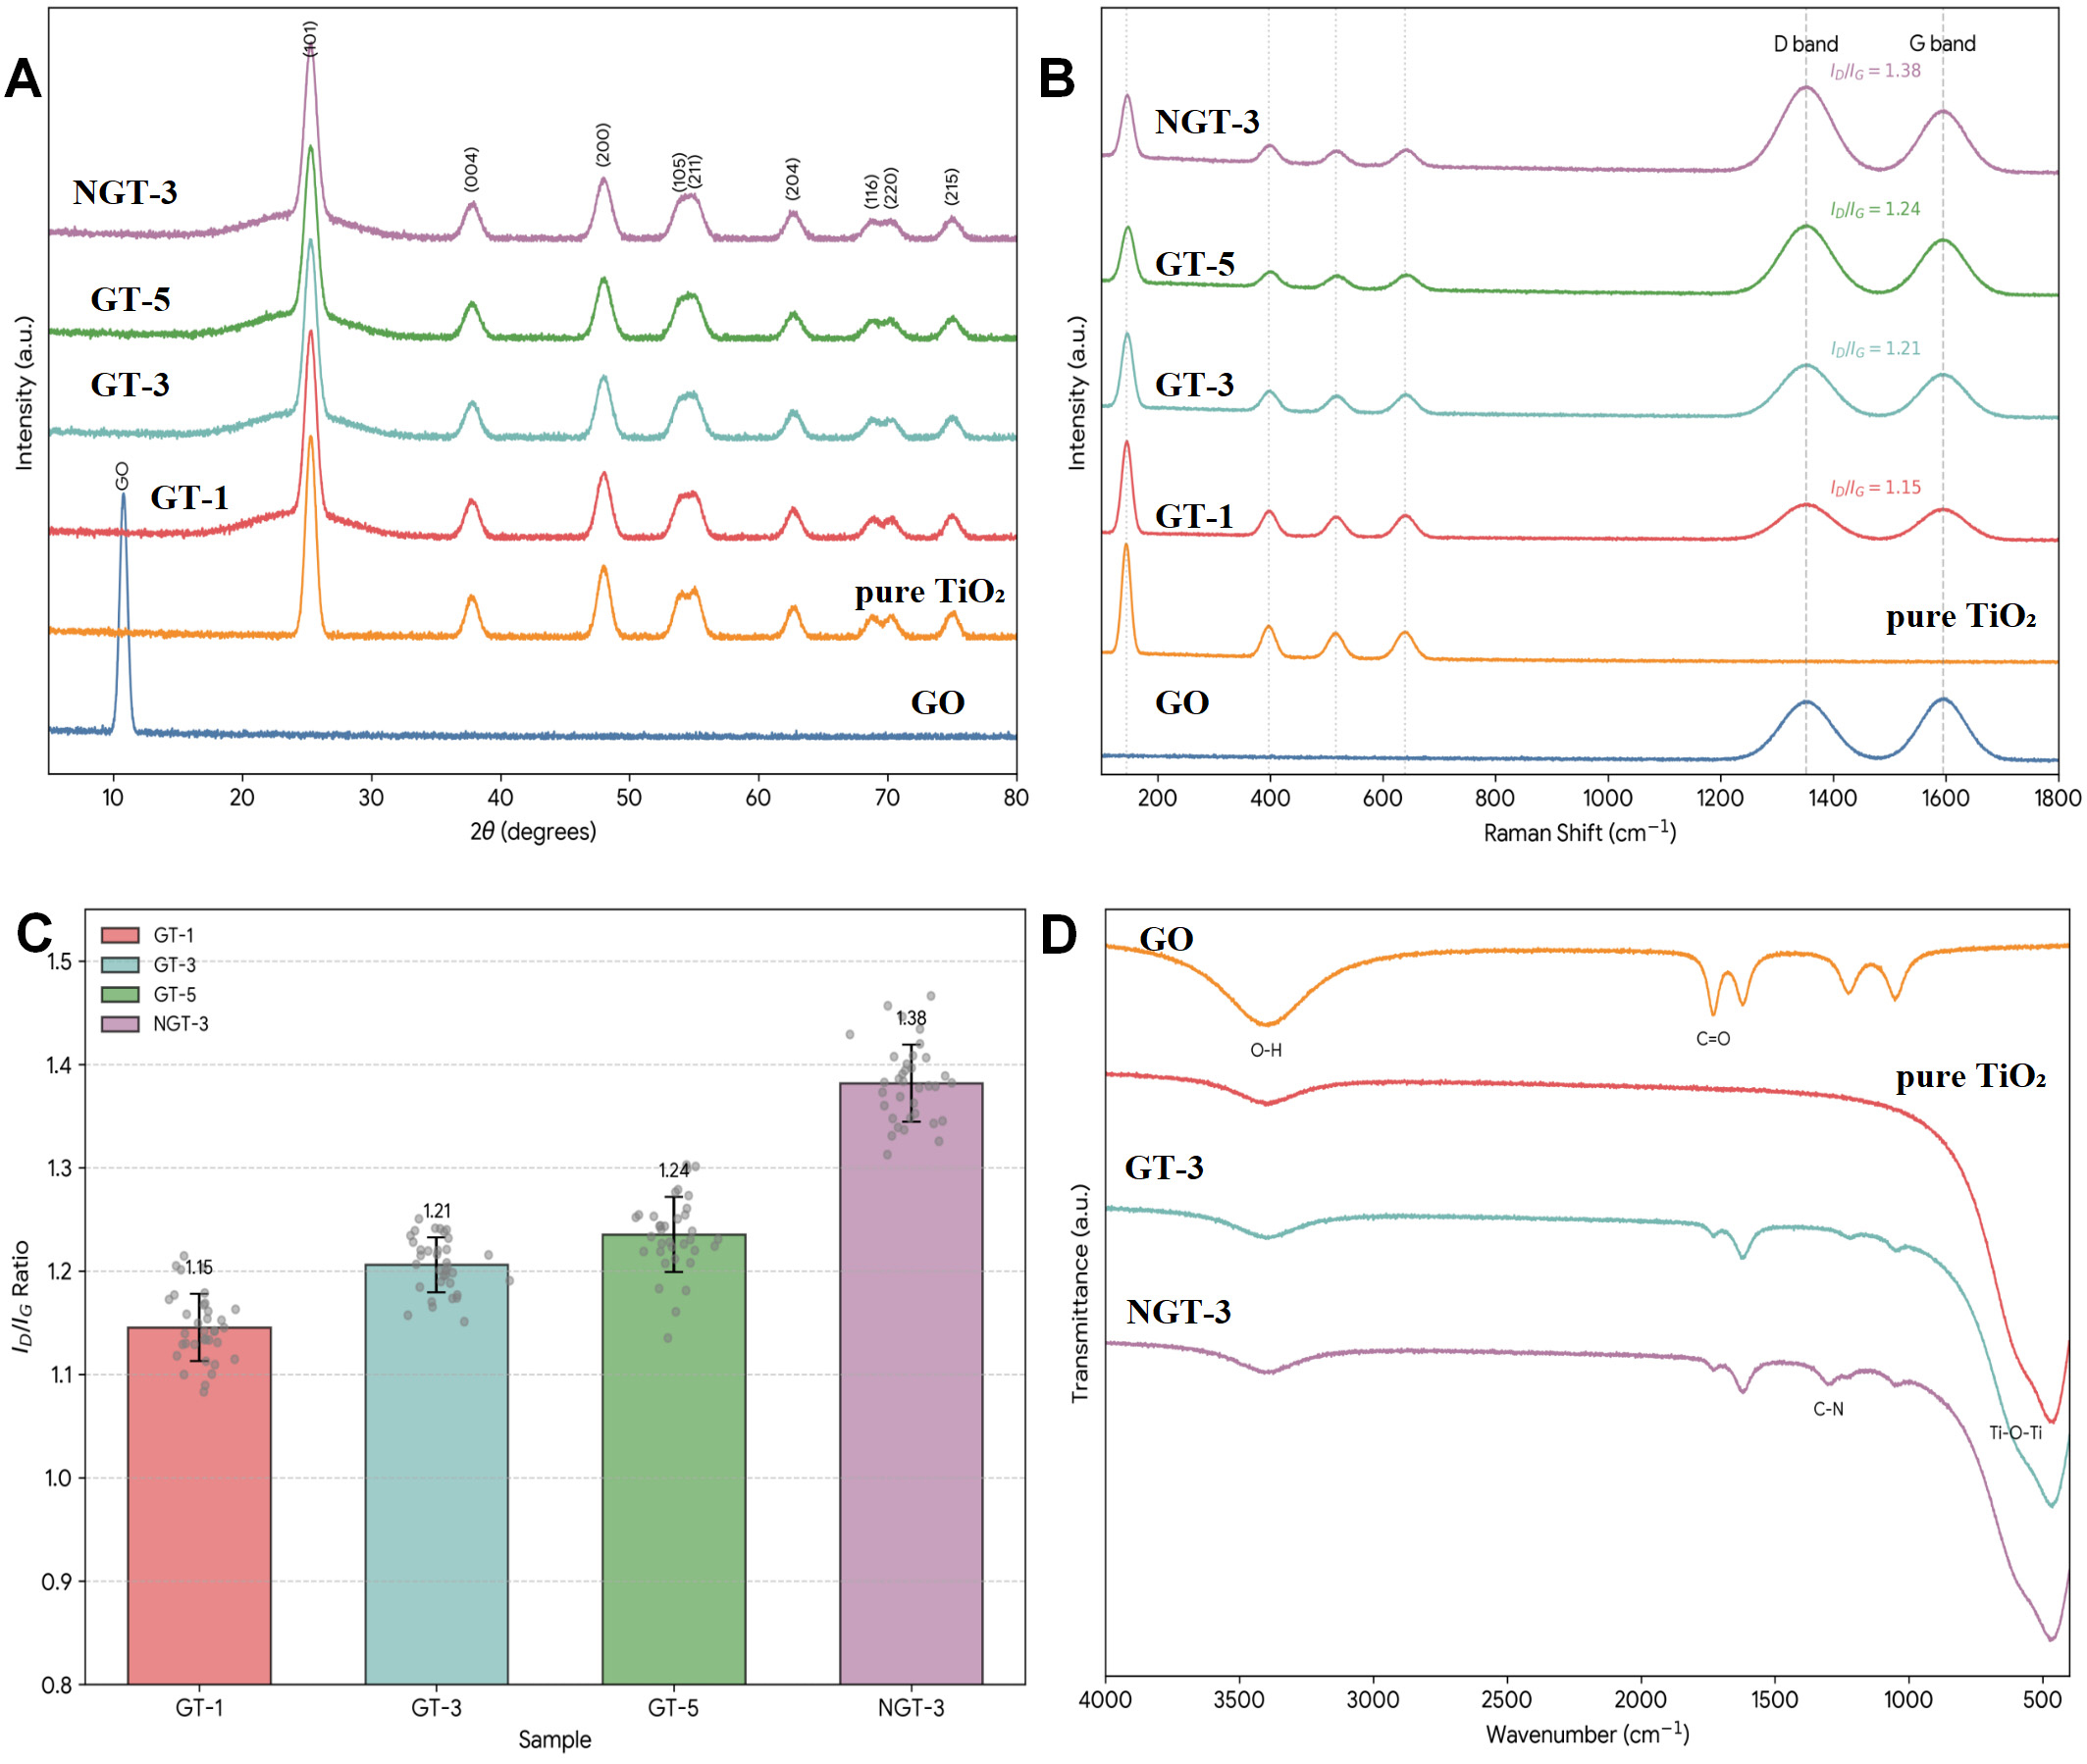
The crystalline structure and phase purity of the hydrothermally synthesized materials were investigated by X-ray diffraction, as shown in Figure 3A. The XRD pattern of the prepared GO exhibits a characteristic sharp diffraction peak at 2θ = 10.8°, corresponding to an interlayer spacing of 0.82 nm, which is indicative of the successful oxidation of graphite and the intercalation of oxygen-containing functional groups. The pattern for pure TiO2 displays well-defined diffraction peaks at 2θ values of 25.3°, 37.8°, 48.0°, 53.9°, 55.1°, 62.7°, 68.8°, 70.3°, and 75.0°, which can be indexed to the (101), (004), (200), (105), (211), (204), (116), (220), and (215) crystal planes of the anatase phase of TiO2 (JCPDS Card No. 21-1272), respectively [32]. No peaks corresponding to rutile or brookite phases were detected, confirming the phase purity of the synthesized TiO2. For all the GT and NGT nanocomposites, the characteristic peak of GO disappears, and a very weak and broad diffraction hump appears around 23-26°, overlapping with the strong TiO2 (101) peak. This disappearance of the GO peak and the emergence of a broad feature associated with the (002) plane of graphitic carbon indicates the effective reduction of GO to rGO during the hydrothermal and subsequent annealing processes [33]. The diffraction patterns of all composites are dominated by the peaks of anatase TiO2, suggesting that the incorporation of rGO and nitrogen doping did not alter the primary crystal phase of TiO2. However, a slight decrease in the intensity and broadening of the TiO2 peaks is observed in the composites compared to pure TiO2, which suggests that the rGO sheets may inhibit the crystal growth of TiO2 nanoparticles to some extent. The average crystallite sizes of the TiO2 nanoparticles were calculated from the full width at half maximum (FWHM) of the most intense (101) peak using the Scherrer equation, D = Kλ / (βcosθ). The calculated values are summarized in Table 1. The pure TiO2 exhibits an average crystallite size of 16.5 nm, while the sizes for GT-1, GT-3, GT-5, and NGT-3 are 14.2 nm, 13.1 nm, 12.5 nm, and 12.8 nm, respectively. This trend confirms that the rGO matrix serves as a support that limits the agglomeration and growth of TiO2 nanocrystals, resulting in smaller particle sizes, a desirable feature for gas sensing applications.
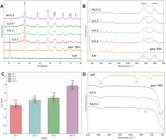
(A) XRD patterns of as-prepared GO, pure TiO₂, and the GT-1, GT-3, GT-5, and NGT-3 nanocomposites. (B) Raman spectra of pure TiO₂, GT-1, GT-3, GT-5, and NGT-3 nanocomposites. (C) Bar chart showing the calculated ID/IG ratios from the Raman spectra for the GT and NGT nanocomposites. (D) FTIR spectra of GO, pure TiO₂, GT-3, and NGT-3 nanocomposites.
Crystallite size, Raman Iₙ/Iₙ ratio, and BET surface area analysis of the synthesized samples.
Raman spectroscopy was employed to further investigate the structural characteristics of the nanocomposites, particularly the states of carbon and TiO2. As shown in Figure 3B, the Raman spectrum of pure TiO2 exhibits prominent peaks at 144 cm−1 (Eg), 397 cm−1 (B1g), 516 cm−1 (A1g + B1g), and 639 cm−1 (Eg), which are the characteristic vibrational modes of the anatase TiO2 phase, consistent with the XRD results [34]. For the GT and NGT composites, these anatase peaks are still clearly visible, although they are slightly broadened and shifted, which could be attributed to the quantum confinement effect in the smaller TiO2 nanocrystals and the interfacial interaction with the rGO sheets. More importantly, two distinct bands appear in the spectra of the composites: the D band at approximately 1352 cm−1 and the G band at approximately 1595 cm−1. The G band corresponds to the E2g phonon mode of sp2-hybridized carbon atoms, representing the graphitic lattice structure, while the D band is associated with the breathing mode of A1g symmetry and is activated by structural defects, vacancies, and disorder in the carbon lattice. The intensity ratio of the D band to the G band (ID/IG) is a widely used parameter to quantify the degree of disorder and the number of defects in graphitic materials. The calculated ID/IG ratios for the samples are presented in Table 1 and graphically in Figure 3C. The ratios for GT-1, GT-3, and GT-5 are 1.15, 1.21, and 1.24, respectively. These values are significantly higher than that of pristine graphite (typically <0.2), confirming the presence of abundant defects in the rGO sheets, which are introduced during the chemical oxidation and subsequent hydrothermal reduction processes. Notably, the NGT-3 sample exhibits the highest ID/IG ratio of 1.38, indicating that nitrogen doping has introduced additional structural defects and disorder into the graphene lattice. These defect sites are expected to serve as active centers for gas molecule adsorption, potentially enhancing the sensing performance [35].
FTIR spectroscopy was performed to identify the surface functional groups and confirm the chemical changes during the synthesis process [36]. The FTIR spectra of GO, pure TiO2, GT-3, and NGT-3 are displayed in Figure 3D. The spectrum of GO shows several characteristic absorption bands: a broad peak centered at ~3400 cm−1 due to O-H stretching vibrations of hydroxyl groups and adsorbed water molecules, a peak at ~1730 cm−1 corresponding to C=O stretching in carboxyl groups, a peak at ~1620 cm−1 from the skeletal vibrations of unoxidized graphitic domains (C=C), a peak at ~1225 cm−1 related to C-O-C stretching of epoxide groups, and a peak at ~1050 cm−1 attributed to C-OH stretching [37]. In the spectra of both pure TiO2 and the composites, the strong, broad absorption band below 800 cm−1 is assigned to the stretching vibrations of Ti-O and Ti-O-Ti bonds in the TiO2 lattice [38, 39]. For the GT-3 and NGT-3 composites, the intensities of the peaks associated with oxygen-containing functional groups (C=O, C-O-C, C-OH) are significantly diminished compared to the GO spectrum. This observation provides strong evidence for the effective deoxygenation and reduction of GO to rGO during the hydrothermal treatment. For the NGT-3 sample, a new weak shoulder peak appears around 1250-1350 cm−1, which could be associated with C-N stretching vibrations, suggesting the successful incorporation of nitrogen atoms into the carbon lattice. The persistence of a weak O-H band in the composites indicates the presence of some residual hydroxyl groups or adsorbed water, which can be beneficial for gas sensing by providing active adsorption sites.
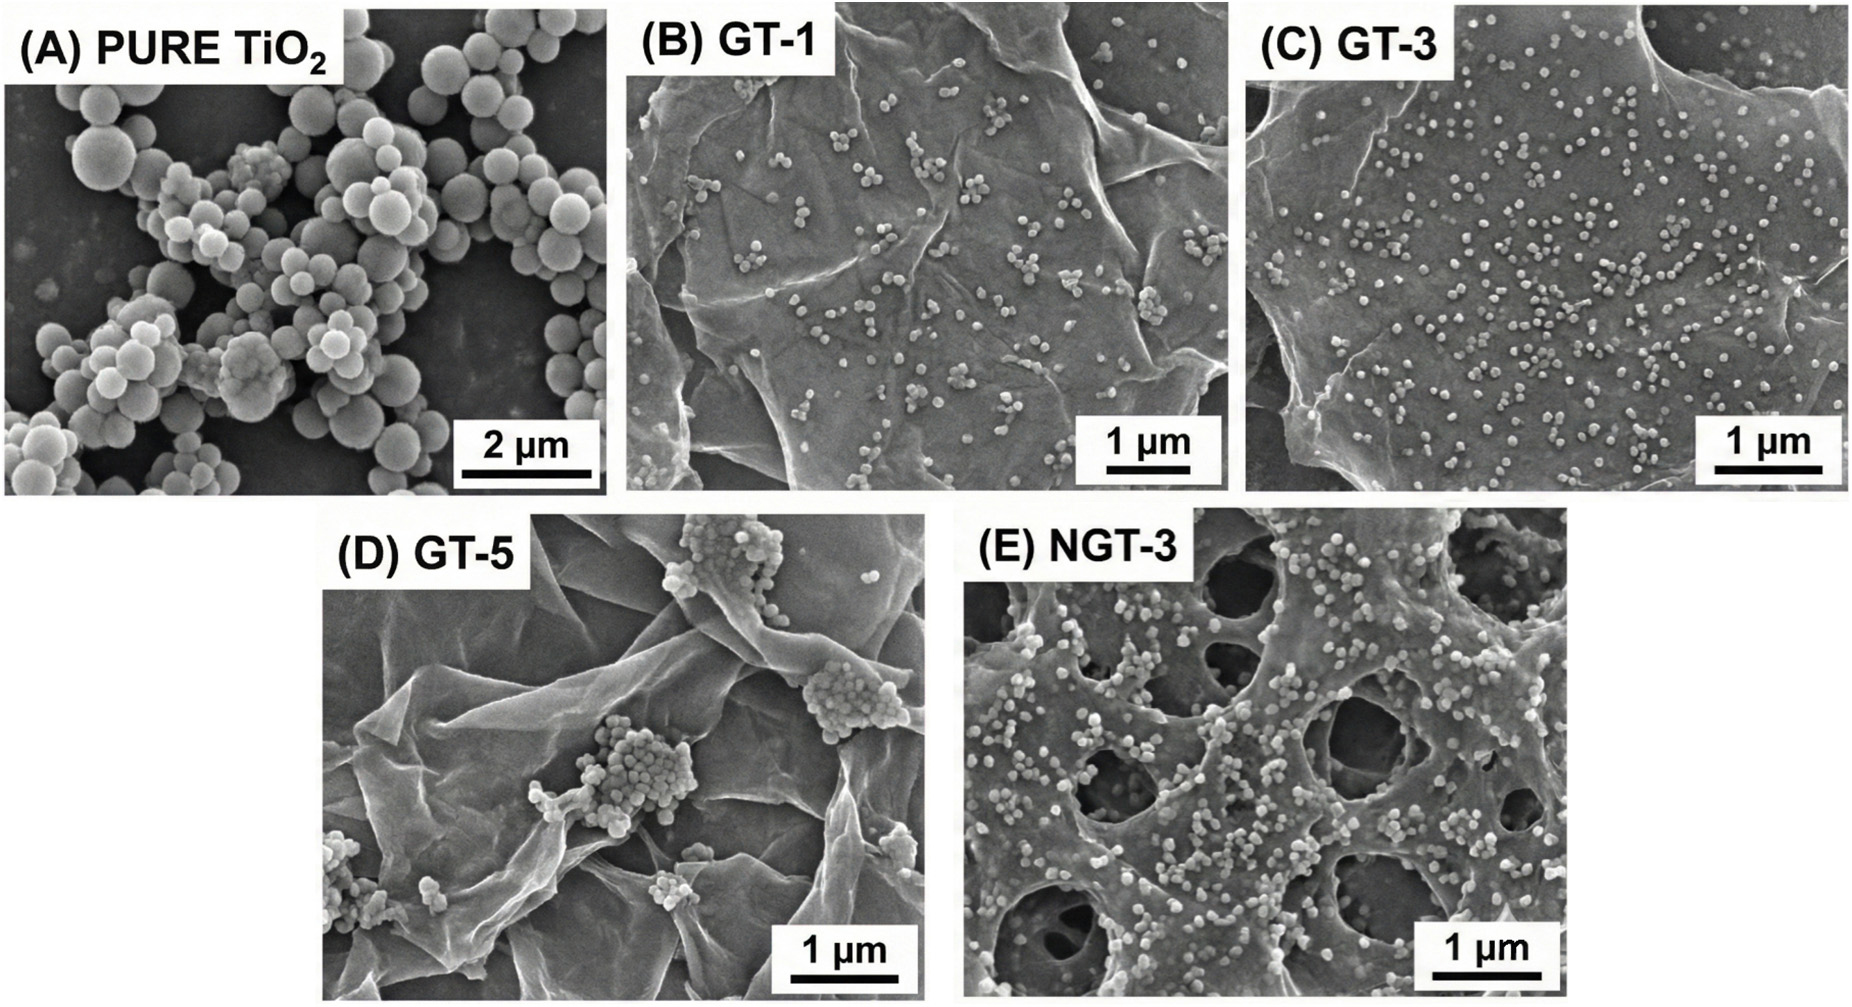
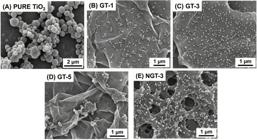
The morphology and microstructure of the synthesized materials were examined by FESEM and TEM. Figure 4 presents the FESEM images of pure TiO2 and the various nanocomposites. Pure TiO2 (Figure 4A) consists of aggregated spherical nanoparticles with a relatively wide size distribution. In contrast, the nanocomposites exhibit a distinctly different morphology. As seen in the images of GT-1, GT-3, and GT-5 (Figure 4B–D), the TiO2 nanoparticles are anchored onto the surface of thin, wrinkled, and semi-transparent rGO sheets. These rGO sheets act as a flexible substrate, preventing the severe agglomeration of TiO2 nanoparticles observed in the pure sample. The distribution of TiO2 on the rGO surface appears relatively uniform in GT-1 and GT-3. However, in GT-5 (Figure 4D), some restacking of rGO sheets and localized agglomeration of TiO2 nanoparticles can be observed, which might be due to the higher graphene concentration. The NGT-3 sample (Figure 4E) displays a morphology similar to GT-3, with well-dispersed TiO2 nanoparticles decorating the rGO nanosheets, forming a porous and interconnected network structure. This unique hierarchical structure is highly advantageous for gas sensing, as it provides a large accessible surface area and numerous channels for gas diffusion [40].
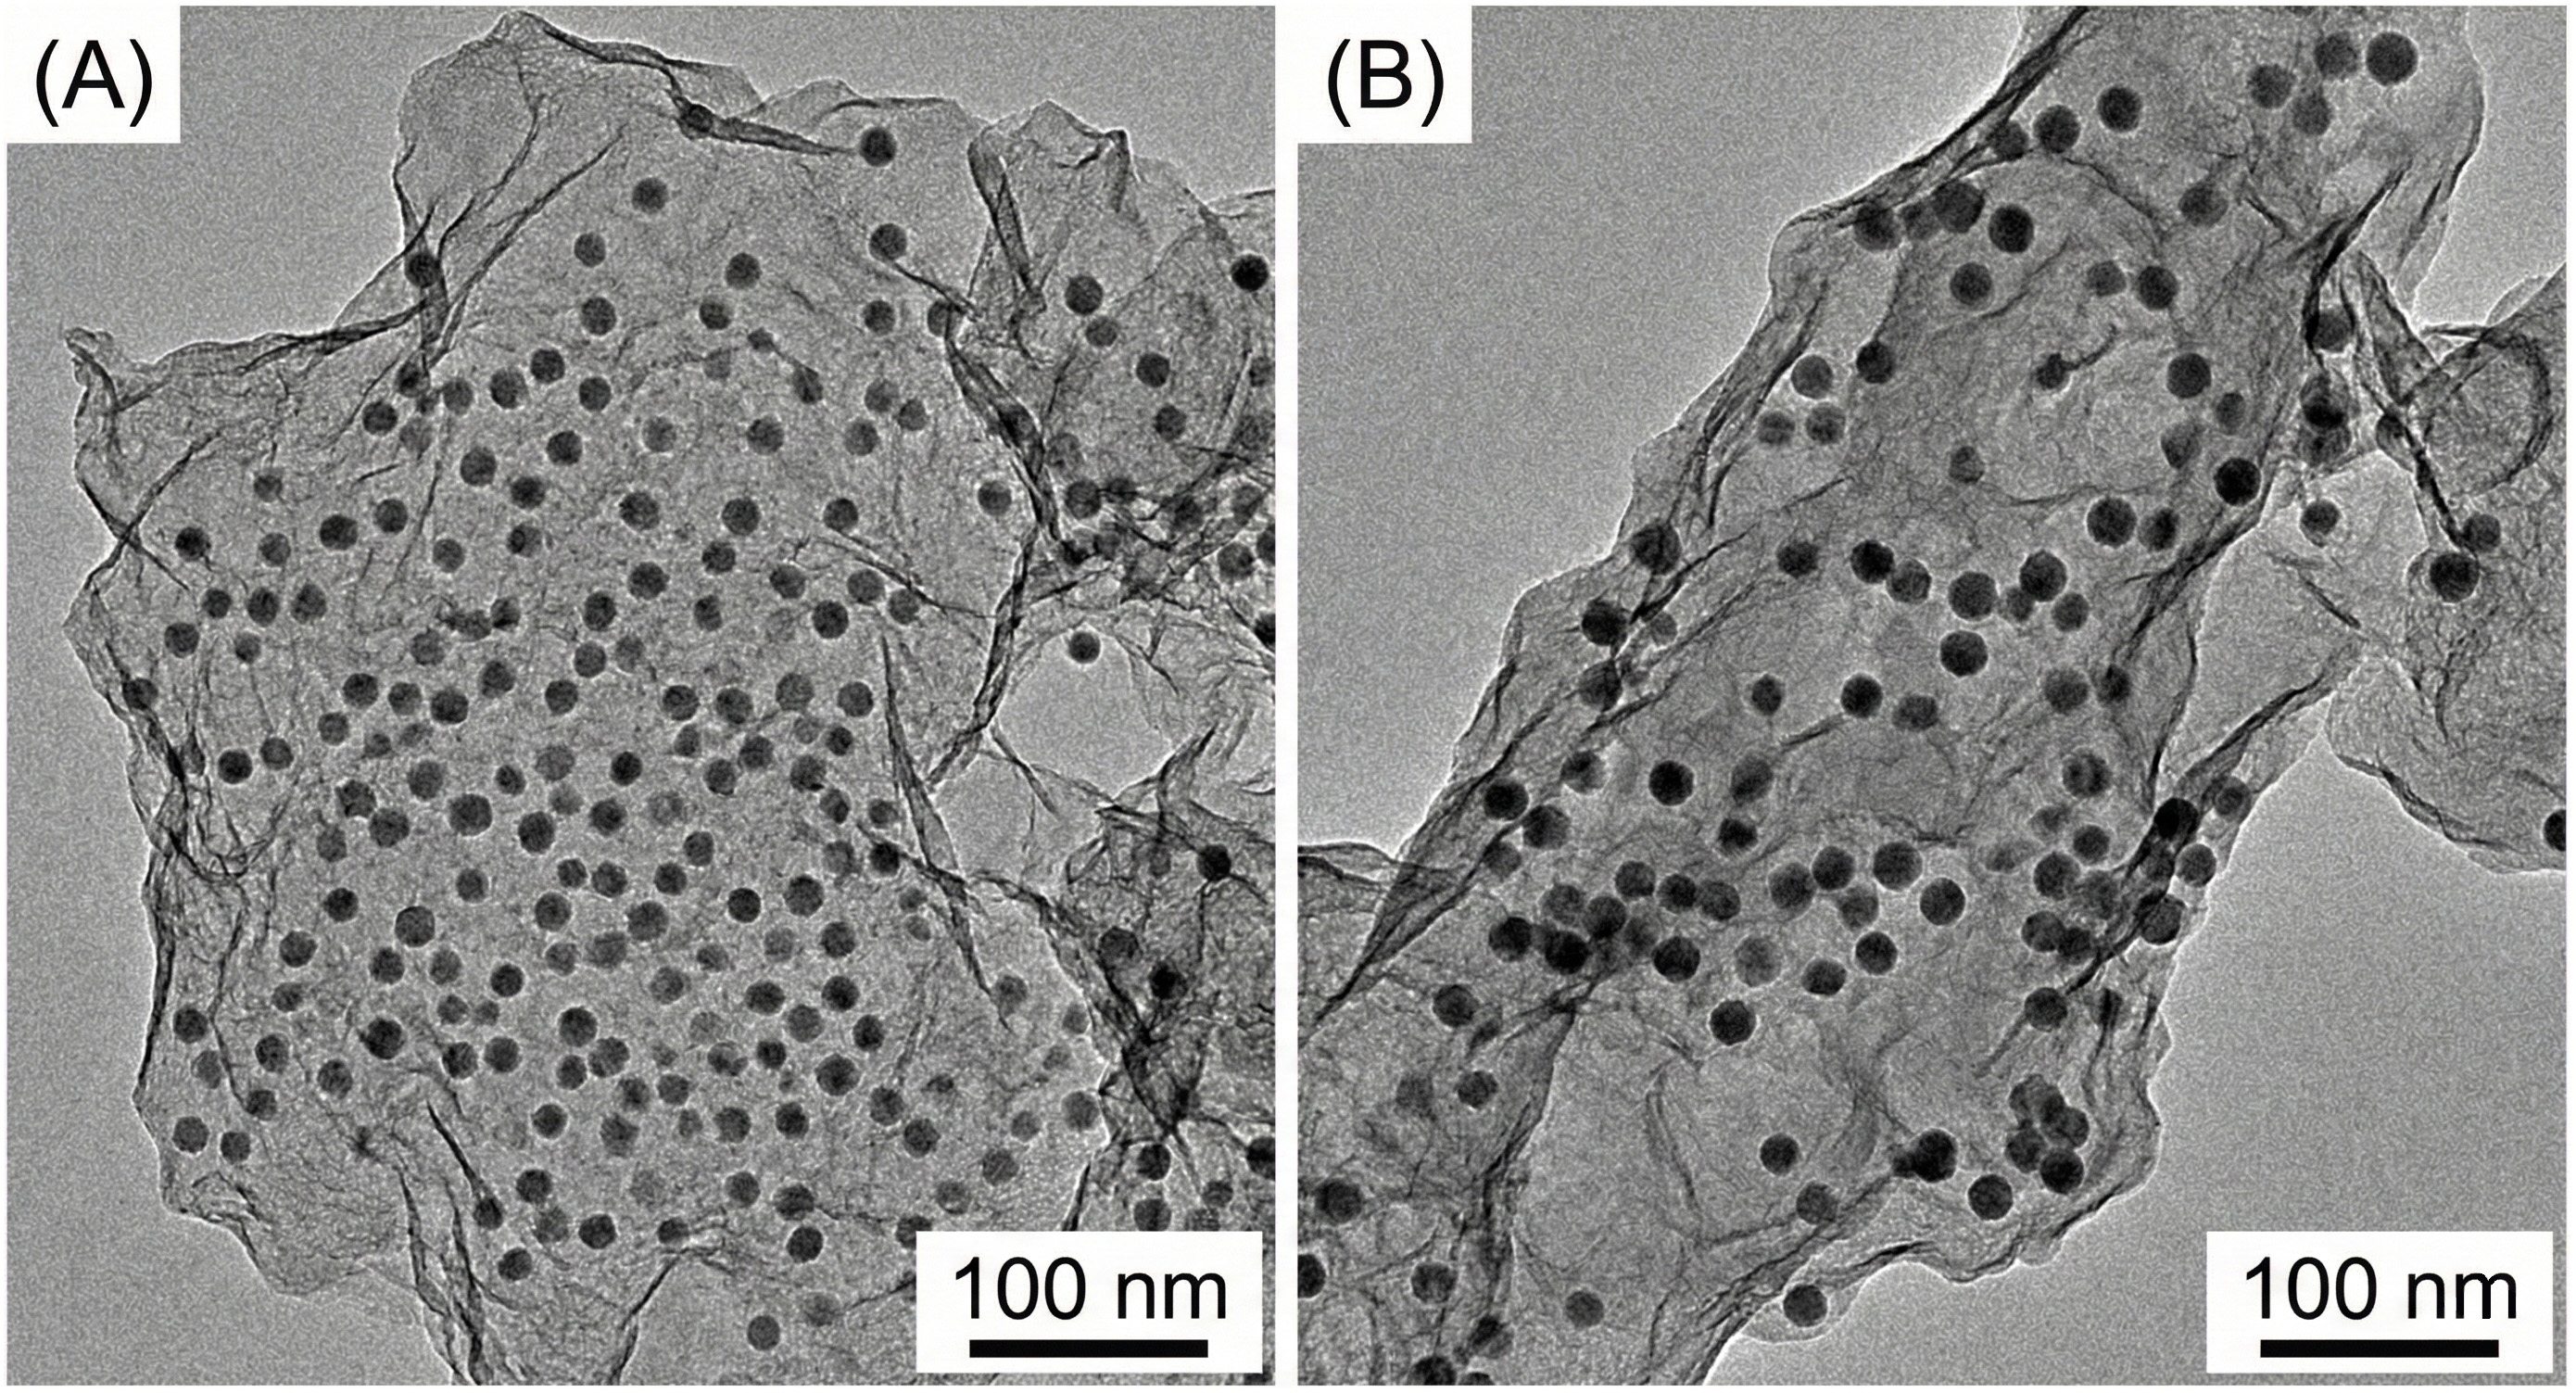
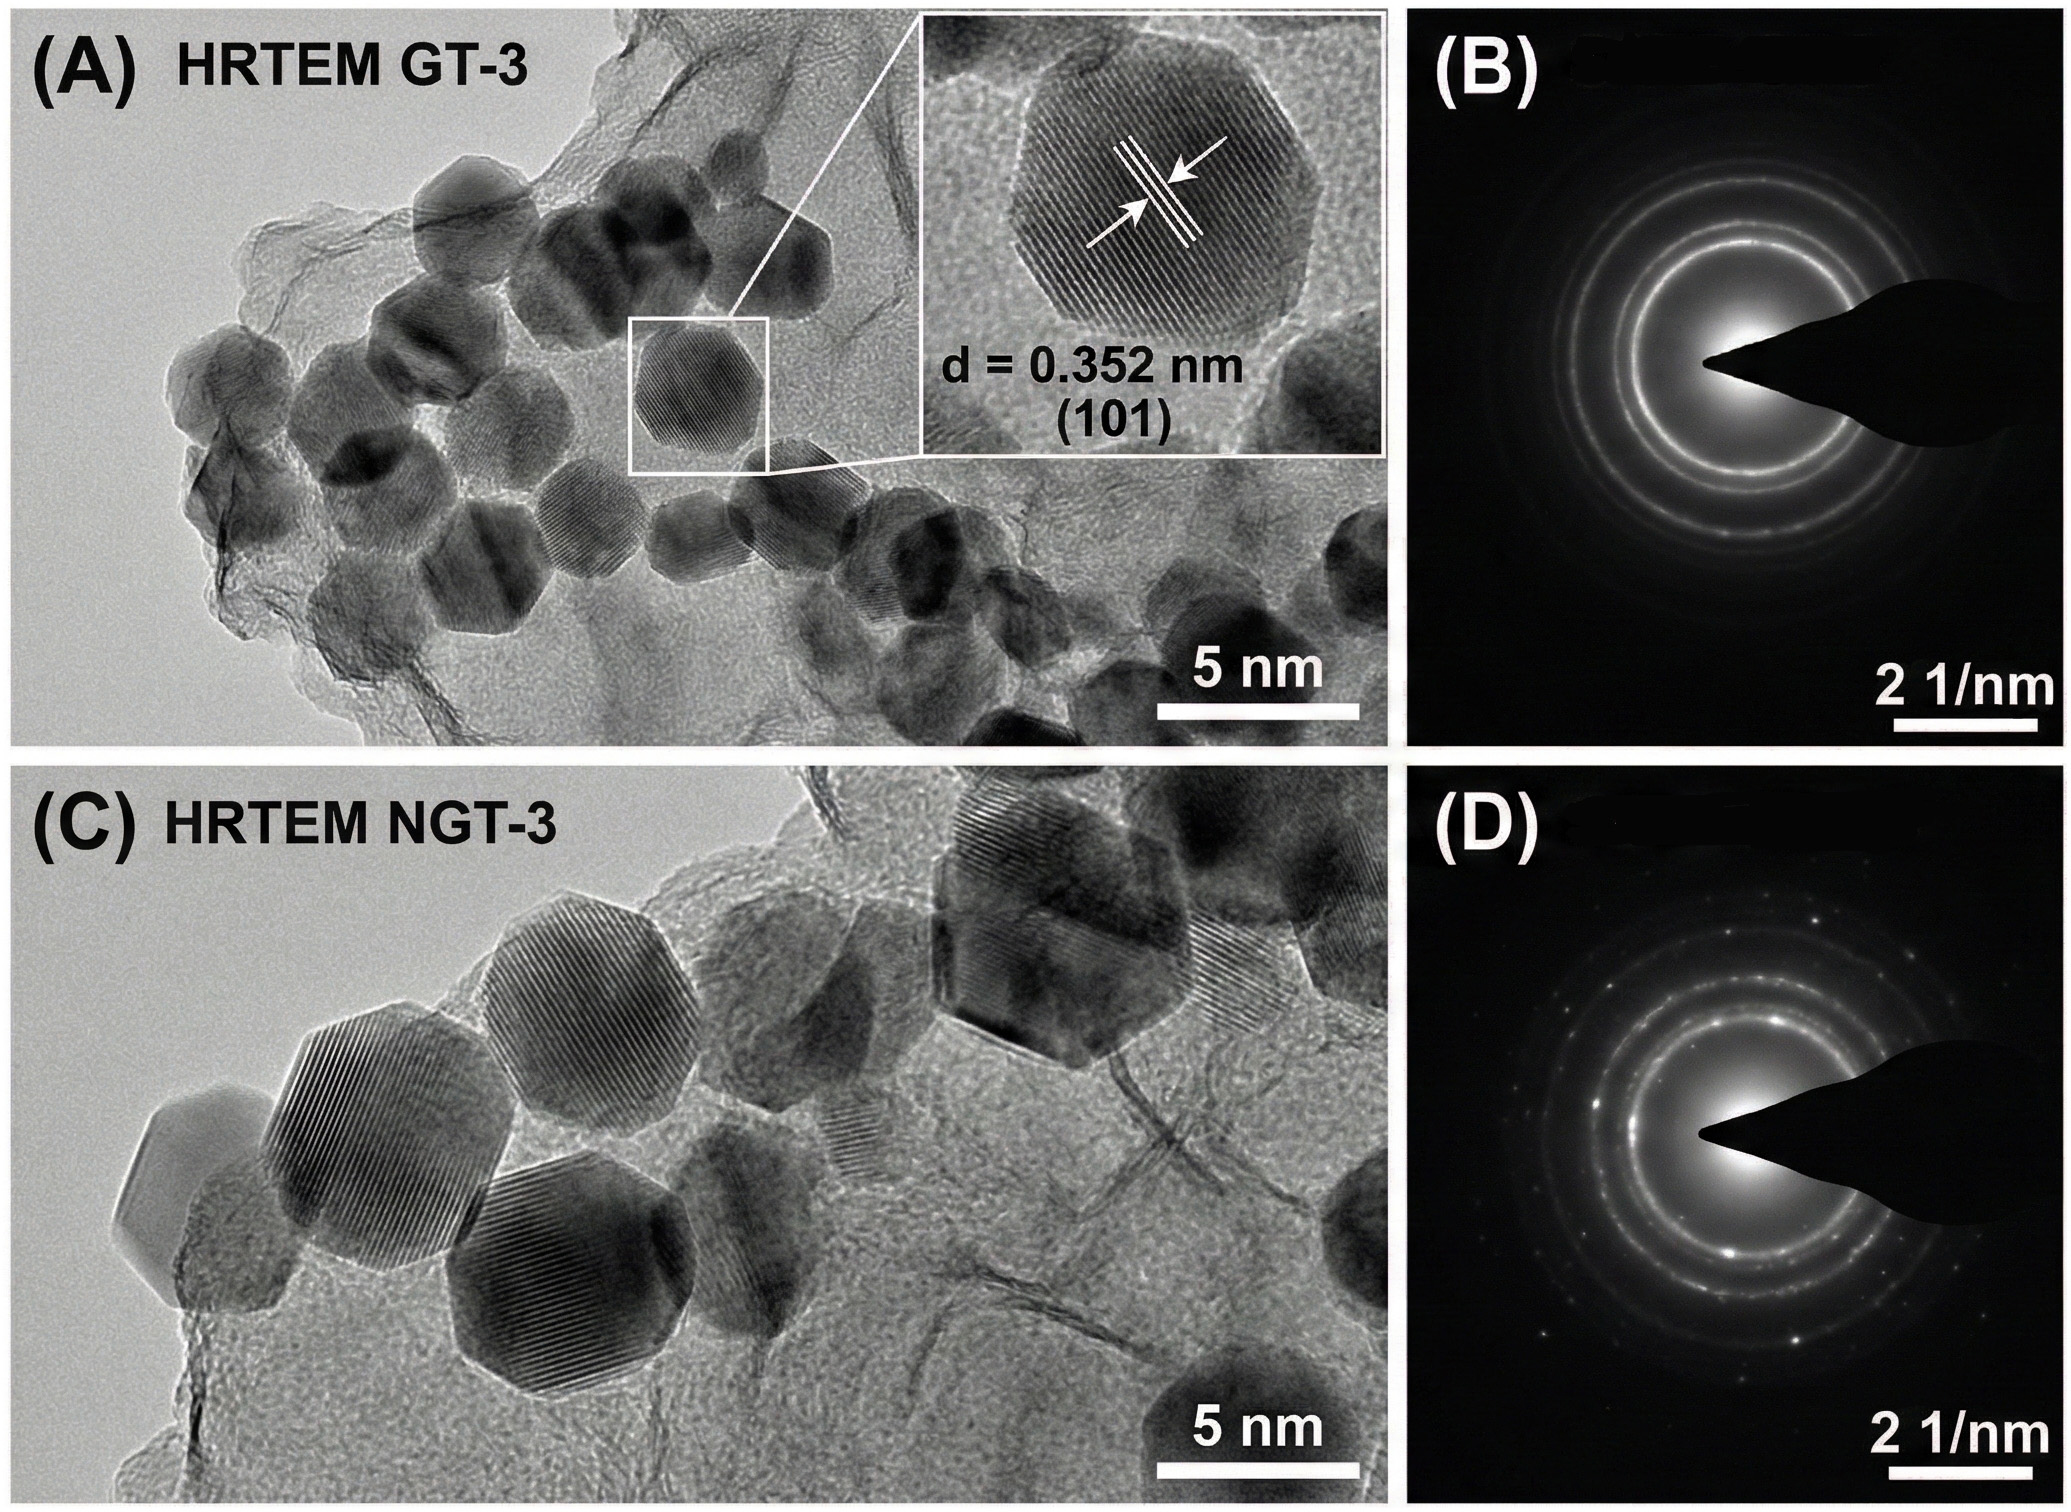
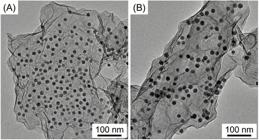
Further microstructural details were revealed by TEM analysis. Figure 5A shows a TEM image of the GT-3 composite, confirming that TiO2 nanoparticles with an average diameter of approximately 10–15 nm are densely and uniformly distributed on the rGO nanosheet. The wrinkled and folded nature of the ultrathin rGO sheet is clearly visible. The TEM image of NGT-3 (Figure 5B) shows a similar intimate contact between the TiO2 nanoparticles and the N-doped rGO substrate. The high-resolution TEM (HRTEM) image of GT-3 (Figure 6A) displays clear lattice fringes with an interplanar spacing of 0.352 nm, which corresponds to the d-spacing of the anatase TiO2 (101) plane. The corresponding SAED pattern (Figure 6B) exhibits concentric polycrystalline rings that can be indexed to the anatase TiO2 planes (101), (004), (200), and (105). These indexed rings match the principal XRD reflections observed at 2θ ≈ 25.3°, 37.8°, 48.0°, and 53.9°, respectively, confirming good agreement between local electron diffraction and bulk X-ray diffraction. Likewise, the NGT-3 sample shows the same anatase diffraction features in its HRTEM/SAED analysis (Figure 6C,D), with no additional rings attributable to rutile or impurity phases [41]. Thus, both SAED and XRD consistently confirm that the TiO2 nanocrystals in GT-3 and NGT-3 retain the anatase structure.
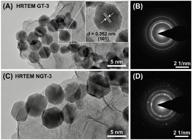
(A, B) HRTEM images and (C, D) SAED patterns of the GT-3 and NGT-3 nanocomposites, respectively.
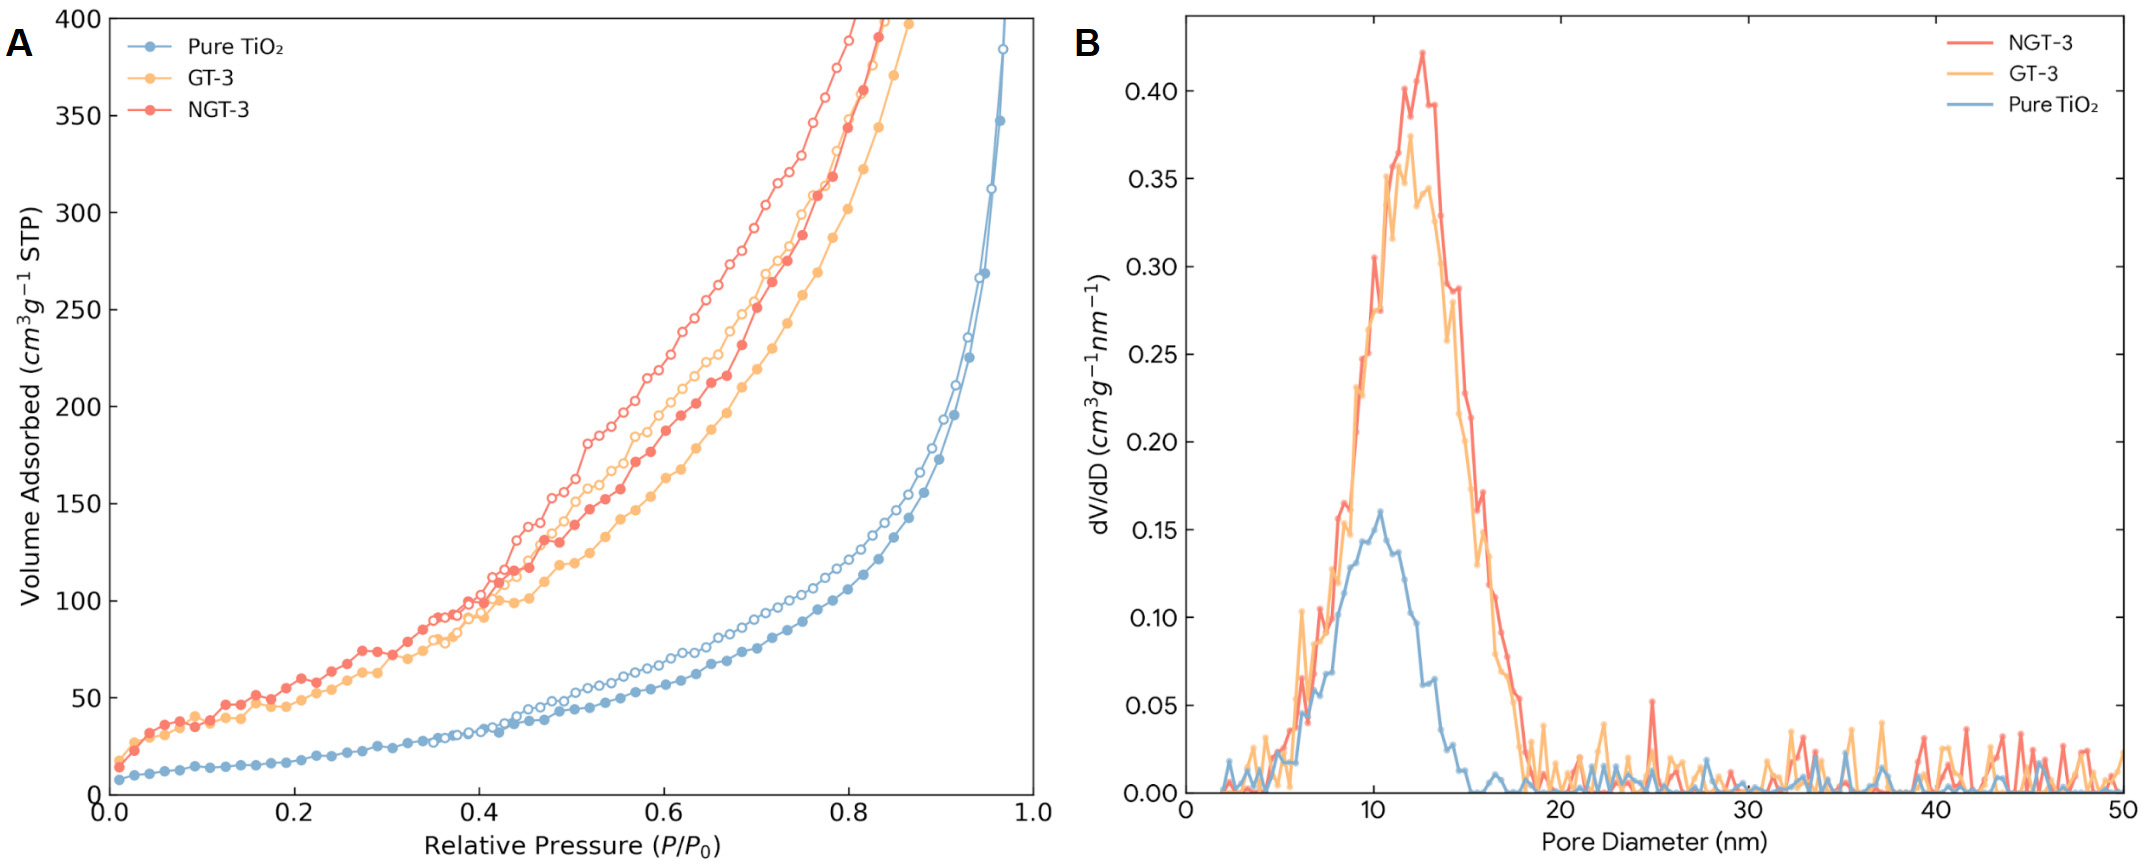
The specific surface area and porous nature of the materials, which are critical factors for gas sensing performance, were characterized by N2 adsorption-desorption measurements [42]. The isotherms for pure TiO2, GT-3, and NGT-3 are shown in Figure 7A. All three samples exhibit type-IV isotherms with a distinct H3-type hysteresis loop at high relative pressures (P/P0 > 0.5), which is characteristic of mesoporous materials with slit-shaped pores formed by the aggregation of plate-like particles [43]. The corresponding pore size distribution curves, calculated using the BJH method (Figure 7B), reveal a narrow distribution of mesopores centered around 10–13 nm. The key parameters derived from these measurements are summarized in Table 1. The specific surface area of pure TiO2 is 58.4 m2/g. In contrast, the introduction of rGO leads to a dramatic increase in surface area. The GT-3 composite possesses a surface area of 148.2 m2/g, approximately 2.5 times larger than that of pure TiO2. This enhancement is attributed to the rGO sheets acting as spacers that prevent TiO2 nanoparticle aggregation and create a porous, high-surface-area architecture. The GT-1 and GT-5 samples have surface areas of 95.7 and 132.6 m2/g, respectively. The lower surface area of GT-5 compared to GT-3 is likely due to the partial restacking of rGO sheets at higher concentrations, as observed in FESEM. Remarkably, the NGT-3 nanocomposite exhibits the highest specific surface area of 165.3 m2/g, along with the largest pore volume (0.51 cm3/g). This suggests that nitrogen doping not only modifies the electronic properties but also contributes to a more porous and accessible surface structure. Such a high surface area provides a greater number of active sites for the adsorption of ozone molecules, which is expected to significantly boost the sensor response.

(A) N₂ adsorption-desorption isotherms and (B) corresponding BJH pore size distribution plots for pure TiO₂, GT-3, and NGT-3.
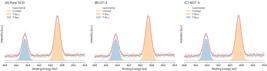
XPS analysis was performed to investigate the surface elemental composition and chemical states of the GT-3 and NGT-3 nanocomposites. The survey confirms the presence of C, O, and Ti in both samples. For NGT-3, an additional peak corresponding to N 1s is clearly observed, providing direct evidence of successful nitrogen doping. The elemental compositions derived from the survey spectra are listed in Tables 2 and 3. The atomic percentage of nitrogen in NGT-3 is found to be approximately 3.1 at.%. This moderate nitrogen level is consistent with literature reports on hydrothermal urea-assisted doping of graphene-based materials and supports the suitability of the selected 1.0 g urea input for introducing chemically active nitrogen species under the present synthesis conditions [28].
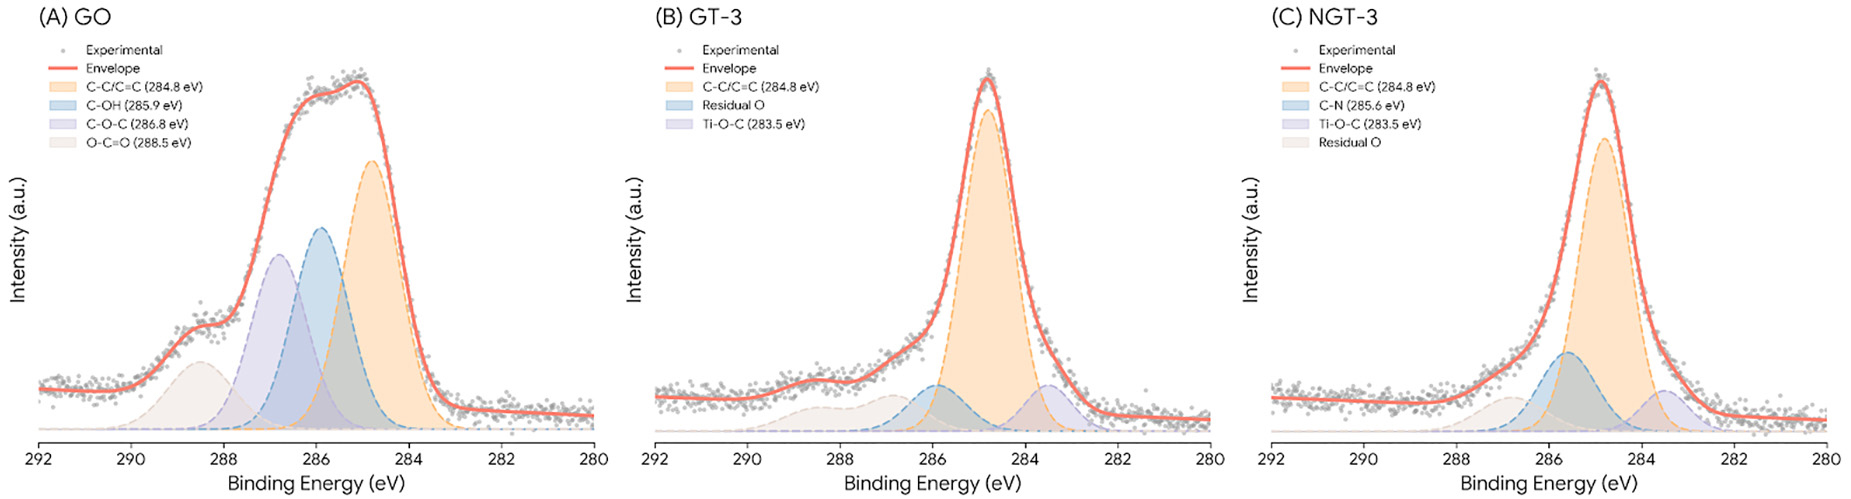
To gain deeper insight into the chemical bonding, high-resolution XPS spectra of C 1s, Ti 2p, and N 1s were recorded and deconvoluted. Figure 8 shows the C 1s spectra. The C 1s spectrum of GO can be deconvoluted into four peaks corresponding to C-C/C=C in graphitic domains (~284.8 eV), C-OH (~285.9 eV), C-O-C (~286.8 eV), and O-C=O (~288.5 eV). In the C 1s spectrum of GT-3, the intensities of the peaks related to oxygen-containing functional groups are significantly reduced, confirming the effective reduction of GO. The spectrum is dominated by the sp2 C-C/C=C peak, and a new peak appears at a lower binding energy of ~283.5 eV, which can be attributed to the formation of Ti-O-C chemical bonds at the interface between TiO2 and rGO [44, 45]. This chemical linkage is crucial for facilitating efficient charge transfer between the two components. The C 1s spectrum of NGT-3 shows a further decrease in oxygenated carbon species and the emergence of a peak at ~285.6 eV, which can be assigned to C-N bonds.
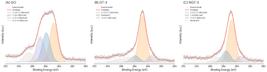
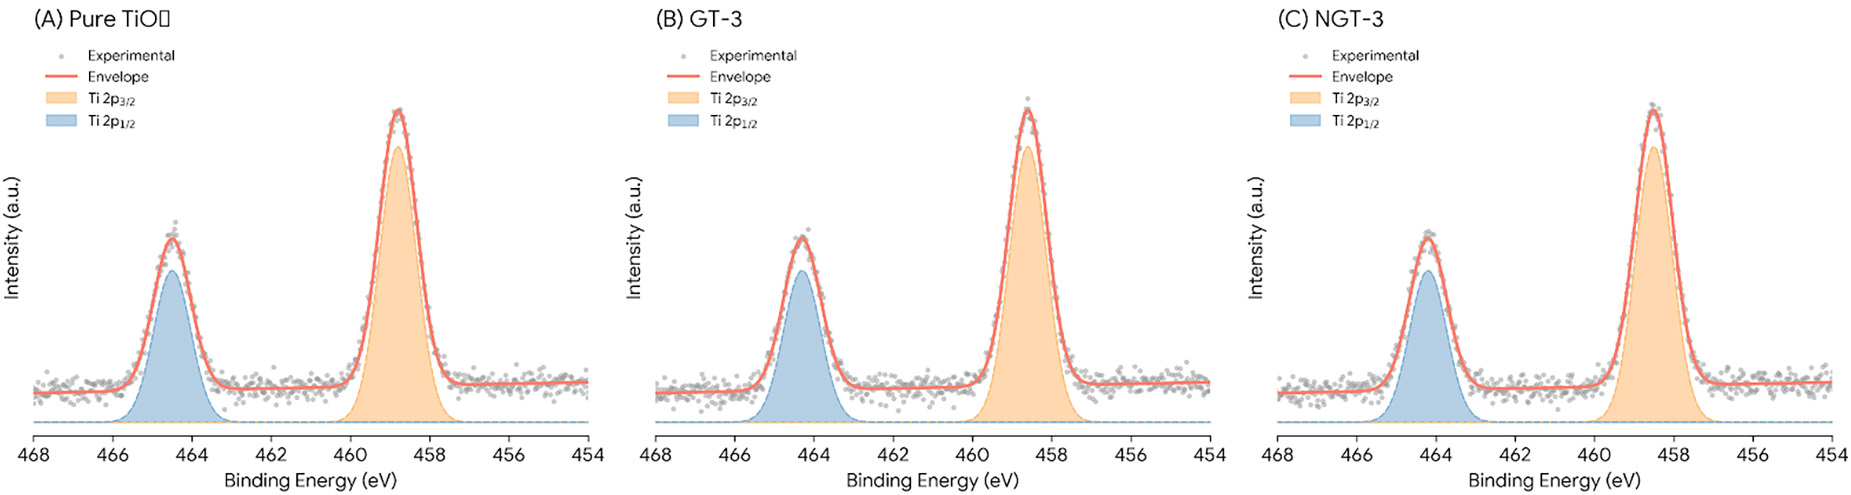
The high-resolution Ti 2p spectra for pure TiO2, GT-3, and NGT-3 are shown in Figure 9. For all samples, the spectra exhibit two strong peaks corresponding to Ti 2p3/2 and Ti 2p1/2, located at approximately 458.8 eV and 464.5 eV, respectively. The spin-orbit splitting of ~5.7 eV is characteristic of the Ti4+ oxidation state in TiO2 [46, 47]. Compared to pure TiO2, the Ti 2p peaks for the GT-3 and NGT-3 composites show a slight shift to lower binding energies, indicating interfacial electronic coupling between TiO2 and the graphene phase. To further verify this effect, temperature-dependent resistance and dark I–V measurements were performed for pure TiO2, GT-3, and NGT-3. All samples showed quasi-linear I–V behavior in the tested bias range, indicating stable electrical contact with the Au electrodes, while the composite samples exhibited a stronger temperature dependence than pure TiO2. From Arrhenius plots of ln(R) versus 1/T, the apparent activation energies were estimated to be 0.44 eV for pure TiO2, 0.36 eV for GT-3, and 0.32 eV for NGT-3, consistent with facilitated interfacial charge transport after graphene coupling and nitrogen functionalization. At 100 °C under 100 ppb O3, the current decrease at 1 V was markedly larger for NGT-3 than for GT-3 and pure TiO2, supporting the view that ozone exposure modulates an interfacial depletion barrier rather than only the surface resistance of TiO2.
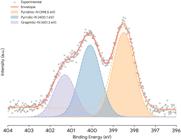
The high-resolution N 1s spectrum of the NGT-3 sample (Figure 10) was deconvoluted into pyridinic-N (~398.5 eV), pyrrolic-N (~400.1 eV), and graphitic-N (~401.3 eV). To better quantify the doping chemistry, the relative integrated areas of these components were extracted from the fitted N 1s envelope and converted into fractions of the total nitrogen content measured by survey XPS. The fitting shows that pyridinic-N is the dominant configuration, followed by pyrrolic-N and graphitic-N, corresponding to 47.8%, 31.6%, and 20.6% of total nitrogen, respectively; based on the total N content of 3.1 at.%, these fractions correspond to approximately 1.48 at.% pyridinic-N, 0.98 at.% pyrrolic-N, and 0.64 at.% graphitic-N. This distribution indicates that edge-type nitrogen species are preferentially introduced under the present hydrothermal-annealing conditions. Importantly, pyridinic-N is widely considered the most chemically active nitrogen configuration for gas adsorption and interfacial charge redistribution because it is located at edge or vacancy-adjacent sites and induces strong local electronic polarization [48]. Therefore, the enhanced ozone response of NGT-3 is reasonably associated not merely with the presence of nitrogen, but more specifically with the predominance of pyridinic-N among the nitrogen species detected by XPS. Pyrrolic-N and graphitic-N may also contribute by modifying the overall defect density and electronic structure of the N-rGO framework, but their contribution is likely secondary in the present system. Pyridinic-N refers to a nitrogen atom at the edge of a graphene plane, bonded to two carbon atoms and contributing one p-electron to the π-system. Pyrrolic-N is bonded to two carbon atoms and is part of a five-membered ring, contributing two p-electrons to the π-system. Graphitic-N substitutes a carbon atom within the hexagonal graphene lattice. This combination of nitrogen configurations creates multiple electronically distinct adsorption environments, but the dominant pyridinic-N fraction provides the strongest basis for linking the XPS result to the improved ozone-sensing performance [49].
It should be noted that the 1, 3, and 5 wt% labels used throughout this work denote the theoretical precursor loading employed during composite synthesis rather than the directly measured final bulk rGO content in the annealed products. In graphene/TiO2 composites, the actual carbon fraction can deviate from the nominal value because GO undergoes partial reduction and deoxygenation during hydrothermal treatment and subsequent annealing. Such deviations have been reported previously; for example, WANAG et al. [50] observed 6.5 wt% carbon for a TiO2/rGO sample prepared from a theoretically assumed 8 wt% carbon formulation. Therefore, in the present manuscript, GT-1, GT-3, GT-5, and NGT-3 should be interpreted as composition labels reflecting precursor feed ratio. The XPS survey confirms the expected surface compositional trend and successful nitrogen incorporation in NGT-3, but a rigorous bulk determination of final rGO content would require dedicated TGA or elemental analysis, which will be included in future work.
3.2. Ozone sensing performance
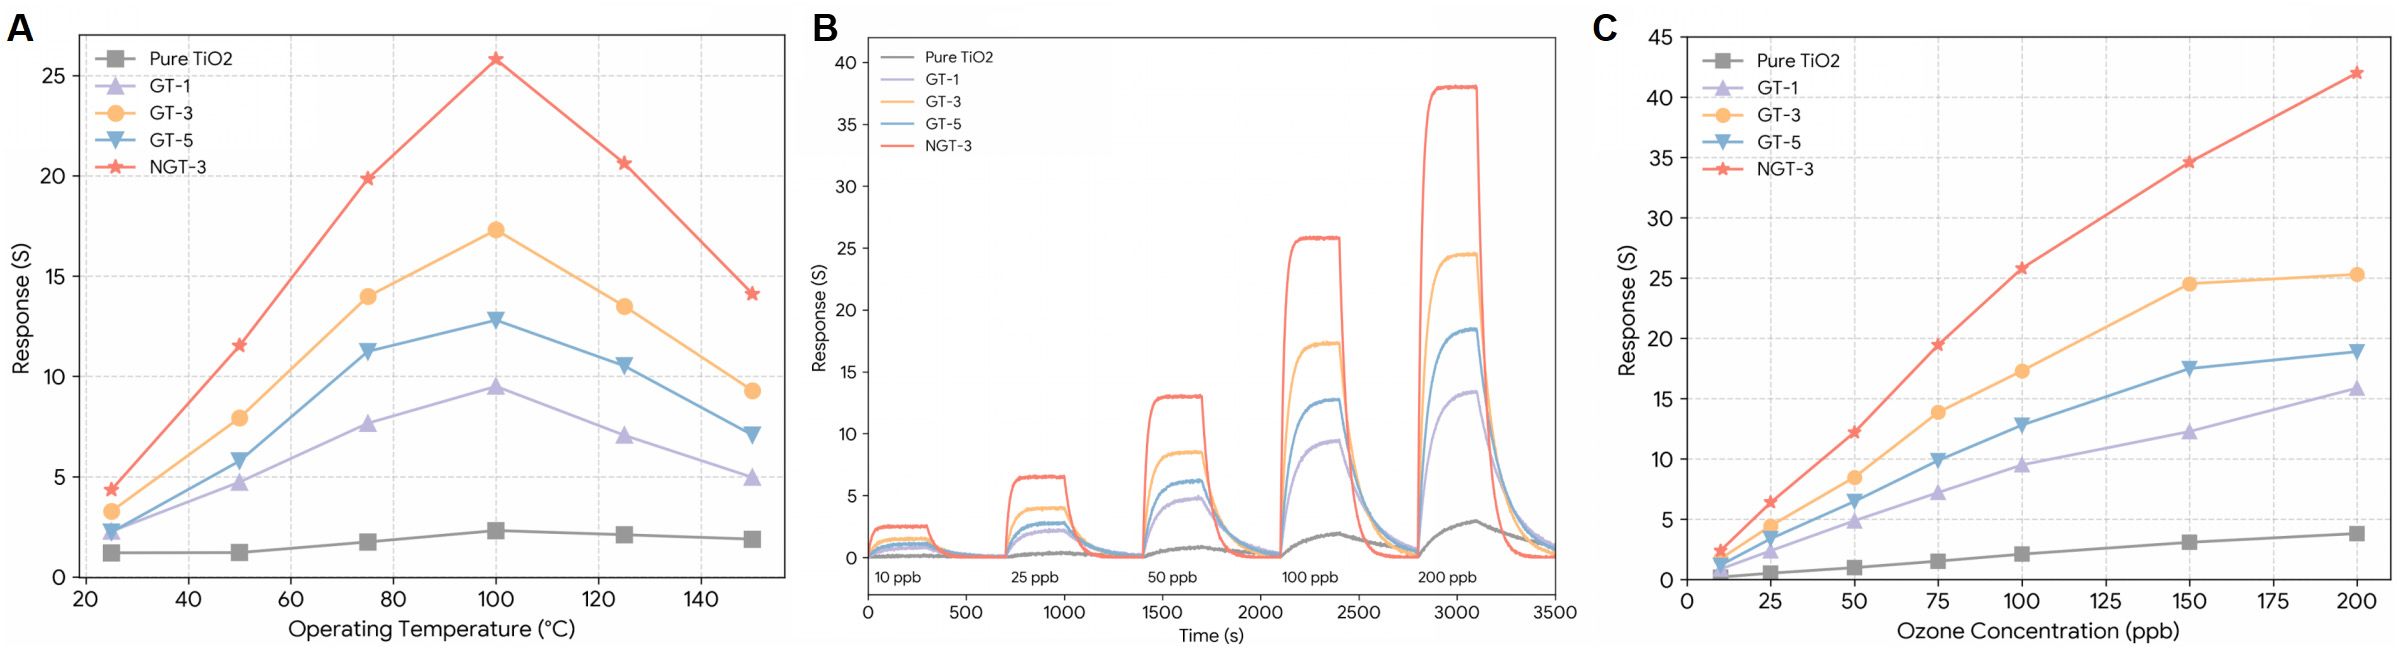
The operating temperature is a critical parameter that profoundly influences the performance of SMO-based gas sensors. The relationship between sensor response and operating temperature was investigated for all synthesized materials towards 100 ppb of ozone in the range of 25 °C to 150 °C, and the results are presented in Figure 11A. All sensors exhibit a typical volcano-shaped response curve, where the response initially increases with temperature, reaches a maximum at an optimal temperature, and then decreases. This behavior reflects a trade-off between the kinetics of gas adsorption/reaction and desorption. At lower temperatures, the thermal energy is insufficient to overcome the activation energy barrier for the sensing reaction, resulting in a low response. As the temperature rises, the reaction rate increases, leading to a higher response [51]. However, beyond the optimal temperature, the rate of gas desorption becomes dominant, reducing the surface coverage of ozone molecules and thus causing the response to decline [52]. The pure TiO2 sensor shows a maximum response of 2.1 at a relatively high optimal temperature of 125 °C. In contrast, all the GT and NGT composites not only exhibit significantly enhanced responses but also show a reduction in their optimal operating temperature [53]. The GT-1, GT-3, and GT-5 sensors reach their maximum responses of 9.5, 17.3, and 12.8, respectively, at an optimal temperature of 100 °C. The NGT-3 sensor demonstrates the best performance, with a peak response of 25.8 at 100 °C. The substantial improvement in response and the lowering of the optimal operating temperature for the composites can be attributed to the synergistic effects of rGO, including the formation of p-n heterojunctions and its high catalytic activity, which effectively lowers the activation energy for the ozone sensing reaction. Based on these results, the optimal temperature of 100 °C was selected for all subsequent tests on the composite sensors (125 °C for pure TiO2).

(A) Response of the pure TiO₂, GT-1, GT-3, GT-5, and NGT-3 sensors to 100 ppb of ozone as a function of operating temperature. (B) Dynamic response-recovery curves of the (a) pure TiO₂, (b) GT-1, (c) GT-3, (d) GT-5, and (e) NGT-3 sensors to different concentrations of ozone at their optimal operating temperatures. (C) Sensor response as a function of ozone concentration for all synthesized materials. The inset shows the linear fitting for the NGT-3 sensor at low concentrations.
The dynamic response-recovery characteristics of the sensors were evaluated by exposing them to various concentrations of ozone (10–200 ppb) at their respective optimal operating temperatures. In the revised manuscript, Figure 11B presents representative raw resistance transients together with replicate measurements from three independently fabricated NGT-3 devices. All devices showed the same resistance-increase trend upon O3 exposure and returned close to baseline after purging with dry air, confirming the reproducibility of the chemiresistive response. At 100 ppb O3, the response of NGT-3 was 25.8 ± 0.9 (n = 3 devices), while GT-3 showed 17.3 ± 0.7 under the same nominal concentration. The pure TiO2 sensor shows a very weak and sluggish response, especially at low ozone concentrations. The GT composites exhibit a marked improvement in response magnitude. Among them, the GT-3 sensor displays the highest response, consistent with the temperature-dependent measurements. The response of GT-5 is lower than GT-3, which can be attributed to the aforementioned rGO sheet restacking and potential shielding of TiO2 active sites at higher graphene loading. The NGT-3 sensor demonstrates a remarkably superior performance, with a much larger and more rapid change in resistance compared to all other samples, indicating its exceptional sensitivity to ozone.
The relationship between sensor response and ozone concentration is plotted in Figure 11C. For all sensors, the response increases with increasing ozone concentration. In the low concentration range (10–100 ppb), the response shows a good linear relationship, which is desirable for quantitative detection. At higher concentrations, the response tends to saturate due to the limited availability of surface adsorption sites. The slope of the linear portion of the curve represents the sensitivity of the sensor. The NGT-3 sensor exhibits the highest sensitivity. By extrapolating the linear fit in the 10–100 ppb region to a signal-to-noise ratio of 3, a theoretical LOD of 1.2 ppb was obtained for NGT-3. We emphasize that this value is derived from the calibration slope and baseline noise, whereas the experimentally demonstrated concentration window in this work is 10–200 ppb. The baseline noise of the NGT-3 device at 100 °C was below 0.03 in normalized response units over the acquisition interval, and no obvious baseline drift was observed during consecutive low-concentration measurements. To avoid overstatement, the revised manuscript now describes 1.2 ppb as a theoretical LOD rather than a directly demonstrated detection limit.
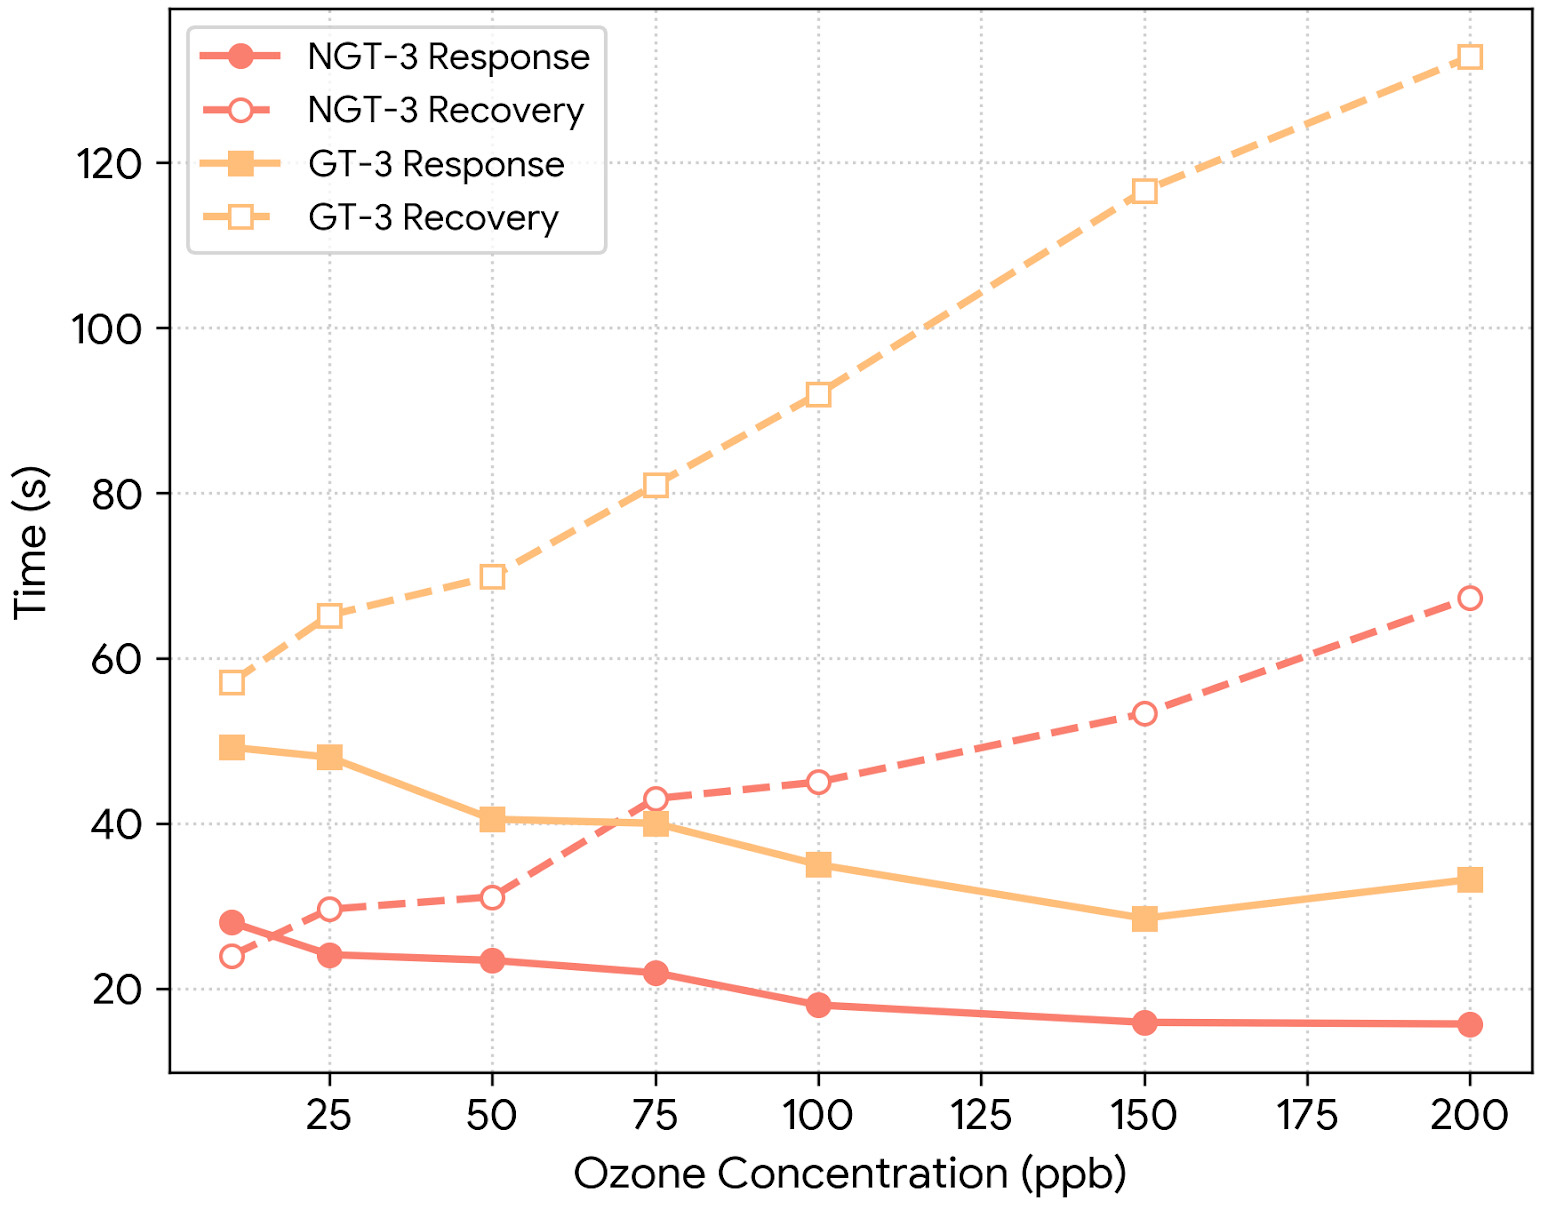
Fast response and recovery are crucial for real-time monitoring applications. The response (τres) and recovery (τrec) times were extracted from the dynamic response curves and are plotted as a function of ozone concentration for the best-performing GT-3 and NGT-3 sensors in Figure 12. For both sensors, the response time decreases slightly with increasing ozone concentration, while the recovery time shows a slight increase. This is because a higher gas concentration provides a larger driving force for adsorption, accelerating the response process, while desorbing from a more saturated surface takes longer. The NGT-3 sensor demonstrates significantly faster kinetics compared to GT-3. For 100 ppb of ozone, the NGT-3 sensor has a response time of 18 s and a recovery time of 45 s, whereas the GT-3 sensor exhibits times of 35 s and 92 s, respectively. The rapid response and recovery of the NGT-3 sensor can be attributed to the enhanced catalytic activity of the N-doped rGO and the efficient charge transport pathways it provides. A comprehensive summary of the sensing performance of all fabricated sensors is presented in Table 4, alongside a comparison with other ozone sensors reported in the literature [54-59, 54-59]. It is evident that the NGT-3 sensor shows competitive ppb-level ozone sensing performance at a relatively low operating temperature of 100 °C. However, compared with literature examples such as CuWO4, rGO/LaFeO3, and rGO-ZnO systems, the present response and theoretical LOD should be interpreted together with the measurement protocol, response definition, and validation procedure. The superior performance of GT-3 over GT-1 and GT-5 experimentally justified its use as the parent composition for nitrogen functionalization, because GT-1 likely provided insufficient interfacial junction density, whereas GT-5 partially suffered from graphene restacking and conductive bypass effects.
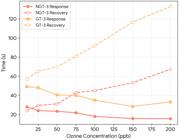
Response and recovery times of the GT-3 and NGT-3 sensors as a function of ozone concentration.
Benchmark comparison of the present NGT-3 sensor with representative graphene-modified, carbon-modified, and oxide-based chemiresistive ozone sensors reported in the literature.
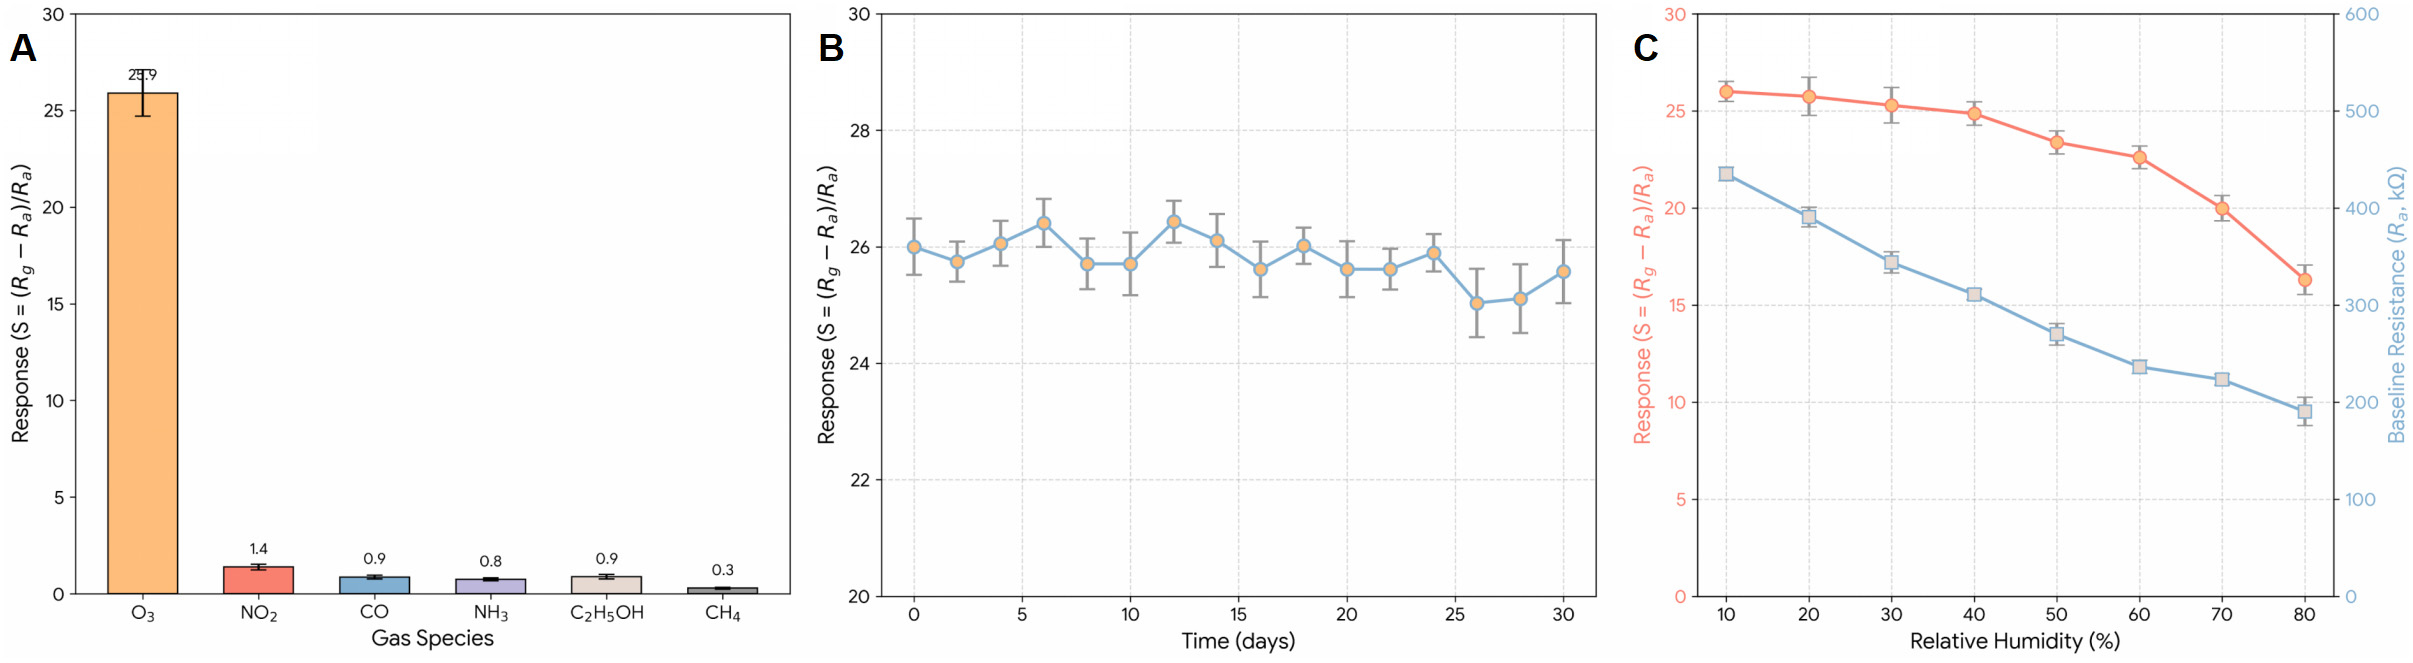
Selectivity is another critical metric for a practical gas sensor, because ambient air contains multiple oxidizing and reducing interferents that may perturb the baseline or induce cross-response. To visualize this more clearly, a dedicated selectivity bar chart has been added in Figure 13A, comparing the response of the NGT-3 sensor to 100 ppb O3 with its responses to representative concentrations of NO2, SO2, CO, NH3, ethanol, acetone, toluene, and CH4. The response to 100 ppb O3 remained the largest signal. Among the interferents, NO2 produced the most noticeable cross-response, as expected for a competing oxidizing gas, but its signal remained substantially lower than that of ozone under the tested conditions, whereas CO and the tested reducing gases produced only weak responses. This result indicates that the NGT-3 surface is much more strongly perturbed by ozone adsorption than by the other common atmospheric interferents examined here, supporting selective ozone detection under mixed-gas conditions. This behavior is consistent with previous ozone-sensing studies, in which NO2 is typically the most relevant oxidizing interferent whereas CO shows much weaker response under comparable or higher concentrations [57].

(A) Dedicated selectivity bar chart comparing the response of the NGT-3 sensor to 100 ppb O3 with its responses to representative concentrations of NO₂, SO₂, CO, NH3, ethanol, acetone, toluene, and CH₄ at 100 °C. (B) Long-term stability of the NGT-3 sensor over 30 days, showing the baseline resistance in dry air (Ra) and the response to 100 ppb O3 (S). (C) Influence of relative humidity (RH) on the baseline resistance and the response of the NGT-3 sensor to 100 ppb O3 at 100 °C.
Long-term stability is crucial for the practical application of chemiresistive ozone sensors, because practical deployment requires both preserved response magnitude and minimal baseline drift over time. The stability of the NGT-3 sensor was therefore evaluated over 30 days by recording both the baseline resistance in dry air (Ra) and the response to 100 ppb O3 every two days, using three independently fabricated devices and three repeated sensing cycles for each data point. As shown in the revised Figure 13B, the initial baseline resistance was 1.82 ± 0.05 MΩ and changed only slightly to 1.88 ± 0.06 MΩ after 30 days, corresponding to a drift of approximately 3.3%. Over the same period, the response decreased from 25.8 ± 0.6 to 24.7 ± 0.8, corresponding to 95.7% retention of the initial signal. The small changes in both Ra and S, together with the narrow standard deviations, indicate good device-to-device reproducibility and stable interfacial sensing behavior with no significant long-term drift.
Finally, the influence of ambient humidity on sensor performance was investigated, because water vapor is a major source of baseline drift and response attenuation in chemiresistive MOS ozone sensors. As RH increased from dry air to 20%, 40%, 60%, and 80%, the baseline resistance gradually decreased, while the ozone response was retained with only moderate attenuation up to 60% RH. At 100 ppb O3, the response changed from 25.8 in dry air to 24.9, 24.1, 22.7, and 19.6 at 20%, 40%, 60%, and 80% RH, respectively. Thus, the response loss was limited to about 12.0% at 60% RH but increased to about 24.0% at 80% RH. This behavior suggests that the NGT-3 sensor has moderate humidity tolerance, but not humidity independence. Figure 13C shows the response of the NGT-3 sensor to 100 ppb ozone under different RH levels at 100 °C. The decrease in baseline resistance with increasing RH can be attributed to adsorption of water molecules and the formation of surface hydroxyl species, which modify the near-surface carrier density. At the same time, pre-adsorbed H2O/OH species compete with ozone for reactive adsorption sites and partially suppress ozone-induced electron withdrawal, thereby reducing the response at high RH. Similar humidity-induced weakening of ozone interaction has been reported for SnO2- and In2O3-based ozone sensors, where adsorption/desorption of water significantly affects response kinetics and pre-adsorbed water blocks sites otherwise available for ozone adsorption. The comparatively moderate attenuation observed here up to 60% RH may be associated with the elevated operating temperature and the graphene-containing porous architecture, which help limit persistent water accumulation on the sensing surface. However, the more pronounced decay at 80% RH indicates that water interference becomes non-negligible under highly humid conditions and should be considered in practical deployment.
3.3. Ozone sensing mechanism
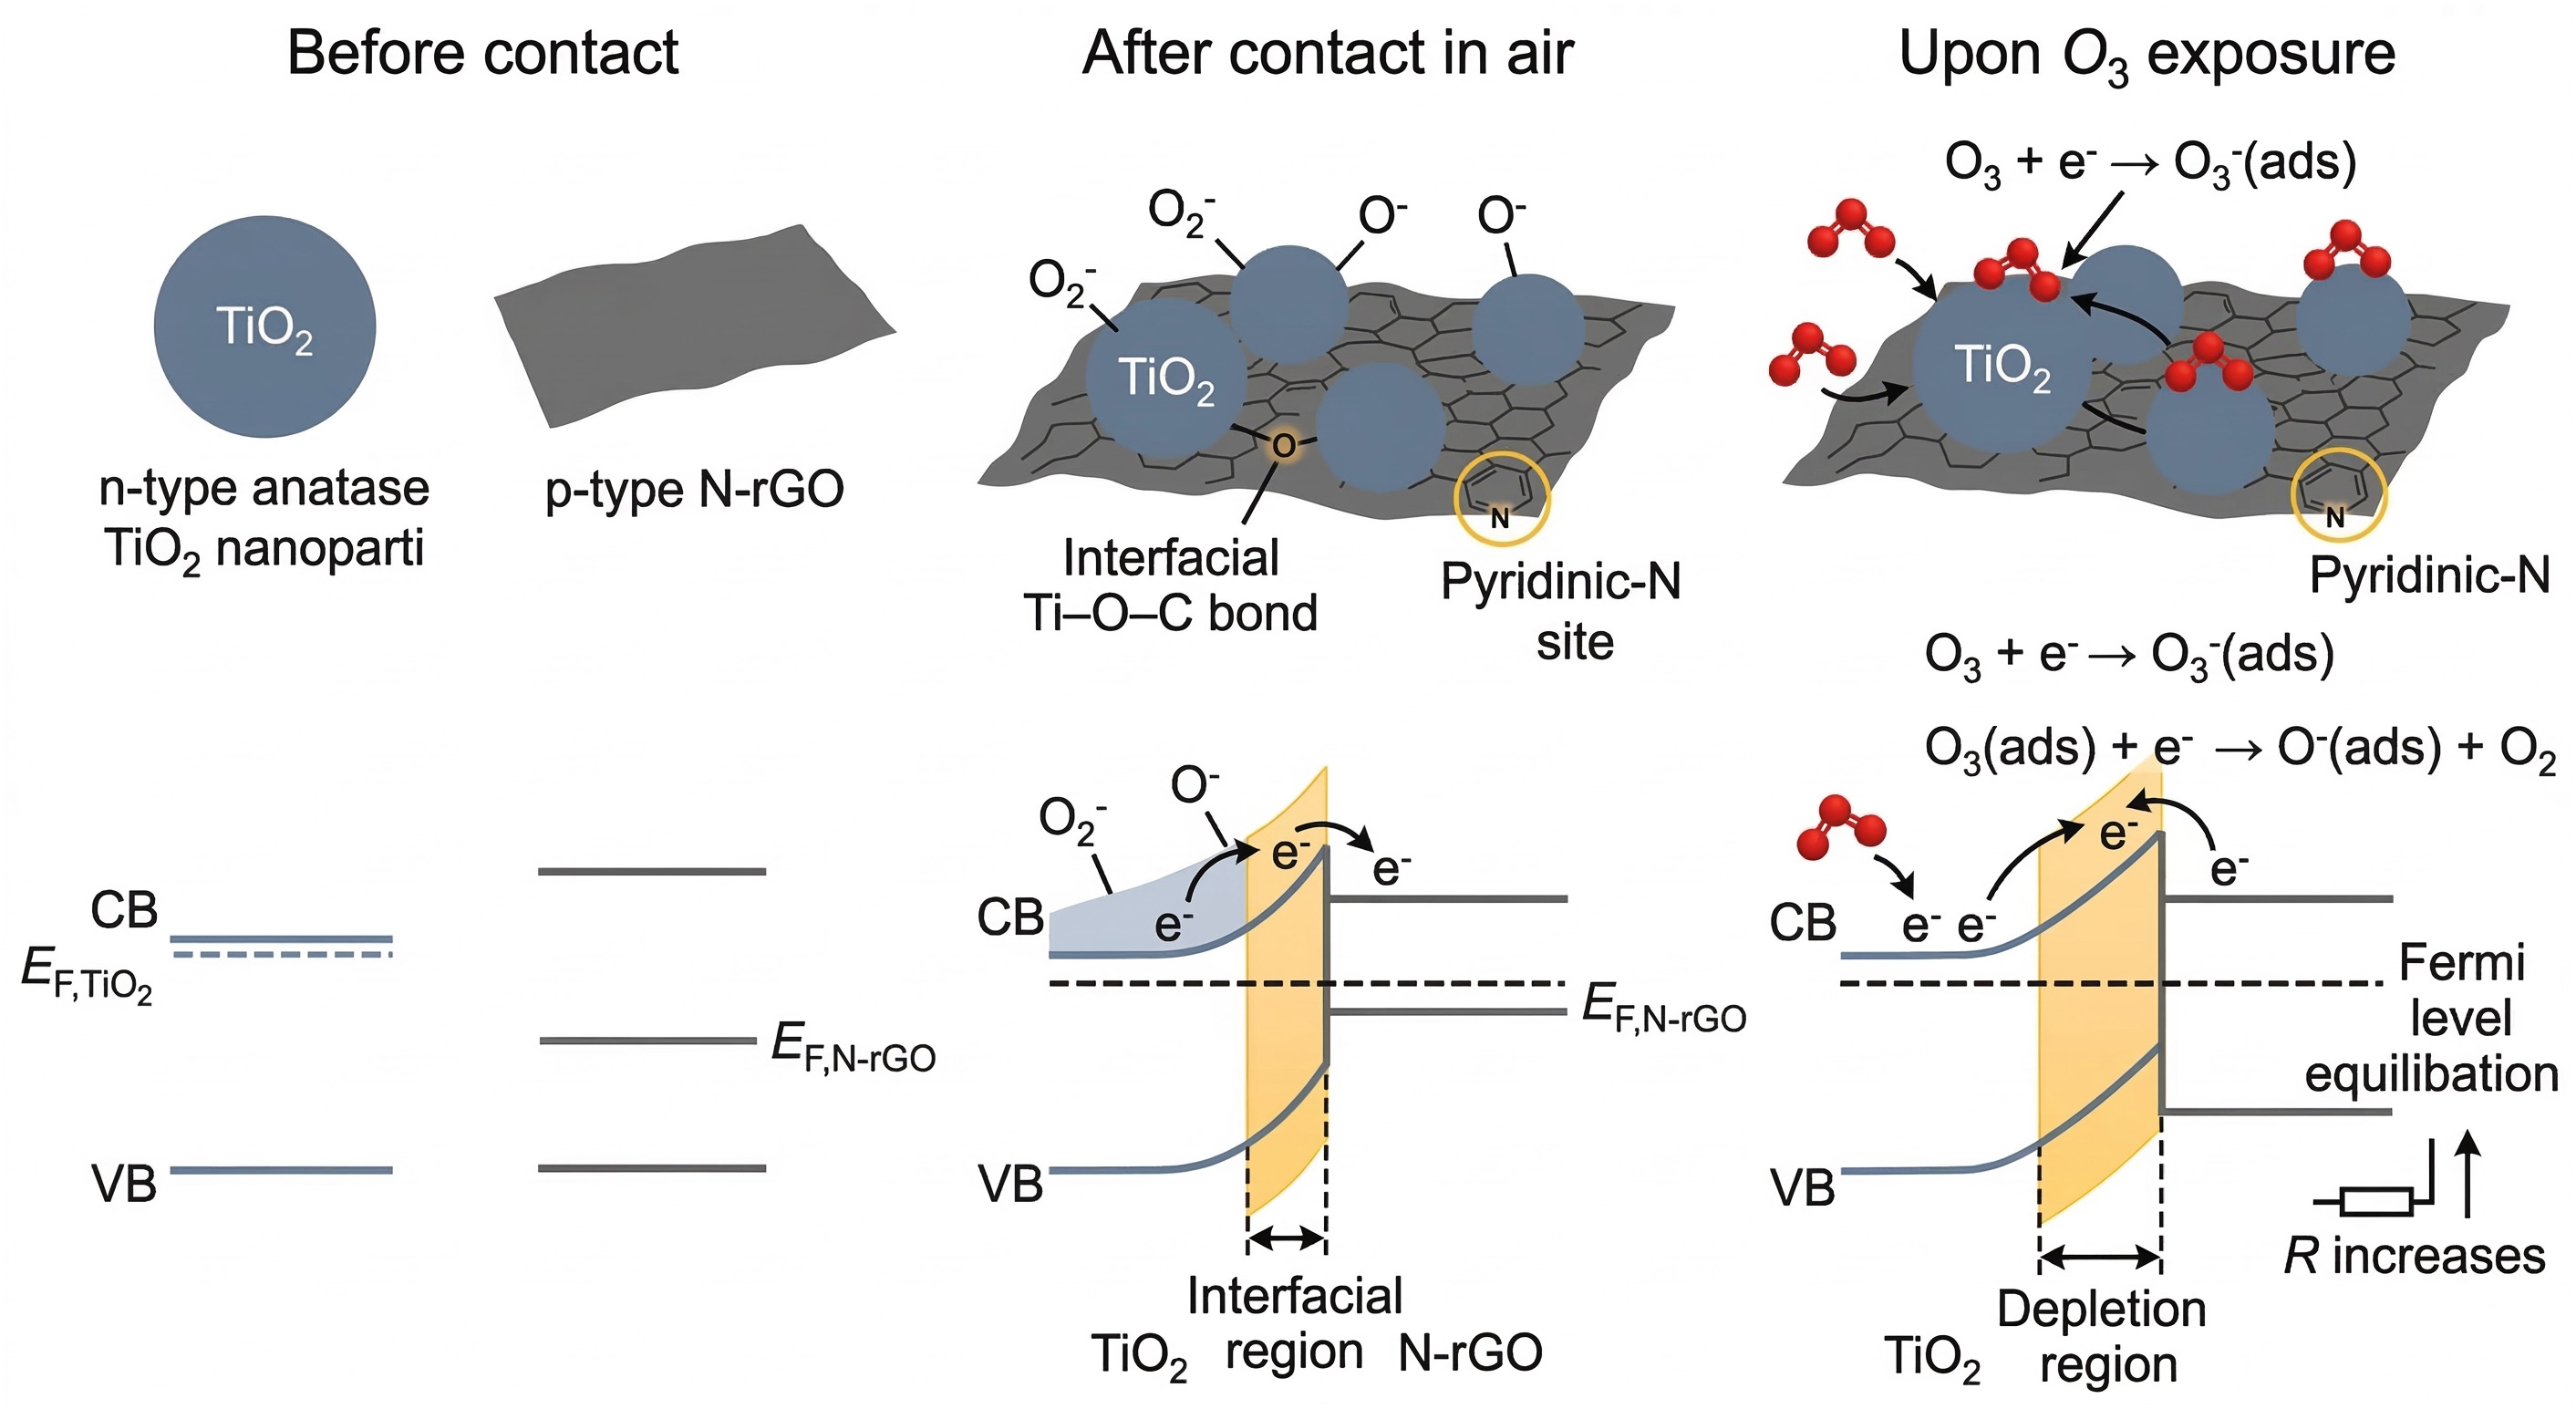
The significantly enhanced ozone sensing performance of the GT and NGT nanocomposites can be explained by a synergistic mechanism involving several key factors. The fundamental sensing mechanism of the n-type TiO2 involves surface redox reactions. When the sensor is in air, oxygen molecules adsorb on the surface and capture electrons from the TiO2 conduction band to form ionosorbed oxygen species (O2−, O−, O2−), creating an electron depletion layer (EDL) and establishing a stable baseline resistance. Upon exposure to ozone, which is a much stronger oxidizing agent than oxygen, O3 molecules directly react with the TiO2 surface or with the pre-adsorbed oxygen ions, capturing more electrons and leading to a significant expansion of the EDL, thereby increasing the sensor’s resistance. The reaction can be described as: O3(gas) + e− → O3−(ads) and O3(ads) + e− → O−(ads) + O2(gas). Under humid atmospheres, however, part of the TiO2/rGO surface can be covered by molecularly adsorbed water and hydroxyl species, which compete with ozone for accessible active sites and weaken the ozone-induced interfacial charge-transfer process, thereby lowering the net resistance modulation at high RH [60].
The incorporation of rGO enhances this fundamental mechanism in three primary ways:
-
Chemical Sensitization (Increased Active Sites): As confirmed by BET analysis, the rGO sheets provide an ultra-high specific surface area, offering a vast number of adsorption sites for ozone molecules. This leads to a higher surface coverage of the target gas, directly contributing to a larger response signal.
-
Electronic Sensitization (p-n Heterojunctions): At the TiO2/rGO interface, a depletion-type heterojunction is formed because the Fermi levels of the two components are initially mismatched (Figure 14). Before contact, anatase TiO2 behaves as an n-type semiconductor, whereas defect-rich rGO or N-rGO behaves as a hole-conducting carbon phase under ambient conditions. After contact, interfacial charge redistribution occurs until Fermi-level equilibration is reached, producing upward band bending on the TiO2 side and a widened depletion region near the heterointerface. In air, this interfacial barrier is further coupled with electron withdrawal by adsorbed oxygen species. When ozone is introduced, additional electron extraction deepens the depletion layer and increases the heterojunction barrier, producing a larger resistance modulation than in pure TiO2. In NGT-3, the interfacial effect is further strengthened by Ti–O–C bonding and by nitrogen-induced electronic polarization of the graphene phase, which together facilitate charge transfer and amplify the ozone-induced barrier variation. This pre-existing, wider depletion region is more sensitive to modulation by adsorbed ozone molecules. When ozone captures electrons, the potential barrier at the heterojunction is further increased, causing a much larger change in the overall resistance of the composite compared to pure TiO2. The Ti-O-C bonds identified by XPS facilitate this efficient charge transfer across the interface.
-
Enhanced Charge Transport: The highly conductive rGO sheets act as efficient “highways” for charge carriers, improving the overall conductivity of the composite and enabling faster signal transduction, which results in quicker response and recovery times.
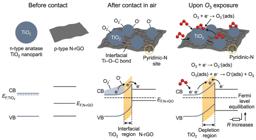
Schematic band alignment and ozone sensing mechanism of the NGT-3 heterostructure, showing Fermi-level equilibration, depletion-layer formation at the TiO₂/N-rGO interface, and barrier-height increase upon ozone adsorption.
The optimal performance observed for the GT-3 sample suggests a balance. At 1 wt% rGO (GT-1), the number of heterojunctions and active sites is limited. At 5 wt% rGO (GT-5), the excessive rGO content may lead to the shielding of TiO2 active sites and create redundant conductive pathways that bypass the sensing junctions, thus reducing the overall response.
The NGT-3 sensor demonstrates a further leap in performance due to the added benefits of nitrogen doping:
-
Creation of More Defect Sites: As shown by the higher In/In ratio in the Raman spectrum, N-doping introduces more structural defects into the graphene lattice. These defects, particularly pyridinic-N sites located at graphene edges or vacancy-adjacent regions, are expected to be more reactive toward electrophilic oxidants than basal-plane carbon atoms because pyridinic nitrogen induces strong local charge redistribution and creates chemically accessible edge states. In the present NGT-3 sample, XPS quantification shows that pyridinic-N is the dominant nitrogen configuration, accounting for 47.8% of total nitrogen, which is higher than pyrrolic-N (31.6%) and graphitic-N (20.6%). This result provides direct compositional support for correlating the enhanced ozone-sensing behavior with pyridinic-rich nitrogen functionalization. Literature on N-doped graphene has shown that pyridinic-rich configurations can strengthen gas adsorption and produce larger electronic perturbations than undoped graphene, making them plausible active sites for ozone adsorption and charge transfer in the present NGT-3 composite. Therefore, the superior response of NGT-3 is reasonably attributed not only to a higher defect density, but also to the predominance of chemically active pyridinic nitrogen functionalities, while pyrrolic and graphitic nitrogen contribute more indirectly through broader electronic modulation of the carbon network [61].
-
Modulation of Electronic Properties: Nitrogen atoms, being more electronegative than carbon, can modulate the local electronic density of the rGO sheet. This modification can enhance the charge transfer kinetics between the adsorbed ozone molecules and the sensing material, leading to a stronger and faster response. The various nitrogen configurations (pyridinic, pyrrolic, graphitic) create a complex electronic landscape that is highly favorable for selective interaction with ozone.
In summary, the exceptional ozone sensing performance of the NGT-3 nanocomposite is a result of the combined effects of the high surface area of the hierarchical structure, the electronic modulation from the p-n heterojunctions, and the enhanced catalytic activity and modified electronic properties induced by nitrogen doping.
4. CONCLUSION
In this study, we have successfully fabricated a series of graphene/TiO2 (GT) and nitrogen-doped graphene/TiO2 (NGT) nanocomposites via a facile, one-step hydrothermal synthesis followed by thermal annealing. Comprehensive material characterization confirmed the formation of hierarchical structures where anatase TiO2 nanoparticles (~13 nm) were uniformly anchored onto rGO nanosheets. The incorporation of rGO significantly increased the specific surface area and created intimate interfacial contact, while nitrogen doping effectively introduced structural defects and modified the electronic properties of the graphene lattice. The gas sensing properties of the prepared materials were systematically evaluated for ozone detection. All nanocomposites exhibited markedly superior performance compared to pure TiO2. The sensor based on the NGT-3 composite (derived from the 3 wt% nominal graphene-loading formulation) demonstrated the most outstanding performance, achieving a high response of 25.8 towards 100 ppb of ozone at a reduced optimal operating temperature of 100 °C. It also featured a low theoretical detection limit of 1.2 ppb derived from the low-concentration calibration slope, fast response/recovery times (18 s/45 s), reproducible performance across independently fabricated devices, and stable operation over 30 days. The selectivity study showed a clear preference for O3 over common interferents, although measurable cross-sensitivity to NO2 was observed at comparable ppb levels. The remarkable enhancement in sensing performance was attributed to a synergistic mechanism. This includes the high specific surface area providing abundant active sites, the formation of p-n heterojunctions at the rGO-TiO2 interface which amplifies the resistance modulation, and the catalytic and electronic promotion effects induced by nitrogen doping. This work not only provides a scalable method for producing advanced composite materials but also demonstrates that N-doped graphene/TiO2 nanocomposites are exceptionally promising candidates for the development of next-generation, high-performance, and low-power-consumption sensors for real-time environmental monitoring of trace-level ozone.
5. DATA AVAILABILITY
The full dataset supporting the findings of this study is available upon request to the corresponding author.
6. BIBLIOGRAPHY
-
[1] PETRUCI, J.F.S., BARRETO, D.N., DIAS, M.A., et al., “Analytical methods applied for ozone gas detection: A review”, Trends in Analytical Chemistry, v. 149, pp. 116552, Apr. 2022. doi: https://doi.org/10.1016/j.trac.2022.116552.
» https://doi.org/10.1016/j.trac.2022.116552 -
[2] LI, S., SONG, G., XING, J., et al., “Unraveling overestimated exposure risks through hourly ozone retrievals from next-generation geostationary satellites”, Nature Communications, v. 16, n. 1, pp. 3364, Apr. 2025. doi: https://doi.org/10.1038/s41467-025-58652-2. PubMed PMID: 40204746.
» https://doi.org/10.1038/s41467-025-58652-2 -
[3] LI, X., PAN, Y., GUO, M., “Research on a novel citrus pectin-bentonite composite with enhanced rheological properties”, Matéria, v. 31, pp. e20250552, 2026. doi: https://doi.org/10.1590/1517-7076-rmat-2025-0552.
» https://doi.org/10.1590/1517-7076-rmat-2025-0552 -
[4] XIE, W., LI, X., TONG, T., et al., “2D CO3 O4 nanosheets for high selectivity and response of H2 S gas sensing performances”, Journal of Nanoelectronics and Optoelectronics, v. 19, n. 11, pp. 1156–1164, Nov. 2024. doi: https://doi.org/10.1166/jno.2024.3675.
» https://doi.org/10.1166/jno.2024.3675 -
[5] TIAN, X., CUI, X., LAI, T., et al., “Gas sensors based on TiO2 nanostructured materials for the detection of hazardous gases: A review”, Nano Materials Science, v. 3, n. 4, pp. 390–403, Dec. 2021. doi: https://doi.org/10.1016/j.nanoms.2021.05.011.
» https://doi.org/10.1016/j.nanoms.2021.05.011 -
[6] NOVOSELOV, K.S., GEIM, A.K., MOROZOV, S.V., et al., “Electric field effect in atomically thin carbon films”, Science, v. 306, n. 5696, pp. 666–669, Oct. 2004. doi: https://doi.org/10.1126/science.1102896. PubMed PMID: 15499015.
» https://doi.org/10.1126/science.1102896 -
[7] FAN, Z., YUAN, L., XIA, T., et al., “Enhanced Alzheimer’s biomarker detection using a ternary composite electrochemical aptasensor”, Mikrochimica Acta, v. 192, n. 3, pp. 167, Mar. 2025. doi: https://doi.org/10.1007/s00604-024-06927-8. PubMed PMID: 39955684.
» https://doi.org/10.1007/s00604-024-06927-8 -
[8] ANSARI, S.A., LOPA, N.S., PARVEEN, N., et al., “A highly sensitive poly(chrysoidine G)–gold nanoparticle composite based nitrite sensor for food safety applications”, Analytical Methods : Advancing Methods and Applications, v. 12, n. 46, pp. 5562–5571, 2020. doi: https://doi.org/10.1039/D0AY01761B. PubMed PMID: 33226391.
» https://doi.org/10.1039/D0AY01761B -
[9] ARADE, S., BALGUDE, S., KOUNSALYE, J., et al., “Magnetically separable Cu0.5Ni0.5MnFeO4@GO nanocomposites for efficient methylene blue removal”, Journal of Materials Science Materials in Electronics, v. 35, n. 24, pp. 1636, Aug. 2024. doi: https://doi.org/10.1007/s10854-024-13405-7.
» https://doi.org/10.1007/s10854-024-13405-7 -
[10] GEIM, A.K., NOVOSELOV, K.S., “The rise of graphene”, Nature Materials, v. 6, n. 3, pp. 183–191, Mar. 2007. doi: https://doi.org/10.1038/nmat1849. PubMed PMID: 17330084.
» https://doi.org/10.1038/nmat1849 -
[11] ADEEL, M., ASIF, K., ALSHABOUNA, F., et al., “Label-free electrochemical aptasensor for the detection of SARS-CoV-2 spike protein based on carbon cloth sputtered gold nanoparticles”, Biosensors & Bioelectronics: X, v. 12, pp. 100256, Dec. 2022. doi: https://doi.org/10.1016/j.biosx.2022.100256. PubMed PMID: 36187906.
» https://doi.org/10.1016/j.biosx.2022.100256 -
[12] UMAR, A., HUSSAIN, S., ANSARI, S.A., et al., “Indium oxide nanocubes for enhanced ethanol gas sensing and photocatalytic applications”, Ceramics International, v. 51, n. 12, pp. 16037–16045, May. 2025. doi: https://doi.org/10.1016/j.ceramint.2025.01.439.
» https://doi.org/10.1016/j.ceramint.2025.01.439 -
[13] ANSARI, S.A., KHATOON, Z., PARVEEN, N., et al., “Polyaniline-functionalized TiO2 nanoparticles as a suitable matrix for hydroquinone sensor”, Science of Advanced Materials, v. 9, n. 11, pp. 2032–2038, Nov. 2017. doi: https://doi.org/10.1166/sam.2017.3158.
» https://doi.org/10.1166/sam.2017.3158 -
[14] CHINNADURAI, G., NAGARAJAN, S., “Development of advanced sensor materials and encryption techniques for secure Wireless Body Area Networks (WBANs) in healthcare applications”, Matéria, v. 31, pp. e20250390, 2026. doi: https://doi.org/10.1590/1517-7076-rmat-2025-0390.
» https://doi.org/10.1590/1517-7076-rmat-2025-0390 -
[15] GALSTYAN, V., PONZONI, A., KHOLMANOV, I., et al., “Reduced graphene oxide–TiO2 nanotube composite: Comprehensive study for gas-sensing applications”, ACS Applied Nano Materials, v. 1, n. 12, pp. 7098–7105, 2018. doi: https://doi.org/10.1021/acsanm.8b01924.
» https://doi.org/10.1021/acsanm.8b01924 -
[16] LING, Y., YU, Y., TIAN, C., et al., “Improving the NO2 Gas Sensing Performances at Room Temperature Based on TiO2 NTs/rGO Heterojunction Nanocomposites”, Nanomaterials, v. 14, n. 22, pp. 1844, 2024. doi: https://doi.org/10.3390/nano14221844. PubMed PMID: 39591084.
» https://doi.org/10.3390/nano14221844 -
[17] SHEN, J., YAN, B., SHI, M., et al., “One step hydrothermal synthesis of TiO 2-reduced graphene oxide sheets”, Journal of Materials Chemistry, v. 21, n. 10, pp. 3415–3421, 2011. doi: https://doi.org/10.1039/c0jm03542d.
» https://doi.org/10.1039/c0jm03542d -
[18] PERERA, S.D., MARIANO, R.G., VU, K., et al., “Hydrothermal synthesis of Graphene-TiO2 nanotube composites with enhanced photocatalytic activity”, ACS Catalysis, v. 2, n. 6, pp. 949-956, Jun. 2012. doi: https://doi.org/10.1021/cs200621c.
» https://doi.org/10.1021/cs200621c -
[19] ZHANG, Y., TANG, Z.-R., FU, X., et al., “TiO2−graphene nanocomposites for gas-phase photocatalytic degradation of volatile aromatic pollutant: Is TiO2−graphene truly different from other TiO2−carbon composite materials?”, ACS Nano, v. 4, n. 12, pp. 7303–7314, Dec. 2010. doi: https://doi.org/10.1021/nn1024219. PubMed PMID: 21117654.
» https://doi.org/10.1021/nn1024219 -
[20] PADMANABHAN, N.T., THOMAS, N., LOUIS, J., et al., “Graphene coupled TiO2 photocatalysts for environmental applications: A review”, Chemosphere, v. 271, pp. 129506, May. 2021. doi: https://doi.org/10.1016/j.chemosphere.2020.129506. PubMed PMID: 33445017.
» https://doi.org/10.1016/j.chemosphere.2020.129506 -
[21] NEMEA, A.A., AL-ABDALY, B.I., “Improving the performance of titanium oxide nanocomposites as NO2 gas sensors for optimum sensitivity”, Iraqi Journal of Science, v. 65, n. 3, pp. 1200–1211, 2024. doi: https://doi.org/10.24996/ijs.2024.65.3.3.
» https://doi.org/10.24996/ijs.2024.65.3.3 -
[22] MIAO, S., LIANG, K., ZHU, J., et al., “Hetero-atom-doped carbon dots: Doping strategies, properties and applications”, Nano Today, v. 33, pp. 100879, Aug. 2020. doi: https://doi.org/10.1016/j.nantod.2020.100879.
» https://doi.org/10.1016/j.nantod.2020.100879 -
[23] LV, R., LI, Q., BOTELLO-MÉNDEZ, A.R., et al., “Nitrogen-doped graphene: beyond single substitution and enhanced molecular sensing”, Scientific Reports, v. 2, n. 1, pp. 586, Aug. 2012. doi: https://doi.org/10.1038/srep00586. PubMed PMID: 22905317.
» https://doi.org/10.1038/srep00586 -
[24] CRUZ-MARTÍNEZ, H., ROJAS-CHÁVEZ, H., MONTEJO-ALVARO, F., et al., “Recent developments in graphene-based toxic gas sensors: a theoretical overview”, Sensors, v. 21, n. 6, pp. 1992, 2021. doi: https://doi.org/10.3390/s21061992. PubMed PMID: 33799914.
» https://doi.org/10.3390/s21061992 -
[25] ZHANG, Y.-H., CHEN, Y.B., ZHOU, K.G., et al., “Improving gas sensing properties of graphene by introducing dopants and defects: a first-principles study”, Nanotechnology, v. 20, n. 18, pp. 185504, Apr. 2009. doi: https://doi.org/10.1088/0957-4484/20/18/185504. PubMed PMID: 19420616.
» https://doi.org/10.1088/0957-4484/20/18/185504 -
[26] MA, C., SHAO, X., CAO, D., “Nitrogen-doped graphene as an excellent candidate for selective gas sensing”, Science China. Chemistry, v. 57, n. 6, pp. 911–917, Jun. 2014. doi: https://doi.org/10.1007/s11426-014-5066-2.
» https://doi.org/10.1007/s11426-014-5066-2 -
[27] ANSARI, Z., KADAM, S., KASABE, S., et al., “Optimized Mn doped ZnO@rGO nanocomposites: a breakthrough for advanced energy storage and PEC systems”, Ionics, v. 31, n. 8, pp. 8151–8172, Aug. 2025. doi: https://doi.org/10.1007/s11581-025-06468-x.
» https://doi.org/10.1007/s11581-025-06468-x -
[28] SUN, L., WANG, L., TIAN, C., et al., “Nitrogen-doped graphene with high nitrogen level via a one-step hydrothermal reaction of graphene oxide with urea for superior capacitive energy storage”, RSC Advances, v. 2, n. 10, pp. 4498, 2012. doi: https://doi.org/10.1039/c2ra01367c.
» https://doi.org/10.1039/c2ra01367c -
[29] KIM, Y., JOO, S.H., SHIN, S.G., et al., “Effect of annealing in ITO film prepared at various argon-and-oxygen-mixture ratios via facing-target sputtering for transparent electrode of perovskite solar cells”, Coatings, v. 12, n. 2, pp. 203, 2022. doi: https://doi.org/10.3390/coatings12020203.
» https://doi.org/10.3390/coatings12020203 -
[30] PREETI, T., MAJHI, T., SINGH, R.K., et al., “Recovery and investigation of ITO coated-glass substrates from laboratory grade discarded perovskite solar cells for their sustainable reuse”, Next Materials, v. 6, pp. 100495, Jan. 2025. doi: https://doi.org/10.1016/j.nxmate.2025.100495.
» https://doi.org/10.1016/j.nxmate.2025.100495 -
[31] LIU, H., XU, S., LI, M., et al., “Chemiresistive gas sensors employing solution-processed metal oxide quantum dot films”, Applied Physics Letters, v. 105, n. 16, pp. 163104, Oct. 2014. doi: https://doi.org/10.1063/1.4900405.
» https://doi.org/10.1063/1.4900405 -
[32] MASUDA, Y., KATO, K., “Synthesis and phase transformation of TiO2 nano-crystals in aqueous solutions”, Journal of the Ceramic Society of Japan, v. 117, n. 1363, pp. 373–376, Mar. 2009. doi: https://doi.org/10.2109/jcersj2.117.373.
» https://doi.org/10.2109/jcersj2.117.373 -
[33] GAI, L.-X., WANG, W.-Q., WU, X., et al., “NIR absorbing reduced graphene oxide for photothermal radiotherapy for treatment of esophageal cancer”, Journal of Photochemistry and Photobiology. B, Biology, v. 194, pp. 188–193, May. 2019. doi: https://doi.org/10.1016/j.jphotobiol.2019.03.014. PubMed PMID: 31004866.
» https://doi.org/10.1016/j.jphotobiol.2019.03.014 -
[34] LI, Z., DENG, L., KINLOCH, I.A., et al., “Raman spectroscopy of carbon materials and their composites: Graphene, nanotubes and fibres”, Progress in Materials Science, v. 135, pp. 101089, Jun. 2023. doi: https://doi.org/10.1016/j.pmatsci.2023.101089.
» https://doi.org/10.1016/j.pmatsci.2023.101089 -
[35] LEVE, Z.D., IWUOHA, E.I., ROSS, N., “The synergistic properties and gas sensing performance of functionalized graphene-based sensors”, Materials, v. 15, n. 4, pp. 1326, Feb. 2022. doi: https://doi.org/10.3390/ma15041326. PubMed PMID: 35207867.
» https://doi.org/10.3390/ma15041326 -
[36] LI, H., CHEN, Y., YANG, X., et al., “Quantitative determination of Cd in single hair strands using laser ablation inductively coupled plasma mass spectrometry (LA-ICP-MS)”, Matéria, v. 31, pp. e20250408, 2026. doi: https://doi.org/10.1590/1517-7076-rmat-2025-0408.
» https://doi.org/10.1590/1517-7076-rmat-2025-0408 -
[37] UMAR, A., AKBAR, S., KUMAR, R., et al., “Unveiling the potential of PANI@MnO2@rGO ternary nanocomposite in energy storage and gas sensing”, Chemosphere, v. 349, pp. 140657, Feb. 2024. doi: https://doi.org/10.1016/j.chemosphere.2023.140657. PubMed PMID: 38000555.
» https://doi.org/10.1016/j.chemosphere.2023.140657 -
[38] KIM, S., AYALA, I., STEENHUIS, J.J., et al., “Infrared spectroscopic identification of the C–O stretching vibration associated with the tyrosyl Z. and D. radicals in photosystem II”, Biochimica et Biophysica Acta (BBA) - Bioenergetics, v. 1364, n. 3, pp. 337–360, May. 1998. doi: https://doi.org/10.1016/S0005-2728(98)00016-4. PubMed PMID: 9630714.
» https://doi.org/10.1016/S0005-2728(98)00016-4 -
[39] GIUBERTONI, G., SOFRONOV, O.O., BAKKER, H.J., “Effect of intramolecular hydrogen-bond formation on the molecular conformation of amino acids”, Communications Chemistry, v. 3, n. 1, pp. 84, Jun. 2020. doi: https://doi.org/10.1038/s42004-020-0329-7. PubMed PMID: 36703397.
» https://doi.org/10.1038/s42004-020-0329-7 -
[40] AGALE, P., SALVE, V., ARADE, S., et al., “Tailoring structural and chemical properties of ZnO@ g-C3N4 nanocomposites through Sr doping: Insights from multi technique characterization”, Solid State Sciences, v. 166, pp. 107960, Aug. 2025. doi: https://doi.org/10.1016/j.solidstatesciences.2025.107960.
» https://doi.org/10.1016/j.solidstatesciences.2025.107960 -
[41] ANSARI, Z., KADAM, S., SALVE, V., et al., “Structural, electrochemical, and photoelectrochemical performance of Cr doped ZnO@rGO nanocomposites synthesized via Sol-Gel and hydrothermal methods”, Journal of Molecular Structure, v. 1349, pp. 143761, Jan. 2026. doi: https://doi.org/10.1016/j.molstruc.2025.143761.
» https://doi.org/10.1016/j.molstruc.2025.143761 -
[42] SHI, K., SANTISO, E.E., GUBBINS, K.E., “Current advances in characterization of nano-porous materials: pore size distribution and surface area”, In: Moreno-Piraján, J. C., Giraldo-Gutierrez, L., Gómez-Granados, F. (eds), Porous materials: theory and its application for environmental remediation, Cham, Springer International Publishing, pp. 315–340, 2021. doi: https://doi.org/10.1007/978-3-030-65991-2_12.
» https://doi.org/10.1007/978-3-030-65991-2_12 -
[43] BENNETT, T.D., COUDERT, F.-X., JAMES, S.L., et al., “The changing state of porous materials”, Nature Materials, v. 20, n. 9, pp. 1179–1187, Sep. 2021. doi: https://doi.org/10.1038/s41563-021-00957-w. PubMed PMID: 33859380.
» https://doi.org/10.1038/s41563-021-00957-w -
[44] WANG, D.H., HU, Y., ZHAO, J.J., et al., “Holey reduced graphene oxide nanosheets for high performance room temperature gas sensing”, Journal of Materials Chemistry. A, Materials for Energy and Sustainability, v. 2, n. 41, pp. 17415–17420, Aug. 2014. doi: https://doi.org/10.1039/C4TA03740E.
» https://doi.org/10.1039/C4TA03740E -
[45] SMITH, M., SCUDIERO, L., ESPINAL, J., et al., “Improving the deconvolution and interpretation of XPS spectra from chars by ab initio calculations”, Carbon, v. 110, pp. 155–171, Dec. 2016. doi: https://doi.org/10.1016/j.carbon.2016.09.012.
» https://doi.org/10.1016/j.carbon.2016.09.012 -
[46] KUBALA-KUKUŚ, A., BANAŚ, D., STABRAWA, I., et al., “Analysis of Ti and TiO2 nanolayers by total reflection X-ray photoelectron spectroscopy”, Spectrochimica Acta. Part B, Atomic Spectroscopy, v. 145, pp. 43–50, Jul. 2018. doi: https://doi.org/10.1016/j.sab.2018.03.012.
» https://doi.org/10.1016/j.sab.2018.03.012 -
[47] KITCHAMSETTI, N., KALUBARME, R.S., CHIKATE, P.R., et al., “An investigation on the effect of Li–Ion cycling on the vertically aligned brookite TiO2 nanostructure”, ChemistrySelect, v. 4, n. 21, pp. 6620–6626, Jun. 2019. doi: https://doi.org/10.1002/slct.201900395.
» https://doi.org/10.1002/slct.201900395 -
[48] TIAN, K., WANG, J., CAO, L., et al., “Single-site pyrrolic-nitrogen-doped sp2-hybridized carbon materials and their pseudocapacitance”, Nature Communications, v. 11, n. 1, pp. 3884, Aug. 2020. doi: https://doi.org/10.1038/s41467-020-17727-y. PubMed PMID: 32753658.
» https://doi.org/10.1038/s41467-020-17727-y -
[49] SHANG, Y., DING, Y., ZHANG, P., et al., “Pyrrolic N or pyridinic N: The active center of N-doped carbon for CO2 reduction”, Chinese Journal of Catalysis, v. 43, n. 9, pp. 2405–2413, Sep. 2022. doi: https://doi.org/10.1016/S1872-2067(22)64122-6.
» https://doi.org/10.1016/S1872-2067(22)64122-6 -
[50] WANAG, A., KUSIAK-NEJMAN, E., CZYŻEWSKI, A., et al., “Influence of rGO and preparation method on the physicochemical and photocatalytic properties of TiO₂/reduced graphene oxide photocatalysts”, Catalysts, v. 11, n. 11, pp. 1333, Nov. 2021. doi: https://doi.org/10.3390/catal11111333.
» https://doi.org/10.3390/catal11111333 -
[51] YE, Q., LI, C., YANG, T., et al., “Relationship between desorption amount and temperature variation in the process of coal gas desorption”, Fuel, v. 332, pp. 126146, Jan. 2023. doi: https://doi.org/10.1016/j.fuel.2022.126146.
» https://doi.org/10.1016/j.fuel.2022.126146 -
[52] KNOPF, D.A., AMMANN, M., BERKEMEIER, T., et al., “Desorption lifetimes and activation energies influencing gas–surface interactions and multiphase chemical kinetics”, Atmospheric Chemistry and Physics, v. 24, n. 6, pp. 3445–3528, Mar. 2024. doi: https://doi.org/10.5194/acp-24-3445-2024.
» https://doi.org/10.5194/acp-24-3445-2024 -
[53] YAN, Z., ZHANG, Y., KANG, W., et al., “TiO2 gas sensors combining experimental and DFT calculations: a review”, Nanomaterials, v. 12, n. 20, pp. 3611, 2022. doi: https://doi.org/10.3390/nano12203611. PubMed PMID: 36296801.
» https://doi.org/10.3390/nano12203611 -
[54] CHIEN, F.S.-S., WANG, C.-R., CHAN, Y.-L., et al., “Fast-response ozone sensor with ZnO nanorods grown by chemical vapor deposition”, Sensors and Actuators. B, Chemical, v. 144, n. 1, pp. 120–125, Jan. 2010. doi: https://doi.org/10.1016/j.snb.2009.10.043.
» https://doi.org/10.1016/j.snb.2009.10.043 -
[55] TSAI, Y.-T., CHANG, S.-J., TANG, I.-T., et al., “High density novel porous ZnO nanosheets based on a microheater chip for ozone sensors”, IEEE Sensors Journal, v. 18, n. 13, pp. 5559–5565, Jul. 2018. doi: https://doi.org/10.1109/JSEN.2018.2830508.
» https://doi.org/10.1109/JSEN.2018.2830508 -
[56] CATTO, A.C., FIORIDO, T., SOUZA, É.L.S., et al., “Improving the ozone gas-sensing properties of CuWO4 nanoparticles”, Journal of Alloys and Compounds, v. 748, pp. 411–417, Jun. 2018. doi: https://doi.org/10.1016/j.jallcom.2018.03.104.
» https://doi.org/10.1016/j.jallcom.2018.03.104 -
[57] LIU, L., LI, T., YI, Z., et al., “Conductometric ozone sensor based on mesoporous ultrafine Co3O4 nanobricks”, Sensors and Actuators. B, Chemical, v. 297, pp. 126815, Oct. 2019. doi: https://doi.org/10.1016/j.snb.2019.126815.
» https://doi.org/10.1016/j.snb.2019.126815 -
[58] THIRUMALAIRAJAN, S., GIRIJA, K., MASTELARO, V.R., et al., “Enhanced ultrasensitive detection of ozone gas using reduced graphene oxide-incorporated LaFeO3 nanospheres for environmental remediation process”, Journal of Materials Science Materials in Electronics, v. 31, n. 11, pp. 8933–8945, Jun. 2020. doi: https://doi.org/10.1007/s10854-020-03428-1.
» https://doi.org/10.1007/s10854-020-03428-1 -
[59] DE LIMA, B.S., KOMORIZONO, A.A., SILVA, W.A.S., et al., “Ozone detection in the ppt-level with rGO-ZnO based sensor”, Sensors and Actuators. B, Chemical, v. 338, pp. 129779, Jul. 2021. doi: https://doi.org/10.1016/j.snb.2021.129779.
» https://doi.org/10.1016/j.snb.2021.129779 -
[60] KOROTCENKOV, G., BLINOV, I., BRINZARI, V., et al., “Effect of air humidity on gas response of SnO2 thin film ozone sensors”, Sensors and Actuators. B, Chemical, v. 122, n. 2, pp. 519–526, Mar. 2007. doi: https://doi.org/10.1016/j.snb.2006.06.025.
» https://doi.org/10.1016/j.snb.2006.06.025 -
[61] NATH, U., SARMA, M., “Pyridinic dominance N-Doped graphene: a potential material for SO2 gas detection”, The Journal of Physical Chemistry. A, v. 127, n. 5, pp. 1112–1123, Feb. 2023. doi: https://doi.org/10.1021/acs.jpca.2c06154. PubMed PMID: 36716442.
» https://doi.org/10.1021/acs.jpca.2c06154