
 An experimental study on prediction of residual strength of steel rods by electrical resistivity technique
ABSTRACT
In recent days, the corrosion of steel reinforcement has emerged as a significant concern for Civil engineers in the construction industry. As a result, considerable attention has been directed toward developing methods to predict the service life of reinforced concrete structures. Corrosion often remains undetectable until visible signs such as cracking or delamination appear. To deduce this, electrochemical methods are traditionally utilized to observe its development. Among these, the half-cell potential measurement technique is extensively applied to evaluate the possibility of corrosion. This research develops a method for determining the probability of steel rod corrosion using the half-cell potential technique. The evaluation applied a galvanostatic method on 10 mm, 12 mm, and 16 mm in diameter steel rods. Corrosion potential (Ecorr) and concrete resistivity (ρ) measurements were recorded at every point on a pre-determined interval. A predictive model in SPSS was built to forecast each rod corrosion rate and ultimate tensile strength. The experimental results corresponded closely with the predicted values, with percentage differences of 3.4%, 2.6%, and 0.9% for the 10 mm, 12 mm, and 16 mm rods, respectively. These observations validate that electrical resistivity is a most appropriate and good indicator for forecasting steel reinforcement corrosion rate and tensile strength.
Keywords:
Tensile strength; Rate of corrosion; Electrical Resistivity; SPSS and Half-cell potential.
1. INTRODUCTION
Corrosion is one of the most significant threats to the safety of structures in reinforced concrete, and the deterioration of steel reinforcement is thus a serious concern in the construction field [1, 2]. Regular monitoring and inspection are necessary to assess the degree of reinforcement corrosion to make these structures durable and safe [3, 4]. Over the past decade, much attention has been devoted to new reliable techniques to predict the long-term service life of concrete structures [5, 6]. The trend is now leaning towards non-destructive and semi-destructive methods for evaluating reinforcement corrosion, pushing the quest for practical and precise evaluation techniques [7]. These methods are less expensive and simpler to apply, thus very much favored for research and field implementation [8]. Most studies in this domain focus on corrosion in reinforced concrete, utilizing various electrochemical techniques for monitoring and assessment [9]. One key indicator is concrete resistivity: when it falls below 10 Ωm, active corrosion of the rebar is likely, whereas values above 30 Ωm suggest a lower risk [10]. Factors such as ionic conductivity of the concrete electrolyte, ambient humidity, temperature, and the quality of the concrete cover significantly influence corrosion potential [11]. Steel resistivity is a quantitative measure of ionic conductivity and is inversely related to the corrosion rate [12]. Its value is heavily influenced by environmental humidity and the porosity of the concrete [5]. This study explores the relationship between electrical resistivity and corrosion in steel, examining the effects of various influencing factors, including curing conditions and rebar diameter.
1.1. Brief literature
The urbanization process, as well as economic growth, creates a severe damage to the environment and sustainability [13]. One of the most degradation mechanisms in steel structures is the formation of corrosion, which causes permanent failure in the structures [14]. In reinforced concrete structures, the most threatening challenge to the service of the structures is corrosion, which leads to degradation of the structure [15]. The continuous formation of mass loss and the formation of pits in the steel will reduce its strength. During a fire, concrete structures undergo high temperatures, which lead to reduced evaporation of moisture as well as the hydration products of the concrete [16]. The flow of stress in metals will be affected by heat and electric current when the metals are subjected to electric currents [17]. To overcome these issues, studies were conducted to address the problems. AZARSA and GUPTA [18] attempted a study regarding corroded infrastructure, emphasizing that even structurally sound bridges can pose risks if corrosion occurs. It advocates for proactive corrosion assessment as a vital asset management component to ensure public safety and infrastructure reliability [8]. A formula was introduced to calculate concrete resistivity from electrical resistance (RE) using the INESSCOM corrosion sensor. This versatile method supports AC and PSV measurements and enables simultaneous monitoring of corrosion rate and resistivity with a single embedded sensor, enhancing efficiency in corrosion tracking [19]. Non-destructive electrochemical techniques were recommended for estimating corrosion current density (icorr) in large concrete structures using Polarization Resistance (Rp). Initial measurements include free corrosion potential (Ecorr) and electrical resistance (Re), from which concrete resistivity can be derived. While icorr indicates corrosion activity, it does not quantify actual steel loss, necessitating direct observation for assessing structural damage. TRAN [20] reviewed 13 years of in-situ corrosion rate data using the Modulated Current Confinement (MCC) method. MCC is a promising non-destructive technique for preventive maintenance. Challenges include poor current confinement in low-resistivity environments and over-polarization of passive steel. Improving electrochemical current control is key to enhancing MCC reliability and guiding the development of advanced corrosion meters. BOURREAU et al. [21] proposed predictive models for concrete resistivity and steel corrosion potential, incorporating factors such as hydration, porosity, and chloride content. Experimental findings showed increased hydration and fly ash improved corrosion resistance, while chloride ions accelerated degradation. These models support long-term durability assessments of reinforced concrete. AZARSA and GUPTA [18] highlighted that concrete durability is influenced by its resistance to aggressive media penetration through diffusion, absorption, and capillary suction. In real-world conditions, these transport mechanisms often act simultaneously. Understanding their interactions is crucial for predicting long-term concrete performance.
1.2. Research significance and aim
The core objective of this study is to explore the basic characteristics of steel rods and electrical arrangements for setting up an electrical resistivity method, identify suitable accelerated corrosion techniques for varying rod diameters over different durations, and determine the corrosion rate and tensile strength of steel rods at different time intervals. A predictive equation will be developed using SPSS software to estimate corrosion rate and strength across various diameters, and its accuracy will be validated with additional rod sizes. The scope includes analyzing the influence of parameters such as corrosion rate, electrical resistance, tensile strength, and steel grade on resistivity. Using the developed predictive model, the study also aims to establish a relationship between resistivity and corrosion rate in steel.
1.3. Manuscript structure
This manuscript has been structured as follows. Section 2 describes the materials and instrumentation used in the study, section 3 presents the experimental investigation, including preparation, experimental setup & testing procedure, section 4 details the results the trend summary, analytical study by SPSS and their comparative analysis, section 5 includes the discussion of the results, section 6 detailed the conclusion of the study, section 7 shows the limitation of the study and section 8 recommends the future scope of the research.
2. MATERIALS USED
The materials used in this study include steel rods of various diameters, which serve as the primary specimens for corrosion testing. A DC machine was employed to supply a constant electrical current for inducing accelerated corrosion, while resistors were used to control and stabilize the current flow in the circuit. Distilled water was taken, which served as the base electrolyte medium, and Nacl (sodium chloride) solution was added to simulate a corrosive environment and accelerate the corrosion process. These materials enabled the controlled study of corrosion behaviour, electrical resistivity, and strength degradation in steel rods under different conditions.
3. EXPERIMENTAL INVESTIGATION
This research included several essential steps to analyze corrosion behavior of Fe 415 of 10mm, 12mm and 16mm diameter steel reinforcement rods. First, the steel rods were cleaned and made ready for testing. A hole of ¾ inch was drilled at one end of each rod with the help of a precision drilling machine so that there will be even width and radius as illustrated by the Figure 1. These holes were provided for fitting copper wires chosen for their superior resistance to corrosion and good conductivity.

The copper wires were placed in the holes drilled to create a firm electrical connection, as depicted in the Figure 2 to enable voltage and current to be provided from a voltmeter and ammeter to the steel samples. This setup enabled accurate monitoring of the corrosion rate. Corrosion was then induced in the steel rods, targeting different diameters over varying durations. After the corrosion process, the rods were visually inspected for surface deterioration, weighed to assess material loss, and subjected to tensile testing to evaluate the impact of corrosion on mechanical strength.

3.1. Preparation of NACL solutions
Distilled water is produced by boiling water into vapour and then condensing it back into liquid in a separate container, resulting in a highly purified form of water. Due to its lack of ions and impurities, distilled water alone cannot effectively induce corrosion in steel specimens. A sodium chloride (Nacl) solution is introduced as an electrolyte to simulate corrosion artificially, facilitating the electrochemical reaction between the anode and cathode. In a 7% Nacl solution, a significant amount of Nacl is present, producing a high concentration of free Na+ and Cl− ions. These mobile ions carry electric charge, enabling the solution to conduct electricity efficiently. Therefore, in this study, 7% Nacl behaves as a strong electrolyte, not just because Nacl dissociates, but because the ion concentration is sufficiently high to allow good electrical conductivity. The mixture provides a more aggressive environment in which controlled and measurable corrosion is possible for experimental analysis.
3.2. Experimental setup
A stainless-steel plate was employed as the counter electrode throughout the corrosion process in this study. The test arrangement for every steel specimen, 10 mm, 12 mm, and 16 mm in diameter, was kept in individual tubs containing a 7% sodium chloride (Nacl) solution as the electrolyte. These elements were needed for reinforcement, corrosion initiation and maintenance. A 2.5 mm copper wire thickness was tightly fixed at one end of each steel rod with epoxy to provide secure electrical contact for the corrosion process. To prevent movement or disconnection, the wires were fixed tightly, and epoxy was used at the joining points to prevent galvanic corrosion, which may happen when two metals like copper and steel are connected. A two-component, electrically insulating epoxy resin was used to connect the wire while measuring the electrical resistivity of the steel rod. The specimens were then wired in series to a DC power source, allowing simultaneous corrosion across multiple samples. A regulated DC power supply with an adjustable voltage range of 0–43 V and current range of 0–2 A is used to induce electric current. The DC power source provided the necessary voltage, approximately 12V, to overcome the initial circuit resistance caused by the steel bars. In this setup, the positive terminal was connected to the steel rods, which will act as the anode, while the stainless-steel plate attached to the negative terminal of the power supply will serve as the cathode.
As the corrosion process progressed, the resistivity of the setup decreased due to moisture absorption and the ongoing corrosion of the steel bars. Consequently, less voltage was required to maintain a constant current density. The Figure 3 illustrates the precise arrangement of the steel specimens during corrosion induction. In this setup, the steel bars were connected to the positive terminal of a DC power supply, while their surfaces were covered with a copper mesh, which was linked to the negative terminal to function as the cathode. Measures were taken to ensure that the steel rods did not come into contact and that preferential corrosion zones were avoided. Impressed current corrosion is applied to a single steel rod. The shown setup is capable of inducing impressed current when connected to a DC power supply and electrolyte. This configuration enabled the galvanostatic technique to electrically accelerate the diffusion of chloride ions across the surfaces of steel bars embedded in concrete, thereby inducing corrosion. Typically, the effectiveness of corrosion inhibitors is evaluated three days after their application using this method.

3.3. Set up of voltmeter and ammeter
Electrical resistance was measured using a micro-ohmmeter, and mechanical resistance was determined using a Universal Testing Machine with appropriate capacity. Despite their distinct functions, both instruments are fundamental tools in scientific and engineering measurements. The circuit was constructed in this experiment as shown in the Figure 4 as a schematic diagram, incorporating a 1KΩ resistor to facilitate accurate readings. The ammeter was placed in series to monitor current flow, and the voltmeter was connected in parallel to measure voltage across the steel specimens. This setup enabled precise tracking of electrical parameters during the corrosion induction process.

3.4. Induction of corrosion of steel bars using the galvanostatic method
The selected mass loss percentages of 10%, 20%, and 30% for steel specimens A, B, and C, respectively, were chosen to represent incremental levels of corrosion damage, enabling a systematic investigation of how varying degrees of corrosion affect the mechanical and structural behavior of steel. Specifically, 10% mass loss represents mild corrosion, simulating early-stage degradation. 20% mass loss represents moderate corrosion, where noticeable structural weakening may occur.30% mass loss represents severe corrosion, approaching critical deterioration levels. Steel rods of different diameters were placed in separate tanks and subjected to accelerated corrosion using the proposed experimental setup and procedure, as illustrated in the schematic diagram as shown in the Figure 5. The rods were placed at adequate spacing to avoid overlapping electrical fields in the electrolyte.

A constant voltage of 12V was applied through the electrical circuit for 45 days to induce corrosion in all three specimens.
The time required to achieve the targeted corrosion levels for each steel bar was calculated using appropriate formulas which is shown in the Equation 1, based on the experimental study carried out by HU et al. [22].
3.5. Test procedure
This study analyzed 15 samples of each steel rod diameter and ranked them in ascending order based on gravimetric weight loss. The corresponding average values of polarization resistance and estimated weight loss over the exposure period were also recorded. These results clearly demonstrate that the extent of weight loss is influenced by the duration for which the specimens remain submerged in the corrosion-inducing environment. Electrochemical measurements were employed to predict weight loss and were compared to actual gravimetric readings to corroborate the results. The analysis combined gravimetric, electrochemical, and mechanical testing to obtain both actual corrosion loss and the corresponding effect on steel strength. Tensile testing was performed using a Computerized Universal Testing Machine (UTM) for further examination of the mechanical effect of corrosion presented in the Figure 6. Every sample was tensioned until it fractured, and the applied force was measured to assess the residual strength and quality of corroded steel. The operation allowed precision determination of the ultimate tensile strength, offering insight into the reinforcement structural quality following corrosion exposure.

4. RESULTS
To compare the difference in corrosion resistance and percentage rate of corrosion in reinforcement steel bars, the initial and final cross-sectional areas of steel samples with diameters of 10 mm, 12 mm, and 16 mm were compared. The following were noted: the initial cross-sectional area of the steel rod in mm2 (CSi), the initial resistance prior to corrosion in milliohms (Ri), and the final resistance after corrosion in milliohms (Rf).
To derive meaningful insights, several equations were applied:
Equation 2: Used to calculate the change in resistance (∆R).
Equation 3: Used to determine the reduction in cross-sectional area after corrosion (RCS).
Equation 4: Used to find the final cross-sectional area.
Equation 5: Used to compute the corrosion rate in percentage (RC).
Equation 6 calculates the voltage across an unknown resistor (VX).
Equation 7: Used to determine a variable-length unknown resistance (RX) resistor.
These calculations helped correlate the electrical and mechanical properties of the corroded steel specimens, providing a comprehensive understanding of the degradation process.
Table 1 shows the calculated corrosion rate using the above equations and the measured ultimate stress of the steel rod for 10mm. Similarly, for 12mm and 16mm steel rods, the corrosion rate and ultimate stress of the steel rods were calculated and shown in the Table 2 and 3 and also the graphs were developed for the different diameters of bars.
For the 10mm, 12mm and 16mm diameter steel rods, the corrosion rate for the taken samples has been calculated and shown in the graphical representation in the Figure 7. This graph shows how corrosion progresses across all samples for each rod diameter.

Similarly, for the 10mm, 12mm and 16mm diameter steel rods, the Ultimate stress has been calculated and shown in the graphical representation in the Figure 8. The figure compares the Ultimate stress of corroded steel rods across all samples and diameters.

Figure 9 compares the corrosion rate of corroded steel rods and the Ultimate stress of corroded steel rods across all samples and diameters. This scatter plot illustrates the relationship between corrosion rate and ultimate tensile strength, showing how increased corrosion reduces mechanical integrity.

4.1. Trend summary
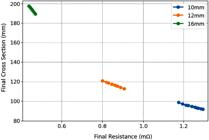
Figure 10 illustrates the relationship between the electrical resistance and the cross-sectional area of a rod with different diameters, specifically 10mm, 12mm, and 16mm. The x-axis represents the final resistance in milliohms (mΩ), while the y-axis shows the final cross-sectional area. From the plotted data, it has been observed that as the diameter of the rod increases, the final resistance decreases and the cross-sectional area increases. This trend aligns with the physical principle that resistance is inversely proportional to the cross-sectional area of a conductor. As the area increases, the path for current flow becomes wider, reducing resistance. The graph effectively demonstrates how increasing the diameter of a conductor improves its electrical performance by lowering resistance and increasing its capacity to carry current.
Across all rod diameters, corrosion rate and ultimate tensile stress have a clear inverse relationship. As the corrosion rate increases, the tensile strength of the steel decreases. This reflects the expected degradation of mechanical properties due to material loss and surface damage from corrosion. Diameter-based Performance: 10mm rods show a steeper decline in tensile strength with increasing corrosion rate. It suggests that smaller diameter rods are more sensitive to corrosion, likely due to their lower cross-sectional area. 12mm rods exhibit a moderate decline, maintaining relatively higher tensile strength at similar corrosion levels compared to 10mm rods. 16mm rods demonstrate the highest resistance to tensile strength loss, even at higher corrosion rates. Their larger cross-sectional area provides more structural integrity and tolerance to surface degradation and material behavior consistency. The consistent pattern across all diameters confirms the reliability of the experimental setup and the predictive model used. It also highlights the importance of considering rod diameter in structural design, especially in corrosion-prone environments.
Figure 11 illustrates how the electrical final resistance of the rod correlates with its corrosion rate across three different diameters: 10mm, 12mm, and 16mm. The x-axis represents the final resistance in milliohms (mΩ), while the y-axis shows the corrosion rate in percentage (%). From the graph, it is evident that there is a positive linear relationship between final resistance and the Rate of corrosion for all three rods. As the resistance increases, the Rate of corrosion also increases. This trend suggests that larger diameter rods are more corrosion-resistant and have lower electrical resistance, making them more durable and efficient in applications with critical electrical performance and material longevity. The graph effectively highlights the advantage of using larger diameter in corrosive environments.

The correlation between electrical resistance and mechanical strength (ultimate stress) of materials with three diameters: 10mm, 12mm, and 16mm has shown in the Figure 12. The x-axis is used to represent the end resistance in milliohms (mΩ), and the y-axis is used to define the ultimate stress in N/mm2. From the Tables, it can be seen that as the diameter increases, final resistance decrease. This trend indicates that higher diameter materials have better electrical conductivity due to reduced resistance and higher mechanical strength, making them more appropriate for applications that need electrical and structural performance. It can be seen from the graph that both ultimate stress and final resistance reduce with increasing diameter. This trend suggests that larger diameter materials conduct electricity more efficiently due to lower resistance and possess greater mechanical strength, making them more suitable for applications requiring both electrical and structural performance.

4.2. Analytical investigation by SPSS
To study this relationship, the statistical software SPSS (Statistical Package for the Social Sciences), a robust software, was employed to analyze data in the research. SPSS allows one to conduct descriptive statistics, correlation analysis, regression modeling, and hypothesis testing and precisely. This research examines the relationship between final electrical resistance and ultimate mechanical stress in rods with 10mm, 12mm, and 16mm diameters. The objective is to determine how rod diameter and corrosion rate changes affect electrical and ultimate stress, which is essential to engineering and materials science uses. To predict the rate of corrosion by SPSS, the obtained rate of corrosion values of 10mm, 12mm and 16mm were given as a input data. Through the data, the prediction equation has obtained which shown in the Equation 8. By using the equation, the rate of corrosion for 10mm, 12mm and 16mm were predicted and shown in the Table 4. Descriptive statistics for this study indicated that as the rod diameter grew larger, final resistance went down, while ultimate stress went up.
where, D is diameter of the rod, Ics is initial cross section of rod, Ir is initial resistance and Fr is final resistance of rod.
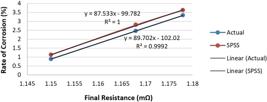
To validate the equation which obtained from SPSS to predict the rate of corrosion, the values obtained through the SPSS equation and actual values were compared through the graph which shown in the Figures 13, 14 and 15 for the 10mm, 12mm and 16mm steel rods respectively.


Similarly, to predict the ultimate stress by SPSS, the obtained ultimate stress values of 10mm, 12mm and 16mm were given as an input data. Through the data, the prediction equation has obtained which shown in the Equation 9. By using the equation, the ultimate stress for 10mm, 12mm and 16mm were predicted and shown in the Table 5. To validate the equation which obtained from SPSS to predict the rate of corrosion, the values obtained through the SPSS equation and actual values were compared through the graph which shown in the Figures 16, 17 and 18 for the 10mm, 12mm and 16mm steel rods respectively.


where, D is diameter of the rod, Ics is initial cross section of rod, Ir is initial resistance and Fr is final resistance of rod.
The statistical analysis of the relationship between Final Resistance and Ultimate Load for diameters 10mm, 12mm, and 16mm reveals a strong negative correlation across all cases. The ultimate load decreases slightly as final resistance increases, indicating an inverse relationship. For each diameter, the actual and SPSS-predicted loads show nearly identical behavior, confirming the reliability of the SPSS model. The correlation coefficients range from -0.9820 to -0.9963, and the R-squared values exceed 0.9, demonstrating excellent linear fit and predictive accuracy. Specifically, the 10mm rod exhibited the highest resistance and lowest stress, and the 16mm rod exhibited the lowest resistance and highest stress. A Pearson correlation coefficient of −0.862 was obtained, reflecting a strong negative correlation between ultimate stress and final resistance. This means that rods with lower resistance tend to be mechanically stronger. The p-value of 0.003 confirms that this correlation is statistically significant, suggesting that the observed relationship is unlikely to be due to random variation. The analysis supports the conclusion that increasing rod diameter enhances electrical conductivity and mechanical strength.
Regression equations for each diameter further quantify this trend, with steeper slopes observed in larger diameters like 16mm, suggesting that small changes in resistance have a more pronounced effect on load capacity. Overall, the data is consistent, the model is reliable, and the relationship is statistically significant; hence, this analysis is helpful in structural evaluations and predictive modeling.
5. DISCUSSION
Using the electrical resistivity method, this research investigated the corrosion rate and ultimate stress in reinforcement rods. One of the most important benefits of this method lies in its non-destructive form; through reinforcements of known electrical resistance embedded in structural members, it is possible to evaluate the condition of other reinforcements without compromising the concrete cover. This method is cost-effective and feasible when measuring corrosion levels. The study found Electrical resistivity to be a good method of estimating corrosion in reinforcement. Using SPSS computer software, a mathematical model was obtained to predict the corrosion rate and ultimate stress for rods with 10mm, 12mm, and 16mm diameters. The expected results closely correlated with the measurements, with percentage differences of 3.4% for 10mm, 2.6% for 12mm, and only 0.9% for 16mm rods. Such slight deviations are indicative of the precision of the SPSS model. In addition, statistical regression found very high negative correlations between ultimate load and final resistance in all the diameters, with correlation coefficients of –0.9820 to –0.9963 and R2 values greater than 0.9. This signifies a highly dependable linear relationship. The model regression equations enable reliable tensile strength and corrosion rate prediction for any rod size without temperature control or concrete damage.
6. CONCLUSION
The steel rod corrosion rate and ultimate stress were successfully predicted in this research by employing the electrical resistivity method. This method provides an important benefit by providing a non-destructive evaluation of the reinforcement conditions without interfering with the concrete cover. A mathematical prediction equation was formulated using SPSS software, and its validity was tested on 10mm, 12mm, and 16mm diameter rods, with a minimum percentage difference (3.4%, 2.6%, and 0.9%, respectively) between predicted and actual values. The prediction coefficient closely resembled actual findings, affirming the use of this method for predicting corrosion and tensile strength in different rod sizes. Overall, the electrical resistivity technique was accurate and feasible for structural health and corrosion monitoring.
7. LIMITATIONS OF THE STUDY
Although the electrical resistivity technique effectively estimated corrosion rate and tensile strength, the research has some limitations. The experiments were performed under a controlled setting with distilled water and Nacl solution, which may not exactly mimic real-life conditions in reinforced concrete structures. The predictive formula evolved based on SPSS is derived from a narrow range of rod sizes (10mm, 12mm, and 16mm), and its applicability can be different for other sizes or steel grades. No temperature effects and environmental aspects like humidity and carbonation were considered. Long-term corrosion behavior and structural interactions also fall outside the purview of this study and need further research.
8. FUTURE SCOPE
This work provides a foundation for future research on non-destructive corrosion monitoring by electrical resistivity measurements. Potential future research can extend the predictive model to cover a greater variety of steel diameters, grades, and environmental factors like temperature, humidity, and carbonation-induced corrosion effects. Real-time sensor network integration in reinforced concrete structures can improve long-term corrosion tracking. Using machine learning algorithms combined with SPSS could enhance prediction accuracy and responsiveness. The corrosion rate and resistivity relationship in actual field conditions deserves further examination to confirm laboratory tests.
DATA AVAILABILITY
Data available upon request.
9. BIBLIOGRAPHY
- [1] BAKAR, B.H.A., JAYA, R.P., AZIZ, H.A., “Malaysian rice husk ash–improving the durability and corrosion resistance of concrete: pre-review”, In: Proceedings of the EACEF-International Conference of Civil Engineering, v. 1, pp. 607–612, 2011.
-
[2] PEDROSA, F., ANDRADE, C., “Spatial variability of concrete electrical resistivity and corrosion rate in laboratory conditions”, Construction & Building Materials, v. 306, pp. 124777, 2021. doi: https://doi.org/10.1016/j.conbuildmat.2021.124777.
» https://doi.org/10.1016/j.conbuildmat.2021.124777 -
[3] RAMÓN, J., CASTILLO, Á., MARTÍNEZ, I., “On-site corrosion monitoring experience in concrete structures: potential improvements on the current-controlled polarization resistance method”, Materiales de Construcción, v. 71, n. 344, e265, 2021. doi: https://doi.org/10.3989/mc.2021.11221.
» https://doi.org/10.3989/mc.2021.11221 -
[4] RIADI, S., TRIONO, S., SYAHRIL, et al, “Effectiveness of metacognitive learning’s model in engineering”, International Journal of Engineering and Advanced Technology, v. 9, n. 1, pp. 4438–4443, 2019. doi: https://doi.org/10.35940/ijeat.A1457.109119.
» https://doi.org/10.35940/ijeat.A1457.109119 -
[5] ASHOKKUMAR, P., JEGADEESWARAN, D., “Application of electrical resistivity method for monitoring and assessment of cracks in concrete structures”, In: Yadav, S., Haleem, A., Arora, P.K., Kumar, H. (eds), Proceedings of Second International Conference in Mechanical and Energy Technology, Singapore, Springer, pp. 239–247, 2023. doi: https://doi.org/10.1007/978-981-19-0108-9_25.
» https://doi.org/10.1007/978-981-19-0108-9_25 -
[6] LIM, Y.-C., NOGUCHI, T., SHIN, S.W., “Corrosion evaluation by estimating the surface resistivity of reinforcing bar”, Journal of Advanced Concrete Technology, v. 8, n. 2, pp. 113–119, 2010. doi: https://doi.org/10.3151/jact.8.113.
» https://doi.org/10.3151/jact.8.113 -
[7] SADOWSKI, L., “Methodology for assessing the probability of corrosion in concrete structures on the basis of half‐cell potential and concrete resistivity measurements”, The Scientific World Journal, v. 2013, n. 1, pp. 714501, 2013. doi: https://doi.org/10.1155/2013/714501. PubMed PMID: 23766706.
» https://doi.org/10.1155/2013/714501 -
[8] RAMÓN, J.E., MARTÍNEZ, I., GANDÍA-ROMERO, J.M., et al, “An embedded-sensor approach for concrete resistivity measurement in on-site corrosion monitoring: cell constants determination”, Sensors, v. 21, n. 7, pp. 2481, 2021. doi: https://doi.org/10.3390/s21072481. PubMed PMID: 33918485.
» https://doi.org/10.3390/s21072481 -
[9] POUR-GHAZ, M., ISGOR, O.B., GHODS, P., “Quantitative interpretation of half-cell potential measurements in concrete structures”, Journal of Materials in Civil Engineering, v. 21, n. 9, pp. 467–475, 2009. doi: https://doi.org/10.1061/(ASCE)0899-1561(2009)21:9(467).
» https://doi.org/10.1061/(ASCE)0899-1561(2009)21:9(467) - [10] LAYSSI, H., GHODS, P., ALIZADEH, A.R., et al, “Electrical resistivity of concrete”, Concrete International, v. 37, pp. 41–46, 2015.
-
[11] SONG, H.-W., SARASWATHY, V., “Corrosion monitoring of reinforced concrete structures: a review”, International Journal of Electrochemical Science, v. 2, n. 1, pp. 1–28, 2007. doi: https://doi.org/10.1016/S1452-3981(23)17049-0.
» https://doi.org/10.1016/S1452-3981(23)17049-0 -
[12] REDDY, V.S., NAIDU, S.S.T., RAO, M.V.S., et al, “Electrical resistivity and half-cell potential studies to assess organic and inorganic corrosion inhibitors’ effectiveness in concrete”, E3S Web of Conferences, v. 184, pp. 01082, 2020. doi: https://doi.org/10.1051/e3sconf/202018401082.
» https://doi.org/10.1051/e3sconf/202018401082 - [13] NANYA, C.S., FERREIRA, F.G., CAPUZZO, V.M., “Mechanical and durability properties of recycled aggregate concrete”, Matéria, v. 26, e13073, 2021.
- [14] VAZQUEZ, D., DUFFÓ, G., “Monitoring reinforcement corrosion of concretes designed for nuclear facilitie”, Matéria, v. 23, e12047, 2018.
-
[15] SHETTY, S., BANERJEE, S., TALLUR, S., et al, “Real-time monitoring of residual strength in corroding steel reinforcement using ultrasonic-guided waves and multi-physics modelling”, Journal of Adhesion Science and Technology, v. 37, n. 20, pp. 2841–2860, 2023. doi: https://doi.org/10.1080/01694243.2022.2159292.
» https://doi.org/10.1080/01694243.2022.2159292 -
[16] WANG, Z., XU, C., CHEN, M., et al, “Experimental test and analytical calculation on residual strength of prestressed concrete T-beams after fire”, Buildings, v. 14, n. 11, pp. 3579, 2024. doi: https://doi.org/10.3390/buildings14113579.
» https://doi.org/10.3390/buildings14113579 -
[17] MAI, J., PENG, L., LIN, Z., et al, “Experimental study of electrical resistivity and flow stress of stainless steel 316L in electroplastic deformation”, Materials Science and Engineering A, v. 528, n. 10–11, pp. 3539–3544, 2011. doi: https://doi.org/10.1016/j.msea.2011.01.058.
» https://doi.org/10.1016/j.msea.2011.01.058 -
[18] AZARSA, P., GUPTA, R., “Electrical resistivity of concrete for durability evaluation: a review”, Advances in Materials Science and Engineering, v. 2017, pp. 8453095, 2017. doi: https://doi.org/10.1155/2017/8453095.
» https://doi.org/10.1155/2017/8453095 -
[19] ANDRADE, C., ALONSO, C., “Test methods for on-site corrosion rate measurement of steel reinforcement in concrete by means of the polarization resistance method”, Materials and Structures, v. 37, n. 9, pp. 623–643, 2004. doi: https://doi.org/10.1007/BF02483292.
» https://doi.org/10.1007/BF02483292 -
[20] TRAN, D.V.P., “Time-dependent model for evaluating corrosion potential and electrical resistivity of reinforced concrete”, Engineering Journal, v. 25, n. 1, pp. 125–135, 2021. doi: https://doi.org/10.4186/ej.2021.25.1.125.
» https://doi.org/10.4186/ej.2021.25.1.125 -
[21] BOURREAU, L., BOUTEILLER, V., SCHOEFS, F., et al, “Uncertainty assessment of concrete electrical resistivity measurements on a coastal bridge”, Structure and Infrastructure Engineering, v. 15, n. 4, pp. 443–453, 2019. doi: https://doi.org/10.1080/15732479.2018.1557703.
» https://doi.org/10.1080/15732479.2018.1557703 -
[22] HU, J.Y., LIU, Y.J., DONG, Z., et al, “A novel method to measure the actual corrosion resistance/rate of steel reinforcement during impressed-current accelerated corrosion test”, Construction & Building Materials, v. 426, pp. 136060, 2024. doi: https://doi.org/10.1016/j.conbuildmat.2024.136060.
» https://doi.org/10.1016/j.conbuildmat.2024.136060


