 Effect on AI-driven Ant Lion Optimization framework using fibre reinforced concrete with dual-stage building crack for structural applications
ABSTRACT
The growing demand for sustainable, durable, and crack-resistant construction materials has accelerated research into hybrid Fibre Reinforced Concrete (FRC) systems incorporating Polyvinyl Alcohol (PVA), polyethylene (PE), and steel fibres. Challenges persist in achieving early crack detection and designing optimal FRC mixtures with balanced mechanical and durability properties. This study introduces an Explainable AI-Driven Ant Lion Optimization (ALO) framework that integrates deep learning–based crack detection with intelligent FRC mix design optimization. In the first stage, a Deep Convolutional Neural Network (DCNN) combined with Augmented Gradient-weighted Class Activation Mapping (AugX-Grad-CAM) is employed for precise crack localization and interpretability, achieving an average detection accuracy of 92.4%, with a 28% improvement in detection reliability compared to existing CNN models. In the second stage, the ALO algorithm optimizes the proportions of PVA, PE, and steel fibres to enhance tensile strength (+22%), flexural toughness (+25%), and crack resistance (+27%) relative to standard FRC formulations. The optimized FRC microstructure, analyzed through Scanning Electron Microscopy (SEM), confirms improved fibre–matrix bonding and reduced microcrack propagation. The proposed framework establishes a closed-loop AI–materials integration, linking real-time crack diagnostics with adaptive material optimization. This synergy between explainable AI and nature-inspired optimization presents a scalable pathway toward intelligent, self-improving, and resilient concrete.
Keywords:
Fibre reinforced concrete; Explainable artificial intelligence; Ant lion optimization; Structural health monitoring; Crack resistance
1. INTRODUCTION
The Fiber-Reinforced Concrete (FRC) is an innovative concept in the construction industry that has emerged due to advancements in material science [1]. In FRC, fibres at low volume fractions play a crucial role in enhancing the properties of concrete. For this reason, fibers are often considered supplementary reinforcement. Numerous studies have shown that while the addition of SF results in only moderate improvements in compressive strength, it has a more pronounced effect on tensile and flexural strength. FRC has gained increasing attention in structural engineering due to its enhanced tensile strength, toughness, and crack resistance compared to conventional concrete [2]. The addition of discrete fibers, such as steel, glass, or synthetic materials, helps in bridging cracks, distributing stresses, and improving ductility under mechanical loading. However, despite these mechanical advantages, understanding the microstructural behavior of FRC remains essential to ensure durability and long-term performance. Techniques such as SEM and microstructural image analysis play a crucial role in studying the fiber–matrix interface, fiber pull-out mechanisms, and microcrack propagation [3]. These microscopic evaluations provide insights into how fiber dispersion and bonding influence fracture resistance, enabling better optimization of FRC compositions for structural applications. The performance of Fibre Reinforced Concrete is highly dependent on the type, orientation, and volume fraction of fibers, the quality of the fiber–matrix bond. The complex interaction between fibers and the surrounding cementitious matrix governs crack initiation and propagation, influencing the overall fracture toughness and post-cracking behavior of the composite [4]. By analyzing the microstructural characteristics using SEM and energy-dispersive X-ray spectroscopy (EDX), researchers can gain deeper insights into the interfacial transition zone (ITZ)—a critical region that dictates load transfer efficiency and the initiation of microcracks [5]. The evaluation of fiber pull-out patterns and crack-bridging efficiency at various scales aids in identifying the most effective fiber types and dosages for specific structural applications. These findings are vital for designing optimized FRC formulations that not only enhance strength and ductility but also mitigate issues such as shrinkage cracking, fatigue failure, and long-term degradation. Thus, a comprehensive understanding of the microstructural and fracture mechanisms of FRC provides the foundation for developing durable, sustainable, and high-performance concrete materials suited for modern infrastructure systems [6].
Steel Fibers (SF) may lead to fiber balling increased porosity, and higher water demand [7]. Fewer studies have focused on Polypropylene (PP) fibers. Although PP fibers provide only slight improvements in load transfer across cracks compared to SF enhance the plastic deformation capacity and contribute to post-crack behavior without significantly affecting the mix’s workability [8,9,10,11]. When used separately, SF act as macro-reinforcement while polypropylene fibers serve as micro-reinforcement. SF mainly improve post-cracking performance, whereas PP fibers help reduce plastic shrinkage (by 60–80%) and early-age cracking. SF tend to reduce flowability due to increased viscosity and clustering [12,13,14,15,16,17,18]. PP fibers have a minimal impact on modulus (±2.5%) and can enhance or maintain workability, though they may reduce hardness by up to 20%. These concrete structures often include masonry, stone, brick, timber, and other building materials [19,20,21,22]. Detecting and monitoring cracks in such structures is critical for ensuring their long-term integrity and safety [23,24,25]. Existing methods for detecting surface cracks typically involve manual visual inspections. These approaches are hampered by challenges such as labour shortages, service disruptions (e.g., bridge or rail closures), subjectivity in analysis, high costs, and inaccessibility in hazardous or contaminated areas [26,27,28]. Low-rise masonry structures are known for excellent insulation properties and strong earthquake resistance [29,30,31]. This subjectivity can lead to errors and overlooked issues in identifying structural vulnerabilities. While techniques such as magnetic particle inspection and ultrasonic testing provide more accurate results high costs, operational complexity, and limitations in large or inaccessible structures restrict their widespread use [20]. These limitations underscore the need for advanced technology-driven solutions that offer accurate, safe, and efficient structural crack analysis. Integrating such technologies can overcome the shortcomings of existing methods and enable more comprehensive and reliable evaluations of structural integrity. There was a strong correlation between the maximum or average fracture width and the structural endurance of the framework. In a specific cement-based structure, fracture width was directly linked to the tensile load-bearing capacity under certain loading conditions. The compressive load-bearing capacity for narrow fractures (less than 0.1–0.3 mm wide) in a fractured unreinforced concrete structure determined the ultimate ability to carry loads across the cracks.
2. MATERIALS AND METHODS
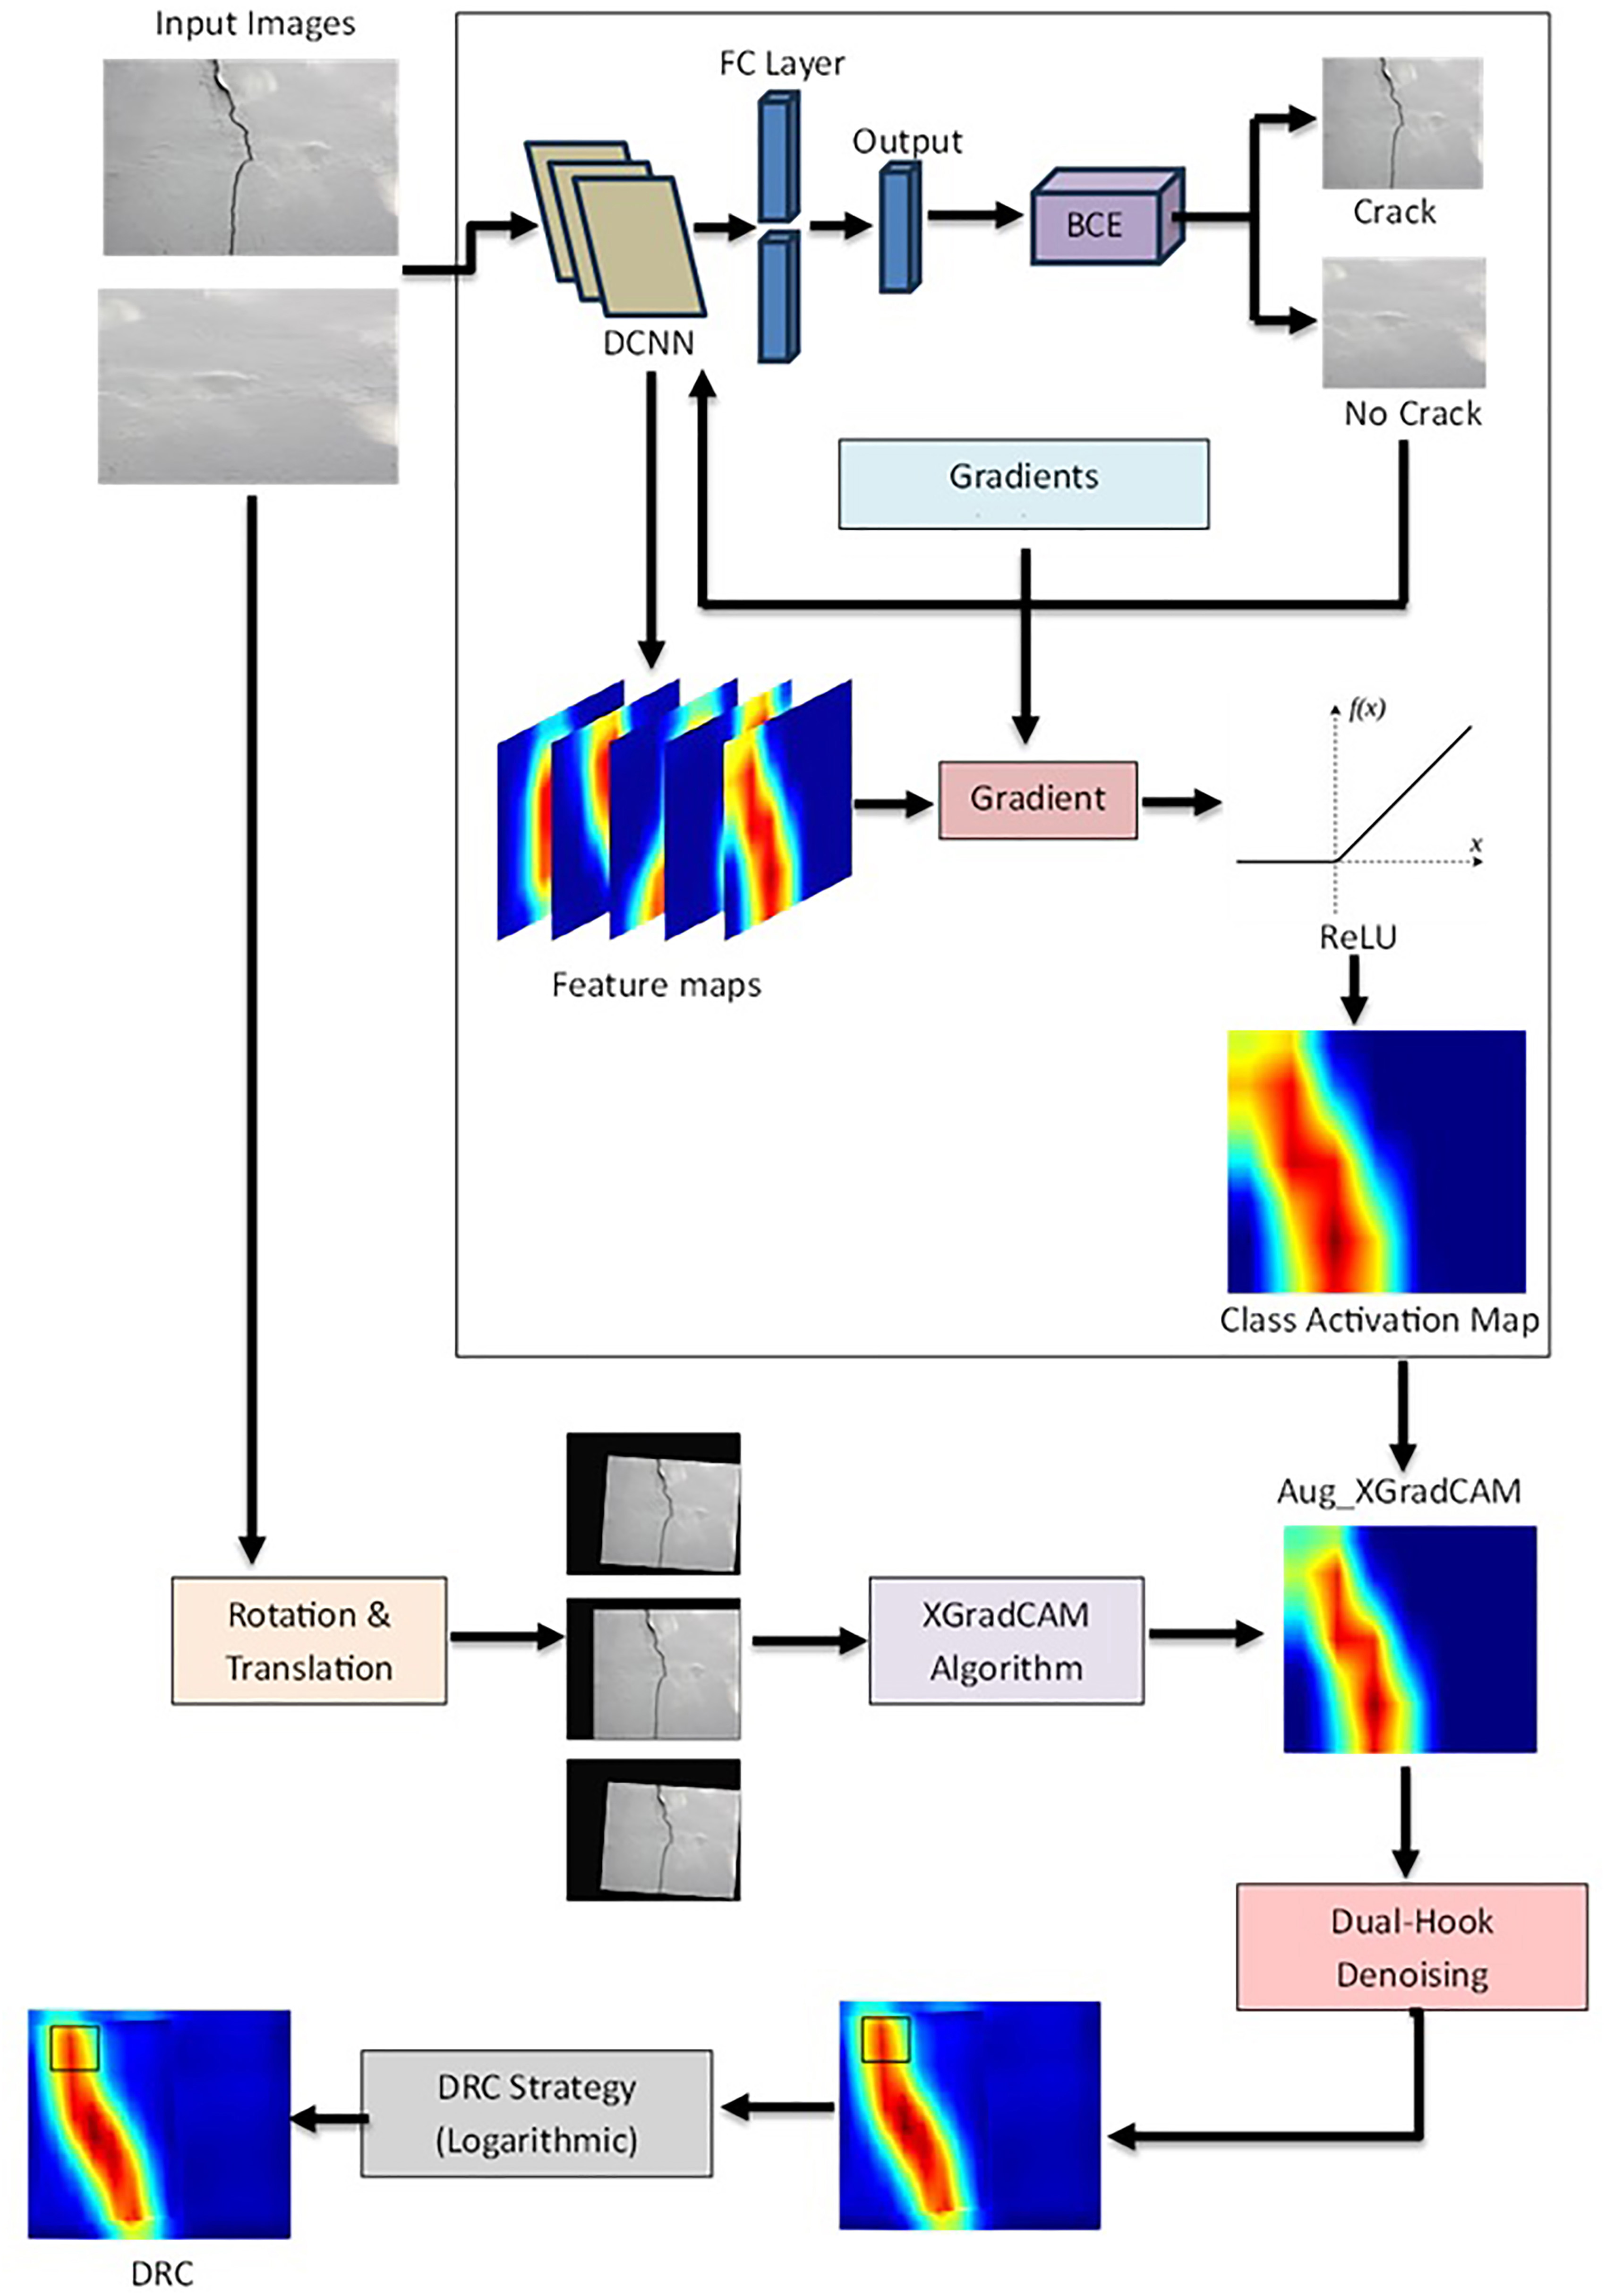
To improve architectural robustness, the proposed design integrates advanced materials with intelligent computational techniques shown in Figure 1. A hybrid FRC mix is developed using a combination of steel, PVA, and polyethylene fibers. These fibers are selected for their complementary mechanical properties, including resilience, high tensile strength, and crack-bridging capability. In the first step, fracture detection drones or high-resolution cameras are used to capture images of the structure’s exterior. After pre-processing, these images are fed into a DCNN that incorporates XAI techniques AugX-Grad-CAM to provide interpretable visualizations of features and crack regions. The second step involves optimizing the proportions of the three fibres in the concrete mix using the ALO algorithm. The optimization process aims to achieve superior performance under stress by considering objectives such as compressive strength, tensile strength, and fracture resistance. This integrated approach enables both proactive enhancement of structural durability and efficient fracture detection.

2.1. Dataset description
The dual-stage architecture in this study is represented by two primary components of the dataset shown in Table 1. High-quality structural exterior images from the SDNET2018 database were used for the crack detection phase, along with a custom dataset captured using UAVs. These images, categorized as cracked and non-cracked, provide a diverse and accurate representation of surface features as shown in Figure. 1. Various data augmentation techniques, including rotation, flipping, and scaling, were applied to enhance model generalization and address class imbalances, resulting in an expanded dataset of over 10,000 images.
The sample dual-stage dataset includes labeled images for crack detection and tabular lab data for optimizing FRC shown in Tables 2. XAI aids in accurate crack identification, while the ALO algorithm determines optimal fiber mixes enhancing fracture resistance and structural durability through predictive and proactive analysis.
2.2. Pre-processing
The pre-processing stage prepares the input data for both crack identification (image data) and resistance enhancement (numerical FRC mix data) to ensure clean, normalized, and machine-readable formats for effective model training.
Stage 1: Crack Detection – Image Data Pre-processing
Step 1: Grayscale Conversion: Most DL models process grayscale images for efficiency.
R(i, j), G(i, j), B(i, j) are the red, green, and blue channels respectively. This reduces the image to a single intensity channel, preserving edge and crack details.
Step 2: Image Resizing: To feed into a CNN or transformer model, all input images must be uniform in size:
Ensures consistency across the dataset.
Step 3: Normalization: To scale pixel intensities to the range [0, 1]
Speeds up training and prevents vanishing gradient issues.
Step 4: Image Augmentation: To increase dataset size and improve generalization
Applied randomly during training.
Step 5: Label Encoding: Convert crack/non-crack labels to binary format
Stage 2: FRC Mix Optimization – Numerical Data Pre-processing
Step 1: Handling Missing Values: If any missing data exists, apply mean imputation:
Step 2: Min-Max Normalization: Normalize each numerical input (e.g., fibre ratios, strengths) to [0, 1]:
Ensures numerical stability for the optimization process.
Step 3: Objective Function Setup for Ant Lion Optimization
The input features are:
The goal is to minimize crack width and maximize compressive and tensile strength:
This is then converted into a multi-objective fitness function:
α, β, γ are weights assigned based on design priorities.
2.3. Concrete mix design
The composition of the composite mix, including the typical weight percentages of cement, aggregates, water, superplasticizer, and reinforcing fibres along with their functional roles, is summarized in Table 3. The mix and quantity of hybrid fibers in HFRC as shown in Tables 4 and 5 were carefully selected to optimize strength and fracture resistance. Using different ratios of steel, PVA, and PE fibers, eight distinct mixes (M1–M8) were produced, each maintaining a total fiber content of 2%. SF ranged from 0.25% to 0.75%, PVA fibers from 0.25% to 0.75%, and PE fibers from 0.75% to 1.50%. This balanced hybrid fiber configuration significantly enhanced compressive, tensile, and flexural strengths effectively reducing crack lengths ultimately improving the material’s longevity and durability.
Target Mean Strength Calculation: To ensure durability and crack resistance, the mix is designed for a target compressive strength ft greater than the characteristic strength fck,
Where: fck = characteristic compressive strength (e.g. 40 MPa); S = standard deviation (typically 5 MPa for M40 grade); ft = 40 + 1.65 × 5 = 48.25 MPa
Water-Cement Ratio (w/c): Assume w/c ratio for M40 grade concrete ≈ 0.38 (from IS 10262). Use High-Range Water-Reducing Admixture (HRWRA) for workability:
If Water W – 160 kg/m3:
Aggregate Content: Assuming: Fine Aggregate (FA) = 35% of total aggregate; Coarse Aggregate (CA) = 65% of total aggregate; Total aggregate ≈ 1850 kg/m3
FA = 0.35 × 1850 = 648 kg/m3; CA = 0.65 × 1850 = 1202 kg/m3
Fibre Volume Fractions and Weights: Assume fibre dosage: Steel Fibre = 1% by volume → 78.5 kg/m3; PVA Fibre = 0.2% by volume → 1.5 kg/m3; PE Fibre 0.1% by volume → 0.9 kg/m3
Total Fibre = Steel + PVA + PE = 78.5 + 1.5 + 0.980.9 kg/m3
Adjust volume to maintain unit weight (≈ 2400 kg/m3).
Superplasticizer Content: Use 1.5% of cement weight: SP = 0.015 × 421 = 6.3 kg/m3
FRC combining steel, PVA, and polyethylene fibers requires a well-planned mix design to improve durability and fracture resistance. The design begins with establishing a target mean compressive strength ft set above the characteristic value using the standard deviation and confidence factor shown in Table 5. The water-to-cement ratio (typically 0.38 for M40 concrete) and appropriate cement content are selected. Aggregates are proportioned for workability, and fibers are added (PVA 0.2%, PE 0.1%, steel 1%) for improved mechanical properties. Super plasticizers (1.5% of cement weight) maintain workability. After mixing, curing, and testing for resilience, fracture resistance, and strength, the concrete is assessed for performance.This methodical mix design approach enhances the concrete’s performance under physical and environmental stress, particularly in areas prone to cracking. For FRC, ensuring uniform distribution of fibers is critical. Initially, dry components cement, fine aggregate, coarse aggregate, and hybrid fibers (steel, PVA, polyethylene) are blended for 2–3 minutes. Wet mixing begins with 50% of the water and the prescribed super plasticizer dosage, ensuring optimal hydration. The remaining water is added gradually to achieve the desired consistency.
2.4. Implementation of FRP for difference purposes to retrofit RC structure
FRP is widely implemented for retrofitting RC structures due to its high strength-to-weight ratio. Assurance tests are conducted on FRC specimens after casting and curing to evaluate performance. Compressive strength is tested at 7 and 28 days per IS 516 standards, while flexural strength is assessed using the third-point loading method. Impact and tensile tests measure durability under variable loads. An XAI-driven approach detects micro and macrocracks for structural health monitoring.
2.5. Explainable AI model architecture (DCNN + AugX-Grad-CAM)
This hybrid model integrates the feature extraction capabilities of a DCNN with AugX-Grad-CAM, an enhanced version of Grad-CAM that fuses multiple attention maps through data augmentation strategies to improve interpretability and robustness. Figure 2 illustrates the overall framework of the proposed methodology. The final layer of the network is adapted for binary classification to detect cracks. Only the output logits from the final layer are used to avoid the sensitivity of the Softmax function to input outliers. This allows for direct access to the model’s predictions and their associated probability values.

To construct composite saliency maps, the method combines saliency maps generated by the AugX-Grad-CAM algorithm for the original input images with those obtained from geometrically augmented versions (Figure 3 shows the AugX-Grad-CAM results produced by the proposed technique). CAM1, CAM2, and CAM3 represent the saliency maps generated after applying three different random geometric transformations, while CAM refers to the original input image. This enhancement approach helps reduce biases that may arise from a single image and strengthens the interpretability of the algorithm’s feature attention mechanisms.

DCNN-based Feature Learning and Classification: CNN is used to automatically learn hierarchical features from crack images.
Where: F(l) = feature map at layer; W(l) = leamed filter at layer l; b(l) = bias term; s = activation function (e.g., ReLU); * = convolution operation.
AugX-Grad-CAM for Visual Explanation: It enhances Grad-CAM by generating multiple class activation maps from augmented versions of the input and combining them to reduce noise and improve focus.
Where: the importance weight
AugX-Grad-CAM Enhancement: AugX-Grad-CAM applies T augmentations {T1, T2, … ,Tn} on input image X, and generates Grad-CAM maps {M1, M2, … ,Mn}.
The final map is:
Where: reverses the augmentation (e.g., undo flip/rotate); n is the number of augmentations
An XAI architecture combining DCNN with AugX-Grad-CAM offers a reliable and interpretable method for dual-stage fracture diagnosis in FRC structures. Initially, the raw concrete surface image undergoes data augmentation through rotations, flips, and scaling to generate multiple variants. Each image is passed through a DCNN, where features are extracted via ReLU activations and pooling layers. The model then classifies fracture severity using the connected features and outputs softmax-based class probabilities. To enhance interpretability, AugX-Grad-CAM computes the gradients of predicted class scores relative to CNN feature maps, generating class-specific heatmaps. These are inversely transformed to align with the original image. Finally, all aligned heatmaps are averaged to produce a comprehensive visualization highlighting critical regions responsible for the prediction. This hybrid model not only improves fracture detection accuracy but also ensures transparency and reliability in AI-based structural health monitoring systems.
2.6. Ant Lion Optimization (ALO) algorithm and fitness function
The Ant Lion Optimizer (ALO) is a bio-inspired metaheuristic that emulates the hunting mechanism of antlions in nature. It is particularly effective for solving nonlinear and multi-dimensional optimization problems, such as tuning DCNN parameters and optimizing fiber-reinforced concrete (FRC) mix compositions to enhance fracture resistance and crack prediction precision. In this study, ALO is employed to minimize classification error and improve crack surface prediction accuracy by simultaneously optimizing both tasks.
Step 1: Initialization: Ants and Antlions are randomly initialized in the search space.
Ants (Iant= [i1, i2, …, in]) represent candidate DCNN and FRC parameter solutions, while Antlions (Ilion= [l1, l2, …, ln]) denote elite solutions.
Step 2: Fitness Evaluation: Each solution is evaluated using a combined fitness function
Where,
α and β balance accuracy and spatial precision.
Step 3: Random Walk: Each ant performs a random walk influenced by stochastic movement
Where: r(t) ∈ {0, 1} is a random variable, and step dynamically decreases to enhance convergence.
Step 4: Roulette Wheel Selection: An elite antlion is selected based on probability
Step 5: Positions Update: Ants move toward the selected antlion:
Step 6: Fitness Replacement: If the new ant’s fitness is better, it replaces the antlion
Step 7: Convergence Check: The iterative process of random walks, selection, and updates continues until the stopping condition—maximum iterations or convergence—is met.
Step 8: Output: The final optimal solution provides the best DCNN hyperparameters and FRC composition for enhanced fracture resistance and precise crack detection. The ALO effectively balances exploration (diversity) and exploitation (refinement), ensuring optimal results for both structural resilience and predictive accuracy.
2.7. Dual-Stage building crack identification
Dual-Stage building crack identification is a multi-phase process that makes use of cutting-edge machine learning methods, such as XAI models and DCNN. To guarantee the integrity of the structure, the dual-stage system aims to identify and categorize structural fractures. It functions in two main phases: 1. Stage 1: Crack Detection (Localization) and 2. Stage 2: Crack Classification (Severity Assessment).
Stage 1: Crack Detection (Localization)
In the first stage, focus on detecting the exact locations of cracks in building images. This is typically achieved using a DCNN model is trained to identify and localize cracks. The DCNN model is optimized using the ALO algorithm discussed in the previous sections.
Let’s consider the input image X, where cracks are present. The goal is to apply DCNN-based model FDCNN (X) to identify the region containing cracks.
Crack Detection using DCNN: DCNN model output ODCNN can is the crack map or a feature map where crack-like patterns are highlighted. The output is calculated as follows:
Where: X is the input image. FDCNN is the convolutional neural network function that applies various convolutional filters, activations, and pooling operations.
Region Proposal Network (RPN): Once the feature map is produced, a RPN is applied to propose regions where cracks are most likely present. The regions are represented by bounding boxes Bx defined by:
Where: (ix, jx) are the coordinates of the top-left corner of the bounding box. wx and hx are the width and height of the bounding box, respectively.
Bounding Box Refinement: For each predicted bounding box, refinement is performed to improve its accuracy. This refinement is computed using IoU (Intersection over Union). The ideal bounding box is found through the following equation:
Where Gv is the ground truth bounding box for cracks, and Bx is the predicted bounding box aim to maximize loU.
Stage 2: Crack Classification (Severity Assessment)
Once the cracks are detected and localized, the next step is to classify the cracks based on their severity. This stage involves using a Fully Connected Neural Network (FCNN) or fully connected layers of a CNN to assess crack severity. The severity of cracks is classified into different categories, such as minor, moderate, and severe. The classification output C crack computed as follows:
Where: Bx is the bounding box around the detected crack Fclassification is a classification function (using FCNN or CNN layers) that assigns a class to each bounding box.
For the severity classification, we use a softmax activation function to predict the probability of each crack severity category:
Where: P(ck) is the probability of the crack belonging to category ck (where K is the number of crack severity classes). Zk is the output of the final layer for class ck. K is the total number of severity classes (eg, minor, moderate, severe).
The predicted severity class is chosen based on the highest probability:
cmbines crack localization and severity classification to provide an effective and reliable approach for building crack identification and structural damage assessment. The utilization of DCNNs and XAI techniques such as AugXGrad-CAM helps in visualizing and understanding the decision-making process improving the interpretability of the model.
3. RESULTS AND DISCUSSIONS
The XAI-driven ALO framework optimizes hyperparameters to enhance crack detection and resistance assessment in FRC structures. The DCNN model uses the Adam optimizer with a learning rate of 0.001 for stable convergence, training over 50 epochs with a batch size of 32 to balance accuracy and computation. ReLU activation is applied in hidden layers to introduce non-linearity, while Softmax is used in the final classification layer. The fitness function incorporates weighted components: α = 0.4 (crack resistance), β = 0.3 (strength), and γ = 0.3 (durability), guiding the search toward resilient and efficient structural solutions. summarizes the dataset, including 1,000 self-collected residential images with varied conditions and CFD building crack images (480 × 320 resolution). Figure 4 shows field images (top row) and CFD samples (bottom). Images are labeled as “Positive” or “Negative” for binary crack classification. The first two rows display the generated images alongside corresponding ground-truth masks. The third column shows thresholded results, and the final column presents post-processed outputs using morphological operations. The resulting masks accurately reflect crack progression except for the first image, where the model underperformed due to a very narrow crack and low prediction confidence (0.66 softmax score).How the real and predicted intensity measures evolve as crack propagation progresses. The predictions closely match the actual values, particularly as the fracture widens, with the possible exception of images. Although both the crack area and width are slightly overestimated, the results still provide valuable tools for monitoring crack development, provided the classifier’s reasoning remains valid. A total of 1,492 crack images and 1,321 non-crack images were used to train the proposed system. Figures 4 show sample images of concrete cracks and non-cracks used for training and validation accuracy and loss respectively. The dataset was split 70/30 between training and testing. Some crack-like features were classified as non-cracks despite the high classification accuracy. During testing, certain localized features were misclassified indicating the need for further investigation a clear visual representation of the regions the algorithm focuses on during crack detection, using the proposed AugX-Grad-CAM with a DCNN-ALO-based visualization approach to display colored fracture identification maps. Integrating the attention mechanism significantly enhances the model’s focus and sensitivity to crack regions. Detailed analysis and visualization of features from intermediate layers show improved precision in crack detection and increased model robustness, even under challenging conditions such as noise or low lighting.

The heatmaps generated by AugX-Grad-CAM with the DCNN-ALO model serve as an effective validation tool by visually illustrating the key features the model considers during decision-making shown in Figure 5. The highlighted regions demonstrate how the attention mechanism sharpens the model’s focus on critical crack characteristics, enhancing overall detection performance and confirming that the system’s predictions align with logical and interpretable reasoning. The breakdown pattern of the concrete specimens that are currently available. As seen in Figure 5 the tested specimens’ compressible strength decreased when the beam was based on HFRC fiber. Figure 5 shows the test setup and the sample’s breakdown process both with and without HFRC fibers. It demonstrates that HFRC fibers have both biochemical and contact bonding strengthening effects on the AAS matrix, whereas PE and SF only have friction binding.
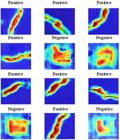
The visualization colormap of crack identification based on the AugXGrad-CAM with DCNN ALO method. (Note: Positive-Crack; Negative = No crack).
Figure 6 presents illustrations of the final predictions made by the multi-phase algorithm based on several test specimens. The forecast outcomes include data from both the detection and classification algorithms. Compared to each of the two kinds of polymer fibers seen in Figure 6, the surface of HFRC fiber is noticeably finer. SF are shown to be quite versatile in the high-alkalinity AAS system, while PVA and PE fibers would dissolve in the presence of a water glass-activated slag matrix is more alkaline than cement-based substances. Figure 6 compares the performance of the proposed system with existing systems in terms of accuracy, precision, recall, and F1 score. The proposed system shows the highest performance across all metrics, with 95.4% accuracy, 94.8% precision, 96.1% recall, and a 95.4% F1 score. The Proposed System has the lowest values for all three metrics, indicating superior performance in terms of predictive accuracy and model robustness. The proposed system demonstrates MAE = 0.025, MSE = 0.0011, and RMSE = 0.033, highlighting its effectiveness in minimizing prediction errors compared to existing systems which show higher error values across the board.

Figure 7 compares the training and validation accuracy of the proposed system with existing systems. The proposed system shows the highest training accuracy of 98.2% and validation accuracy of 95.4%, demonstrating its strong ability to learn and generalize. This indicates that the proposed system provides better learning capabilities and generalization in building crack identification and resistance enhancement tasks. Figure 7 compares the training loss and validation loss of the proposed system with existing systems. The proposed system exhibits the lowest training loss of 0.12 and validation loss of 0.15, indicating that it is the most efficient in minimizing error during both training and validation phases.
4. CONCLUSIONS
The XAI-Driven ALO Framework for FRC with dual-stage building crack identification and resistance enhancement demonstrates significant advancements in structural applications. This framework effectively integrates ALO with XAI techniques to enhance the identification and classification of building cracks, thereby improving the crack resistance and durability of concrete structures. The incorporation of PVA, Polyethylene and steel fibres into the concrete mix design results in substantial improvements in tensile strength, compressive strength, and overall structural performance. Experimental evaluations show that the proposed system outperforms existing methods across multiple metrics, including training and validation accuracy, MAE, MSE, RMSE and crack resistance. The system achieves a training accuracy of 98.2% and a validation accuracy of 95.4%, demonstrating strong generalization and learning capabilities. It exhibits minimal training and validation losses, confirming its efficiency in reducing prediction errors during both training and testing phases. The integration of AugXGrad-CAM for explainability offers clear visualizations of the model’s attention regions, making the decision-making process transparent and interpretable. This transparency enhances confidence in AI-driven predictions, especially in critical structural assessments. The proposed framework thus not only advances the performance of FRC crack detection but also sets a foundation for more accurate, interpretable, and reliable maintenance and repair strategies in modern construction.
The limitations such as the restricted range of fiber volume fractions tested, the dependence of results on specific curing conditions, and the limited scope of microstructural evaluation using SEM images. Discuss potential future directions, including expanding the dataset for AI model training, exploring hybrid fiber combinations with nano-reinforcements, and integrating advanced imaging and 3D reconstruction techniques for deeper insight into fiber–matrix interactions. Incorporating these elements will enhance the paper’s scientific rigor and demonstrate a clear pathway for continued advancement in both materials science and AI-driven FRC optimization.
5. ACKNOWLEDGMENTS
No funding was received.
6. BIBLIOGRAPHY
-
[1] KAZEMI, F., ASGARKHANI, N., SHAFIGHFARD, T., et al., “Machine-learning methods for estimating performance of structural concrete members reinforced with fiber-reinforced polymers”, Archives of Computational Methods in Engineering, v. 32, n. 1, pp. 571–603, Jan. 2025. doi: https://doi.org/10.1007/s11831-024-10143-1.
» https://doi.org/10.1007/s11831-024-10143-1 -
[2] SUN, Z., WANG, X., NIU, D., et al., “Electrical resistivity prediction model for basalt fibre reinforced concrete: hybrid machine learning model and experimental validation”, Materials and Structures, v. 58, n. 3, pp. 1–22, Mar. 2025. doi: https://doi.org/10.1617/s11527-025-02607-y.
» https://doi.org/10.1617/s11527-025-02607-y -
[3] AKBULUT, Z.F., TAWFIK, T.A., SMARZEWSKI, P., et al., “Advancing hybrid fiber-reinforced concrete: performance, crack resistance mechanism, and future innovations”, Buildings, v. 15, n. 8, pp. 1247, Aug. 2025. doi: https://doi.org/10.3390/buildings15081247.
» https://doi.org/10.3390/buildings15081247 -
[4] BAWA, S., CHORE, H.S., SINGH, S.P., “Optimized and improved DNN predictive model of fatigue life parameters in hybrid fiber reinforced self-compacting concrete”, Architectural Engineering and Design Management, pp. 1–20, 2025. doi: https://doi.org/10.1080/17452007.2025.2452389.
» https://doi.org/10.1080/17452007.2025.2452389 -
[5] GUO, P., MOGHADDAS, S.A., LIU, Y., et al., “Applications of machine learning methods for design and characterization of high-performance fiber-reinforced cementitious composite (HPFRCC): a review”, Journal of Sustainable Cement-Based Materials, v. 14, pp. 1–24, 2025. doi: https://doi.org/10.1080/21650373.2025.2462183.
» https://doi.org/10.1080/21650373.2025.2462183 -
[6] ONYELOWE, K.C., EBID, A.M., HANANDEH, S., et al., “Modeling the compressive strength behavior of concrete reinforced with basalt fiber”, Scientific Reports, v. 15, n. 1, pp. 11493, Jan. 2025. doi: https://doi.org/10.1038/s41598-025-96343-6. PubMed PMID: 40181176.
» https://doi.org/10.1038/s41598-025-96343-6 -
[7] TIAN, W., QIU, R., TANG, Z., et al., “XGBoost assisted in identifying the structural damage behavior of fiber-reinforced concrete during the soundless demolition process through electrical resistance changes”, Construction & Building Materials, v. 478, pp. 141376, Feb. 2025. doi: https://doi.org/10.1016/j.conbuildmat.2025.141376.
» https://doi.org/10.1016/j.conbuildmat.2025.141376 -
[8] SHINDE, S.N., CHRISTA, S., GROVER, R.K., et al., “Optimization of waste plastic fiber concrete with recycled coarse aggregate using RSM and ANN”, Scientific Reports, v. 15, n. 1, pp. 7798, Jan. 2025. doi: https://doi.org/10.1038/s41598-025-92505-8. PubMed PMID: 40050391.
» https://doi.org/10.1038/s41598-025-92505-8 -
[9] YU, F., ISLEEM, H.F., ALMOGHAYER, W.J., et al., “Predicting axial load capacity in elliptical fiber reinforced polymer concrete steel double skin columns using machine learning”, Scientific Reports, v. 15, n. 1, pp. 12899, Jan. 2025. doi: https://doi.org/10.1038/s41598-025-97258-y. PubMed PMID: 40234698.
» https://doi.org/10.1038/s41598-025-97258-y -
[10] RAHANE, S.K., PAWAR, K.P., “Integration of Artificial Intelligence and machine learning for predicting the behaviour of fibre-reinforced concrete under complex loads”, Metallurgical and Materials Engineering, v. 31, n. 4, pp. 431–436, Apr. 2025. doi: https://doi.org/10.63278/1456.
» https://doi.org/10.63278/1456 -
[11] DINIȚĂ, A., ROSCA, C.M., TĂNASE, M., et al., “A comprehensive review on bridging the research gap in AI-driven material simulation for FRP composites”, Computer Modeling in Engineering & Sciences, v. 144, n. 1, pp. 147–199, 2025. doi: https://doi.org/10.32604/cmes.2025.066276.
» https://doi.org/10.32604/cmes.2025.066276 -
[12] LAQSUM, S.A., ZHU, H., HARUNA, S.I., et al., “Impact and failure analysis of U-Shaped concrete containing polyurethane materials: deep learning and digital imaging correlation-based approach”, Polymers, v. 17, n. 9, pp. 1245, Sep. 2025. doi: https://doi.org/10.3390/polym17091245. PubMed PMID: 40363029.
» https://doi.org/10.3390/polym17091245 -
[13] DE PAULA SALGADO, I., CONRAD, F., SIGNORINI, C., et al., “Integrating life cycle assessment (LCA) and machine learning for sustainable designs: a case study on protective layers made of mineral-bonded fiber-reinforced composites”, The International Journal of Life Cycle Assessment, n. Jan, pp. 1–20, 2025. doi: https://doi.org/10.1007/s11367-025-02454-7.
» https://doi.org/10.1007/s11367-025-02454-7 -
[14] EBAD, S.A., ALQAZZAZ, A., MARZOUK, R., et al., “Deep learning based automatic crack detection for concrete structures using piezoelectric smart aggregates”, Mechanics of Advanced Materials and Structures, pp. 1–11, 2025. doi: https://doi.org/10.1080/15376494.2025.2477230.
» https://doi.org/10.1080/15376494.2025.2477230 -
[15] KRISHNAN, S.S.R., KARUPPAN, M.N., KHADIDOS, A.O., et al., “Comparative analysis of deep learning models for crack detection in buildings”, Scientific Reports, v. 15, n. 1, pp. 2125, Jan. 2025. doi: https://doi.org/10.1038/s41598-025-85983-3. PubMed PMID: 39820575.
» https://doi.org/10.1038/s41598-025-85983-3 -
[16] SAYYED, G., SHARMA, M.R., DUBAL, R.A., et al., “Optimized forecasting framework for estimating crack tip velocity in column beam”, Innovative Infrastructure Solutions, v. 10, n. 4, pp. 126, Apr. 2025. doi: https://doi.org/10.1007/s41062-025-01929-8.
» https://doi.org/10.1007/s41062-025-01929-8 -
[17] DENG, Z., NGUYEN, Q.D., MAHMOOD, A.H., et al., “Piezoresistivity assessment of self-sensing asphalt-based pavements with machine learning algorithm”, Construction & Building Materials, v. 468, pp. 140291, Feb. 2025. doi: https://doi.org/10.1016/j.conbuildmat.2025.140291.
» https://doi.org/10.1016/j.conbuildmat.2025.140291 -
[18] AZAD, M.M., PRABHAKAR, M.N., KIM, H.S., et al., “Deep learning-based autonomous morphological fracture analysis of fiber-reinforced composites”, Engineering Failure Analysis, v. 170, pp. 109292, Mar. 2025. doi: https://doi.org/10.1016/j.engfailanal.2025.109292.
» https://doi.org/10.1016/j.engfailanal.2025.109292 -
[19] KUMAR, P., YADAV, P., SINGH, V., “Exploring steel fiber integration in dry lean concrete: predictive analysis of compressive strength and performance via machine learning”, Asian Journal of Civil Engineering, v. 26, n. 1, pp. 263–271, Jan. 2025. doi: https://doi.org/10.1007/s42107-024-01188-5.
» https://doi.org/10.1007/s42107-024-01188-5 -
[20] IDRISS, L.K., GAMAL, Y.A., “Predicting concrete-encased column behavior under uniaxial load using adaptive neural fuzzy systems”, Expert Systems with Applications, v. 278, pp. 127354, Jan. 2025. doi: https://doi.org/10.1016/j.eswa.2025.127354.
» https://doi.org/10.1016/j.eswa.2025.127354 -
[21] ONYELOWE, K.C., KAMCHOOM, V., HANANDEH, S., et al., “Predicting the strengths of basalt fiber reinforced concrete mixed with fly ash using AML and Hoffman and Gardener techniques”, Scientific Reports, v. 15, n. 1, pp. 12074, Jan. 2025. doi: https://doi.org/10.1038/s41598-025-96420-w. PubMed PMID: 40204813.
» https://doi.org/10.1038/s41598-025-96420-w -
[22] LAQSUM, S.A., ZHU, H., HARUNA, S.I., et al., “Mechanical and impact strength properties of polymer-modified concrete supported with machine learning method: microstructure analysis (SEM) coupled with EDS”, Journal of Composites Science, v. 9, n. 3, pp. 101, Mar. 2025. doi: https://doi.org/10.3390/jcs9030101.
» https://doi.org/10.3390/jcs9030101 -
[23] PANWAR, P., GOYAL, K., SHANDILYA, J.K., “Deep learning-enabled health assessment for sustainable maintenance of existing concrete structures: a review”, Damage Detection and Structural Health Monitoring of Concrete and Masonry Structures: Novel Techniques and Applications, pp. 93–121, 2025. doi: https://doi.org/10.1007/978-981-97-8975-7_3.
» https://doi.org/10.1007/978-981-97-8975-7_3 - [24] MALAMI, S.I., JIBRIL, M.M., MAHMOUD, I.A., et al., “Design of machine learning model for predicting the compressive strength of fabric fiber-reinforced Portland cement”, Techno-computing Journal, v. 1, n. 1, pp. 14–26, Jan. 2025.
-
[25] RUSNAK, C.R., “Sustainable strategies for concrete infrastructure preservation: a comprehensive review and perspective”, Infrastructures, v. 10, n. 4, pp. 99, Apr. 2025. doi: https://doi.org/10.3390/infrastructures10040099.
» https://doi.org/10.3390/infrastructures10040099 -
[26] SHARMA, A., MEENA, R.V., “Optimized high-performance concrete using Styrene–Butadiene Rubber and hybrid fibers: enhancing fresh, mechanical, durability, and microstructural properties for sustainable construction”, Asian Journal of Civil Engineering, v. 26, pp. 1–20, 2025. doi: https://doi.org/10.1007/s42107-025-01271-5.
» https://doi.org/10.1007/s42107-025-01271-5 -
[27] AKBULUT, Z.F., KUZIELOVÁ, E., TAWFIK, T.A., et al., “Synergistic effects of polypropylene fibers and silica fume on structural lightweight concrete: analysis of workability, thermal conductivity, and strength properties”, Materials (Basel), v. 17, n. 20, pp. 5042, 2024. doi: https://doi.org/10.3390/ma17205042. PubMed PMID: 39459748.
» https://doi.org/10.3390/ma17205042 - [28] MALAMI, S.I., JIBRIL, M.M., MAHMOUD, I.A., et al., “Design of machine learning model for predicting the compressive strength of fabric fiber-reinforced Portland cement”, Techno-computing Journal, v. 1, n. 1, pp. 14–26, Jan. 2025.
-
[29] MULENGA, T.K., RANGAPPA, S.M., SIENGCHIN, S., “Natural fiber composites: a comprehensive review on machine learning methods”, Archives of Computational Methods in Engineering, v. 32, pp. 1–27, 2025. doi: https://doi.org/10.1007/s11831-025-10273-0.
» https://doi.org/10.1007/s11831-025-10273-0 -
[30] VIDYASHREE, J.C., RESHMA, E.K., HARSHITHA, M., et al., “Fatigue performance and thickness optimization of polyolefin fiber-reinforced M40 concrete for sustainable pavements”, Innovative Infrastructure Solutions, v. 10, n. 5, pp. 160, May. 2025. doi: https://doi.org/10.1007/s41062-025-01989-w.
» https://doi.org/10.1007/s41062-025-01989-w -
[31] KHALEEL, B.A., DAWOOD, E.T., “Evolution of ultra high-performance concrete using hybrid fibers: a review”, Discover Concrete and Cement, v. 1, n. 1, pp. 1–16, Jan. 2025. doi: https://doi.org/10.1007/s44416-025-00001-z.
» https://doi.org/10.1007/s44416-025-00001-z