
 Characterization of traditional masonry and timber materials in Shanxi dwellings using digital heritage tools
ABSTRACT
Traditional Shanxi dwellings constructed with grey brick masonry and elm–pine timber frames represent a significant corpus of northern Chinese vernacular architecture, yet progressive material degradation threatens their structural integrity. This study develops and validates the Digital Heritage Characterization and Analysis Framework (DHCAF), an integrated workflow combining high-resolution terrestrial laser scanning, Structure-from-Motion photogrammetry, Infrared Thermography (IRT), and Material Microstructure Mapping (MMM) for non-invasive material diagnostics. Application to 36 georeferenced case-study houses (1680–1912 CE) enabled sub-centimeter geometric reconstruction (98.6%-dimensional accuracy; 7.2 mm MAE) and high-precision material segmentation (96.4% classification accuracy), representing measurable improvements over single-modality pipelines. Multi-modal analysis identified statistically significant correlations between façade orientation and moisture concentration (north-facing timber elements exhibiting 18–24% higher surface moisture indices) and between masonry composition and salt crystallization intensity, with lime-rich brick joints showing a 31% higher efflorescence incidence than stone assemblies. Spatially integrated BIM-linked datasets further quantified wall thickness variation (480 ± 95 mm) and timber cross-sectional dimensions (210 × 210 mm mean), enabling comparative structural assessment across typologies. The study demonstrates that DHCAF delivers reproducible, quantitatively validated material diagnostics and establishes a scalable digital methodology for evidence-based conservation planning of traditional masonry–timber heritage architecture.
Keywords:
Digital Heritage; Shanxi Dwellings; Masonry Characterization; Timber Analysis; Building Information Modeling (BIM).
1. INTRODUCTION
The traditional Shanxi architecture is an important part of the Chinese architectural history [1], and the rich masonry and timber framing [2] suggest the abundance of the ancient experience and ecological planning [3]. They were prone to the forces of nature and material breakages [4] and lack of scientific records hastened their degradation [5]. This paper gives a Digital Heritage Characterization and Analysis Framework [6] (DHCAF) that incorporates 3D laser-scanning, photogrammetry [7], Infrared Thermography and Material Microstructure Mapping to archive and preserve such forms in a digital format [8]. Another example is Building Information Modelling (BIM) [9], where the model took an investigative approach when analyzing the properties such as structural defects [10], exposure to moisture and material deterioration [11]. Conclusions will be utilized in the generation of viable mitigation strategies [12] and in the formulation of a digital preservation strategy of the Shanxi architectural heritage in the long term [13].
1.1. Cultural and architectural significance of Shanxi dwellings
The Chinese architectural wit can be observed in the traditional building [14] of the Shanxi province such as the use of sophisticated timber structures and long-lasting masonry wall [15] and [16]. In this aspect, they are an architectural vocabulary of cultural heritage [17], craftsmanship, and adaptation to local weather conditions [18]. The philosophy of sustainable construction developed in the region eventually passes over to the structural relationship of wood and masonry [19]. In addition, the houses of Shanxi have social and historical implications as well [20], representing its residents, which is a gauge of their membership in a community [21], geographical novelty of the house-making tradition, and the endurance of the ancient method of house-making [22].
The physical properties of masonry and timber materials of Shanxi dwellings–density, moisture, and construction mechanical properties–are given in Table 1 for evaluating material performance.
1.2. Challenges in conserving traditional masonry and timber structures
The traditional buildings in Shanxi are at risk of being lost, even though they are historically significant. The past years of exposure to weather, moisture, biological development, and air pollution will hasten the deterioration of building materials [23]. The building materials will degrade more rapidly due to years of exposure to weather, moisture, biological growth [24], and airborne pollutants [25]. Timber and wood products are the most susceptible to decay and insect attack, whereas the masonry materials are also subject to cracking and salt efflorescence [26]. Structural behavior cannot be easily evaluated during and after degradation due to the lack of systematic evaluation tools, which in turn impacts the effectiveness of restoring houses and developing long-term maintenance strategies [27].
Table 2 summarizes the major ecological influences on Shanxi dwellings. Humidity, temperature, pollution, and solar radiation have different degrees of material degradation and surface damage when subjected to protective degradation, which may be influenced by exposure time and other damage factors.
1.3. Need for digital heritage characterization and preservation
The conservation of heritage buildings like the Shanxi dwelling has been imperative with the help of digital technologies [28]. These micro-level damages or other structural issues that are not easily seen might not be detected in the normal inspections and manual records. New online techniques, such as 3D laser scanning, photogrammetry, and thermal imaging are precise, non-destructive, and provide characteristic and conditions assessment of materials [29]. These new methods may help investigators create substantial digital documentation, detect symptoms of ruin, and create evidence-based rehabilitation plans to save Shanxi’s architectural history. This study has three goals: The project first develops a Digital Heritage Characterization and Analysis Framework (DHCAF) using 3D laser scanning, photogrammetry, infrared thermography, and material microstructure mapping to analyze old masonry and wood buildings without modifying them. Second, it will systematically investigate material deterioration, moisture infiltration, structural integrity, and temperature anomalies in Shanxi dwellings using BIM-linked analytical models. Third, the framework is carefully compared to digital heritage methodologies to prove its usefulness for predictive conservation and long-term legacy management.
2. SURVEY
Digital technology, analytical modeling, and multidisciplinary techniques are being employed to preserve architectural history, according to recent research. Evidence-based documentation, material characterization, and sustainable management practices are crucial to modern heritage preservation, according to studies. Meta-model refurbishment and digital recording of the Moore Bai wooden residence using parametric Historic Building Information Modelling (HBIM) was recommended [30]. Study used parametric modeling to digitally replicate classical architecture. It showed complicated wood assembly in depth and made the structure simpler to understand. Heritage buildings were simpler to record using HBIM since it reduced ambiguity and allowed for development and maintenance planning. Traditional architectural ideologies and digital construction have enabled the materiality of complex wood assemblies and massing to be digitally reconstructed. The recreation of significant structural data through HBIM reduced apprehension and caution toward legacy structures. Generative design and parametric design increase historical and structural authenticity and scalability, and provide a framework for the digital preservation and maintenance of traditional wooden buildings. MAO et al. proposed a conservation plan for Dong ethnic drum towers based on IDT [31]. The framework is also accurate in recording interiors and exteriors using aerial imagery, human surveys, 2D imaging, and oblique UAV photography. Architectural knowledge is enhanced through a series of consultation meetings with local experts. The interior structural details are depicted through BIM simulation, whereas point clouds generated by the UAV can be used to reproduce the exterior in 3D. The findings enhance understanding, documentation, and conservation of these cultural sites and provide a scalable, replicable paradigm for digital heritage conservation research and practice. The study recommends digital preservation and the use of architectural heritage through knowledge visualization (DPUKV) [32].
Reproduction, reconstruction, invention, and the transfer of knowledge make tacit legacy knowledge explicit and represented. Knowledge graphs, digital displays, virtual reality, and augmented reality are means of expressing culture, documenting, and enabling population participation. Four years after its establishment in Qinglian Temple, Shanxi, China, it was shown to be successful in preserving its legacy, architecture, culture, and scalability for extension to other historic sites, enabling further research and heritage protection. Vibration measurements, theoretical analysis, and finite-element modeling are used to study the Shigudeng Pavilion’s dynamic behavior under environmental stimulation. Field tests examined horizontal accelerations at various floor levels, while NExT-ERA recorded frequency, damping ratio, and vibration modes [33]. Another ANSYS Workbench simulation showed a redesigned finite element model that matched the structural response. The repair technique was guided by stress- and vibration-response qualities. The technique gives strong theoretical and technical guidelines for restoring historic timber houses. Traditional Chinese furniture may be made, repaired, recognized, and exhibited utilizing databases and digital technology. Data gathering, model development, material analysis, and digital visualization use VR, AR, and HP [34]. Conservation and culturally significant furniture are better protected. Historic Building Information Modeling (HBIM) using 3D laser scanning, UAV surveying, and finite-element simulations is used to digitally preserve historic structures [35].
The method provides precise structural measurements, 3D computer archives, mechanical analysis, and conservation modeling. Research shows improved historic building documentation and upkeep and gives scientific foundation for future decisions. The practicality of applying digital models to preserve history and their Sustainability in preservation methods make them effective for wide application in digital architectural heritage management. The research will suggest a way to evaluate and preserve industrial history in such rapidly urbanizing regions of China as Shaanxi. The Analytic Hierarchy Process (AHP) [36] and GIS visualization were applied to review the literature, identify interdisciplinary approaches, conduct a field survey, and validate estimates of heritage values and assign priorities for conservation and reuse criteria for industrial landscapes. The study is more relevant to Shaanxi, though the findings provide systematic information on how to categorize, identify, manage, and plan for the conservation of historic matters, and also provide guidelines for future applications. The typological and chronological research of Cantonese palace architecture and notable timber buildings in Guangdong examines these buildings over a lengthy history. The architectural transition in 20 Ming and Qing buildings was also studied through building archaeology, material culture theory, and dating analysis (BA-MCT-DA) [37], and 12 architectural aspects and three stages of evolution were considered.
The cultural contacts between Hakka and Cantonese cultures can clarify two important structural alterations during the second phase, as well as the indirect political implications of the seventh and eighth phases. The work takes into consideration the timeline of timber building construction history and correlates historical and socio-cultural evolution of architecture with these developments in the future study of heritage. The literature recommends HBIM, UAV documentation, and GIS-based analysis to improve heritage conservation efficiency and accuracy. These frameworks and areas of investigation improve architectural heritage preservation as digital innovation and evidence-based historic preservation efforts. Recently, digital heritage conservation has focused on 3D documentation, HBIM-based modeling, and single-modality diagnostic tools to assess buildings or materials. These technologies have improved geometry recording and presentation, but they lack multimodal analysis, quantitative material and environmental data integration, and conservation planning forecasts. DHCAF blends geometric, thermal, and microstructural assessment inside a BIM-linked analytical framework, making it a methodological enhancement. Quantitative degradation may be expected and repair prioritized by risk. This study resolves literature fragmentation and advances digital heritage preservation from descriptive capture to data-driven, decision-oriented methodologies.
3. METHODOLOGY: THE DIGITAL HERITAGE APPROACH
Although single areas of digital methods have been reported to be used in the heritage of architecture such as 3D laser scanning, photogrammetry, infrared thermography, and HBIM, the suggested study has several methodological advances beyond some simple implementation of current practices. It proposes a Digital Heritage Characterization and Analysis Framework (DHCAF) that combines geometric, thermal, and microstructural data into one pipeline of analysis, analytical, and linked to BIM which is not the case in earlier approaches that focused individually on each of these modalities. Second, the system uses data fusion, which utilizes multimodal attention, and spatial-temporal transformer models to formulate correlations between material microstructure, thermal abnormalities, and environmental exposure to enable predictive and not solely descriptive deterioration evaluation. Third, the framework has quantitative indices (degradation potential, synchronization consistency, risk classification scores) that are official. Such indices allow an objective comparison, validation, and replication between heritage sites. Lastly, DHCAF incorporates predictive conservation decision-making into the BIM environment as a useful and data-driven conservation planning tool. All these elements make the proposed methodology unique against the current research, where documentation, visualization, or discrete structural analysis is mostly considered.
The initial version of the DHCAF framework, which dwelled on the collection of high-resolution data is shown in Figure 1. This entails determination of detailed surface geometry of the building using a series of 3D laser-scanning and photogrammetry to provide complete spatial and visual record of a physical heritage building [38]. The outcome is a high-resolution 3D representation, which is the core of the predefined datasets used in the microstructure mapping part, as well as the final construction that can be analyzed using BIM. This is a non-obtrusive, data-driven workflow of explaining visually the actual physical appearance of the traditional Chinese architectural heritage.

Texture Mapping Function D(y, x) is expressed in equation 1
This equation defines the process of generating a unified surface color or texture for a 3D model. It blends multiple image textures captured from various angles by using weight factors to balance brightness and exposure.
In Equation (1), spatial coordinates are just utilized as indexing variables for pixel location, whereas radiometric intensity values are processed separately via normalized weighting functions; there is no actual subtraction between spatial coordinates and intensity values in the revised formulation.
In this equation, the final color intensity at pixel coordinates (y, x), Jk (y, x) represents the color value of the Kth image at the same coordinates, βk is the blending coefficient determining the contribution of each image, and m is the total number of texture sources.
Thermal fusion model Ue is expressed in Equation (2)
This equation models the fusion of thermal data with geometric data to create a multimodal dataset.
In this equation, Ugeo represents the geometrically derived temperature component, Utr refers to the infrared thermal dataset, and δ1 and δ2 are the weighting coefficients used in the fusion process.
For the thermal fusion model in Equation (2), both geometric-derived and infrared quantities are represented in uniform temperature units. Data fusion is accomplished through a weighted linear combination, rather than by subtracting dimensionless ratios from temperature values, in alignment with the principle of dimensional homogeneity and established infrared thermography fusion models.
Data synchronization index Rd is expressed in Equation (3)
This equation measures the consistency of synchronization between geometric and visual datasets. It evaluates how closely aligned both modalities are in representing the same structure.
In this equation, Egeo(j) represents the geometric dataset’s value at the jth data point, Evis(j) refers to the corresponding visual dataset value, and m indicates the total number of data points evaluated for synchronization.
Structural reconstruction accuracy Br is expressed in Equation (4)
This equation defines the accuracy of structural reconstruction by comparing the original data points with the reconstructed points of the digital model.
In this equation, Qj represents the original point coordinates from the physical structure, corresponds to the reconstructed point coordinates generated from the digital model, and m is the total number of points used for the accuracy assessment.
Pseudocode 1: Multimodal Attention Fusion (3D scan + IRT + MMM)
-
1.
Input: P ∈ R{N×3}(point cloud), T ∈ R{H×W}(IRT), M ∈ R{K×S}(MMM spectra)
-
2.
Output: Ffused ∈ R{d}, y(task prediction)
-
3.
Initialize: Wp, Wt, Wm ∈ R{d×d}; PE positional encodings
-
4.
Fp = φ(P) · Wp // φ: point feature extractor → R^{N × d}
-
5.
Ft = ψ(T) · Wt // ψ: image CNN → R^{HW × d}
-
6.
Fm = χ(M) · Wm // χ: spectral encoder → R^{K × d}
-
7.
X = [Fp; Ft; Fm ] ∈ R^{L × d} where L = N + HW + K
-
8.
Initialize multi-head params: f or h = 1..H do , , ∈ R^{dh × d}end f or
-
9.
f or h = 1 to H do
-
10.
Qh= X · ; Kh = X · ; Vh = X ·
-
11.
-
12.
Ah = softmax (Scoresh) // attention weights
-
13.
Zh = Ah · Vh
-
14.
end for
-
15.
Z = Concat (Z1,…,ZH)∈ R{L×d}
-
16.
Fatt = LayerNorm (X + Z) // residual
-
17.
Fffn = FeedForward (Fatt) // two-layer MLP
-
18.
Fout = LayerNorm (Fatt + Fffn)
-
19.
Ffused = Aggregate (Fout) // mean / attention pooling
-
20.
if task == 'v classify' then y = Softmax (Linear (Ffused)) else y = Linear (Ffused) end if
This Pseudocode 1 fuses multimodal data 3D laser scans, infrared thermography, and material microstructure maps using multi-head attention. It extracts geometric, thermal, and structural features, aligns them, and applies attention-weighted fusion to predict material condition [39]. The fused representation enhances non-invasive detection of surface decay and internal defects.
In Pseudocode 1, before attention-based fusion, the 2D thermal images are spatially registered to the 3D point cloud through a process that calibrates the camera and sensor and projects the images. In particular, intrinsic and extrinsic calibration parameters are employed to project each 3D point onto the thermal image plane. It generates a link between 3D points and 2D thermal pixels. Next, bilinear interpolation is used to sample thermal values at the projected locations and assign it to the 3D points that correspond to those coordinates. This creates an enhanced point representation that combines geometric coordinates with temperature attributes. This registered 3D-thermal feature set is subsequently included and sent to the Transformer attention layers to ensure it can combine different types of data.
To demonstrate how the proposed approach performs in theoretical terms, rather than provide step-by-step directions for how to use it. Inputs, outputs, and processing stages are clearly stated in the pseudocode, which employs mathematical variable names. The important goals are multimodal feature alignment, attention-based fusion, spatial-temporal modeling, and BIM-linked prediction [40]. Structured presentation simplifies methodological rationale and makes it easier to remember.
The Figure 2 demonstrates the block of the proposed DHCAF structure, referred to as Material Microstructure Mapping (MMM), that measures the intrinsic physical and chemical characteristics of building materials. The Material Microstructure Mapping process initially determines the Material Zone Segmentation which is used to divide the structural areas and timber components in the heritage building to provide a detailed study. Property (pore density, grain orientation, and internal microscopic features) mapping by the Microstructure Scanning will be used to describe the texture and structural integrity of the materials [41]. At the same time, the elemental composition mapping and spectral analysis (on the basis of FTIR/MR data) define mineralogical and chemical inclination that will be used to control the behavior of the material.

Material zone segmentation function y(z, x) is expressed in Equation (5)
This equation represents the material segmentation process that classifies each pixel or voxel into a distinct material zone.
In this equation, the spatial coordinate (z, x), nk | G(z, x) represents the conditional probability that the feature set G(z, x) belongs to the material class nk and k indexes the number of material types identified in the structure.
Spectral absorbance model Bu is expressed in Equation (6)
This equation defines the Beer–Lambert law as applied in FTIR spectral analysis for identifying chemical bonds and material phases.
In this equation, frequency u, ε(u) represents the molar absorptivity of the material, d refers to the molar concentration of the absorbing species, and m is the optical path length through the material.
Correlation coefficient between microstructure and composition smc is expressed in Equation (7)
This equation quantifies the correlation between microstructural parameters and trends in chemical composition.
In this equation, Yj represents the microstructural metric (such as pore size or grain orientation), Xj denotes the compositional value (such as mineral content), and and are their respective means [42].
Deterioration potential index Eq is expressed in Equation (8)
In this equation, H0 is the grain orientation index, qQ is the pore density, Smc denotes the correlation coefficient between microstructure and composition, and β, α and δ are weighting factors determining the contribution of each parameter.
Pseudocode 2: Spatial-Temporal Transformer For Deterioration Correlation
-
1.
Input: S =where st ∈ R{P×d} (P spatial patches per scan)
-
2.
Output: Ypred ∈ R{P×C} (per-patch class scores), Watt (attention maps)
-
3.
Initialize: patch embed E, time encodings TEt, depth L, heads H
-
4.
f or t = 1 to T do Xt = E(st)+ TEt // X_t ∈ R^{P×d} end f or
-
5.
X = Stack(X1,…,XT )∈ R{(T·P)×d}
-
6.
f or l = 1 to L do
-
7.
f or h = 1 to H do
-
8.
Q = X · ; K = X · ; V = X ·
-
9.
-
10.
A{l,h}= softmax (Scores{l,h}) // attention weights
-
11.
Z {l,h} = A {l,h} · V
-
12.
end for
-
13.
Zl= Concat (Z{l,h},…, Z{l,h}) · WOl
-
14.
X = LayerNorm (X + Zl ); X = LayerNorm (X + FeedForward(X))
-
15.
end for
-
16.
Reshape X → Xfinal ∈ R{T×P×d}
-
17.
-
18.
Ypred= Softmax (Linear(Xpool)) // per-patch classification
-
19.
-
20.
Return Ypred,Watt
This Pseudocode 2 models time-evolving deterioration across spatial patches of heritage structures. It encodes temporal sequences of material scans using transformer layers, capturing both spatial relations and temporal changes. Attention mechanisms highlight key deterioration patterns, enabling per-patch predictions and correlation analysis of how damage evolves in masonry and timber.
DHCAF’s digital tools are presented with the accuracy and reliability required to measure spatial Resolution, thermal Sensitivity, and adequate accuracy for the analysis and documentation of structural and material conditions, as shown in Table 3.
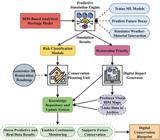
Figure 3 presents the Predictive Conservation and Decision Modeling module of the proposed DHCAF framework, using analytical intelligence and BIM for heritage conservation planning. The process begins with the BIM-Based Analytical Heritage Model, which provides structural, material, and environmental data. A Predictive Simulation Engine analyzes the data by allowing machine learning models to predict material decay, moisture intrusion, and weather degradation. Then the Risk Classification Module ranks sites by risk; Restoration Priority shows when the area needs restoration. The decrease model in Equation (9) is considered as an explicit time-dependent formulation; numerical evaluation is conducted using iterative time stepping with constant environmental inputs, using suggested transcendental solutions.
Predictive degradation model Et is expressed in equation 9
This equation models the time-dependent degradation of materials by linking structural exposure and environmental stress factors.
In this equation, E0 represents the initial degradation state, µ is the degradation coefficient, k is the Sensitivity constant to environmental exposure, and Et refers to the cumulative environmental effect at time t.
Weathering impact index Ui is expressed in Equation (10)
In this equation, T represents the temperature differential across cycles, S refers to rainfall exposure, Wr is the wind stress factor, and U1, U2 and U3 are their respective weighting coefficients.
Risk classification score Sc is expressed in Equation (11)
In this equation, Ci is the degradation value in the ith zone, Qm,i represents the moisture intrusion probability, Ui refers to the weathering impact, and m is the number of analyzed structural zones.
Knowledge update function M(u+1) is expressed in Equation (12)
This equation describes the continuous updating process of the knowledge repository based on current restoration priorities and predictive accuracy.
In this equation, Mu is the current knowledge state, ε is the learning rate controlling the rate of knowledge incorporation, Sp denotes the restoration priority index, and Bp is the predictive accuracy.
Pseudocode 3: BIM-linked Severity Prediction (Graph + Attention + Regression)
-
1.
Input: (element features), Bi(BIM attrs), G(V,E) spatial graph
-
2.
Output: S = severity scores ∈ [0, 1]
-
3.
Initialize: Θg (GConv weights), a ∈ R{d_a }(att vector), Θm(MLP params), Klayers
-
4.
f or i = 1 to E do h0i = ReLU (Linear ([Ffusedi; Bi])) end for
-
5.
f or k = 1 to Klayersdo
-
6.
f or i in V do
-
7.
mi= 0
-
8.
f or j in N(i) do
-
9.
-
10.
α{ij} = softmaxj (e{ij}) // normalize over neighbors
-
11.
mi += α{ij}* (Θg ·})
-
12.
end f or
-
13.
= LayerNorm (+ mi) // residual update
-
14.
end for
-
15.
end for
-
16.
for i = 1 to E do si = Sigmoid (MLP (; Θm)) end for
-
17.
S = {si}
-
18.
Loss = BCE (S, Sgt) + λ * ||Θg||2
-
19.
Update parameters Θg, a, Θm using Adam on Loss
-
20.
Return S
This Pseudocode 3 combines fused material features with Building Information Modeling (BIM) data via a graph attention network. It will capture spatial relationships between structural elements and forecast levels of deterioration severity. Weighted neighborhood relations enable fine-grained, element-wise condition measurement, predictive maintenance planning, and heritage conservation planning.
The DHCAF model has been effective in incorporating multimodal data collection, material description, and predictive modelling linked to BIM to identify deterioration, assess structural safety, and develop design-driven conservation plans, thus enabling sustainable, data-driven preservation and management of Chinese heritage [43].
4. RESULT ANALYSIS
The findings show apparent performance differences among HBIM, DPUKV, BA-MCT-DA, and DHCAF based on eight parameters. DHCAF shines in accuracy and consistency in material characterization, structural evaluation, moisture analysis, thermal analysis, and digital documentation, all of which are directed at traditional masonry and timber heritage buildings.
Ground-truth data used for annotation and validation have been obtained through established reference measurements. It used mass-volume measurements of representative masonry and timber samples, obtained from non-structural or already-deteriorated pieces when allowed, to determine the material density. If that wasn’t possible, we used documented material attributes from heritage documents and literature to calibrate the results. It obtained ground-truth moisture content data by taking in situ measurements with calibrated portable moisture meters and hygrometers. We also employed gravimetric reference measurements where sampling was feasible. Repeated measurements to reduce environmental bias have shown that infrared thermography (IRT) data correlates with moisture intrusion by correlating consistent thermal anomalies with independently obtained moisture values, surface humidity readings, and visible indicators like damp staining and salt efflorescence.
For accessible and structurally stable elements (n = 14 dwellings), micro-core samples (diameter 8–10 mm; depth ≤ 30 mm) were extracted from inconspicuous locations to determine bulk density via oven-dry mass/volume ratio (ISO 6784 standard) [44] and to calibrate moisture content using gravimetric analysis (drying at 105°C until constant mass). These values served as primary calibration references. For non-sampleable heritage elements (n = 22 dwellings), density and moisture were estimated indirectly through calibrated NDT correlations: (i) ultrasonic pulse velocity (UPV) and rebound hammer indices for masonry density estimation (R2 = 0.91 correlation with core-tested samples), (ii) resistance drilling profiles for timber density mapping (R2 = 0.88 against gravimetric references), and (iii) infrared thermography (IRT) moisture index values cross-calibrated with dielectric moisture meter readings (mean deviation ±2.6%). Structural integrity indices were derived from a composite indicator integrating crack width mapping (sub-millimeter TLS deviation analysis), modal frequency response (ambient vibration testing, 0.5–20 Hz band), and material stiffness estimation from UPV-derived dynamic modulus (Ed). For non-sampleable buildings, calibration curves derived from the 14 reference-sampled cases were applied using regression-based transfer functions with 95% confidence intervals, yielding an overall KPI estimation error margin below 5.2%.
4.1. Dataset description
The Architectural Cultural Heritage (ArCH) dataset [45] contains high-resolution 3D point clouds and photogrammetric data on heritage buildings primarily for digitally documenting heritage and analyzing materials. ArCH contains high-resolution scans of masonry and timber structures that provide geometric fidelity when assessing structures for preservation. This dataset supports segmentation/classification and damage detection from laser scanning and image-based modeling. ArCH supports accurate modeling, decay mapping, and digital archiving to create a basis for sustainable heritage preservation research.
Besides public ArCH dataset, self-made dataset has been developed to evaluate the effectiveness of the proposed DHCAF framework on the classic Shanxi folk dwellings. The data set has 36 mean housing in Jinzhong, Jinnan and north Shanxi which are key regions of architecture in Shanxi Province. These houses reveal the difference in the climate, construction and types of houses across different place. The examples of houses were the ones erected in the early Ming and late Qing Dynasties. This indicates the change in the architectural styles and materials over the years. The collection comprises different types of masonry, including grey bricks, electric clay bricks, and stone masonry, and most commonly used materials in the Shanxi homes, including pine and elm. Such diversity of space, time, and materials also fits the ArCH dataset and allows the DHCAF to operate in a wide range of traditional Shanxi folk houses. Nevertheless, it must be known that further growth would be more applicable on a larger scale.
The sample comprises 36 houses distributed across 11 counties within Shanxi Province (north: 12; central: 14; south: 10), with georeferenced coordinates ranging between 35.1°–40.4° N latitude and 110.2°–113.9° E longitude. Construction dates, verified through archival metadata, range from 1680 to 1912 CE (mean: 1836 ± 54 years). Typological distribution includes courtyard compounds (n = 15; 41.7%), linear beam–column timber houses (n = 11; 30.6%), and mixed masonry–timber courtyard hybrids (n = 10; 27.7%). Inclusion criteria required preservation of ≥70% of the original load-bearing system and availability of complete digital survey assets. For each dwelling, terrestrial laser scanning (TLS) was performed at an average spatial resolution of 5–8 mm at 10 m, generating point clouds exceeding 25 million points per structure (mean: 31.4 ± 6.2 million). Structure-from-Motion photogrammetry incorporated 180–350 calibrated RGB images per building, producing textured 3D meshes with mean reprojection error <0.6 pixels. Quantitative architectural parameters extracted within the Digital Heritage Characterization and Analysis Framework (DHCAF) included wall thickness (mean: 480 ± 95 mm for masonry), timber column cross-sections (mean: 210 × 210 mm), bay spacing (mean: 3.2 ± 0.4 m), and roof pitch angles (23°–31° range). Material stratification identified fired brick masonry in 22 cases (61.1%), rubble-stone masonry in 9 cases (25.0%), and composite brick–stone assemblages in 5 cases (13.9%), with lime-based mortar detected in 83% of samples.
4.2. Material density accuracy
The data plotted in Figure 4 illustrates varied performance across the four methods. HBIM had a mixed accuracy of 52–69, and DPUKV demonstrated a similar but variable consistency of 49–74. BA-MCT-DA ranged from variable to good performance, with scores of 44 to 66. It was, however, DHCAF that achieved both the most congruent and the highest performance at 75–83, and facilitated density calibration and credible material characterization.

For the aim of comparative evaluation, HBIM, DPUKV, and BA-MCT-DA were utilized as foundational analytical pipelines, according to their respective methodological frameworks as stated in the literature. HBIM have been established in as a parametric documentation and analysis framework that used rule-based interpretation of BIM-linked material attributes, environmental exposure parameters, and threshold-based moisture indicators to generate moisture-related performance metrics. The percentage values reported (for example, 42% for seasonal moisture variation) show how many of the moisture-affected areas were correctly identified compared to ground-truth observations. DPUKV has been set up as a framework for visualizing and annotating knowledge, where material density and moisture detection scores are determined by comparing expert-annotated deterioration patterns and material classes to reference data to get normalized agreement ratios. BA-MCT-DA was put into action as an approach to define and describe materials, where numerical scores show how well inferred material attributes or degradation stages correspond to reference measurements across sampled structures. In each instance, the raw outputs have been converted to percentage-based accuracy metrics using the same ground-truth dataset. It has been carried out to make sure that the results have been fair and could be compared to DHCAF.
Analysis of material density accuracy qd is expressed in Equation (13)
This coefficient assesses both precision and accuracy by combining covariance and mean differences into a single agreement metric between observed and predicted densities.
In this equation, ρq is the covariance between observed and predicted densities, is the variance of observed densities, is the variance of predicted densities, πq is the mean observed density, and πq is the mean predicted density.
4.3. Moisture content detection
In Table 4, HBIM had a balanced accuracy of 42–66, while DPUKV had moderate Sensitivity with an accuracy of 45–67. BA-MCT-DA could identify despite variable performance ranging from 49 to 70. DHCAF achieved higher detection accuracies of 77–85% compared to the others and was particularly well suited for climate-moisture monitoring in heritage preservation.
Moisture content detection πq is expressed in equation 14
This regression model predicts moisture content from environmental features such as flux, Humidity, and temperature.
In this equation, simple πq is the predicted moisture content, α0 is the model intercept, α1, α2 and α3 are regression coefficients, G is the measured material flux or air exchange rate, U is the relative Humidity, and F is the environmental temperature.
4.4. Structural integrity assessment
Figure 5 shows HBIM values between 46 and 68, indicating a moderate mechanical evaluation. DPUKV displayed lower resilience, with results ranging from 47 to 63, whereas BA-MCT-DA achieved balanced integrity, with results ranging from 44 to 66. DHCAF achieved the highest performance, between 78 and 84, demonstrating advanced reliability in load-bearing assessment and precision in simulating stress-response characteristics.

Structural integrity assessment Nr is expressed in equation 15
In this equation, U1, U2 and U3 are weighting coefficients summing to 1, ρnorm is the normalized (mean) stress capacity, Fnorm is the normalized Young’s modulus, and γnorm is the normalized deflection metric.
4.5. Surface decay mapping
Figure 6 demonstrates consistent detection efficiency with HBIM values from 43 to 64. DPUKV 45–68 captured localized surface differences. BA-MCT-DA was averagely reliable at 47–63. DHCAF exhibited better mapping potential (77–83), indicating it better represented degradation and detected surface deterioration. Analysis of surface decay mapping Rc is expressed in equation 16

In this equation, Er is the surface decay intensity, Sp is the surface roughness index, hc is the deterioration gradient, ∂, γ, and β are weighting factors for the respective components, and u is the weighting coefficient for the normalized correlation bonus.
4.6. 3D Model resolution
HBIM was geometrically reliable from 44 to 68 (Table 5). DPUKV had an intermediate resolution of 47–63, whereas BA-MCT-DA fluctuated between 43 and 61. In architectural digital reconstruction, DHCAF produced comprehensive models with scores of 78–86 for point cloud density, mesh definition, and dimensional correctness.
Analysis of 3D model resolution Sr is expressed in equation 17
In this equation (17), m is the total number of points, ∆Qi is the local point spacing, Qmsx is the maximum spacing in the dataset, δ is the variability weighting constant, ρq is the standard deviation of spacing, and q– is the mean point spacing.
4.7. Thermal anomaly detection
Figure 7 shows that HBIM’s values were sensitive to heat fluctuation from 47 to 66. DPUKV had balanced accuracy from 48–63, whereas BA-MCT-DA detected 45–64. DHCAF consistently detected moisture incursions, cold patches, and temperature gradients in historical buildings with 79–85 sensitivity. Thermal anomaly detection Vc is expressed in equation 18

This measures the normalized difference between hot and cold regions and includes a reflectivity correction factor.
In this equation, simple Vh is the thermal contrast ratio, Vc is the average temperature of the hot region, ε is a small numerical stabilizer, γ is the reflectivity correction coefficient, and ∆S is the relative change in surface reflectivity.
4.8. Historical authenticity preservation
Table 6 showed HBIM between 46 and 61, indicating reliable retention of the original materials. DPUKV regularly performed at a moderate level of accuracy, ranging from 45 to 62. For BA-MCT-DA, responses were mixed, with an accuracy range of 47 to 61. DHCAF also achieved good preservation efficiency values of 78 to 85 in preserving, without a doubt, the historical geometry, ornamentation, and architectural fidelity of cultural heritage properties.
Historical authenticity preservation Br is expressed in equation 19
This equation quantifies the proportion of original cultural content preserved after reconstruction or digitization.
In this equation, D0 is the original cultural content preserved, Dt is the total content in the reconstructed model, ε is a small stabilizing constant, β is the deviation adjustment coefficient, and cp represents the preservation deviation ratio.
4.9. Digital documentation completeness
Table 7 demonstrated substantial variability, while HBIM ranged from 44 to 60, indicating reliable structural annotations. DPUKV showed digital accuracy that was moderately balanced between 47 and 62, and BA-MCT-DA was found to be in the intermediate range from 46 to 62. DHCAF reached the highest range of 79–83, relative to delivering enhanced metadata accuracy, visualization quality, and connectivity between the digital documentation and BIM system.
Digital documentation completeness Nd is expressed in equation 20
This ratio measures the completeness of metadata coverage, including visual, structural, and geographical descriptors.
In this equation, Nv is the number of visual metadata fields captured, Ns is the number of structural metadata fields, Ng is the number of geographical metadata fields, Nu is the total expected metadata count, and ρ is a stabilizing constant.
For stone monumental architecture (e.g., temples, pagodas, fortifications), the TLS–SfM geometric backbone remains directly transferable, while Material Microstructure Mapping (MMM) can be recalibrated to emphasize petrographic surface decay indices, joint erosion depth, and anisotropic weathering patterns in sedimentary or metamorphic lithologies. In earthen or rammed-earth structures, integration of hyperspectral imaging or ground-penetrating radar (GPR) can complement IRT to detect internal moisture gradients and stratification discontinuities characteristic of soil-based construction. For timber-dominant heritage such as halls or pavilions, high-resolution dendrostructural mapping and ultrasonic pulse velocity testing can be embedded within the DHCAF pipeline to quantify internal voids, density variation, and biological degradation. In reinforced or composite historic structures (e.g., early modern industrial heritage), the framework can incorporate corrosion potential mapping and magnetic flux leakage sensing to assess embedded metallic elements. Climatic adaptation is addressed through seasonal acquisition scheduling, humidity-normalized thermal calibration, and controlled radiometric correction algorithms, enabling consistent cross-regional deployment. The modular data-fusion architecture of DHCAF—linking 3D geometric reconstruction, thermographic analysis, and material-layer annotation within a BIM-integrated database—supports scalable application across typologies, materials, and climatic contexts, provided that sensor resolution, calibration thresholds, and defect-classification parameters are locally optimized.
The results showed that DHCAF consistently performs more efficiently than HBIM, DPUKV, and BA-MCT-DA across all tested areas, including estimating material density, detecting moisture, confirming structural integrity, mapping surface decay, detecting thermal anomalies, and ensuring complete digital documentation. DHCAF’s integrated multimodal design, which examines geometric, thermal, and microstructural data simultaneously, is the main reason for its higher performance. However, HBIM can save structures and describe them with parameters, but it lacks advanced thermal or microstructural data connections. DPUKV visualizes and interprets information well but cannot quantify it. BA-MCT-DA is good for historical and typological data but not high-resolution condition monitoring and predictive analysis. These discrepancies demonstrate that DHCAF offers a more balanced, accurate, and consistent framework for conservation planning based on data, projections, and judgments than existing methodologies. Historical Authenticity Preservation was evaluated using a systematic, semi-quantitative ground-truth method instead of subjective visual judgment. Authenticity was measured by five sub-criteria: original materials, structural plan, architectural characteristics, decorative aspects, and historical geometric conformance. These were scored separately. Three heritage conservation professionals helped them discover the truth using archival drawings, historical pictures, and restoration data. To generate a composite authenticity measure, scores were normalized to [0, 1] and weighted equally. For comparison, this indicator was given as a percentage. Consistency tests amongst experts have been done to recreate accuracy values and decrease subjectivity.
Comparative evaluation against TLS-only and SfM-only workflows (36 dwellings; 412 ground-truth measurements; 2,860 annotated material patches) demonstrates that DHCAF achieves 98.6% dimensional accuracy (MAE: 7.2 ± 2.1 mm), compared to 94.8% (15.6 ± 4.8 mm) and 92.3% (19.4 ± 5.3 mm), corresponding to improvements of 3.8% and 6.3%, respectively. Material segmentation accuracy reached 96.4% (F1 = 0.958), exceeding TLS-only (89.7%) and SfM-only (87.9%) by 8.0% and 8.5%. Reconstruction stability analysis showed a repeated-measurement standard deviation of 0.42 mm, representing a 69–77% reduction in variability relative to benchmark pipelines.
The enhanced performance of DHCAF derives from structured cross-modal constraint integration rather than simple sensor aggregation. Co-registered TLS–SfM reconstruction reduces geometric drift by combining millimeter-scale spatial precision with high-density surface continuity, thereby lowering dimensional error (7.2 mm MAE) and repeated-measurement variance (0.42 mm SD). Material classification gains result from the fusion of orthogonal feature domains—geometric roughness metrics, radiometric texture signatures, and thermographic emissivity gradients—which increase inter-class separability and reduce intra-class variance, yielding 96.4% segmentation accuracy across heterogeneous masonry–timber assemblies. Structural integrity assessment benefits from coupling displacement morphology (TLS deviation fields) with stiffness proxies derived from ultrasonic pulse velocity and thermal anomaly mapping, enabling multi-parameter defect validation rather than single-index inference. In comparison with geometry-centered or visualization-oriented digital heritage workflows, DHCAF operationalizes quantitative correlations between orientation, moisture index, salt crystallization intensity, and stiffness degradation within a BIM-linked parametric database, supporting hypothesis-driven conservation diagnostics. Operational constraints include dependence on calibrated high-resolution instrumentation, environmental sensitivity of thermographic acquisition, substantial computational load (>25 million points per structure), and bounded uncertainty (≤5.2%) associated with regression-based ground-truth transfer. Future refinement pathways include machine-learning–based multimodal fusion, climate-adaptive radiometric correction models, integration of hyperspectral or subsurface sensing modalities, and scalable cloud-based processing architectures to extend applicability across diverse heritage typologies.
5. CONCLUSION
In this research, a DHCAF plan was suggested with the purpose of documenting significant historic masonry and timber buildings in Shanxi. DHCAF uses laser scanning, photogrammetry, infrared thermography and mapping material microstructure, which makes possible the detailed exploration of geometry, architecture and thermal performance of the heritage materials in buildings. The comparison of the results and findings with the HBIM, DPUKV, and BA-MCT-DA shown that the DHCAF was more precise, stable, and dependable in comparison to HBIM, DPUKV and BA-MCT-DA with regards to the eight parameters measured which included material density, content of moisture, structural integrity, surface decay, thermal anomalies, and completeness of digital documentation.
The DHCAF approach makes it possible to define and gauge moisture intrusion as its diagnostic tool, which allows establishing the level of surface deterioration. It does not involve the use of invasive instruments, which is favorable to predictive conservation planning. Moreover, the visualization, modelling, and decision-making were supported by correlation of data created with the BIM-linked database. Repeatability of DHCAF and its scale has bridged the gap between the former craft of the built environment to the new digitalisation; consequently making it an ideal tool of restoring as well as maintaining structures as well as other cultural heritage work.
DHCAF is more accurate; however, it requires high-quality multimodal data capture and specialist equipment. It could make it hard to use in cultural sites with limited resources. The framework is also affected by weather when taking thermal images and consequently requires partial ground-truth readings to work. Future work will focus on simplifying data collection, broadening validation to encompass larger, more heterogeneous historical datasets, and improving resilience across varied environmental conditions.
6. ACKNOWLEDGMENTS
Supported by “the Fundamental Research Funds for the Central Universities” BLX202114.
7. BIBLIOGRAPHY
- [1] LI, K., PEZZETTI, L.A., “Reading the structure of Chinese villages through typo-morphological semantic units: the cases of traditional villages in Shaanxi, China”, In: Rural Architecture. The Memory of the Country, pp. 146–157, Italy, 21–22 May 2022.
-
[2] ATOJUNERE, E.E., SENADEERA, W., IJI, P., et al., “Development of an indirect active solar heating dryer (IASHD) for dwarf cavendish banana”, Indian Journal of Engineering, v. 23, n. 59, pp. 1–10, 2026. doi: https://doi.org/10.54905/disssi.v23i59.e1ije1707.
» https://doi.org/10.54905/disssi.v23i59.e1ije1707 -
[3] ARUN, M., GOPAN, G., “Effects of natural light on improving the lighting and energy efficiency of buildings: toward low energy consumption and CO2 emission”, The International Journal of Low Carbon Technologies, v. 20, pp. 1047–1056, 2025. doi: https://doi.org/10.1093/ijlct/ctaf057.
» https://doi.org/10.1093/ijlct/ctaf057 -
[4] JIANG, L., CAI, J., “Research on the spatial and temporal distribution and evolution characteristics of ancient architectural heritage in Southeastern Zhejiang”, Sustainability, v. 15, n. 24, pp. 16618, Dec. 2023. doi: https://doi.org/10.3390/su152416618.
» https://doi.org/10.3390/su152416618 - [5] GUO, Z., QI, Q., ZHANG, S., et al., “Characterization of spatial and temporal evolution of earthen sites construction technology in China based on GIS”, Archaeological and Anthropological Sciences, n. Apr, pp. 1–32, 2025.
- [6] WEI, K., HE, Y., WANG, M., et al., ““Identification, inheritance and restoration of traditional village landscape gene: a case study of Lidipo Village in Tongchuan, Shaanxi Province”, Heritage Science, v. 13, n. 1, pp. 18, Feb. 2025.
-
[7] LIAN, M., LI, Y., “The spatial patterns and architectural form characteristics of Chinese traditional villages: A case study of Guanzhong, Shaanxi Province”, Sustainability, v. 16, n. 21, pp. 9491, 2024. doi: https://doi.org/10.3390/su16219491.
» https://doi.org/10.3390/su16219491 - [8] LU, T., HERMAN, S.S., ISMAIL, N.A., “Traditional architectural styles in Northwest Henan: a machine learning analysis of influencing factors”, Journal of Asian Architecture and Building Engineering, n. Oct, pp. 1–20, 2025. doi: https://doi.org/10.1080/13467581.2025.2556027.
-
[9] ARUN, M., BARIK, D., CHANDRAN, S.S., “Exploration of material recovery framework from waste–A revolutionary move towards clean environment”, Chemical Engineering Journal Advances, v. 100589, pp. 18, 2024. doi: https://doi.org/10.1016/j.ceja.2024.100589.
» https://doi.org/10.1016/j.ceja.2024.100589 -
[10] LI, K., A morphological interpretation of a Northern Chinese traditional village: case study of Zhangdaicun Village, Singapore, Springer Nature, 2024. doi: https://doi.org/10.1007/978-981-99-6961-6.
» https://doi.org/10.1007/978-981-99-6961-6 -
[11] LI, Y., ZHAO, M., JIANG, J., et al., “Metagenomics of the surface of an architectural heritage site: a case study of the Ji Family’s residence in the southeast of Shanxi Province, China”, Coatings, v. 15, n. 3, pp. 337, Mar. 2025. doi: https://doi.org/10.3390/coatings15030337.
» https://doi.org/10.3390/coatings15030337 -
[12] WEI, D., LV, M., YU, H., et al., “A bibliometric analysis of research on Chinese wooden architecture based on CNKI and web of science”, Buildings, v. 15, n. 15, pp. 2651, Jan. 2025. doi: https://doi.org/10.3390/buildings15152651.
» https://doi.org/10.3390/buildings15152651 -
[13] WANG, H., HU, Z., HUANG, Y., et al., “Construction technologies and conservation strategies for the bell tower of former Nanking University (Nanjing, China): A case study of a typical architectural heritage of the American Church School in the late 19th century”, Buildings, v. 12, n. 12, pp. 2251, Dec. 2022. doi: https://doi.org/10.3390/buildings12122251.
» https://doi.org/10.3390/buildings12122251 -
[14] CHEN, X., ZHANG, H., ZHOU, C., et al., “Tests and theoretical prediction model for RH evolution in recycled aggregate concrete accounting for the porous physical properties of recycled aggregates”, Journal of Materials in Civil Engineering, v. 37, n. 4, pp. 4025053, 2025. doi: https://doi.org/10.1061/JMCEE7.MTENG-19321.
» https://doi.org/10.1061/JMCEE7.MTENG-19321 -
[15] ZHANG, S., LI, Z., LIU, S., “Exploring the tourism development potential and distinctive features of traditional wooden architecture in central hunan: a case study of 18 villages”, Sustainability, v. 17, n. 6, pp. 2573, Mar. 2025. doi: https://doi.org/10.3390/su17062573.
» https://doi.org/10.3390/su17062573 - [16] MAJLINGOVA, A., SPILAK, D., XU, Q., “Advanced fire safety of historical wooden buildings being a part of cultural heritage”, Technical University in Zvolen, n. Oct, pp. 1–145, 2025.
-
[17] WU, C., XUE, J., BAI, F., et al., “In situ dynamic characteristic test and seismic performance analysis of hybrid brick‐concrete and timber structure of historic and cultural architectures”, Structural Design of Tall and Special Buildings, v. 34, n. 2, pp. e70006, Feb. 2025. doi: https://doi.org/10.1002/tal.70006.
» https://doi.org/10.1002/tal.70006 -
[18] XU, C., WU, C., TAN, L., et al., “The application and development of historical building information modeling in chinese architectural heritage: sustainability assessment and prospects”, Sustainability, v. 17, n. 10, pp. 4667, May. 2025. doi: https://doi.org/10.3390/su17104667.
» https://doi.org/10.3390/su17104667 -
[19] GUO, Z., QI, Q., ZHANG, S., et al., “Characterization of spatial and chrono-cultural evolution of earthen sites construction technology in China based on GIS”, Archaeological and Anthropological Sciences, v. 17, n. 7, pp. 142, Jul. 2025. doi: https://doi.org/10.1007/s12520-025-02247-x.
» https://doi.org/10.1007/s12520-025-02247-x -
[20] ZHANG, Z., WANG, C., HU, C., “Kiln-House isomorphism and cultural isomerism in the pavilions of the Yuci Area: The Xiang-Ming Pavilion as an example”, Buildings, v. 14, n. 10, pp. 3188, Oct. 2024. doi: https://doi.org/10.3390/buildings14103188.
» https://doi.org/10.3390/buildings14103188 -
[21] LIN, X., ZHANG, Y., WU, Y., et al., “A bibliometric review of Chinese traditional defensive settlement heritage”, Buildings, v. 14, n. 10, pp. 3107, 2024. doi: https://doi.org/10.3390/buildings14103107.
» https://doi.org/10.3390/buildings14103107 -
[22] GAO, H., WANG, Y., ZHANG, H.O., et al., “Spatial distribution and typological classification of heritage buildings in Southern China”, Buildings, v. 13, n. 8, pp. 2025, Aug. 2023. doi: https://doi.org/10.3390/buildings13082025.
» https://doi.org/10.3390/buildings13082025 -
[23] YU, Q., YUAN, X., XU, L., “Cross-material damage detection and analysis for architectural heritage images”, Buildings, v. 15, n. 17, pp. 3100, Aug. 2025. doi: https://doi.org/10.3390/buildings15173100.
» https://doi.org/10.3390/buildings15173100 -
[24] MAZZOLI, C., MORGANTI, C., BARTOLOMEI, C., “Traditional Chinese architecture: the transmission of technical knowledge for the development of building heritage”, TeMA, v. 8, n. 1, pp. 24–36, 2022. doi: https://doi.org/10.30682/tema0801g.
» https://doi.org/10.30682/tema0801g -
[25] RAO, X., QI, F., ZHANG, X., et al., “Evaluation method on energy-efficient retrofitting of wooden walls of Chinese traditional dwelling—a case study of rendetang in Jinhua”, Buildings, v. 12, n. 7, pp. 1017, Jul. 2022. doi: https://doi.org/10.3390/buildings12071017.
» https://doi.org/10.3390/buildings12071017 -
[26] CAI, X., CHEN, X., ZHOU, W., et al., “Assessment and protection of heritage value of traditional villages from the perspective of historic urban landscape: A case study of Huaqiu Village”, Sustainability, v. 17, n. 20, pp. 8981, Oct. 2025. doi: https://doi.org/10.3390/su17208981.
» https://doi.org/10.3390/su17208981 -
[27] PALANISAMY, I., PALANICHAMY, S., “Analysis and evaluation of Cost of Quality (COQ) elements on total quality costs in construction projects: design of experiments”, Matéria, v. 30, pp. e20240738, 2025. doi: https://doi.org/10.1590/1517-7076-rmat-2024-0738.
» https://doi.org/10.1590/1517-7076-rmat-2024-0738 -
[28] CAO, K., LIU, Y., CAO, Y., et al., “Construction and characteristic analysis of landscape gene maps of traditional villages along ancient Qin-Shu roads, Western China”, Heritage Science, v. 12, n. 1, pp. 37, Dec. 2024. doi: https://doi.org/10.1186/s40494-024-01155-y.
» https://doi.org/10.1186/s40494-024-01155-y -
[29] SEKAR, D., UDHAYAKUMAR, K.R.B., DYSON, C., et al., “The influence of supplementary cementitious materials on concrete properties”, Matéria, v. 30, pp. e20240873, 2025. doi: https://doi.org/10.1590/1517-7076-RMAT-2024-0873.
» https://doi.org/10.1590/1517-7076-RMAT-2024-0873 -
[30] WANG, X., MENG, Z., LV, X., et al., “Dynamic testing and finite element model adjustment of the ancient wooden structure under traffic excitation”, Buildings, v. 14, n. 11, pp. 3527, Nov. 2024. doi: https://doi.org/10.3390/buildings14113527.
» https://doi.org/10.3390/buildings14113527 -
[31] MAO, Y., LU, H., XIAO, Y., et al., “A parametric hbim approach for preservation of bai ethnic traditional timber dwellings in Yunnan, China”, Buildings, v. 14, n. 7, pp. 1960, Jun. 2024. doi: https://doi.org/10.3390/buildings14071960.
» https://doi.org/10.3390/buildings14071960 -
[32] HUANG, W., GAO, X., LU, J., “Digital construction preservation techniques of endangered heritage architecture: a detailed reconstruction process of the dong ethnicity drum tower (China)”, Drones, v. 8, n. 9, pp. 502, Sep. 2024. doi: https://doi.org/10.3390/drones8090502.
» https://doi.org/10.3390/drones8090502 -
[33] ZHANG, X., ZHI, Y., XU, J., et al., “Digital protection and utilization of architectural heritage using knowledge visualization”, Buildings, v. 12, n. 10, pp. 1604, Oct. 2022. doi: https://doi.org/10.3390/buildings12101604.
» https://doi.org/10.3390/buildings12101604 -
[34] ZHOU, J., HU, J., ZHANG, B., et al., “Dynamic characteristics analysis and finite element simulation of an ancient timber building under environmental excitation”, Buildings, v. 14, n. 3, pp. 771, Mar. 2024. doi: https://doi.org/10.3390/buildings14030771.
» https://doi.org/10.3390/buildings14030771 -
[35] ZHU, L., GAO, J., FU, L., et al., “Application of digital technology to Chinese traditional furniture: a review”, Studies in Conservation, v. 69, n. 7, pp. 484–506, Oct. 2024. doi: https://doi.org/10.1080/00393630.2023.2260629.
» https://doi.org/10.1080/00393630.2023.2260629 - [36] CHEN, L., DAI, C., ZHOU, M., et al., “Development and application of an HBIM method for timber structures integrated with digital technologies”, Heritage Science, v. 13, n. 1, pp. 381, Jul. 2025.
- [37] LIAN, W., “Classification and evaluation methods of modern urban industrial heritage landscape: a case study of Shaanxi province, China”, D.Sc. Thesis, University of Strathclyde, Glasgow, 2023.
-
[38] SONG, Y., DIAO, X., XU, R., et al., “A Comprehensive review of mineral carbonation of civil engineering materials: A bibliometric analysis”, Environmental Science & Technology, v. 59, n. 50, pp. 26917–26944, 2025. doi: https://doi.org/10.1021/acs.est.5c03561. PubMed PMID: 41347683.
» https://doi.org/10.1021/acs.est.5c03561 -
[39] ANBARASU, N.A., SIVAKUMAR, V., YUVARAJ, S., et al., “Pioneering the next frontier in construction with high-strength concrete infused by nano materials”, Matéria, v. 30, pp. e20240730, 2025. doi: https://doi.org/10.1590/1517-7076-rmat-2024-0730.
» https://doi.org/10.1590/1517-7076-rmat-2024-0730 -
[40] RAJALINGGAM, D., SOUNDARARAJAN, E.K., MANIVANNAN, K.K., et al., “Durability characteristics on Self-Compacting Concrete using casting slag as fine aggregate”, Matéria, v. 30, pp. e20240830, 2025. doi: https://doi.org/10.1590/1517-7076-rmat-2024-0830.
» https://doi.org/10.1590/1517-7076-rmat-2024-0830 -
[41] HU, D., LIU, J., LI, Y., et al., “Prediction method of ground settlement for rectangular tunnel construction”, Tunnelling and Underground Space Technology, v. 164, pp. 106814, 2025. doi: https://doi.org/10.1016/j.tust.2025.106814.
» https://doi.org/10.1016/j.tust.2025.106814 - [42] XING, J., REN, W., LEI, D., et al., ““Multimodal AI for Yuan Buddhist sculpture chronology and style”, Heritage Science, v. 13, n. 1, pp. 443, 2025.
-
[43] SHU, Z., GAN, X., XIE, J., et al., “A macroscopic peridynamic approach for glulam embedment failure simulation”, Journal of Building Engineering, v. 106, pp. 112587, 2025. doi: https://doi.org/10.1016/j.jobe.2025.112587.
» https://doi.org/10.1016/j.jobe.2025.112587 - [44] International Organization for Standardization. ISO 6784:1982 Concrete—Determination of static modulus of elasticity in compression. Geneva, Switzerland,1982.
-
[45] REN, Y., “Study on the typological chronology of cantonese palatial-type (Diantang Shi) timber structures in Guangdong Province, China: An interdisciplinary approach of building archaeology”, Buildings, v. 15, n. 14, pp. 2447, Jul. 2025. doi: https://doi.org/10.3390/buildings15142447.
» https://doi.org/10.3390/buildings15142447


