 Influence of the shear key on the mechanical performance of beam-column connections in precast concrete structures
ABSTRACT
The shear key is a connection commonly used in structures built with precast concrete elements. Its use is based on the assumption that adding grout and interlocking the beam-column interface through surface roughness (shear key) can increase the maximum load capacity of the structure, as it relieves part of the load from the corbel. However, the extent of this enhancement remains unclear due to the limited number of systematic studies addressing the structural behavior of such connections. This research evaluated the influence of shear key rib width, beam-column spacing, and beam dimensions on increasing the maximum load. This objective was achieved through a parametric study developed with 35 numerical simulations. The results showed that the presence of the shear key significantly increased the maximum strength. It was found that rib width and beam-column spacing did not significantly impact strength. On the other hand, the beam length proved to be a relevant variable, with its reduction increasing the maximum load. In this context, the beam with the best performance was the 3.80 m beam, for which the presence of the shear key resulted in a 36.70% increase in maximum load compared to the model without it.
Keywords:
Shear key; Precast concrete; Numerical simulation; Beam-column connections; Maximum load capacity
1. INTRODUCTION
Precast concrete is a construction technique that involves fabricating concrete elements, such as columns, beams, purlins, walls, hollow-core slabs, and corbels, off-site. This method was developed from the 1920s to the 1940s, following World War I, when improvements in material strength, design optimization, durability, and resilience emerged for the elements [1, 2]. One of the main advantages of this construction method is the reduction in construction time, the optimization of resources, and improved quality [3, 4].
The on-site assembly of precast elements requires support and connection systems, which are extremely important for structural design [5]. These connections may include column-to-footing socket connections (also known as “popsicle block”), hollow-core slab-to-beam connections, and beam-to-column connections. Howwever, the present research focuses on corbels, which can be cast monolithically with beams and columns or added later using metal or wooden formwork.
Corbels are three-dimensional, cubic, or trapezoidal reinforced concrete structures designed to form the beam-column connection, and they are widely used in the precast industry. Corbels support horizontal and vertical loads imposed by elements resting on them, typically a beam. Their design requires consideration of dimensions, load application points, and concrete stress levels. Thus, the greater the loads, the larger the corbel dimensions and the higher the reinforcement ratio in the struts [5, 6].
Various standards and codes provide analytical models for corbel design, such as the Brazilian standard ABNT NBR 6118:2023 [7], the EN 1992-1-1:2004 [8], used in Europe, and the PCI (Pre-cast/Prestressed Concrete Institute) technical publications. These documents establish criteria and procedures for determining the dimensions and reinforcements necessary to ensure the safety and structural integrity of these elements. Through specific methods and analysis models, these standards aim to ensure that corbels adequately support the loads they are subjected to, considering factors such as material strength, load distribution, deformation effects, and environmental conditions, thus contributing to the standardization and safety of reinforced and prestressed concrete structures.
At the top of the corbel, various bearing systems are considered for redistributing forces, including mortar pads, elastomeric pads, and steel plates. Due to their rigidity, steel plate bearings are commonly used, as noted in the study by ABU-OBAIDA et al. [9], who conducted a numerical investigation of corbels internally reinforced with glass fiber-reinforced polymers (GFRP), using a steel plate as the bearing surface.
According to NEUBERGER et al. [10], corbel failure typically occurs in the strut region, a region of disturbed stress, making it challenging for analytical models to predict the results of experimental models accurately. one alternative to relieving the load and the stresses acting on the corbel is the implementation of grooves at the beam-column interface so that the corbel is responsible for only a portion of the total load. This step allows for a reduction in corbel size. This type of connection is known as a shear key.
By introducing mechanical interlocking at the beam-column interface, the shear key transfers part of the vertical load directly through the interface, thereby reducing stress concentration in the corbel strut and altering the internal load path. Despite its widespread use, the structural role of the shear key remains difficult to quantify, as it is located in a region of high stress and its contribution depends on several interacting parameters. Consequently, there is no clear consensus regarding shear key geometry in design practice. Variations in key geometry, beam length, and beam-column spacing can significantly influence load redistribution between the shear key and the corbel.
Nevertheless, it is generally understood that the shear key can positively influence stress reduction in the corbel. This understanding was confirmed in the research by FALEIROS JUNIOR [5], who experimentally evaluated the influence of the shear key on the effective load acting on the corbel, using an elastomeric bearing pad. However, given the number of variables involved, it remains unclear which variables truly affect the key’s performance and which questions are most influential, and whether they can be answered through numerical simulation using a proper parametric study.
Despite its widespread use in civil construction, few published studies have specifically addressed the structural contribution of the shear key in precast beam-column connections. While several investigations have examined precast beam-column connections and corbel behavior through experimental and numerical approaches, the specific role of shear keys at the beam-column interface remains insufficiently clarified. In particular, the combined influence of geometric parameters and beam length on load redistribution between the shear key and the corbel has not been systematically investigated through parametric numerical analyses. Therefore, it is essential to examine how variations in geometric and dimensional variables affect the increase in the structure’s maximum load and to determine the most significant parameters. A proper estimate of the shear key’s load share may lead to more efficient structural solutions, potentially reducing concrete and steel consumption and associated costs for manufacturers and end users. Given the above, the objective of this study is to evaluate the influence of the shear key on the increase in maximum structural load as a function of beam length, shear key geometry (rib width), and spacing between the beam and the column.
It is essential to note that the numerical models employed in this study assume idealized bonding conditions between the grout, beam, and column at the shear key interface. This assumption represents an upper-bound structural response and does not account for possible construction imperfections, incomplete grouting, or workmanship-related variability. Therefore, the results should be interpreted as a comparative parametric assessment rather than as direct design recommendations.
2. MATERIALS AND METHODS
Figure 1 illustrates the stages involved in achieving the research objective. Initially, a parametric study of the numerical simulations based on the finite element method (FEM) was planned. Subsequently, the corbel to be simulated was defined, from which the structural design of the beams was carried out. Then, a computational model was proposed for simulating the structure. Finally, the validity of the symmetrical model was evaluated, and the optimal mesh size for the simulations was determined. The simulations were developed using Abaqus.

2.1. Parametric study
Given the objectives of this study, 28 simulations were carried out, varying the beam length (L: 3.80; 4.00; 4.20; 4.40; 4.60; 4.80; 5.00 m), the rib (or tooth) width of the shear key (ws: 4 and 6 cm), and the beam-column spacing (sbc: 4 and 8 cm). The steel plate between the beam and the corbel had constant dimensions: 20 cm in length, 5 cm in width, and 2.5 cm in thickness. Similarly, the beam cross-section was maintained at a constant width of 0.2 m and a height of 1 m. Figure 2 provides an overview of the parametric study, the shear key detailing, and the parameter variations considered. In addition, for each configuration, a reference simulation was carried out (Figure 3) to evaluate the influence of each variable on the structure’s maximum load capacity.


The shear key geometry adopted in the numerical models consisted of a prismatic rib with constant height and inclination. Within the parametric study, only the rib width and the beam-column spacing were varied, while all remaining geometric characteristics of the shear key were kept constant. It should be noted that the selected parameter ranges were defined to represent typical geometric limits adopted in precast concrete practice, while maintaining compatibility with the corbel geometry considered. These values were chosen to enable a comparative assessment of parameter influence rather than to represent optimized design solutions.
2.2. Definition and validation of the corbel
The corbel used in the simulations of the present research was the one numerically studied by NEUBERGER et al. [10], who evaluated the influence of some CDP (Concrete Damaged Plasticity) parameters, such as the dilation angle (Ψ - dilation angle; Kc - eccentricity factor) to identify the most suitable combination (Figure 4) for reproducing the experimental force vs. displacement curve of the corbel. For modeling the reinforcement steel, the authors considered elastoplastic behavior with linear hardening, whereas concrete’s geometrical properties and stress-strain curves were modeled according to different criteria [10]. For compression, the model proposed by CARREIRA and CHU [11] was adopted; for tension, the model by GENIKOMSOU and POLAK [12] was used; and damage evolution was assessed following the work by YU et al. [13].

After modeling the corbel (Figure 5) using the optimal combination of CDP parameters, namely a dilation angle Ψ = 39°, shape factor Kc = 0.667, viscosity parameter μ = 0.0005, plastic eccentricity ε = 0.10, and a biaxial-to-uniaxial compressive strength ratio σb/σc = 1.16, the numerical results closely matched those reported by NEUBERGER et al. [10], as shown in Figure 6. The corbel was discretized using C3D8 finite elements (hexahedral, 8-node, reduced integration) for the concrete and T3D2 elements (1D, 2-node, full integration) for the reinforcement, with an average mesh size of 25 mm. Figure 6 compares the numerical response obtained in the present study with the experimental results reported by NEUBERGER et al. [10] for the isolated corbel model. As the experimental data in the reference study primarily report peak load capacity, the validation focused on reproducing the maximum load and the overall nonlinear response trend of the corbel.


It should be noted that the constitutive parameters adopted for the concrete damaged plasticity model were previously calibrated and validated against experimental results reported by NEUBERGER et al. [10], who investigated the structural behavior of reinforced concrete corbels. In that study, the numerical model was calibrated by comparing it with experimental load-displacement curves. Therefore, the present work adopts the same validated parameter set to ensure that the nonlinear material behavior of concrete is consistent with experimentally observed responses before extending the model to the beam–corbel system analyzed in the parametric study.
2.3. Beam design
After defining the corbel (see Section 2.2), the beam design followed the Brazilian standard NBR 6118:2023 [7]. Figure 7 presents the sequence of equations used to obtain the longitudinal and shear reinforcement and verify the strut’s concrete compression. The input data considered for the design are shown in Table 1. Based on these inputs (Table 1) and the calculation routine (Figure 7), the reinforcement values (Table 2) were obtained for modeling and numerical simulation of the beams.

It is worth emphasizing that due to the small dimensions of the corbel (20 cm width, 30 cm length, and 40 cm height), adjustments to the beam design were required to ensure that the beams would meet testing requirements without premature failure since the primary focus of this work is to analyze the influence of the shear key on the performance of beam-column connections.
From Table 1, bw is the beam width, h is the beam height, d is the effective depth, Vd is the design shear force, Md is the design bending moment, fs is the steel strength, fcm is the mean concrete compressive strength, and fctd is the design concrete tensile strength. From Table 2, As is the area of longitudinal reinforcement, As,skin is the area of skin reinforcement, Vrd2 is the concrete shear resistance, Vsd is the applied design shear force, and Asw is the area of transverse reinforcement. The design shear force and bending moment were calculated for the reference beam and intentionally kept constant for all beam lengths. This approach was adopted to isolate the influence of beam length and shear key parameters on the structural response.
It should be noted that the side face reinforcement adopted in the numerical models exceeds the minimum code requirements. This modeling choice was intentionally made to enhance numerical stability and prevent localized cracking or premature damage that could compromise the global response of the beam-corbel system during the nonlinear finite element analysis. Therefore, this reinforcement configuration should not be interpreted as a direct design recommendation, but rather as a numerical strategy to ensure consistent parametric comparisons.
Although beam length varied in the parametric study, the beam cross-section, corbel geometry, and reinforcement detailing were kept constant. This modeling decision was intentionally made to isolate the influence of beam length and shear key parameters on the structural response and to avoid premature corbel failure, which could compromise the comparative analysis.
2.4. Computational models
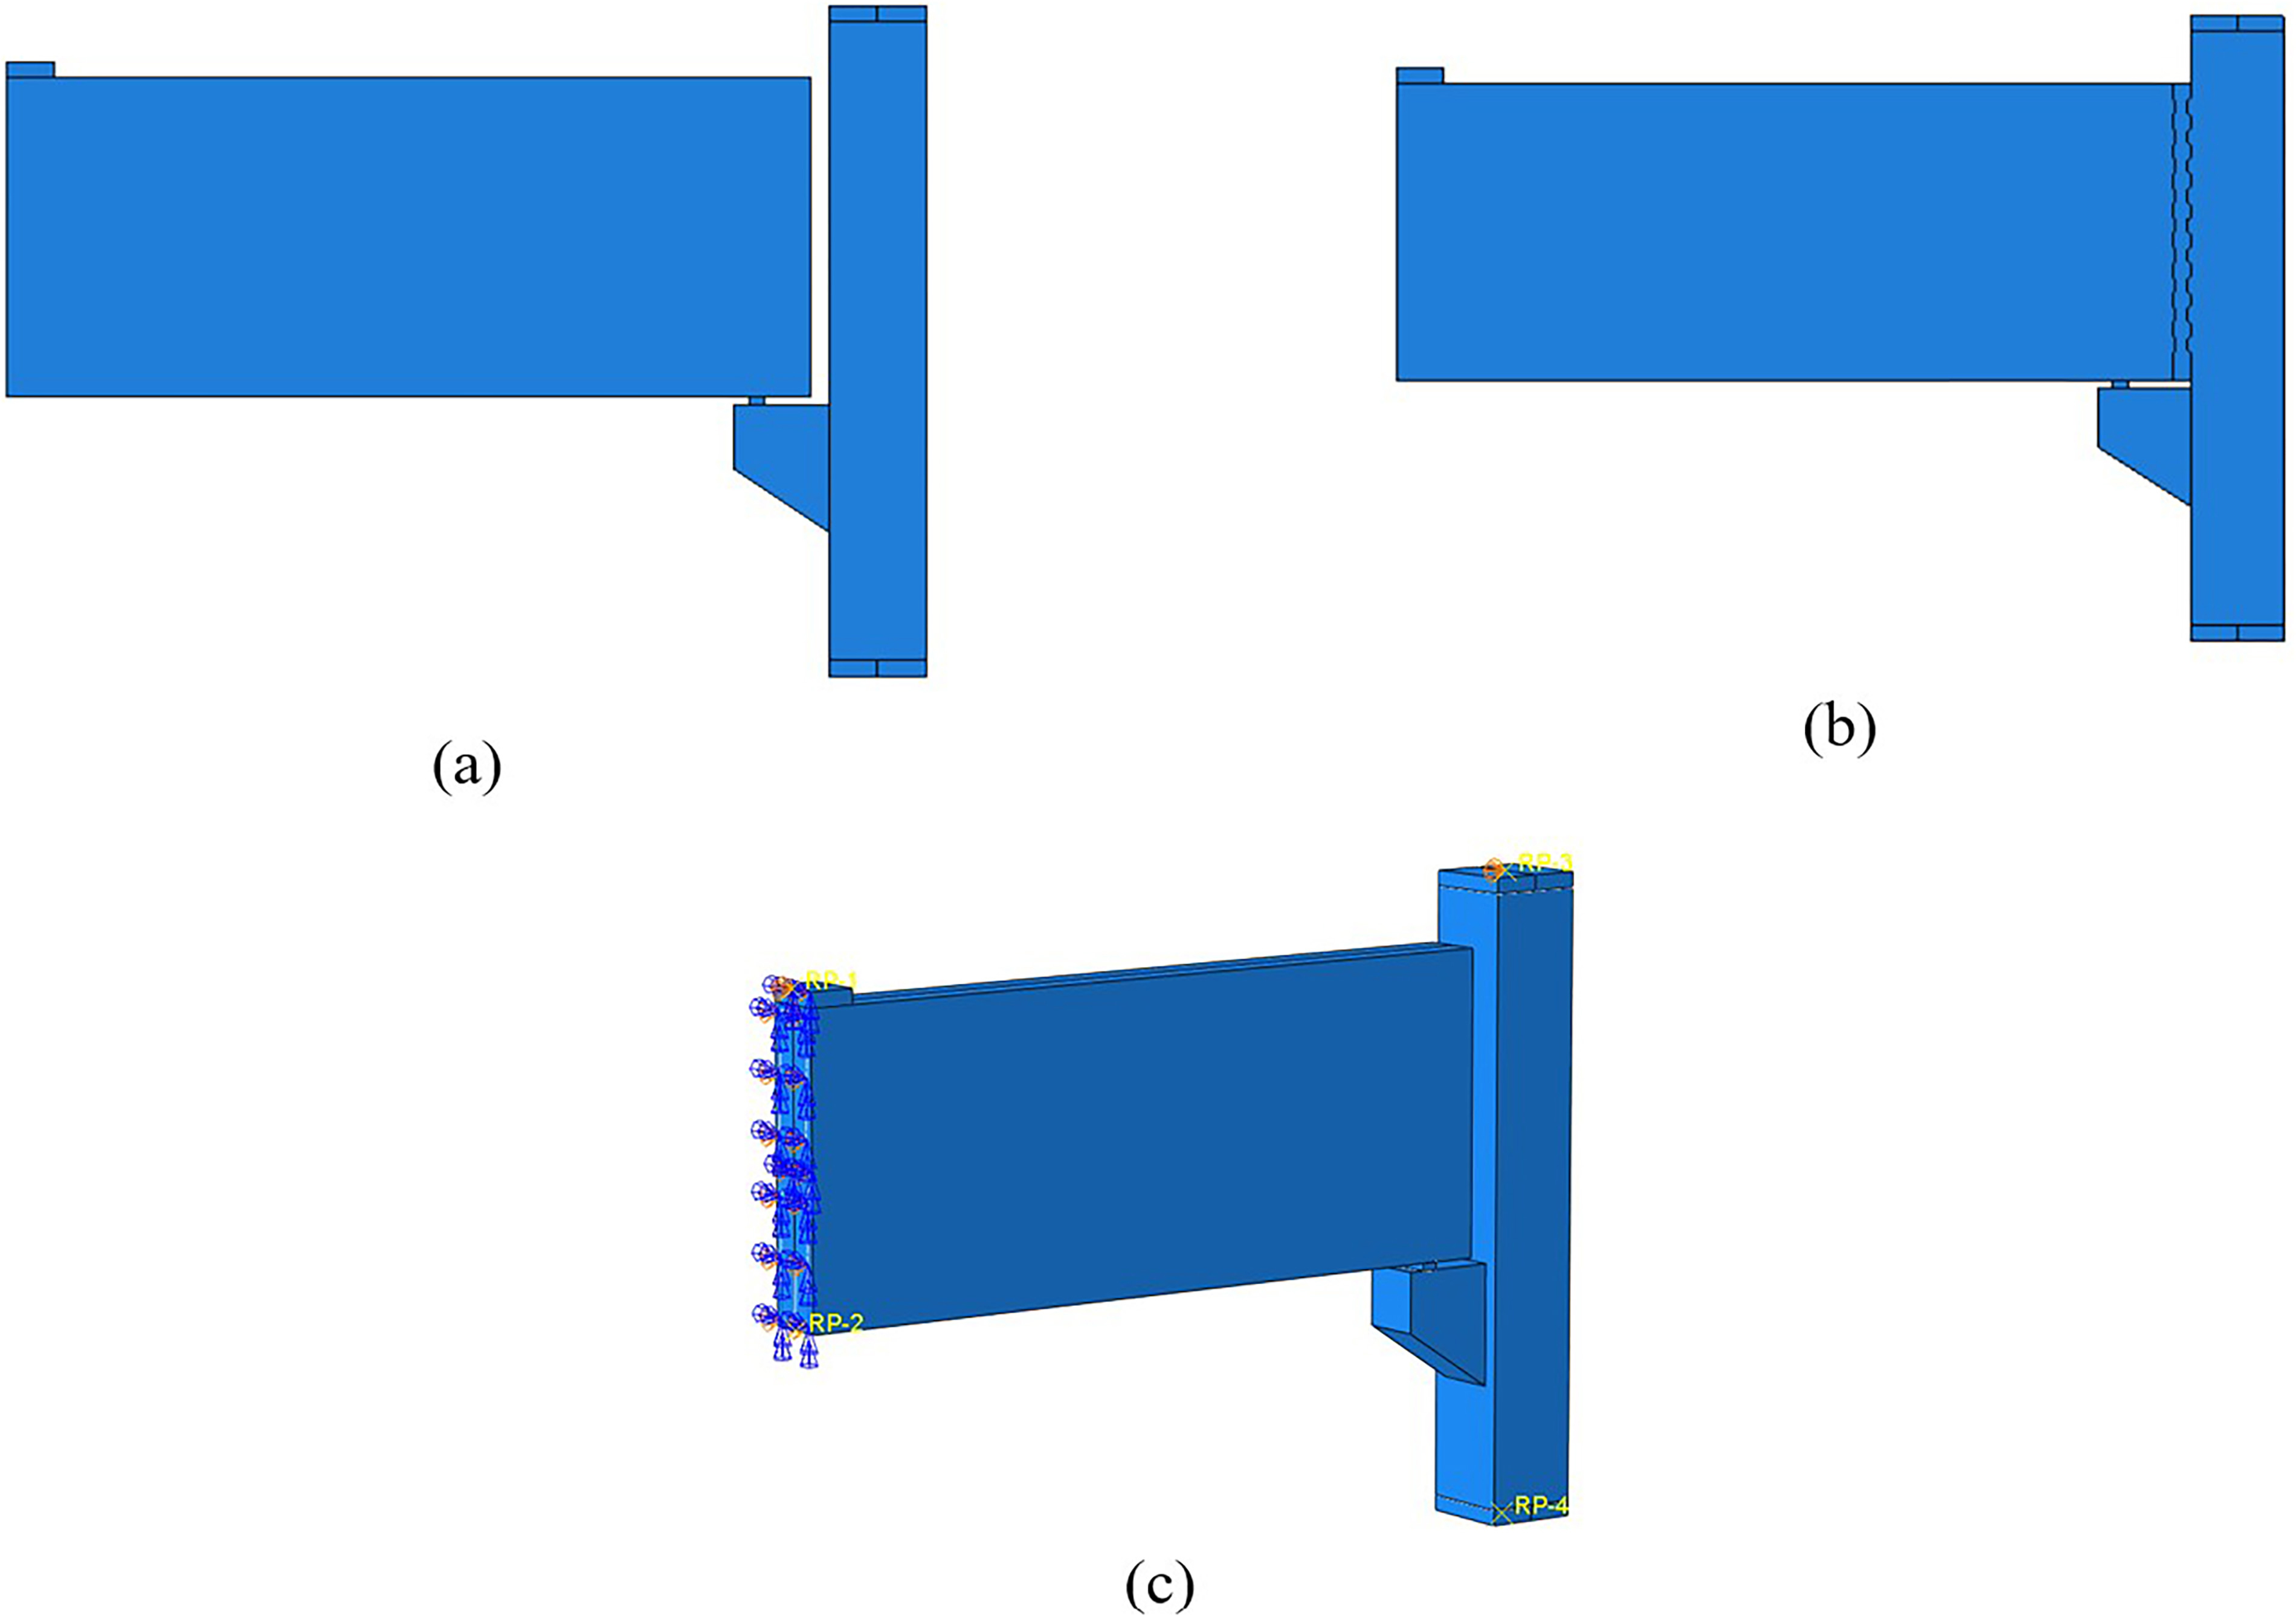
Initially, two computational models were proposed: a complete and a symmetrical model. Based on the validation of these models (Section 2.5), a comparison was conducted to evaluate differences in results with and without symmetry. Both computational models are illustrated in Figure 8 and Figure 9. In the symmetrical model, it was necessary to fully restrain the symmetric face in all directions (Figure 9b), except for vertical displacements (along the loading direction).


Symmetrical model of the reference beam (a), symmetrical model of the beam with the shear key (b), and boundary conditions of the symmetrical models (c).
Concrete was modeled using the concrete damaged plasticity (CDP) model, while an elastoplastic constitutive law with linear hardening was used to model the reinforcement steel. The grout material filling the shear key was assumed to behave as a high-strength cementitious material with elastic properties comparable to those of concrete. It was considered to be perfectly bonded to the beam and column surfaces.
To avoid excessive stress concentration at a single node, a loading plate measuring 30 cm × 20 cm was modeled and positioned at the center of the beam, with a reference point used to apply and monitor the progressive displacement. As for the steel plate placed between the beam and the corbel (20 cm long, 5 cm wide, and 2.5 cm thick), it was modeled using C3D8R finite elements (hexahedral, 8-node, reduced integration) with a 25 mm mesh and a linear elastic constitutive model.
The steel reinforcements (Figure 10) were obtained using the design routine presented in the Brazilian standard NBR 6118:2023 [7], as explained in Section 2.3. The definition of corbel and its validation were addressed in Section 2.2. In beams, columns, and corbels, the C3D8 element (hexahedral, reduced integration) was used, while T3D2 elements (1D, two-node) were adopted for the reinforcement bars.

The elastic modulus of concrete (Ec = 33172 N/mm2) was taken from the experimental results of ARAÚJO et al. [14], and the Poisson’s ratio (0.2) was adopted according to EN 1992-1-1:2004 [8]. For steel, the elastic modulus (200000 N/mm2) and Poisson’s ratio (0.3) are well-established in the literature [10].
The reinforcement steel was modeled as an elastoplastic material with linear hardening. The plastic strain at yield was set to zero, and the strain at failure was defined as 0.01εy, according to the elongation limit for steel specified in NBR 6118:2023 [7], where εy is the steel’s yield strain. The steel yield strength was set to 670 MPa, based on the experimental results from ARAÚJO et al. [14].
Given that concrete beams are structural elements frequently analyzed using the CDP model, the parameters listed in Table 3 were adopted, as they are well established for this type of analysis [15]. These include the dilation angle (ψ), eccentricity factor (Kc), viscosity parameter (μ), plastic eccentricity (ε), and the biaxial-to-uniaxial compressive strength ratio (σb/σc).
The concrete’s geometric properties and stress-strain curves were defined using specific modeling approaches. In compression, the model proposed by CARREIRA and CHU [11] was adopted; for tension, the approach from GENIKOMSOU and POLAK [12] was used. Damage evolution was modeled following the formulation of YU et al. [13], with the compression damage parameter (dc) defined by Equation (1) and the tensile damage parameter (dt) by Equation (2), where σc is the compressive stress at a given time, σct is the tensile stress at a given time, fc is the concrete compressive strength, and fct is the concrete tensile strength.
Contact interactions between model parts were defined using normal and tangential contact constraints, with master-slave relationships connecting the concrete regions according to the load path applied to the beam. The interaction between concrete and reinforcement was modeled using the embedded region technique, ensuring full bond compatibility between the two materials. Contact interactions between concrete and steel plates were modeled using hard normal contact, with tangential interactions assumed to be frictionless. The grout region within the shear key was assumed to be perfectly bonded to the beam and column concrete surfaces, representing idealized interaction conditions.
The applied displacement of 20 mm was selected based on preliminary numerical analyses, ensuring that the reinforcement yielded and that the solution converged stably through the post-peak response of the structural system. The Full Newton solution technique was used to solve the nonlinear equilibrium system, with a maximum of 10,000 iterations. The time increment was configured with an initial value of 0.005, a maximum of 0.05, and a minimum of 1e-20.
2.5. Validation of the computational model
As the beam was designed based on the defined corbel geometry, no experimental work is available for direct comparison. Therefore, once the CDP parameters were established, a mesh sensitivity study was conducted by varying the mesh size (50 mm, 35 mm, and 25 mm) of the chosen finite element (T3D2, the same used for the corbel) to assess its influence on the maximum load, aiming to approximate the result obtained through the analytical methodology described in the normative document [7].
Initially, a comparison was performed between the complete model (Figure 8a) and the symmetrical model (Figure 9a) to evaluate the applicability of symmetry in the nonlinear analysis. Although symmetry must be applied with caution in nonlinear problems, the symmetrical model was validated through direct comparison with the complete model, showing a difference of less than 5% in peak load. Based on this agreement, the symmetrical model was adopted to reduce computational cost while maintaining acceptable accuracy. Both models were developed using the largest beam considered in the parametric study (5.0 m length), with T3D2 finite elements and the smallest mesh size tested (25 mm).
Additionally, in Figure 8a and Figure 9a, the shear key was not included, as the reference value used for comparison (based on the code) does not account for it. It is important to note that the wireframe structures considered in both models were defined according to the reinforcement design described in Section 2.2.
Following validation of the symmetrical model, a mesh sensitivity test was performed by varying the finite element sizes (C3D8R and T3D2) to 25 mm, 35 mm, and 50 mm (Figure 9a). The aim was to determine which mesh size produced the maximum load value closest to the reference value specified in the normative document.
3. RESULTS AND DISCUSSIONS
This section initially presents the results of the corbel and structural model validation, ensuring the reliability of the analyses developed within the parametric study. It also includes the outcomes of numerical simulations, evaluating the influence of key variables, such as shear key geometry, beam-to-column spacing, and beam length, on structural performance, particularly maximum load capacity.
3.1. Validation of the computational model
Figure 11 shows the force-displacement results obtained from the complete model simulation (without symmetry) using a 25 mm mesh. The curves from both the symmetrical and full models exhibit similar behavior, with peak loads at approximately 8 mm of displacement. Moreover, when comparing half the maximum load of the complete model (427.21 kN) to the peak load of the symmetrical model (406.46 kN), the difference is only 20.75 kN or roughly 5%. Given the significantly reduced computational time and the close agreement in results, the symmetrical model was deemed valid for parametric simulations.

Force-displacement curve obtained from the complete (full) numerical model without shear key, using a mesh size of 25 mm. The load-displacement response corresponds to the full structural model, and the applied displacement is measured at the reference point located at the center of the loading plate.
Figure 12 displays the force-displacement curves for the symmetrical models at the three mesh sizes (50 mm, 35 mm, and 25 mm). It can be observed that mesh size had little impact on the maximum load values. As a result, the difference between the simulated maximum loads and the normative reference value (490.20 KN) [7], obtained through structural design (Section 2.2) without safety factors, remained nearly constant at around 17%. This discrepancy may be attributed to differences between the simplified analytical design model and the nonlinear numerical representation adopted in this study. While the analytical procedure provided by ABNT NBR 6118 is based on simplified strut-and-tie formulations intended for design verification, the finite element model explicitly considers nonlinear material behavior, cracking propagation, stiffness degradation, and contact interactions between structural components. These aspects may lead to a slightly lower predicted peak load in the numerical model compared to the analytical estimate.

Force–displacement curves obtained from the symmetrical numerical model (half structure) for different mesh sizes (50 mm, 35 mm, and 25 mm), with displacement measured at the reference point located at the center of the loading plate. All results correspond to the symmetrical model without the shear key and represent half of the structural system used for the validation analysis. The horizontal dashed line indicates the normative reference value (490.20 kN) obtained from the analytical design according to ABNT NBR 6118 [7].
3.2. Results of the parametric study
Figure 13 illustrates the parametric study’s force-displacement behavior of all beams considered. Overall, the maximum load increased as the beam length decreased, indicating a greater influence of shear forces. Consequently, shorter beams (3.8 m) could withstand greater loads. However, the gain in maximum force between the 4.0 m and 3.8 m beams was insignificant, suggesting a possible limit to the improvement provided by the shear key.

Force-displacement curves of beams with and without shear key for different beam lengths: (a) 5.0 m, (b) 4.8 m, (c) 4.6 m, (d) 4.4 m, (e) 4.2 m, (f) 4.0 m, and (g) 3.8 m. The curves correspond to the symmetrical numerical model (half structure). Although only half of the geometry is modeled due to symmetry conditions, the load values represent the equivalent structural response of the complete system, since the applied displacement is defined at the central reference point representing the loading of the full beam–column assembly.
When analyzing beams with shear keys, the overall structural behavior was similar across different rib widths and beam-column spacings. For beams with lengths ranging from 5.0 m to 4.2 m, the best performance was observed in configurations with larger rib widths (8 cm) combined with smaller beam-column spacing (4 cm). In contrast, beams with lengths of 4.0 m and 3.8 m exhibited better performance when narrower ribs (4 cm) were adopted, also with a spacing of 4 cm. These trends indicate that shorter beams tend to benefit from narrower shear key ribs, which promote more efficient load transfer at the beam-column interface by limiting stress concentration and avoiding localized shear effects. As beam length increases, wider ribs become more effective by increasing the contact area and enhancing stress redistribution between the shear key and the corbel.
Furthermore, the difference in maximum load between beams with and without shear keys was evident for each beam length. Despite the variations in rib width and beam-column spacing not significantly affecting the maximum load values, Table 4 highlights the difference between the maximum load of beams without shear keys (Fmin) and the average maximum load (Fmax,mean) of those with shear keys, where COV denotes the coefficient of variation. The results show that this difference increased as the beam length decreased, indicating that the shear key played a more significant role in shorter beams, resulting in a maximum increase in load of 36.70%.
The structural responses of the beams that showed the highest and lowest maximum loads are presented in Figure 14, Figure 15, Figure 16, and Figure 17. Specifically, the maximum stresses in the reinforcement highlight the most critical regions, emphasizing the concentration of tensile forces and the interaction between steel and concrete (Figure 14). The compressive damage illustrates the critical crushing zones (Figure 15), while the tensile damage reveals areas with significant cracking in the concrete (Figure 16). In concrete, the minimum principal stresses identify the most intensely compressed regions, assessing the efficiency of internal stress redistribution (Figure 17). Observing the minimum stresses allows tracing the stress path from the point of loading to the corbel, indicating a tendency toward failure in the strut region.

Maximum stresses in the reinforcement steel for the beams with the lowest maximum load (worst performance, without shear key) (a) and the highest maximum load (best performance, with shear key) (b), highlighting the most critical tensile stress regions along the beam-corbel system.

Minimum principal stresses in the concrete for the beams with the lowest maximum load (worst performance, without shear key) (a) and the highest maximum load (best performance, with shear key) (b), indicating the regions subjected to the highest compressive stresses and the main stress transfer path from the loading point to the corbel.

Tensile damage distribution in the concrete for the beams with the lowest maximum load (worst performance, without shear key) (a) and the highest maximum load (best performance, with shear key) (b), illustrating the cracking pattern and the influence of the shear key on damage localization.

Compressive damage distribution in the concrete for the beams with the lowest maximum load (worst performance, without shear key) (a) and the highest maximum load (best performance, with shear key) (b), highlighting the crushing zones and the effectiveness of stress redistribution provided by the shear key.
The stress and damage distributions shown in Figures 14 to 17 indicate that the presence of the shear key modifies the internal load transfer mechanism by promoting a more direct load path at the beam-column interface. This effect reduces stress concentration in the corbel strut region. It enhances load sharing between the shear key and the corbel, particularly in shorter beams, which explains the higher load capacity observed in these configurations.
4. CONCLUSIONS
This study examined the impact of shear keys on the maximum load capacity of precast concrete structures through a parametric numerical investigation using the finite element method, considering variations in beam length, shear key rib width, and beam-to-column spacing.
The numerical results indicated that variations in beam-column spacing and shear key rib width did not produce a significant overall effect on maximum load capacity. However, distinct trends were observed depending on beam length. Shorter beams (4.0 m and 3.8 m) exhibited improved performance when narrower ribs (4 cm) and smaller spacing (4 cm) were adopted. In contrast, longer beams exhibited higher maximum loads when combined with wider ribs (8 cm) and reduced spacing.
A clear difference in maximum load capacity was observed between beams with and without shear keys, with the shear-key contribution becoming more pronounced as the beam length decreased. For the 3.8 m beam, the presence of the shear key increased the maximum load by approximately 36.70%. The relatively small difference between the 4.0 m and 3.8 m beams suggests a performance threshold beyond which further reductions in beam length provide only limited additional benefit.
The numerical models adopted idealized bonding conditions at the shear key interface between the grout, beam, and column. This assumption was intentionally adopted to represent an upper-bound structural response and to allow a controlled parametric evaluation of the shear key influence. Consequently, the investigated configurations should be interpreted as part of an exploratory numerical study rather than as direct design recommendations. In practical applications, the effectiveness of shear keys may be influenced by construction quality, grout filling conditions, and interface behavior, which were not explicitly considered in the present simulations.
The present study is limited to numerical simulations and does not consider construction imperfections, long-term effects, or experimental validation. Future research should address these aspects, including investigating additional beam lengths and alternative corbel geometries, and conducting further experimental testing to support professional application and design guidance.
5. ACKNOWLEDGMENTS
The authors thank the Coordination for the Improvement of Higher Education Personnel (CAPES), the Federal University of São Carlos (UFSCar), and the Federal University of Catalão (UFCAT).
6. BIBLIOGRAPHY
-
[1] ELLIOTT, K.S. “Historical and chronological development of precast concrete structures”, In: Elliott, K.S., Hamid, Z.A. (eds.), Modernisation, mechanisation and industrialisation of concrete structures, Hoboken, John Wiley & Sons, pp. 1–60, 2017. doi: http://doi.org/10.1002/9781118876503.ch1.
» https://doi.org/10.1002/9781118876503.ch1 -
[2] GHAYEB, H.H., RAZAK, H.A., SULONG, N., “Performance of dowel beam-to-column connections for precast concrete systems under seismic loads: a review”, Construction & Building Materials, v. 237, pp. 117582, 2020. doi: http://doi.org/10.1016/j.conbuildmat.2019.117582.
» https://doi.org/10.1016/j.conbuildmat.2019.117582 -
[3] MARTINS, R., CARMO, R., COSTA, H., et al., “A review on precast structural concrete walls and connections”, Advances in Structural Engineering, v. 26, n. 14, pp. 2600–2620, 2023. doi: http://doi.org/10.1177/13694332231191073.
» https://doi.org/10.1177/13694332231191073 -
[4] CHANG, R., ZHANG, N., GU, Q., “A review on mechanical and structural performances of precast concrete buildings”, Buildings, v. 13, n. 7, pp. 1575, 2023. doi: http://doi.org/10.3390/buildings13071575.
» https://doi.org/10.3390/buildings13071575 - [5] FALEIROS JUNIOR, J.H., “Estudo experimental dos mecanismos resistentes de juntas com chave de cisalhamento em ligações pilar-viga”, D.Sc. Thesis, Federal University of São Carlos, São Carlos, São Paulo, 2018.
-
[6] XIAO, S., FOMIN, N., “Development and systematic review of connection techniques for RC Precast structural elements: Beam and column connection”, Heliyon, v. 10, n. 16, pp. e35886, 2024. doi: http://doi.org/10.1016/j.heliyon.2024.e35886. PubMed PMID: 39224382.
» https://doi.org/10.1016/j.heliyon.2024.e35886 - [7] ASSOCIAÇÃO BRASILEIRA DE NORMAS TÉCNICAS, NBR 6118 Projetos de estruturas de concreto, Rio de Janeiro, ABNT, 2014.
- [8] COMITÉ EUROPÉEN DE NORMALISATION, EN 1992-1-1 Eurocode 2 – Design of concrete structures – Part 1-1: General rules and rules for buildings, Brussels, CEN, 2004.
-
[9] ABU-OBAIDA, A., EL-MAADDAWY, T., EL-ARISS, B., “Numerical simulation of double-sided concrete corbels internally-reinforced with GFRP bars”, Composites Part C: Open Access, v. 2, pp. 100040, 2020. doi: http://doi.org/10.1016/j.jcomc.2020.100040.
» https://doi.org/10.1016/j.jcomc.2020.100040 -
[10] NEUBERGER, Y.M., ANDRADE, M.V., DE SOUSA, A.M.D., et al., “Numerical analysis of reinforced concrete corbels using concrete damage plasticity: Sensitivity to material parameters and comparison with analytical models”, Buildings, v. 13, n. 11, pp. 2781, 2023. doi: http://doi.org/10.3390/buildings13112781.
» https://doi.org/10.3390/buildings13112781 - [11] CARREIRA, D.J., CHU, K.-H., “Stress-strain relationship for plain concrete in compression”, ACI Journal Proceedings, v. 82, n. 6, pp. 797–804, 1985.
-
[12] GENIKOMSOU, A.S., POLAK, M.A., “Finite element analysis of punching shear of concrete slabs using damaged plasticity model in ABAQUS”, Engineering Structures, v. 98, pp. 38–48, 2015. doi: http://doi.org/10.1016/j.engstruct.2015.04.016.
» https://doi.org/10.1016/j.engstruct.2015.04.016 -
[13] YU, T., TENG, J.G., WONG, Y.L., et al., “Finite element modeling of confined concrete-II: Plastic-damage model”, Engineering Structures, v. 32, n. 3, pp. 680–691, 2010. doi: http://doi.org/10.1016/j.engstruct.2009.11.013.
» https://doi.org/10.1016/j.engstruct.2009.11.013 -
[14] ARAÚJO, D.L., OLIVEIRA, E.M., SILVA, E.M.O., et al., “Experimental analysis of a modified two-step corbel for precast concrete system”, Engineering Structures, v. 242, pp. 112585, 2021. doi: http://doi.org/10.1016/j.engstruct.2021.112585.
» https://doi.org/10.1016/j.engstruct.2021.112585 -
[15] SILVA, L.M., CHRISTOFORO, A.L., CARVALHO, R.C., “Calibration of Concrete Damaged Plasticity Model parameters for shear walls”, Matéria, v. 26, n. 1, pp. e12944, 2021. doi: http://doi.org/10.1590/s1517-707620210001.1244.
» https://doi.org/10.1590/s1517-707620210001.1244