 Validation of the determination of chemical oxygen demand through UV-VIS
ABSTRACT
Effective management of water resources demands rigorous quality monitoring, with Chemical Oxygen Demand (COD) serving as a key indicator of organic pollution. Traditionally, COD determination relies on oxidation with potassium dichromate in a strongly acidic medium containing concentrated sulfuric acid and silver sulfate as a catalyst, with mercury sulfate added to minimize chloride interference. The process involves heating under closed reflux, followed by titration of excess dichromate with ammonium ferrous sulfate. Although analytically robust, this method generates hazardous waste containing hexavalent chromium, mercury, silver, and high concentrations of sulfuric acid, posing environmental risks. This study aimed to validate an optimized alternative based on closed reflux digestion coupled with UV–Vis spectrophotometric detection of trivalent chromium, in accordance with Standard Methods for the Examination of Water and Wastewater. To ensure compliance with ABNT NBR ISO/IEC 17025, the method underwent full validation, including selectivity, linearity, limits of detection and quantification, repeatability, intermediate precision, and accuracy. Results demonstrated excellent analytical performance, with precision comparable to the traditional titrimetric method. The approach reduced reagent consumption and toxic waste generation, proving robust, cost-effective, and environmentally sustainable, enabling up to 24 samples per hour and reducing analysis time by approximately 60–70%.
Keywords:
Waters; Chemical oxygen demand; Residue; Validation
1. INTRODUCTION
Chemical oxygen demand (COD) is one of the main parameters used for monitoring and regulating liquid effluent discharge, as it represents the total amount of oxidizable organic matter in a sample. It is widely applied in environmental control and regulatory frameworks, including Brazilian legislation such as CONSEMA Resolution Nº 355/2017 [1], as well as in studies focused on alternative rapid analytical approaches [2].
The standard method for COD determination is based on dichromate oxidation under closed reflux conditions, followed by titrimetric quantification, as described in Standard Methods [3]. Although this approach is well established and widely used in laboratories accredited according to ABNT NBR ISO/IEC 17025:2017 [4], it presents important limitations. These include the generation of hazardous waste containing chromium, mercury sulfate, silver sulfate, and concentrated sulfuric acid [5, 6], as well as relatively long analysis times, chloride interference control requirements, and high reagent consumption associated with the titrimetric step [7,8,9].
As an alternative, UV–Vis spectrophotometric methods based on the same digestion principle have been widely reported [10, 11] and are also described in standard methods [3]. These approaches enable the direct quantification of the chemical species formed during digestion, reducing reagent consumption and analysis time while maintaining analytical performance comparable to conventional techniques [10,11,12,13].
Despite these advances, important challenges remain regarding the routine analytical implementation of this approach. Most studies available in the literature focus on partial validation, often evaluating isolated parameters such as linearity, method detection limit, limit of quantification, precision, and accuracy [10–12, 14]. However, these approaches do not fully address the broader analytical requirements necessary for routine implementation, including residual analysis, repeatability and reproducibility, comparison with reference methods, and continuous performance monitoring [15, 16].
Therefore, the main limitation is not related to the UV–Vis analytical principle itself, which is already well established in the literature, but rather to the scarcity of integrated validation approaches that systematically address equivalence to the reference method, analytical limits, linearity, statistical agreement, repeatability, and reproducibility under routine laboratory conditions [15, 16].
Thus, the objective of this study was to validate a UV–Vis spectrophotometric method for COD determination through a comprehensive analytical framework, including linearity and residual analysis, evaluation of repeatability and reproducibility, comparison with a certified titrimetric method, and performance monitoring using control charts [15, 16]. This study contributes by providing a systematic and metrologically consistent strategy for the routine implementation of the UV–Vis method in analytical laboratories.
2. MATERIALS AND METHODS
The proposed methodology is based on the UV–Vis spectrophotometric determination of chemical oxygen demand (COD) after acid digestion using the dichromate method, performed in a closed reflux system, applied in two concentration ranges (low and high) to meet different levels of organic load. The method validation was conducted according to the recommendations of INMETRO DOQ-CGCRE-008 [15] and the Standard Methods for the Examination of Water and Wastewater [3], including evaluation of linearity, sensitivity, precision, accuracy, stability, repeatability, and statistical equivalence in relation to the traditional titrimetric method.
2.1. Reagents and solutions
For chemical oxygen demand (COD) analyses, potassium dichromate (K2Cr2O7) solutions at concentrations of 0.03473 mol L−1 (high range) and 0.003496 mol L−1 (low range) were prepared by dissolving 10.216 g and 1.022 g, respectively, of an analytical standard previously dried in an oven at 150 °C for 2 h, in approximately 500 mL of ultrapure water. Subsequently, 167 mL of sulfuric acid (H2SO4) and 33.3 g of mercury sulfate (HgSO4), corresponding to approximately 33.3 g L−1 in the final solution, were added. HgSO4 acts as a chloride-complexing agent, preventing chloride oxidation during acid digestion and consequently avoiding overestimation of COD values. After cooling to room temperature, the solutions were transferred to 1000 mL volumetric flasks, brought to volume with ultrapure water, and stored in amber bottles protected from light.
The digestion reagent consisted of concentrated sulfuric acid containing silver sulfate (Ag2SO4) as a catalyst, prepared at a concentration of 5.5 g L−1 in concentrated H2SO4 [3]. The mixture was stirred until complete dissolution of the catalyst.
The COD standard solutions used in the validation were prepared from different reference materials according to their analytical purpose. For calibration curves, linearity, limit of detection (LOD), and limit of quantification (LOQ) studies, certified reference material (CRM, Merck, batch HC04021832, 996 ± 11 mg O2 L−1), traceable to internationally recognized metrological standards, was used. For the construction of control charts and monitoring of method performance, a reference material (RM, SpecSol, batch F20B0015B, 1000 ± 6 mg O2 L−1) was used for internal quality control purposes and routine monitoring of analytical performance. Repeatability, reproducibility (Gage R&R), and analytical performance studies were carried out using solutions prepared from solid potassium hydrogen phthalate (KHP, Merck, batch A0959474 611, 99.9% purity), used as a secondary analytical standard for precision and performance studies.
2.2. Preparation of test specimens
The samples used in the validation were prepared in the laboratory in an aqueous matrix from reference materials, covering different Chemical Oxygen Demand (COD) concentration ranges in order to encompass the entire analytical interval of the method under study. Therefore, no field sampling step was involved, and sample preparation was carried out according to the recommendations of the Standard Methods for the Examination of Water and Wastewater [3].
For the digestion procedure, 2.5 mL of the test solution, 3.5 mL of sulfuric acid solution containing silver sulfate, and 1.5 mL of potassium dichromate solution were added into test tubes, totaling a final volume of 7.5 mL. For solutions with expected low COD concentrations, a 0.003496 mol L−1 potassium dichromate solution was used, whereas for high concentrations, a 0.03473 mol L−1 solution was employed. After reagent addition, the tubes were hermetically sealed and subjected to digestion in a digestion block at 150 °C for 2 h [3], as recommended by the reference method. Subsequently, the tubes were cooled to room temperature before the determination step.
The determination was then carried out by UV–Vis spectrophotometry (T80, PG Instruments), using a wavelength of 600 nm for high COD concentrations, aiming at the quantification of the Cr3+ ion formed during the digestion process, and 420 nm for low concentrations, allowing the determination of the residual dichromate in solution, as recommended by Standard Methods [3]. It is noteworthy that, at this latter wavelength, there is a slight contribution from the absorbance of Cr3+, which may lead to a small increase in the analytical response, however, this interference was compensated during the construction of the calibration curve.
After preparation and digestion, the solutions were maintained under controlled temperature conditions and analyzed within the shortest possible time interval. Before measurement, all solutions were homogenized by agitation to ensure the uniformity and representativeness of the analyzed aliquots. All preparation, digestion, and analytical steps were performed in a standardized manner in order to minimize sources of variability not associated with the analytical method [15], ensuring that the obtained results exclusively reflect the performance of the COD UV–Vis spectrophotometric method under validation.
2.3. Calibration curves
Two calibration curves were constructed for the determination of COD by UV–Vis spectrophotometry, corresponding to the low (25–90 mg O2 L−1) and high concentration (100–1000 mg O2 L−1) ranges. The calibration levels were established as nominal working concentrations obtained by volumetric dilution of the certified reference material (CRM, 996 ± 11 mg O2 L−1). The small difference (0.4%) between the nominal upper limit (1000 mg O2 L−1) and the certified CRM value (996 mg O2 L−1) was considered analytically negligible, since it lies within the uncertainty interval of the reference material (± 11 mg O2 L−1), thus preserving its metrological traceability.
For instrument blank correction, a reagent blank was prepared using ultrapure water in place of the sample, which was subjected to the same digestion conditions and reagent proportions described in Section 2.2 and applied to the calibration standards, in order to reduce optical interferences associated with the cuvette.
After instrument blank adjustment, absorbance readings were performed at 420 nm for the low concentration range, corresponding to residual dichromate (Cr2O72−), and at 600 nm for the high concentration range, corresponding to Cr3+ formed during digestion, as described in Standard Methods [3]. The wavelengths employed were adopted as recommended by the reference method, and no spectral optimization step was performed, as they provided an adequate analytical response, with sensitivity and selectivity compatible with the evaluated concentration ranges.
Each calibration point was analyzed in five replicates, and the curves were constructed relating the theoretical concentration to the average absorbance.
2.4. Linearity assessment
The linearity of the calibration curves was evaluated by linear regression using the least squares method, using the average absorbance readings at each concentration point. Discrepant readings were evaluated using Grubbs’ test, according to ALBANO and RAYA-RODRIGUEZ [16], and excluded when applicable.
Subsequently, a calibration curve was constructed, where x represents the theoretical concentration and y corresponds to the mean absorbance values. The goodness of fit was evaluated by the coefficient of determination (R2), with values greater than 0.99 indicating excellent linearity. In addition, the regression equation was used to calculate the predicted y values for each concentration level [16].
2.5. Limits of detection and quantification
The limits of detection (LOD) and quantification (LOQ) were determined for both calibration curves from ten measurements of fortified blanks with the lowest analyte concentration, as recommended by INMETRO DOQ-CGCRE-008 [15]. The fortified blanks were prepared using the lowest concentrations of each calibration curve, namely 25 mg O2 L−1 for the low concentration range and 100 mg O2 L−1 for the high concentration range, and were subjected to the same digestion conditions and reagent proportions described in Section 2.3 and applied to the calibration standards.
The LOD and LOQ values were calculated based on the standard deviation of the readings (s), adopting the statistical factors 3.143 for LOD and 10 for LOQ. Accuracy at the quantification level was evaluated by recovery tests, while precision was evaluated by the coefficient of variation (CV).
As acceptance criteria, the recovery limits established by the accredited laboratory for the respective concentration ranges and CV ≤ 10% were used, as recommended by metrological standards for analytical methods.
2.6. Control charts
For both calibration curves, control charts were established from intermediate concentrations. For the low COD concentration curve, a value of 50 mg O2/L was adopted, while for the high concentration curve, 450.4 mg O2/L was used. The samples were prepared from an MR standard (SpecSol, 1000 ± 6 mg O2 L−1) and subjected to the same digestion procedure described in Section 2.2. The analyses were performed in triplicate over 20 days, and the control limits were defined as the mean ± 3 standard deviation.
After the digestion process, with the samples cooled and taking the precautions already mentioned, the concentration was determined in a UV–Vis spectrophotometer, applying the same wavelengths as the calibration curves.
2.7. Repeatability and reproducibility
The intermediate precision of the method was evaluated using a Gage R&R study, as described by ALBANO and RAYA-RODRIGUEZ [16], employing five concentration levels within the low (36.5–83 mg O2 L−1) and high concentration ranges (150–900 mg O2 L−1), analyzed by two operators in triplicate.
The samples were prepared from potassium hydrogen phthalate (KHP, 99.9%), previously dried at 110 °C to constant mass, using the stoichiometric factor of 1.176 mg O2 per mg of KHP to obtain the desired COD concentrations [9]. The masses of KHP corresponding to each concentration level were calculated based on this factor, weighed on an analytical balance, dissolved in ultrapure water, and diluted in volumetric flasks to a final volume of 1 L in order to obtain the nominal concentrations established for each study level. The solutions were digested in a digestion block at 150 °C for 2 h and analyzed by UV–Vis spectrophotometry at the same wavelengths used in the calibration curves.
Repeatability and reproducibility were calculated from the means and ranges of the triplicate measurements at each concentration level, according to the Gage R&R statistical procedure. As acceptance criteria, R&R ≤ 10% was considered satisfactory, 10% < R&R ≤ 30% acceptable with need for improvement, and R&R > 30% unacceptable [16].
2.8. Performance comparison
The proposed UV–Vis spectrophotometric method was compared with the accredited reference titrimetric method, in accordance with ABNT NBR ISO/IEC 17025:2017 [4], based on acid digestion by the dichromate method followed by titration with ammonium ferrous sulfate and ferroin indicator, as described in Standard Methods [3]. In this study, the same KHP samples prepared for the repeatability and reproducibility study (Section 2.7) were used, aiming to reduce laboratory waste generation, and were analyzed by both methods for comparative purposes.
The ammonium ferrous sulfate (FAS) solution (0.01 mol L−1) was standardized by titration with a standard potassium dichromate solution (0.01667 mol L−1), previously prepared by dissolving 4.903 g of the salt in a 1 L volumetric flask. For standardization, 2.0 mL of the dichromate solution, approximately 98 mL of ultrapure water, and 30 mL of concentrated sulfuric acid were used, with the addition of 5 drops of ferroin indicator, followed by titration with FAS.
For the low concentration range, the limit of quantification of the reference titrimetric method (≥ 45 mg O2 L−1) was considered, which restricted the selection of samples within the previously evaluated interval. Thus, the three highest concentrations of the low concentration range (56, 69, and 83 mg O2 L−1), previously used in the precision study (Section 2.7), were selected, and additional replicates were performed in order to obtain the set of seven samples required for statistical analysis.
For the high concentration range, due to the wider working range of the reference method, seven samples distributed between 150 and 900 mg O2 L−1 were selected within the previously validated interval, using the same solutions prepared for the precision study (Section 2.7). When necessary, samples were diluted to ensure partial consumption of dichromate during digestion, according to the routine procedure of the reference method [3].
For determination by the reference titrimetric method, 2.0 mL aliquots of the digested sample were transferred to Erlenmeyer flasks, to which approximately 98 mL of ultrapure water, 30 mL of concentrated sulfuric acid, and 5 drops of ferroin indicator were added, followed by titration with ammonium ferrous sulfate (FAS) solution (0.01 mol L−1). Analysis by the proposed UV–Vis spectrophotometric method was carried out under the same wavelengths and conditions used for the calibration curves. Blanks and control standards were analyzed in parallel to verify the validity of the assay.
The statistical evaluation was performed using the Student’s t-test for paired samples, comparing the results obtained by the UV–Vis method and the titrimetric method for each sample. Considering seven pairs of data, the degrees of freedom were 6, adopting a critical value of t0,05,6 = 2.447. The equivalence between the methods was confirmed when the calculated t-value was less than the critical value.
3. RESULTS AND DISCUSSION
Initially, linearity was verified by applying Grubbs’ test to 5 low-concentration calibration curves and 5 high-concentration curves. Then, the limits of detection and quantification were evaluated for the low-concentration curve.
The next validation step was the creation of control charts. Subsequently, performance comparison, repeatability, and reproducibility tests were performed.
3.1. Calibration curve and linearity
Calibration curves were constructed from five concentration levels in each range (low and high), with five replicates per point. Means, standard deviations, and coefficients of variation (CV) are presented in Table 1.
Grubbs’ test (Gcritical = 1.715, n = 5) indicated the absence of outliers at all concentration levels, allowing the use of all replicates for the calculation of means. The coefficients of variation ranged between 2% and 9% for both curves, remaining below the 10% limit recommended for analytical assays, which demonstrates adequate instrumental repeatability.
For the high concentration range (100–1000 mg O2 L−1), the linear regression equation obtained was y = (0.0003 ± 0.000008)x + (0.0125 ± 0.0050), with a coefficient of determination R2 = 0.9993 (Figure 1A). For the low concentration range (25–90 mg O2 L−1), the fitted equation was y = (−0.0018 ± 0.00004)x + (0.1841 ± 0.0022), with R2 = 0.9988 (Figure 1B). The errors associated with the coefficients were obtained from linear regression using the least squares method. In both cases, the R2 values exceeded the minimum criteria typically adopted in analytical method validation, indicating excellent linear fit and suitability of the model within the evaluated concentration ranges.
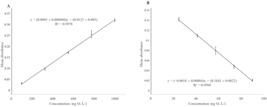
It is observed that the curve at high concentrations shows a positive slope, attributed to the formation of Cr3+ ions, whose absorbance is measured at 600 nm. In contrast, the curve at low concentrations shows a negative slope, which is explained by the decrease in the concentration of the remaining dichromate during the reaction. According to the Beer–Lambert law, absorbance is directly proportional to concentration, therefore, the reduction in dichromate concentration results in lower absorbance at 420 nm. This behavior is consistent with the mechanism of organic matter oxidation by dichromate, confirming the physicochemical coherence of the proposed method.
The adequacy of the linear model was also evaluated through graphical analysis of the residuals (Figure 2). Based on the linear regression equations, the residuals were calculated as the difference between the experimental absorbance values and the theoretical values predicted by the model. In both concentration ranges, the residuals showed a random distribution around zero, with no systematic trend or curvature, indicating the absence of bias and confirming the suitability of the linear model within the studied working range.
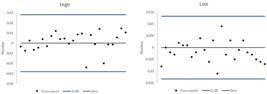
All results remained within the ± 3 standard deviation limits, as expected for a normal data distribution. Additionally, the Grubbs test applied to the experimental absorbance values did not identify any outliers at any concentration level, further confirming the absence of discrepant values in the dataset.
A slight apparent trend was observed in the residuals at the highest concentration level of the low range (Figure 1B, Figure 2, Low), with experimental absorbance values being slightly higher than those predicted by the model. However, the magnitude of these residuals was small and consistent with the expected experimental variability, indicating no evidence of systematic bias. To verify whether this observation represents a statistically significant effect, the corresponding concentration level was further evaluated in subsequent validation studies (Sections 3.4 and 3.5).
Thus, considering the overall behavior of the residuals, the results demonstrate that the method exhibits a linear and repeatable response, with no evidence of outliers across the studied concentration ranges. Although a slight trend was observed at one point in the low concentration range, its magnitude is consistent with the expected experimental variability and does not compromise the adequacy of the model. Therefore, the method meets the linearity requirements for metrological method validation, in accordance with international guidelines for analytical method validation.
3.2. Limits of quantification and detection
For both calibration curves, the limits of detection (LOD) and quantification (LOQ) were determined by the blank method with the addition of the lowest analyte concentration, as recommended in the literature. Ten readings were taken for each curve, and seven values were selected for the statistical calculation of the mean and standard deviation (s). The LOD was calculated as 3.143·s and the LOQ as 10·s.
The values obtained for the low and high concentration curves are presented in Table 2. It can be observed that, for both curves, the LOD and LOQ values were lower than the first point of the calibration curve, indicating adequate sensitivity of the method.
For experimental verification of the calculated limits, recovery tests were performed at the LOD and LOQ, with six replicates per level for each curve. The samples were digested in a digestion block and analyzed by UV–Vis spectrophotometry. The recovery results and coefficient of variation (CV) obtained at the limit of quantification are presented in Table 3.
The recoveries obtained were within the acceptance criteria established by the laboratory, based on method validation guidelines described in the INMETRO DOQ-CGCRE-008 [15] document and supported by literature for environmental analytical methods. These guidelines state that recovery acceptance criteria should be defined according to the concentration level and method performance requirements. For the concentration range evaluated in this study, the observed recovery values were consistent with commonly applied ranges for environmental analyses. The coefficients of variation were lower than 5% for both calibration curves, demonstrating good precision of the method.
Although the calculated LOQ values were lower than the first point of the respective calibration curves, as recommended by INMETRO, the first point of the curve was adopted as the operational quantification limit, corresponding to 25 mg O2/L for the low concentration curve and 100 mg O2/L for the high concentration curve. This approach avoids extrapolations outside the calibration range and ensures greater metrological reliability.
3.3. Control chart
To monitor the stability of the method over time, control charts were constructed using certified standards (RM) at concentrations of 50 mg O2/L and 450.4 mg O2/L, representative of the low and high working ranges, respectively. Readings were taken on 20 different days, in triplicate, totaling 60 determinations per concentration.
From these data, the averages, standard deviations, and lower (LCL) and upper (UCL) control limits, as well as the center line (CL), were calculated, as shown in Table 4. For the concentration of 50 mg O2/L, a standard deviation of 5.759 mg O2/L was obtained, while for 450.4 mg O2/L the deviation was 13.287 mg O2/L, indicating greater dispersion in the high range, but still within values considered acceptable for statistical process control.
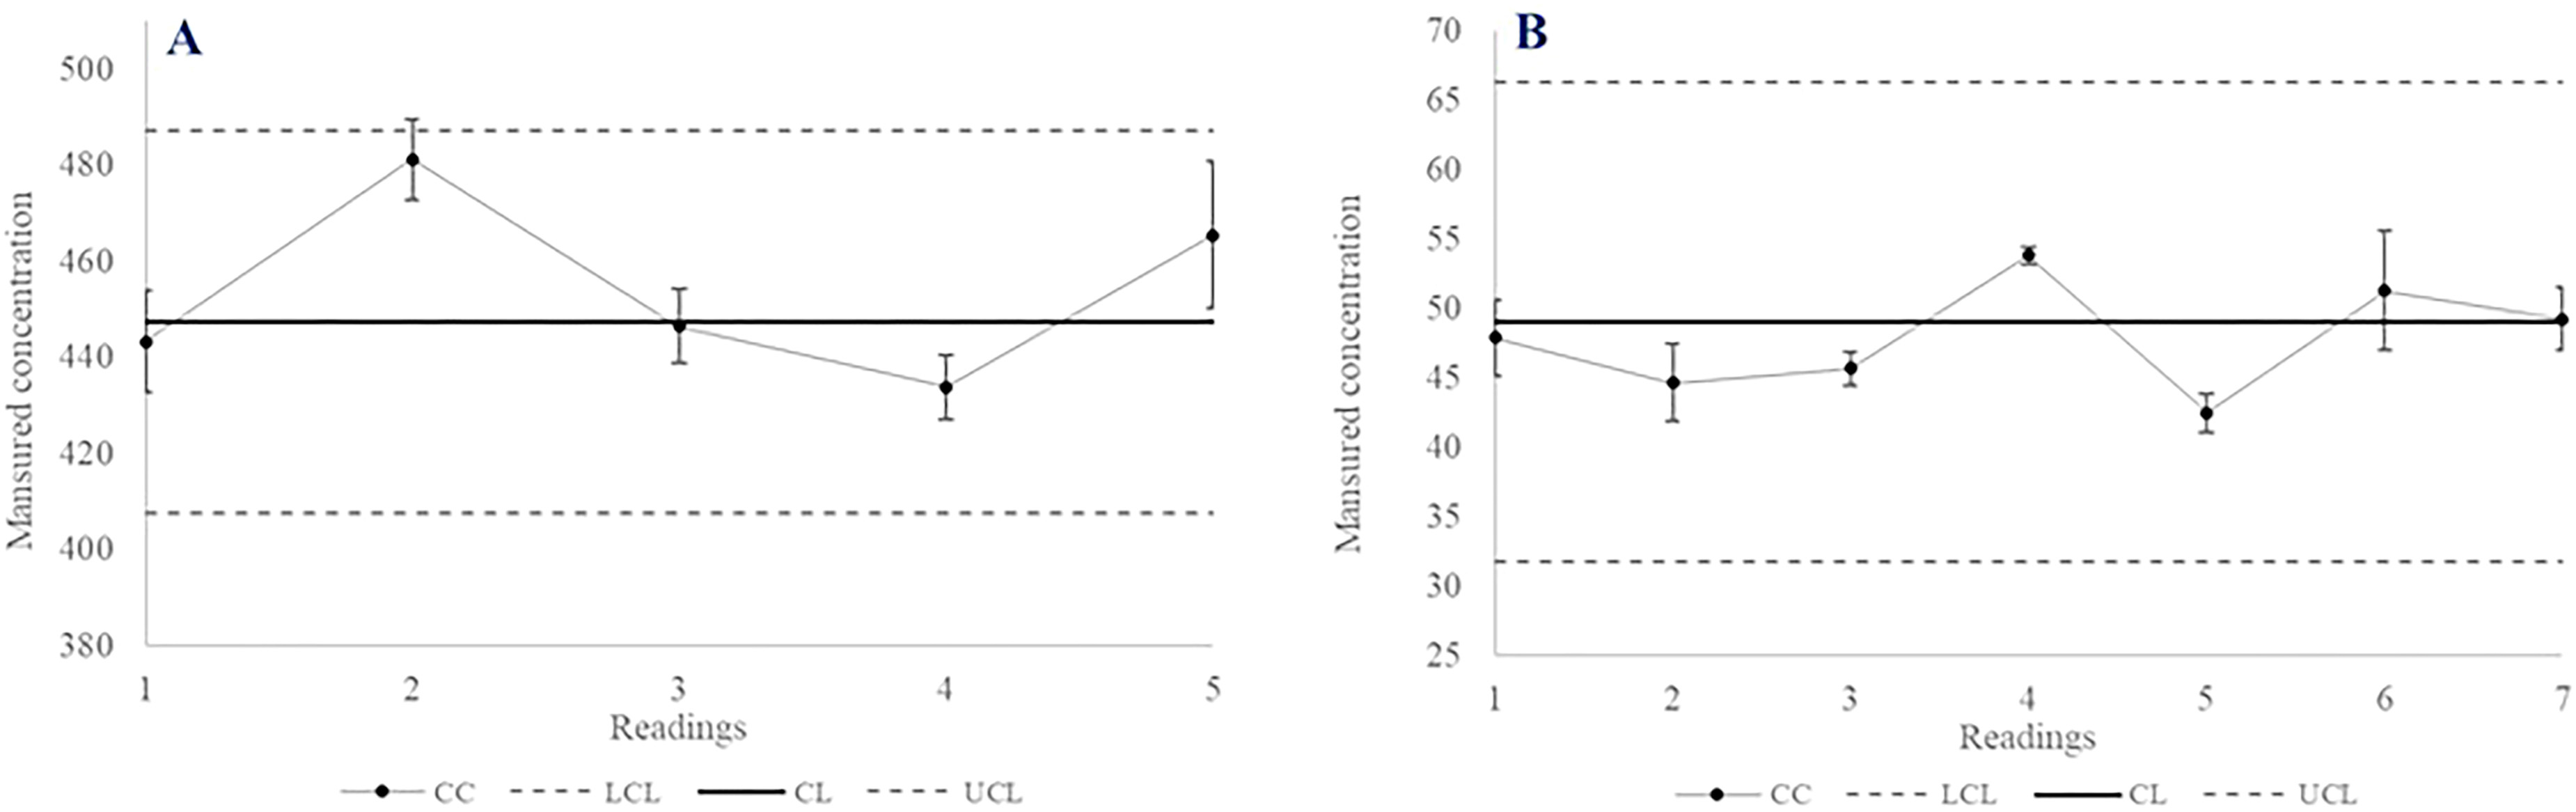
Daily averages were plotted on control charts for visual evaluation of the method’s behavior, as shown in Figures 3 and 4. In the low concentration chart, a sequence of points above the center line was observed in the initial results, indicating a trend. However, since these data were used for the construction of the chart itself, this trend was disregarded for the purposes of diagnosing instability.
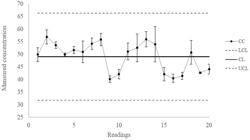

The high concentration chart showed a random distribution of points, with no trends or results outside the control limits, characterizing a stable process under statistical control [16]. In both concentration ranges, none of the analytical batches showed results outside the previously established control limits (LCL and UCL), which represent the expected range of process variation under statistical control conditions. This result indicates that no significant deviations occurred in the analytical performance throughout the study [8].
The analytical behavior observed in this study is consistent with that reported by RAMADHAN et al. [14], who evaluated COD determination across different concentration ranges (10–90 mg/L and 100–900 mg/L). The authors reported that measurements at lower concentrations are strongly influenced by the sensitivity of absorbance detection, since small variations in Cr(VI) can significantly affect the signal response. In contrast, higher concentration ranges are more affected by volumetric and calibration preparation uncertainties, which contribute more significantly to overall measurement uncertainty.
Similarly, in the present study, lower concentration levels required greater attention to instrumental sensitivity, while higher concentration ranges showed increased influence of calibration-related variability. This behavior is consistent with the expected analytical performance of the dichromate method, where both detection sensitivity and volumetric preparation contribute differently depending on concentration level.
The LOD and LOQ values reported by RAMADHAN et al. [14] further support that reliable quantification at low COD levels is achievable when instrumental sensitivity is adequate, as also demonstrated in this work.
Throughout the subsequent validation stages, including repeatability, reproducibility, and performance comparison studies, the same digestion procedure previously described was consistently applied. In addition, a reference material (RM) was included in each analytical batch and monitored using the limits established in control charts, allowing continuous assessment of the method’s performance throughout the validation process. The control results for each analytical batch are presented in Figure 5.

In both concentration ranges, none of the analytical batches showed results outside the previously established control limits, indicating that the analytical process remained under statistical control throughout the study. Additionally, no systematic trends were observed in the control charts, such as consecutive points consistently above or below the central line, which further supports the stability of the analytical process. This behavior demonstrates the stability of the method, as well as its ability to produce consistent and reliable results over time, even under varying operational conditions. These findings reinforce the robustness of the proposed methodology and its suitability for routine analytical application, in accordance with recommended practices for quality control in analytical methods.
3.4. Repeatability and reproducibility
The repeatability and reproducibility of the method were evaluated for high and low concentration curves using standard solutions prepared with potassium hydrogen phthalate (KHP). Due to the difficulty in accurately weighing the theoretical masses, the actual concentrations of the solutions were recalculated based on the masses actually weighed.
For each concentration level, two technicians simultaneously pipetted the samples, followed by joint digestion in the same digestion block and reading on a UV–Vis spectrophotometer. The results obtained were used to calculate repeatability (intra-operator variation) and reproducibility (inter-operator variation), according to the analysis of variance methodology applied in a spreadsheet. The consolidated results of the study are presented in Table 5.
The overall R&R values were 4.35% for the high concentration range and 9.35% for the low concentration range, both below the 10% limit recommended for analytical methods, indicating satisfactory performance of the measurement system [16]. To better understand the origin of this variability and provide a more detailed interpretation of the method performance, the sources of variation were decomposed into repeatability and reproducibility components (Figure 6, contribution of variability sources).

For the high concentration range, repeatability (σ = 10.31) was the main source of variability, accounting for 67.1% of the total variation, while reproducibility (σ = 7.21) contributed 32.9%. This result indicates that most of the variability is associated with experimental conditions of the method, such as sample preparation and instrumental response, whereas the influence of the operator is secondary.
In the low concentration range, an even more pronounced predominance of repeatability was observed (σ = 1.91), accounting for 94.9% of the total variability, while reproducibility showed a minor contribution (σ = 0.44, 5.1%). This behavior is expected, since at lower concentration levels the method becomes more sensitive to small instrumental and operational variations.Similar results were reported by JERÔNIMO et al. [13], who evaluated the spectrophotometric determination of COD in the range of 50 to 5000 mg O2/L and obtained repeatability and reproducibility values on the order of ± 2%. Although the values obtained in the present work are higher, direct comparison is limited due to methodological differences and the concentration range evaluated.
MENDEZ [8] also observed greater variability in the low concentration curve when comparing titrimetric and colorimetric methods, indicating that the lower precision in this range is an intrinsic characteristic of the method.
In addition, the specific evaluation of the 83 mg O2/L point (Table 6) demonstrated positive and negative variations between technicians and between replicates, without evidence of systematic bias, corroborating the interpretation that the visual trend observed in the low concentration curve is not statistically significant.
Thus, the results confirm that the method exhibits adequate repeatability and reproducibility for both concentration ranges studied, being fully applicable to the spectrophotometric determination of COD in water and effluents.
3.5. Performance comparison
The performance comparison was carried out between the proposed UV–Vis spectrophotometric method and the certified method employed by the accredited laboratory, based on closed reflux digestion followed by titration. For both calibration ranges (low and high concentration), seven samples distributed across the working range were analyzed.
For the high concentration range, in addition to the solutions prepared for the repeatability and reproducibility study, two additional intermediate solutions were included to meet the minimum number of points required for the statistical analysis. For the low concentration range, the previously prepared solutions were reused.
The samples were analyzed simultaneously by both methods, and the results were evaluated using a paired Student’s t-test at a 95% confidence level to assess the presence of statistically significant differences between the methods. The calculated and critical t-values for both ranges are presented in Table 7.
In both cases, the calculated t-values were lower than the critical value, meeting the acceptance criterion recommended for analytical method validation [16] and indicating no statistically significant difference between the methods.
Results consistent with those obtained in this study were reported by MENDEZ [8], who compared titrimetric and colorimetric methods for COD determination and observed better performance of the colorimetric method, particularly at low concentrations.
In addition to the t-test, the agreement between the methods was further evaluated by linear regression analysis (Figure 7).
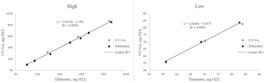
For the high concentration range, the regression equation was y = 1.0034x − 2.386 (R2 = 0.9999), while for the low concentration range it was y = 1.0086x − 0.0471 (R2 = 0.9904). The slopes close to unity and intercepts close to zero indicate the absence of proportional and systematic errors, demonstrating excellent agreement between the methods. Similarly, BUENO [7] reported satisfactory accuracy for both methods over a wide concentration range.
To further investigate the visual trend observed at the highest point of the low concentration range, the sample corresponding to 83 mg O2 L−1 was analyzed in triplicate by both methods. The results showed both positive and negative deviations relative to the theoretical concentration, with no evidence of systematic bias, supporting the interpretation that the trend observed in the calibration residuals is not statistically significant.
In addition to the analytical performance, the proposed method presents advantages from a green chemistry perspective when compared to the reference titrimetric method. The elimination of the titration step reduces reagent consumption and simplifies the analytical procedure, contributing to lower chemical waste generation and improved operational efficiency.
4. CONCLUSION
The present study demonstrated that the determination of chemical oxygen demand (COD) by UV–Vis spectrophotometry, based on dichromate digestion followed by spectrophotometric quantification, meets the metrological requirements applicable to methods used in laboratories accredited according to ABNT NBR ISO/IEC 17025:2017 [4].
The method exhibited excellent analytical performance across both low and high concentration ranges. Calibration curves showed strong linearity, with coefficients of determination above recommended values, while residual analysis confirmed the adequacy of the linear model with no evidence of significant systematic deviations. The limits of detection and quantification, as well as recovery and coefficient of variation results, demonstrated adequate sensitivity and precision for routine applications.
Repeatability and reproducibility were within acceptable limits (R&R < 10%), confirming the precision of the method, although slightly higher variability was observed at lower concentration levels, as expected for spectrophotometric measurements. The comparison with the certified reference method showed no statistically significant differences, and the strong correlation between methods confirmed the accuracy and reliability of the proposed approach.
In addition to its analytical performance, the method offers relevant operational and environmental advantages. The elimination of the titrimetric step reduces analysis time, reagent consumption, and the generation of chromium-containing waste. Considering that the conventional method requires approximately 5 to 10 minutes per sample, the proposed approach enables the determination of up to 24 samples within one hour, significantly increasing analytical throughput. These factors contribute to improved laboratory safety, increased analytical efficiency, and alignment with green chemistry principles.
Overall, the proposed UV–Vis spectrophotometric method represents a reliable, efficient, and environmentally favorable alternative for COD determination in water and wastewater samples, being suitable for routine application in environmental and industrial laboratories.
5. ACKNOWLEDGEMENTS
This work was supported by the company Artecola and the National Council for Scientific and Technological Development (CNPq). The authors also acknowledge the financial support of the Brazilian agencies Coordination for the Improvement of Higher Education Personnel (CAPES), Foundation for Research Support of the State of Rio Grande do Sul (FAPERGS), and Financing Agency for Studies and Projects (FINEP).
6. DATA AVAILABILITY
All the data supporting the results of this study were published in the article itself.
7. BIBLIOGRAPHY
- [1] PORTO ALEGRE, Conselho Estadual do Meio Ambiente – CONSEMA, Resolução nº 355, de 13 de julho de 2017. Dispõe sobre os critérios e padrões de emissão de efluentes líquidos para as fontes geradoras que lancem seus efluentes em águas superficiais no Estado do Rio Grande do Sul, Diário Oficial do Estado, 2017.
-
[2] CORREA, J.S., CAMPOS, M., MONTANHEZ, B.E., et al, “Uso de resposta espectral em comprimentos de onda (230–290) nm como parâmetro indireto quantitativo de COD e DQO”, Revista DAE, v. 68, n. esp., pp. 51–62, 2020. doi: https://doi.org/10.36659/dae.2020.052.
» https://doi.org/10.36659/dae.2020.052 - [3] AMERICAN PUBLIC HEALTH ASSOCIATION, Standard methods for the examination of water and wastewater, 24 ed., Washington, D.C., APHA, AWWA, WEF, 2023.
- [4] ASSOCIAÇÃO BRASILEIRA DE NORMAS TÉCNICAS, Requisitos gerais para a competência de laboratórios de ensaio e calibração, ABNT NBR ISO/IEC 17025:2017, Rio de Janeiro, ABNT, 2017.
-
[5] DALLAGO, R.M., DI LUCCIO, M., GOLUNSKI, C., et al, “Extração e recuperação de prata e mercúrio em efluentes gerados na determinação de DQO empregando métodos físico-químicos”, Engenharia Sanitária e Ambiental, v. 13, n. 2, pp. 121–125, 2008. doi: https://doi.org/10.1590/S1413-41522008000200001.
» https://doi.org/10.1590/S1413-41522008000200001 -
[6] SARAN, L.M., GIANSANTE, R.H., SILVEIRA, G.A., et al, “Recuperação e reciclagem da prata de solução residual proveniente da determinação da demanda química de oxigênio”, Revista Virtual de Química, v. 7, n. 4, pp. 1072–1086, 2015. doi: https://doi.org/10.5935/1984-6835.20150059.
» https://doi.org/10.5935/1984-6835.20150059 -
[7] BUENO, R.F., “Comparação entre o método colorimétrico e titulométrico na determinação da DQO através de análises efetuadas em esgoto doméstico e efluentes industriais”, Revista DAE, v. 57, n. 181, pp. 4–11, 2009. doi: https://doi.org/10.4322/dae.2014.040.
» https://doi.org/10.4322/dae.2014.040 - [8] MENDEZ, E.A.C., “Confiabilidade metrológica: o caso da análise de DQO em um laboratório acadêmico”, Tese de M.Sc., Universidade do Estado do Rio de Janeiro, Rio de Janeiro, 2013.
-
[9] AQUINO, S.F., SILVA, S.Q., CHERNICHARO, C.A.L., “Considerações práticas sobre o teste de demanda química de oxigênio (DQO) aplicado à análise de efluentes”, Engenharia Sanitária e Ambiental, v. 11, n. 4, pp. 295–304, 2006. doi: https://doi.org/10.1590/S1413-41522006000400001.
» https://doi.org/10.1590/S1413-41522006000400001 -
[10] XU, X., WANG, J., LI, J., et al, “Research on COD measurement method based on UV–Vis absorption spectra of transmissive and reflective detection systems”, Frontiers in Environmental Science, v. 11, pp. 1175363, 2023. doi: https://doi.org/10.3389/fenvs.2023.1175363.
» https://doi.org/10.3389/fenvs.2023.1175363 - [11] WULANDARI, I., HASANAH, U., WARNASIH, S, “Comparison of COD determination methods FAS titrimetric with UV–Vis spectrophotometry”, Journal of Science and Applied Chemistry, v. 3, n. 1, pp. 29–34, Jun. 2023.
-
[12] GUAN, L., ZHOU, Y., YANG, S., “An improved prediction model for COD measurements using UV–Vis spectroscopy”, RSC Advances, v. 14, n. 1, pp. 193–205, 2024. doi: https://doi.org/10.1039/D3RA05472A. PubMed PMID: 38173619.
» https://doi.org/10.1039/D3RA05472A. -
[13] JERÔNIMO, C.E., FERNANDES, H.G., MELO, H.N.S., et al, “Estudo comparativo entre técnicas de determinação da matéria orgânica em efluentes industriais de composição carbônica”, Holos, v. 2, pp. 33–43, 2012. doi: https://doi.org/10.15628/holos.2012.828.
» https://doi.org/10.15628/holos.2012.828 -
[14] RAMADHAN, I., ROHYAMI, Y., AHDIATY, R., “Verificação de método de ensaio de demanda química de oxigênio (DQO) por espectrofotometria UV–Vis para baixa e alta concentração”, Indonesian Journal of Chemical Analysis, v. 5, n. 1, pp. 52–61, 2022. doi: https://doi.org/10.20885/ijca.vol5.iss1.art6.
» https://doi.org/10.20885/ijca.vol5.iss1.art6 - [15] INSTITUTO NACIONAL DE METROLOGIA QUALIDADE E TECNOLOGIA, Orientação sobre validação de métodos analíticos, DOQ-CGCRE-008, 9 ed., Brasília, INMETRO, 2020.
- [16] ALBANO, F.M., RAYA-RODRIGUEZ, M.T., Validação e garantia da qualidade de ensaios laboratoriais, 2 ed., Porto Alegre, Rede Metrológica RS, 2015.