 Phase-field modeling of interfacial effects on corrosion-induced damage in confined reinforced concrete structures
ABSTRACT
Reinforced concrete (RC) structures in aggressive environments are highly vulnerable to rebar corrosion, which causes volumetric expansion of corrosion products and leads to cracking and deterioration of the surrounding concrete. Reliable prediction of corrosion-induced damage is therefore crucial for evaluating structural durability and safety. However, many existing phase-field modelings treat concrete as a homogeneous material and neglect its inherent multiphase microstructure as well as the mechanical behavior of interfacial regions between phases. Moreover, these phase-field formulations often fail to satisfy the orthogonal condition between the tensile and compressive components of the strain tensor, which is essential for preserving elastic energy in brittle materials. Therefore, this study develops the phase-field computational frameworks to simulate damage evolution in RC structures subjected to corrosion-induced expansion. Two phase-field modelings are proposed: one considering interfacial damage between different phases while enforcing the strain tensor orthogonal condition (Model M1), and another modeling neglecting interfacial damage but still satisfying this orthogonal requirement (Model M2). Numerical simulations investigate crack propagation and rust expansion values in various structural configurations, including different concrete cover thicknesses, confined and unconfined structures, and randomly distributed inclusions with complex shapes. The obtained results show that: (i) the multiphase characteristics of concrete significantly influence corrosion-induced cracking and rust-expansion displacements; (ii) for the same structural configuration, the rust expansion displacements at the crack initiation and full crack propagation of confined structures are greater than those of unconfined structures; and (iii) due to the influence of interfacial effects, the rust expansion displacement values at the two times predicted by the M1 model are always smaller than those obtained using the M2 model, with differences of up to 50.3%.
Keywords:
Phase-field modeling; Strain orthogonal decompositions; Corrosion-induced damage; Multiphase structures; Confined structures
1. INTRODUCTION
Reinforced concrete (RC) structures are widely used in civil engineering due to their high load-carrying capacity, durability, and economic efficiency. From a material perspective, RC structures represent a complex multi-phase system composed of aggregates, cement paste, voids, and rebars. The mechanical performance and durability of such structures strongly depend on the interaction between these phases and their interfaces. Understanding the coupled mechanical behavior of the different material phases is therefore essential for accurately describing the structural response under various loading and environmental conditions.
In aggressive environments, particularly in coastal or high-humidity regions, RC structures are frequently exposed to chloride ions and carbon dioxide. These aggressive agents gradually destroy the alkaline protective environment surrounding the rebars, thereby initiating corrosion. As corrosion progresses, corrosion products are generated whose volume can be several times larger than that of the original steel. This volumetric expansion induces tensile stresses in the surrounding concrete, leading to cracking and spalling of the concrete cover as well as significant degradation of the bond between rebars and concrete. These deterioration mechanisms ultimately reduce the stiffness, strength, and service life of RC structures [1, 2]. Consequently, understanding the damage mechanisms induced by reinforcement corrosion is essential for improving structural durability and ensuring structural safety.
Extensive experimental investigations have been conducted to study the deterioration of RC structures subjected to reinforcement corrosion. Accelerated corrosion techniques, such as impressed current methods [3, 4], are commonly used in laboratory environments rich in aggressive agents [5, 6], while some studies simulate coastal conditions through controlled temperature and humidity environments [7, 8]. Experimental observations indicate that the expansion of corrosion products generates internal pressure on the concrete cover, which leads to crack initiation and propagation as well as significant bond degradation between rebars and concrete [9, 10]. Tests on corroded RC beams and columns have further demonstrated substantial reductions in flexural, shear, and eccentric compressive capacities compared with non-corroded members [4, 11]. In addition, several studies have examined the influence of key parameters such as corrosion level, concrete cover thickness, concrete quality, and pre-existing cracks on structural deterioration [12, 13], while others have investigated strengthening and protection techniques using composite materials, nanomaterials, fiber-reinforced concrete, or surface coatings [14,15,16,17,18,19].
In parallel with experimental investigations, numerous numerical approaches have been developed to simulate corrosion-induced damage in RC structures. These models aim to capture the coupled physical and mechanical processes involved in chloride penetration, corrosion initiation and propagation, expansion of corrosion products, cracking of the concrete cover, and degradation of the rebar–concrete interface [20, 21]. The finite element method (FEM) has been widely used to analyze the behavior of corroded RC components such as beams, columns, and frames while accounting for the degradation of material properties [22,23,24]. Furthermore, advanced numerical techniques, including the lattice model [25], the Rigid-Body-Spring Method (RBSM) [26, 27], and the Discrete Element Method (DEM) [28, 29], have been applied to simulate crack initiation and propagation induced by uniform or non-uniform corrosion.
Among recent developments in computational fracture mechanics, the phase-field method has emerged as a powerful framework for modeling fracture and damage evolution in brittle materials and structures [30,31,32,33]. This approach is rooted in classical fracture mechanics theory [34, 35] and replaces discrete cracks with a continuous damage variable. However, several challenges remain in phase-field modeling. Previous studies have shown that numerical results may strongly depend on the mesh size and loading increments [36], as well as the regularization length parameter, which is often interpreted as a material parameter [31, 37]. In addition, various degradation functions have been proposed to improve the accuracy of the phase-field formulation [38,39,40]. More recently, anisotropic phase-field method have been developed to capture fracture behavior in anisotropic materials such as honeycomb structures, orthotropic two-phase materials, and polycrystalline solids [41,42,43].
Despite these advances, most numerical models for corrosion-induced damage in RC structures treat concrete as a homogeneous material. In reality, concrete is inherently a multi-phase composite consisting of aggregates, cement paste, and voids, while RC structures additionally include rebars. The geometry, spatial distribution, and mechanical properties of these phases, as well as the characteristics of the interfaces between them, may significantly influence crack initiation and propagation. However, these microstructural effects are rarely incorporated in existing numerical models of corrosion-induced damage.
Another important issue concerns the tension–compression asymmetry of brittle materials. The mechanical response under tensile and compressive loading is typically represented by the positive and negative components of the strain tensor. According to [44], these components should satisfy an orthogonal condition to ensure the preservation of elastic energy. Nevertheless, most existing phase-field modelings [30, 31, 32,33,34,35,36,37,38,39,40,41,42,43] do not satisfy this orthogonality requirement, which may introduce inaccuracies in the prediction of crack evolution.
Furthermore, although several recent studies have applied phase-field modelings to simulate damage in corroded RC structures [45,46,47], these studies generally assume concrete to be a homogeneous brittle material and neglect the influence of the shape and spatial distribution of aggregates and voids. As a result, the influence of the multi-phase microstructure of concrete on corrosion-induced cracking remains insufficiently understood.
To address these limitations, this paper proposes a phase-field-based computational framework for modeling damage evolution in RC structures subjected to corrosion-induced expansion of rebars. Two phase-field modelings are developed in this work: (i) a phase-field modeling considering interfacial damage between different phases while enforcing the orthogonal condition of the strain tensor (denoted by Model M1); (ii) a classical phase-field modeling neglecting interfacial damage but still satisfies the strain tensor orthogonal condition (denoted by Model M2).
The aforementioned phase-field modelings are employed to investigate the influence of the multi-phase microstructure of concrete on the damage evolution of RC structures under different conditions. Several numerical simulations are conducted to: (1) analyze multi-phase structures considering the shape and spatial distribution of aggregates and voids as well as the influence of concrete cover thickness; (2) simulate corrosion-induced damage in RC structures under both confined and unconfined surrounding conditions; (3) examine corrosion experimental structure containing randomly distributed aggregates and complex shape subjected to expansion caused by corrosion of multiple rebars; and (4) compare crack propagation paths and the rust expansion displacement values of corrosion products at crack initiation and when cracks reach the structural boundary.
The remainder of this paper is organized as follows. Section 2 presents the proposed phase-field modelings incorporating the orthogonality condition of the strain tensor. Section 3 provides numerical simulations to investigate crack propagation and corrosion-induced expansion displacement values under different structural configurations. Finally, the main conclusions of this study are summarized in the last section.
2. FUNDAMENTAL CONCEPT OF PHASE-FIELD MODELINGS WITH STRAIN TENSOR ORTHOGONAL DECOMPOSITIONS
2.1. Phase-field modelings for investigating interfacial effects
Consider a domain Ω composed of two brittle constituents, namely an inclusion phase and a matrix phase ∂Ω, where denotes the external boundary of the domain. The interface separating these two phases is denoted by , while Г represents the crack surface within the body. Following the formulation proposed in [48, 49], the phase-field modeling considering interfacial damage introduces two independent phase-field variables. The variable d (x) describes the propagation of cracks in the bulk material, whereas the variable b (x) is used to represent damage and separation along the interface. The parameters ld and lb correspond to the regularization lengths associated with the diffused bulk crack and the interfacial crack, respectively.
In contrast, when the interfacial damage mechanism is neglected in the phase-field modeling, the interfacial variable vanishes (b (x) → 0), and the model reduces to a classical phase-field modeling involving only the bulk crack variable d (x) (see [32]). Consequently, the total energy functional W for a cracked domain Ω consisting of matrix and inclusion phases, while incorporating the effect of interfacial damage, can be written as:
where, denotes the elastic energy density, GF represents the fracture toughness of the bulk phases, and WI is an interfacial energy function that depends on the displacement jump across the interface (see [49]).
-
Model M1: Phase-field modeling considering interfacial damage
Based on the formulation presented in [48, 49], the phase-field modeling considering interfacial damage separates the total strain tensor ε into two components: the bulk strain tensor εP and the strain associated with the interfacial displacement jump εI. This relationship can be written as:
For brittle materials, the bulk strain tensor εP in Equation (2) is further decomposed into tensile and compressive contributions in order to distinguish the mechanical response under tension and compression. Hence, it can be expressed as:
where () and () denote the tensile and compressive components of the elastic energy density function introduced in Equation (1). According to [48, 49], the bulk elastic energy density function is defined as:
in which the degradation function is given by g(d) = (1 - d)2 + k. Here, k ≪ 1 is a small numerical parameter introduced to avoid singularity in the energy functional (see, for instance, References [32, 48, 49]).
In this formulation, the interfacial traction vector is defined as with . The tangential component is taken as tt = 0, while the normal traction component is expressed as , where represents the normal component of the displacement jump, and is the unit normal vector to the interface . The parameter , where tu denotes the interfacial tensile traction (see [48, 49]), where GI represents the interfacial fracture toughness.
-
Model M2: Classical phase-field modeling neglecting interfacial damage
In the phase-field method where the interfacial damage mechanism is neglected, the interfacial phase-field variable tends to vanish (b(x) → 0). As a consequence, Equation (2) is simplified since the strain contribution associated with the interfacial displacement jump disappears, i.e., εI → 0, and the bulk strain becomes εP = ε. Accordingly, Equation (4) reduces to the classical strain decomposition ε = ε+ + ε-.
Based on this decomposition, the elastic energy density expression given in Equation (4) can be separated into two components, W+ (ε+) and W-(ε-), which correspond to the tensile and compressive strain contributions. The resulting elastic energy density function is therefore written as:
For this M2 model, the total energy functional introduced in Equation (1) is reduced to:
which corresponds to the classical phase-field method for brittle fracture neglecting interfacial damage effects.
2.2. Phase-field methods with orthogonal strain tensor decomposition
-
Model M1: Phase-field modeling considering interfacial damage
Following the approaches proposed in [44, 48, 50], the tensile and compressive contributions of the bulk elastic energy and in Equation (4) can be expressed as:
The strain components introduced in Equation (3) satisfy the orthogonal condition requirement described in [44], which is written as:
where ℂ represents the fourth-order elastic stiffness tensor. If the tensor ℂ admits a square-root form ℂ1/2, the orthogonal condition (8) can alternatively be written as . Let the transformed strain space associated with EP be denoted by , defined as . The transformed strain space can be partitioned into two convex subsets where ⊕ denotes the sum of two subsets. Consequently, each strain state can be decomposed into two orthogonal components associated with , namely:
Moreover, the components correspond to the projections of onto the subsets . This projection can be formulated as:
Based on Equation (10), the convex subsets are determined as:
By combining Equations (9)–(11), the strain components can be obtained through the spectral decomposition:
where denote the eigenvalues and eigenvectors of , with the ordering .
Finally, by combining Equations (4), (7), and (12), the Cauchy stress tensor σ can be expressed as:
-
Model M2: Classical phase-field modeling neglecting interfacial damage
According to the formulations reported in [32, 44, 45], the tensile and compressive contributions of the elastic energy density function W+ (ε+) and W - (ε-) in Equation (8) for this model are expressed as:
These expressions hold provided that the strain tensors ε+ and ε- satisfy the orthogonality condition introduced in [32, 45], namely:
Following the same reasoning as previously discussed, Equation (15) can also be written in the equivalent form (ℂ1/2:ε+) ⋅ (ℂ1/2:ε-) = 0. Let denote the transformed strain space associated with the strain tensor space E, defined as = = ℂ1/2:ε, ε ∈ E}, The space can be decomposed into two convex subsets and , representing the positive and negative parts of the strain space, respectively, such that = ⊕ . Consequently, each transformed strain tensor ∈ can be written as the sum of two orthogonal components:
where these components correspond to projections onto the convex subsets and . The projection can be defined through the minimization problem:
The subsets and are therefore characterized as:
By combining Equations (16)–(18), the strain components and can be obtained through the spectral decomposition:
where and represent the eigenvalues and eigenvectors of the tensor , with the ordering .
Finally, combining Equations (5), (14), and (19), the Cauchy stress tensor σ is obtained as:
2.3. Phase-field and displacement governing equations
-
Model M1: Phase-field modeling considering interfacial damage
Following the formulations proposed in [48, 50], the governing equations used to determine the phase-field variable d (x) and the displacement vector u (x) in a domain are given by the coupled systems (21) and (22), valid for all x ∈ Ω:
and
In these equations, n denotes the outward unit normal vector to the boundary ∂Ω. The vector represents the prescribed traction applied on the force boundary ∂ΩF, while fbo corresponds to the body force acting within the domain Ω. The displacement boundary condition is specified by on ∂Ωu. In Equation (21), the functional derivative of the crack surface density function γ with respect to the phase-field variable d, denoted , is introduced to describe the crack evolution.
Furthermore, according to [48, 50] and Equation (7), the strain history variable is defined as:
which ensures the irreversibility of the fracture process.
-
Model M2: Classical phase-field modeling neglecting interfacial damage
Based on the formulation presented in [45, 46], the phase-field variable d (x) and the displacement vector u (x), defined for all x ∈ Ω, are obtained by solving the coupled governing equations (24) and (25) through a staggered solution strategy. The governing equation for the phase-field variable is written as:
The mechanical equilibrium equation associated with the displacement field takes the following form:
According to References [45, 46] and Equation (14), the strain history variable is defined as:
which guarantees the irreversibility condition in the fracture evolution process.
3. NUMERICAL EXAMPLES
3.1. Validation of the phase-field modeling considering interfacial damage with reference results
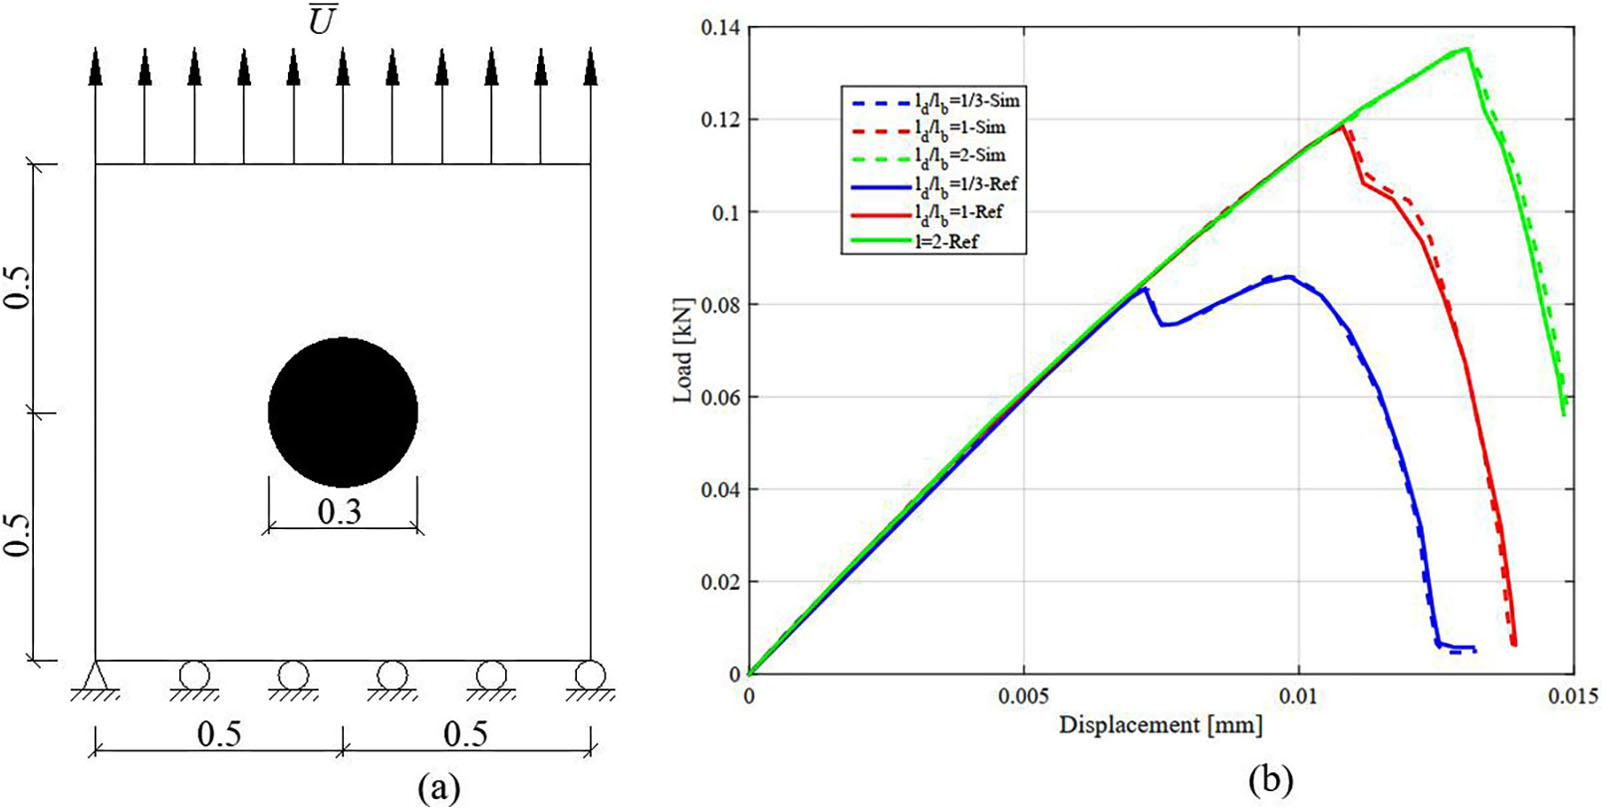
This example study is designed to analyze the initiation and propagation of damage in a composite structure containing a single inclusion phase embedded in a matrix phase, with varying ratios of the length parameters ld/lb. The phase-field method of M1 model is employed to describe the interaction between interfacial damage and bulk damage within the constituent phases. The structure has dimensions of 1 × 1 mm and contains a circular inclusion with a diameter of 0.3 mm (see Figure 1a and Reference [49]). The material properties used in the simulation follow those reported in [49]. The Young’s modulus and Poisson’s ratio of the inclusion phase are Ei = 52 GPa and vi = 0.3, respectively. For the matrix phase, the corresponding values are Ei = 52 GPa and vm= 0.3, with a tensile traction of tu = 0.01 GPa. The fracture toughnesses of the two phases and the interface are assumed to be identical, with GI = GF = 0.1 N/mm. Plane strain conditions are adopted.

(a) Geometry and boundary conditions of the structure; (b) Comparison of the load–displacement response curves between the present M1 model and those reported in [49] for different values of the ratio ld/lb.
At the bottom-left node, both the horizontal and vertical displacements are constrained. The remaining nodes along the bottom edge are restricted only in the vertical direction while remaining free in the horizontal direction. A monotonically increasing vertical displacement is applied at the top boundary of the plate with an increment of Du = 0.00005 mm until complete structural failure occurs. The structure is discretized using a uniform mesh of 200 × 200 quadrilateral elements, and the length parameter is selected as ld = 0.013 mm, consistent with [49].
Figure 2 compares the crack paths obtained for different ratios ld/lb at a displacement value of U = 0.0107 mm between the present M1 model and the reference results reported in [49], corresponding to ld/lb = 1/3, ld/lb = 1, and ld/lb = 2. The results demonstrate the strong influence of interfacial damage on the overall fracture behavior of the structure. From Figure 2, it can be observed that the crack paths predicted by the two approaches of M1 model and reference model are in good agreement for this considered case.

Comparison of crack propagation for different ratios ld/lb at a displacement ofU = 0.0107 mm. Results obtained from the present M1 model: (a) ld/lb = 1/3; (b) ld/lb = 1; (c) ld/lb = 2; and from the reference method [49]: (d) ld/lb = 1/3; (e) ld/lb = 1; (f) ld/lb = 1/2.
The comparisons of the force–displacement responses are presented in Figure 1b. For each ratio ld/lb, a distinct response curve is obtained, reflecting the interaction between interfacial damage and bulk damage within the phases. From Figures 2 and 1b, it is evident that the ratio ld/lb significantly affects both the mechanical response curves and the crack paths of the structure. In other words, as the ratio ld/lb increases, crack propagation becomes slower and the structural response curve becomes larger. The curves corresponding to the two methods are quite similar, highlighting the potential of the proposed M1 model introduced in Section 2. In the following examples, to simplify the simulation procedure when using the M1 model, we assume l = ld = lb.
3.2. Validation of the phase-field modeling neglecting interfacial damage with reference results
To validate the accuracy of the proposed simulation, this section compares the present numerical results obtained using the M2 model with the benchmark example reported in Reference [51]. The SFRC structure has dimensions of 100 × 100 mm and contains an initial notch of length Ln = 10 mm, together with a vertical steel fiber of length 30 mm (see Figure 3a). The material properties of the steel fiber are as follows: Young’s modulus Es = 210 GPa, Poisson’s ratio vs = 0.3, and fracture toughness = 0.01 kN/mm. The material parameters of the concrete matrix are: Young’s modulus Ec = 39.9 GPa, Poisson’s ratio νc = 0.19, and fracture toughness = 0.00005 kN/mm.

Comparison of crack paths between the present M2 model and the reference method: (a) geometry and boundary conditions of the structure; crack paths obtained from the present M2 model for (b) l = 0.25 mm, (c) l = 0.75 mm, (d) l = 1 mm, and (e) l = 1.25 mm; and the reference result [51] for (f) l = 1 mm.
The interfacial material parameters between the steel fiber and the concrete are defined as GI = = 0.00005 kN/mm, with a tensile strength tu = 0.01 GPa. The structure is discretized using uniform square elements with a mesh size of h = 0.5 mm. Regarding the boundary conditions, at the bottom edge the left corner node is constrained in both directions, while the remaining nodes are restrained only in the vertical direction. On the top edge, a constant displacement increment of Du = 10-4 mm is applied at each loading step throughout the simulation (see Reference [51]).
This example aims to compare the crack paths and the stress–strain response curves obtained by the present M2 model with those reported in Reference [51]. In this example, the steel fiber is located at the coordinates (X,Y) = (20, 50) mm, as illustrated in Figure 3a. In the M2 model, there is only one length parameter ld, therefore, the notation l = ld is adopted.
During the simulation, the length parameter is varied as l = 0.25 mm, 0.75 mm, 1 mm, and 1.25 mm. Figures 3(b–f) illustrate the crack paths obtained using the present M2 model corresponding to these values of the length parameter. Figures 3d and 3f compare the crack paths predicted by the two approaches for the case l = 1 mm reported in Reference [51]. It can be observed that the crack initiation and propagation paths are very similar for both methods.
Figure 4 compares the stress–strain response curves obtained from the two approaches for different values of the length parameter l. The results show that the corresponding response curves are in very good agreement.

Comparison of the response curves between the present M2 model and the reference method [51] for different values of the length parameter l.
The results obtained from Examples 3.1 and 3.2 demonstrate the reliability of the phase-field modelings of M1 and M2 models described in Section 2. Therefore, the subsequent examples continue to employ the M1 and M2 models to simulate more complex structural configurations under both unconfined and confined conditions, considering uniform corrosion of the rebars. These simulations enable a comparison of the influence of structural confinement surrounding the structure, as well as an assessment of the influence of interfacial damage between the inclusion phase and the matrix phase on crack initiation and propagation, together with the overall expansion displacement induced by rebar corrosion.
3.3. Damage analysis of unconfined and confined structures using the M1 and M2 models
Figure 5a illustrates an unconfined structure containing a void, an inclusion phase, a matrix phase, and the interface between the inclusion and matrix. To investigate the effect of structural confinement, a Carbon–epoxy layer is bonded around the outer boundary of the structure, as shown in Figure 5b. This configuration enables a direct comparison between the damage paths of the confined and unconfined systems.

Illustration of uniform corrosion of rebar in a multiphase structure with interfaces: (a) unconfined structure; (b) structure confined by an external boundary (green). Mesh discretization and phase identification for (c) the unconfined structure and (d) the confined structure: matrix phase (green), inclusion phase (yellow), voids (white), interfaces (red), and rebar (blue), Carbon-epoxy layer (black).
Both configurations contain a rebar with an initial diameter D = 20 mm. After corrosion, the diameter of the rebar is denoted by Dc, while dc represents the material loss due to corrosion. The corrosion process induces a free radial expansion displacement u around the rebar, and c denotes the thickness of the concrete cover. The method for determining the rust expansion displacement u, as shown in Figures 5a–b, has been presented in works such as [52,53,54], and is described in detail in Reference [55]. In [55], it is shown that the volume of corrosion products exceeds the original volume of rebar ranging from 2.2 to 6.4 times. This results in a corrosion-induced displacement u. The determination of the expansion value u is carried out based on the obtained values of Dc, and dc, as well as the type of corrosion products formed (see Reference [55]).
All structures considered in this study have a square geometry with dimensions of 100 × 100 mm. The boundary conditions are defined such that the bottom-left corner is fully fixed in both directions, while the bottom-right corner is constrained only in the vertical direction and remains free in the both directions.
For the numerical simulations, the structures shown in Figures 5a–b are discretized using a uniform mesh of 200 × 200 quadrilateral elements, as illustrated in Figures 5c–d. The inclusion phase, matrix phase, void, and the interface are represented by yellow, green, white, and red regions, respectively. The rebar and the Carbon–epoxy layer are indicated by blue and black regions.
The material properties of the inclusion and matrix phases are identical to those used in Example 3.1 and Reference [49]. The void is assigned extremely weak material properties so that it does not influence the mechanical response, with Ep = 10-6 GPa and vp = 0.3. The fracture toughness of the bulk phases and the interface is assumed to be identical, GI = GF = 0.1 N/mm, and the tensile traction is taken as tu = 0.01 GPa. The length parameter is chosen as l = 1 mm, which is larger than twice the mesh size, satisfying the length requirement suggested in Reference [56]. During the simulation, the corrosion-induced expansion around the rebar is applied incrementally with a constant displacement step of Δu = 10-5 mm.
The orthotropic material properties of the Carbon–epoxy layer are adopted from Reference [57], with E1 = 150 GPa, E2 = 11 GPa, G12 = 6 GPa, and Poisson ratios v12 = v13 = 0.25. The remaining Poisson ratios are determined as and v23 = 0.25. The fracture toughness of the Carbon–epoxy material is taken as GFCE = 0.352 N/mm.
The objective of these examples is to employ the two phase-field modelings, M1 and M2, under the assumption of uniform corrosion in order to investigate the initiation and propagation of cracks, as well as the displacement induced by corrosion expansion at the onset of cracking (time t1) and when the crack propagates to the boundary of the structure (time t2). Different phase distributions of inclusions and voids are considered, as illustrated in Figure 6.

Structures containing a D20 rebar (black) and inclusions or voids (diagonal dashed lines): (a) Type 1, c = 40 mm (T1–C40); (b) Type 1, c = 20 mm (T1–C20); (c) Type 2, c = 40 mm (T2–C40); (d) Type 2, c = 20 mm (T2–C20); (e) Type 3, c = 40 mm (T3–C40); (f) Type 3, c = 20 mm (T3–C20); (g) Type 4, c = 40 mm (T4A–C40 or T4B–C40); (h) Type 4, c = 20 mm (T4A–C20 or T4B–C20).
Furthermore, in practical structures, the bonding between the inclusion phase and the matrix phase may be considered either perfectly bonded or bonded while accounting for interfacial damage. Correspondingly, the present study employs the M1 model to represent the case where interfacial damage is considered, while the M2 model represents the case of perfect bonding between the inclusion and matrix phases, i.e., neglecting interfacial damage.
In the investigated configurations, structures with the rebar located at the center have a concrete cover thickness of c = 40 mm (denoted as C40), whereas structures with the rebar located at other positions have a concrete cover thickness of c = 20 mm (denoted as C20). It should be noted that all structural configurations described above are analyzed for both the unconfined case and the confined case with an external Carbon–epoxy layer, as introduced in Figures 5a–b. The notation of the considered structural configurations is summarized in Figure 6 and Table 1.
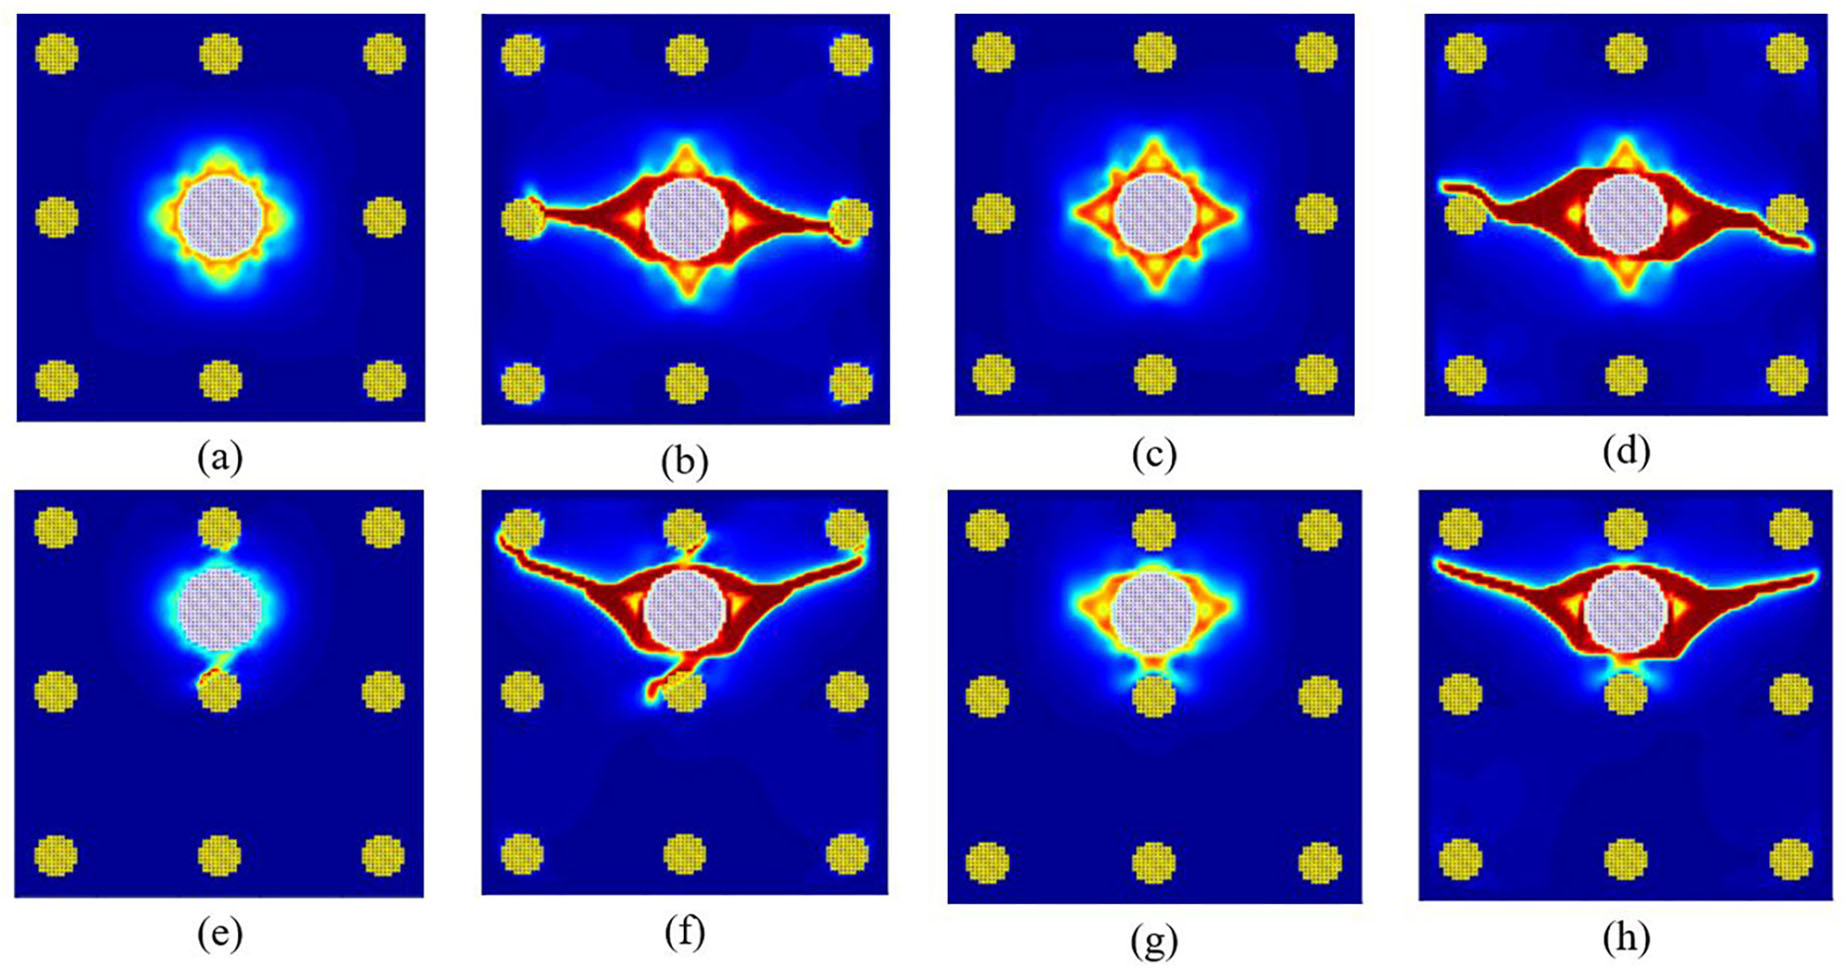
Figures 7a–b illustrate the crack initiation and propagation in the structure T1-C40-CI, while Figures 7c–d present the crack paths for the structure T1-C40-NI. For both configurations, cracks tend to initiate around the rebar and propagate horizontally toward the two lateral boundaries of the structure. Figures 7e–f show the crack paths of the structure T1-C20-CI, whereas Figures 7g–h correspond to the structure T1-C20-NI. In these latter cases, where the concrete cover thickness is c = 20 mm, the cracks predominantly propagate vertically toward the top boundary of the structure.

Comparison of crack initiation and propagation in unconfined structures: (a–b) T1–C40–CI; (c–d) T1–C40–NI; (e–f) T1–C20–CI; (g–h) T1–C20–NI.
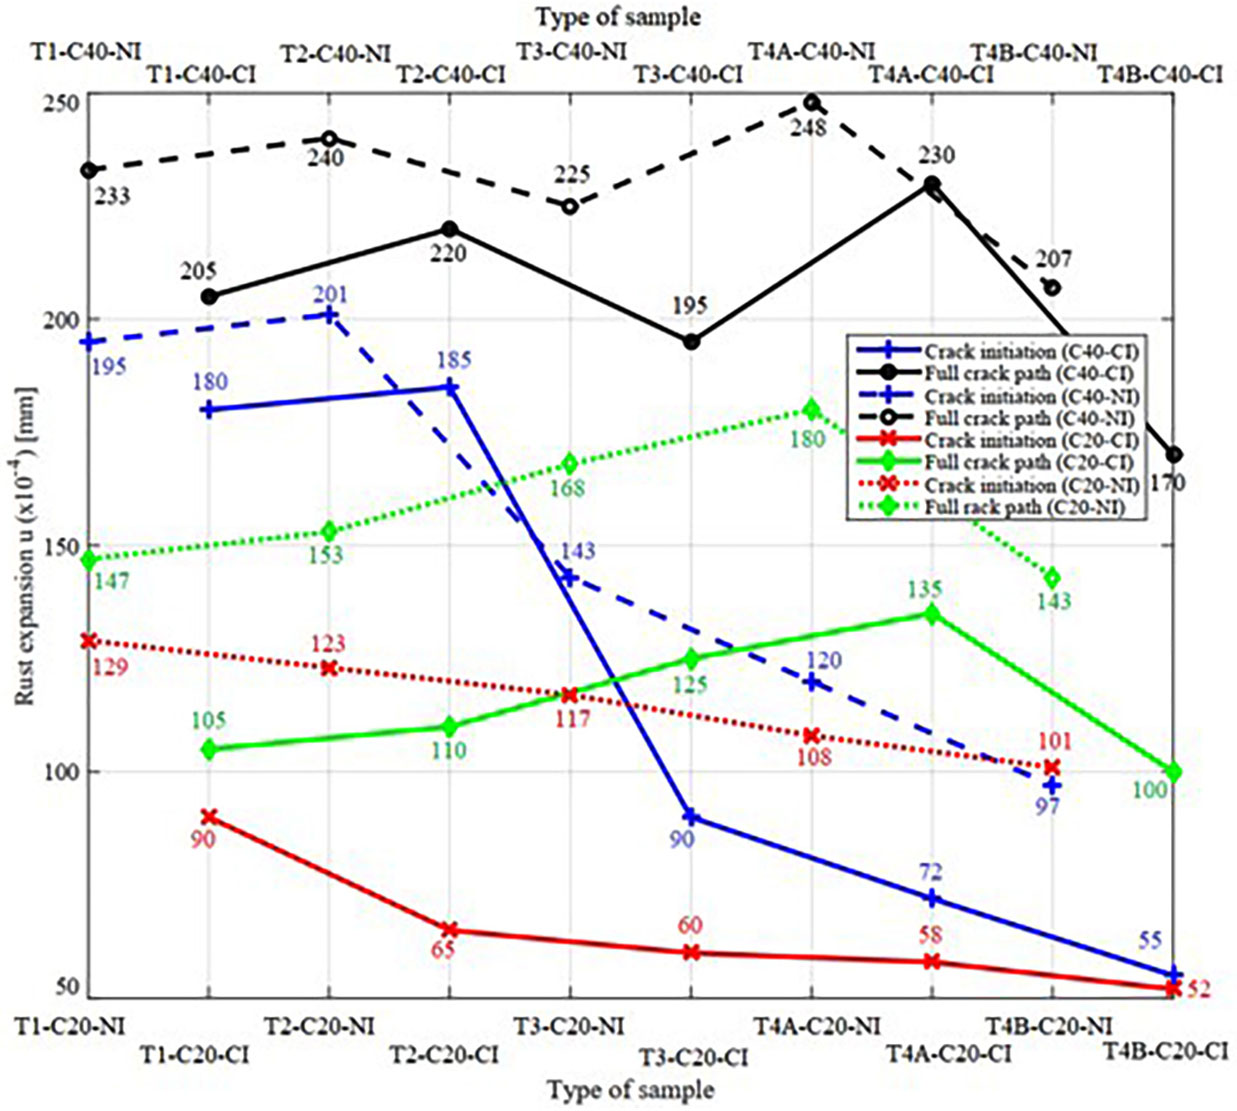
Although similar crack propagation trends are observed for both the M1 and M2 models, noticeable differences arise when cracks interact with the inclusion phase. In the M1 model, cracks tend to propagate through regions of stress concentration near the inclusion phase (e.g., near the inclusion in Figures 7c–d and 7g–h) rather than strictly following the interface, as predicted by the M2 model (see Figures 7a–b and 7e–f). As a result, the corrosion-induced expansion displacements corresponding to the crack initiation time t1 and the time when the crack reaches the structural boundary t2 are larger for the M1 model than for the M2 model (see Figure 8).

Comparison of the displacements induced by rebar corrosion expansion at two time instants, t1 and t2, in unconfined structures.
For the confined structures, the crack paths for the different configurations are presented in Figure 9. It can be observed that the crack paths of the structures T1-C40-CI-C and T1-C40-NI-C (Figures 9a–b and 9c–d, respectively) exhibit horizontal crack propagation similar to those observed in the unconfined cases shown in Figures 7a–d. However, when the concrete cover thickness is reduced to c = 20 mm, noticeable differences appear between the confined structures (see Figures 9e–h) and the unconfined structures (see Figures 7e–h).

Comparison of crack initiation and propagation in confined structures: (a–b) T1-C40-CI-C; (c–d) T1-C40-NI-C; (e–f) T1-C20-CI-C; (g–h) T1-C20-NI-C.
For the structures T1-C20-CI-C and T1-C20-NI-C, the primary crack propagates diagonally toward the corners of the structure, as illustrated in Figures 9f and 9h. In structure T1-C20-CI-C, secondary cracks propagate vertically upward and downward along the phase interface (Figure 9f). In contrast, for the structure T1-C20-NI-C (Figure 9h), the secondary crack is blocked by the inclusion phase located below the rebar. These observations clearly highlight the influence of the Carbon–epoxy confinement layer and the role of the phase interface in governing the damage evolution of the structure.
As shown in Figure 8, the rust expansion displacement at the two times t1 and t2 for structures that account for interfacial effects is smaller than those of structures without the interfacial effects for both C20 and C40 configurations. This observation can be explained by the bonding conditions between the inclusion phase and the matrix. When perfect bonding is assumed, cracks interacting with the inclusion phase tend to propagate through the matrix in regions of stress concentration near the inclusion, since the matrix phase possesses lower mechanical properties than the inclusion phase. In contrast, when interfacial damage is considered, the bonding between the inclusion and matrix is no longer perfect. In this case, cracks may propagate along the interface due to the interaction between interfacial damage and the weaker matrix phase, leading to crack paths that follow the interface once the inclusion is encountered.
Moreover, for the same inclusion distribution, the corrosion-induced expansion displacements corresponding to t1 and t2 are significantly smaller for the C20 configuration than for C40. This behavior can be attributed to the smaller concrete cover thickness, which facilitates earlier crack initiation and faster crack propagation due to the reduced confinement capacity of the thinner cover layer.
Figure 10 shows that the total corrosion-induced expansion displacements at t1 and t2 for the confined structures T1-C40-CI-C and T1-C20-CI-C are smaller than those of T1-C40-NI-C and T1-C20-NI-C, respectively. Similarly, the expansion displacements at t1 and t2 for T1-C20-CI-C and T1-C20-NI-C are smaller than those of T1-C40-NI-C and T1-C40-NI-C, respectively. These results further highlight the influence of interfacial damage and the concrete cover thickness on the corrosion-induced damage evolution.

Comparison of the displacements induced by rebar corrosion expansion at two time instants, t1 and t2, in confined structures.
Figures 11a–b present the crack paths of the structure T2-C40-CI, while Figures 11c–d show those of T2-C40-NI. For both structures, cracks tend to propagate diagonally toward the two corners of the structure. In the structure T2-C40-NI, the inclusion phase blocks the crack path, forcing crack propagation to occur only within the matrix without nucleating interfacial cracks. Consequently, the resulting crack path is shorter than that observed in the structure T2-C40-CI (see Figures 11b and 11d).

Comparison of crack initiation and propagation in unconfined structures: (a–b) T2-C40-CI; (c–d) T2-C40-NI; (e–f) T2-C20-CI; (g–h) T2-C20-NI.
Figures 11e–f illustrate the crack paths for the structure T2-C20-CI, whereas Figures 11g–h correspond to the structure T2-C20-NI. Unlike the previous configurations, the primary crack in these cases still initiates from the rebar and propagates toward the nearest boundary due to the reduced concrete cover thickness (c = 20 mm). For the structure T2-C20-CI, secondary cracks propagate horizontally, whereas in the structure T2-C20-NI the secondary cracks are blocked by the inclusion phase located above and below the rebar.
Figure 12 illustrates the crack initiation and propagation paths of the confined structures belonging to configurations T2. For the structures T2-C40-CI-C (Figures 12a–b) and T2-C40-NI-C (Figures 12c–d), the primary crack propagation directions are similar to those observed in the corresponding unconfined structures T2-C40-CI (Figures 11a–b) and T2-C40-NI (Figures 11c–d).

Comparison of crack initiation and propagation in confined structures: (a–b) T2-C40-CI-C; (c–d) T2-C40-NI-C; (e–f) T2-C20-CI-C; (g–h) T2-C20-NI-C.
For the confined structure T2-C20-NI-C shown in Figures 12g–h, the crack propagation path is also similar to that observed in the unconfined structure T2-C20-NI (Figures 11g–h), where the primary crack propagates through the matrix phase toward the nearest corner of the structure. However, the crack path of the confined structure T2-C20-CI-C (Figures 12e–f) differs from that of the structure T1-C20-CI-C shown in Figures 9e–f. In this case, in addition to the confinement effect, the crack propagation is also influenced by interfacial damage between neighboring inclusion phases.
From Figure 8, when considering the corrosion-induced expansion displacement for configurations T2, trends similar to those previously discussed are observed at the characteristic times t1 and t2. Specifically, the expansion displacement corresponding to structures accounting for interfacial damage is smaller than that of structures neglecting interfacial damage, while the displacement values for configurations C20 are smaller than those for C40.
A similar tendency can be observed for the confined structures shown in Figure 10. The expansion displacements at times t1 and t2 for structures considering interfacial damage remain smaller than those obtained without accounting for interfacial effects. Moreover, the displacement values for configurations C20 are smaller than those for C40 due to the combined influence of interfacial damage, concrete cover thickness, and the confinement provided by the external layer.
Finally, based on Figures 8 and 10, it can be observed that the expansion displacement at time t2 for both confined and unconfined structures of configurations T2 is larger than those of configuration T1, respectively. This behavior is attributed to the higher number of inclusion phases in configurations T2, which increases the overall stiffness of the structure compared to configurations T1. In contrast, the expansion displacement at time t1 for both confined and unconfined configurations T2 is smaller than that of configurations T1 due to the local influence of inclusion phases located near the corroding rebar. These observations also highlight that, when comparing configurations T1 and T2 with and without confinement, the number and distribution of inclusion phases significantly affect the corrosion-induced expansion displacement at time t2, corresponding to the stage when cracks propagate to the structural boundary.
Figures 13a–b present the crack paths of the structure T3-C40-CI, whereas Figures 13c–d show those of T3-C40-NI. Similarly, Figures 13e–f illustrate the crack paths for the structure T3-C20-CI, while Figures 13g–h correspond to T3-C20-NI. For these configurations, noticeable differences in crack propagation are observed between structures considering interfacial damage and structures neglecting interfacial damage. Specifically, in structures considering interfacial damage, such as T3-C40-CI and T3-C20-CI, crack branching occurs more frequently because cracks can easily propagate along the phase interfaces when encountering inclusion particles (see Figures 13b and 13f). In contrast, for structures neglecting interfacial damage, namely T3-C40-NI and T3-C20-NI, only the primary crack propagates along its initial direction, while secondary cracks are arrested by the inclusion particles (see Figures 13d and 13h).
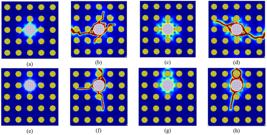
Comparison of crack initiation and propagation in unconfined structures: (a–b) T3-C40-CI; (c–d) T3-C40-NI; (e–f) T3-C20-CI; (g–h) T3-C20-NI.
Figure 14 illustrates the crack propagation paths of the confined structures corresponding to configurations T3. For the structure T3-C40-CI-C shown in Figures 14a–b, the crack propagation directions are similar to those observed in the structure T3-C40-NI-C (Figures 14c–d). However, for the structure T3-C20-CI-C (Figures 14e–f), the primary crack propagates vertically toward the nearest boundary, consistent with the behavior observed in confined structures of configurations T1 and T2 that consider interfacial damage (see Figures 9f and 12f). In contrast, for the unconfined structures of configurations T1, T2, and T3, the primary crack also tends to propagate vertically toward the structural boundary (see Figures 7f, 11f, and 13f). For the structure T3-C20-NI-C (Figures 14g–h), the crack path tends to propagate toward the nearest corner of the structure, similar to the behavior observed in T1-C20-NI-C (Figures 9g–h) and T2-C20-NI-C (Figures 12g–h).

Comparison of crack initiation and propagation in confined structures: (a–b) T3-C40-CI-C; (c–d) T3-C40-NI-C; (e–f) T3-C20-CI-C; (g–h) T3-C20-NI-C.
Figure 8 shows that for the unconfined structures of configurations T3, the trend of corrosion-induced expansion displacement at the characteristic times t1 and t2 is similar to those observed in configurations T1 and T2 for structures containing inclusion phases. However, it can also be observed that the displacement difference between t1 and t2 for the structures T3-C40 is larger than that of the corresponding structures T2-C40 and T1-C40, regardless of whether interfacial effects are considered. This indicates that the expansion displacement at the crack initiation stage t1 for structures T3-C40 is relatively small. Such behavior suggests that when inclusion phases are located close to the rebar, the structural system tends to initiate cracking earlier during the corrosion-induced expansion process.
From Figures 8 and 10, it can be observed that for the confined structures of configurations T3, the corrosion-induced expansion displacement at time t1 is quite similar to that of the corresponding unconfined structures. However, the displacement at time t2 for the confined structures is larger than that of the unconfined ones, which is consistent with the trends previously observed for configurations T1 and T2.
The study then examines the damage behavior of structures composed entirely of inclusion phases with particles of different diameters, namely D10 and D7 (these structures are classified as type T4A). Figures 15a–b and 15e–f illustrate the crack paths of the unconfined structures considering interfacial damage, while Figures 15c–d and 15g–h correspond to the unconfined structures neglecting interfacial damage. Similarly, Figures 16a–b and 16e–f present the crack paths of the confined structures considering interfacial damage, whereas Figures 16c–d and 16g–h correspond to the confined structures neglecting interfacial damage.

Comparison of crack initiation and propagation in unconfined structures: (a–b) T4A-C40-CI; (c–d) T4A-C40-NI; (e–f) T4A-C20-CI; (g–h) T4A-C20-NI.

Comparison of crack initiation and propagation in confined structures: (a–b) T4A-C40-CI-C; (c–d) T4A-C40-NI-C; (e–f) T4A-C20-CI-C; (g–h) T4A-C20-NI-C.
From Figures 15 and 16, it can be seen that for the structures T4A-C40, both confined and unconfined, the primary crack propagation paths are quite similar regardless of whether interfacial damage is considered (see Figures 15b, 15d, 16b, and 16d). In particular, cracks initiate from the rebar and propagate diagonally toward the two corners of the structure. However, due to the influence of interfacial damage, additional secondary cracks appear in the structures considering interfacial effects (see Figures 15b and 16b).
A similar analysis can be made for the structures T4A-C20 based on Figures 15 and 16. For the unconfined structures, cracks tend to propagate vertically toward the nearest boundary (see Figures 15f and 15h). In contrast, for the confined structures, the cracks tend to deviate from the vertical direction and propagate diagonally toward the corners of the structure (see Figures 16f and 16h). This behavior is also reflected in the displacement responses shown in Figures 8 and 10. Specifically, the displacement values at time t2 for the corresponding unconfined structures are smaller than those of the confined structures.
Structures containing inclusion particles of diameter D10 and voids of diameter D7 (classified as type T4B) are further investigated. Figures 17a–b and 17e–f present the crack paths for the unconfined structures considering interfacial damage, whereas Figures 17c–d and 17g–h correspond to the unconfined structures neglecting interfacial damage. Similarly, Figures 18a–b and 18e–f show the crack paths of the confined structures considering interfacial damage, while Figures 18c–d and 18g–h illustrate the corresponding confined structures in which interfacial damage is neglected.
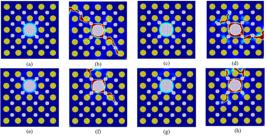
Comparison of crack initiation and propagation in unconfined structures: (a–b) T4B-C40-CI; (c–d) T4B-C40-NI; (e–f) T4B-C20-CI; (g–h) T4B-C20-NI.
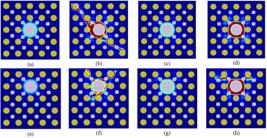
Comparison of crack initiation and propagation in confined structures: (a–b) T4B-C40-CI-C; (c–d) T4B-C40-NI-C; (e–f) T4B-C20-CI-C; (g–h) T4B-C20-NI-C.
From Figures 17 and 18, it can be observed that for the structures T4B-C40, both confined and unconfined and considering interfacial damage, the crack propagation paths are relatively similar. Specifically, cracks initiate from the corroding rebar and subsequently propagate diagonally toward the corners of the structure. When encountering an inclusion phase, the crack tends to propagate along the interface, whereas when encountering a void, it penetrates through the void and continues to propagate and branch within the matrix phase (see Figures 17b and 18b).
For the structures T4B-C20 considering interfacial damage, cracks do not propagate directly toward the nearest boundary, instead, they preferentially propagate toward the region containing voids where the structural stiffness is lower (see Figure 17f and Figure 18f).
For the configurations T4B neglecting interfacial damage, cracks initiate from the corroding rebar and propagate within the matrix phase. When encountering a void, cracks pass through the void, whereas when encountering an inclusion phase, the crack path deviates and propagates within the matrix region adjacent to the inclusion phase, resulting in a more complex crack trajectory (see Figures 17d and 17h).
Besides, for the confined configurations T4B neglecting interfacial damage, cracks may only form locally around the corroding reinforcement and do not propagate toward the structural boundary. This behavior can be explained by the relatively higher stiffness of the matrix phase compared with that of the interface, combined with the presence of distributed voids within the structure. Consequently, the available fracture energy is insufficient for cracks to propagate to the structural boundary, leading instead to localized damage around the corroding reinforcement, particularly in structures with a thicker concrete cover.
The above analyses are clearly reflected in the comparison of corrosion-induced expansion displacements presented in Figures 8 and 10. In general, for all configurations T4A and T4B, the following observations can be drawn: (i) the expansion displacements at times t1 and t2 for confined structures are larger than those of the corresponding unconfined structures; (ii) the displacement values at t1 and t2 for structures composed entirely of inclusion phases are larger than those for structures containing both inclusions and voids; (iii) structures with a larger concrete cover thickness exhibit greater displacement values at t1 and t2 than those with a smaller cover thickness; (iv) structures neglecting interfacial damage exhibit greater displacement values at t1 and t2 than structures considering interfacial damage; and (v) for confined structures containing both inclusions and voids while neglecting interfacial damage, crack propagation toward the structural boundary becomes significantly more difficult.
3.4. Comparison with experimental RC structures containing randomly distributed inclusions with complex shapes
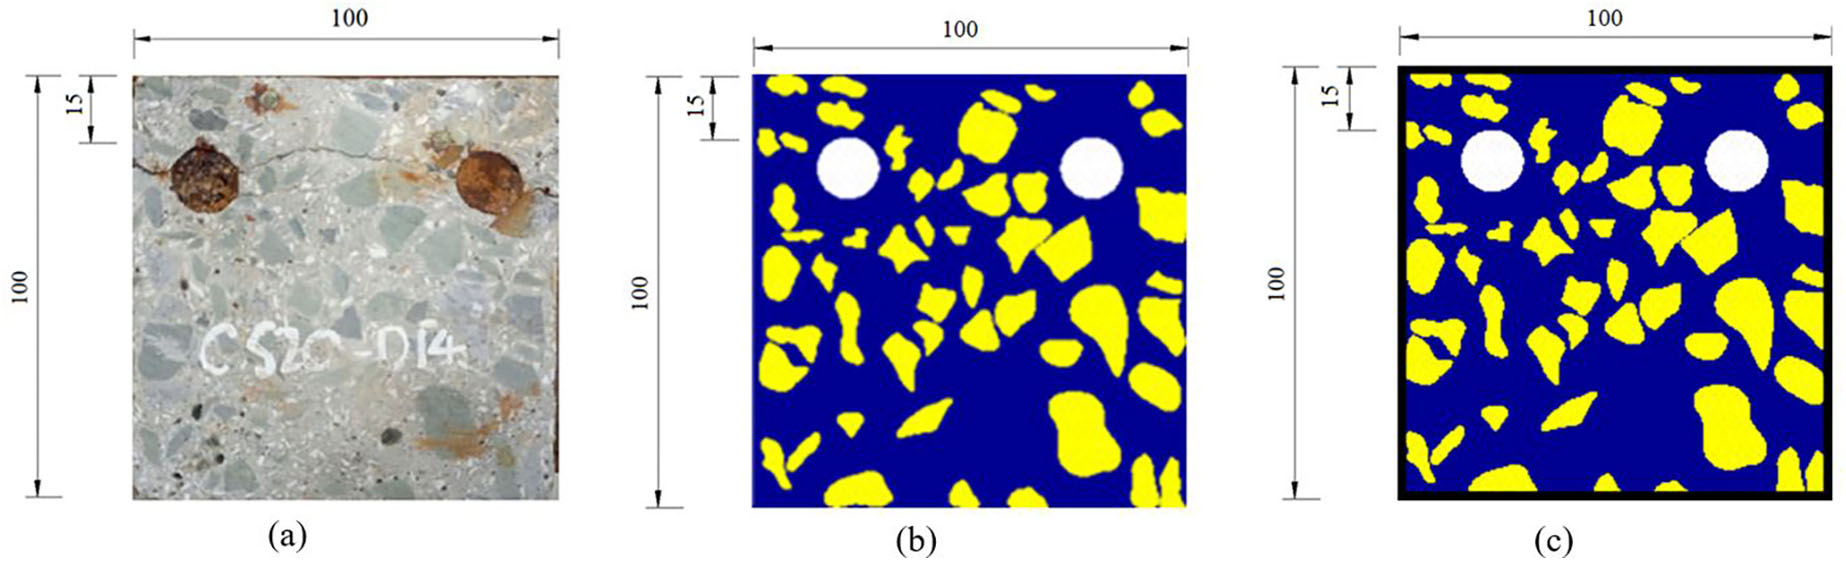
This example aims to extend the M1 and M2 models to simulate and compare results for RC structures containing inclusions with complex shapes and random spatial distributions. The structure has dimensions of 100 × 100 mm and consists of aggregate particles embedded in a cement mortar matrix, extracted from the RC structure used in the corrosion experiment reported in Reference [45]. The structure contains two rebars with a diameter of 14 mm (D14) and a concrete cover thickness of c = 15 mm, as illustrated in Figure 19a.

Experimental structure containing inclusion phases with random shapes and distributions: (a) unconfined structure in experimental study [45]; (b) unconfined structure after inclusion shape recognition from (a); (c) confined structure after inclusion shape recognition from (a).
Before performing the simulation, a preprocessing step was carried out to identify the aggregate-phase geometry consistent with the actual structure (see Figures 19b–c). This step is particularly important because the interfacial geometry has a significant influence on both the crack propagation paths and the corrosion-induced expansion displacements at the two times of t1 and t2.
After inclusion shape recognition process the structure from the experimental image in Figure 19a, the domain is discretized into a mesh of 200 × 200 uniform square elements with mesh size of h = 0.5 mm for both the unconfined and confined structures, as shown in Figure 19b and Figure 19c, respectively. In these figures, the inclusion phase is shown in yellow, the matrix phase in blue, the rebars in white, and the Carbon–epoxy layer in black. The material properties of the Carbon–epoxy layer are adopted similarly to those used in Example 3.3.
The material parameters are adopted from Reference [45]. The work [45] investigated concrete incorporating crushed clam shells as a 20% replacement for natural sand (CS20). In this mixture, the aggregate phase possesses a compressive strength of = 120 MPa. According to Vietnamese highway bridge design specification TCVN 11823:2017 [58], the Young’s modulus of the aggregates is calculated as . The Poisson’s ratio of the aggregates is assumed to be the same as that of the corresponding concrete mixture, i.e., νi = 0.195. After testing, the cement mortar matrix is determined by the following material parameters: Em = 25 MPa and vm = vi = 0.195. The fracture toughness of the material phases and the interface is taken from Reference [45] as GF = GI = 0.049 N/mm. The tensile traction tu is selected according to Example 3.1, with tu = 0.01 GPa. The length parameter is also taken from Reference [45] as l = 3.7 mm.
In Reference [45], the accelerated corrosion experiment was conducted by immersing the RC structure in a 3% NaCl solution and applying an electric current density of 300 μA/cm2. Consequently, the bond strength between the coarse aggregate and the cement mortar was no longer intact compared with the original unimmersed RC structure. This implies that the bond strength between the cement mortar and the coarse aggregate should be represented by interfacial parameters (corresponding to the M1 model, with interfacial parameters of GI = 0.049 N/mm and tu = 0.01 GPa, as described above), rather than assuming a perfect bond between the cement mortar and the coarse aggregate (corresponding to the M2 model). Therefore, the comparison between the experimental results reported in [45] and the M1 model was carried out in terms of both crack paths and rust expansion displacements at the two times, t1 and t2.
It should be noted that the analysis of crack initiation and propagation in the M1 model, considering the interaction between interfacial crack and bulk crack, was compared with the experimental observations reported in [45] (see Figure 20a). The comparison of displacement values at t1 and t2 between the experimental results [45] and the M1 model is also presented on the right side of Figure 21. From Figure 20a, it can be observed that the overall crack paths, as well as the localized cracks at the interfaces and within the cement mortar matrix, obtained from the experiment [45] and the M1 model are in very good agreement. Furthermore, Figure 21 (right side) shows that the rust expansion displacements at t1 and t2 predicted by the M1 model fall within the range of the experimental results. These findings provide confidence for further simulations of the remaining cases under confined conditions (for both the M1 and M2 models) and unconfined conditions (for the M2 model), for which experimental investigations are planned in future studies.

Comparison of crack initiation and propagation in unconfined structures: (a) comparison of interfacial damage and bulk damage between the experimental study [45] and the M1 model; (b–c) structure neglecting interfacial damage (the M2 model).

Comparison of the displacements induced by rebar corrosion expansion at two time instants, t1 and t2: the left side corresponds to the confined structure, and the right side to the unconfined structure (including a comparison of experimental results [45] and the M1 model).
Figure 20 also compares the crack propagation processes in the unconfined structure when considering and neglecting interfacial damage. In addition, Figure 22 presents the corresponding comparison between M1 and M2 for the confined structure. It can be observed that when interfacial damage is considered, cracks initiate from the corroded rebars and propagate through both the matrix and the interface regions due to the interaction between bulk damage in the matrix and interfacial damage (see Figures 20a and 22b). Figure 20a further illustrates the crack bifurcation points associated with interfacial crack and bulk crack in the matrix phase.

Comparison of crack initiation and propagation in confined structures: (a–b) structure considering interfacial damage (the M1 model); (c–d) structure neglecting interfacial damage (the M2 model).
In contrast, when interfacial damage is neglected, cracks initiate from the corroded rebars and propagate primarily within the matrix phase. Upon encountering inclusion phases, the cracks deviate and continue to propagate within the matrix regions adjacent to the inclusions. As a result, the crack paths naturally follow regions with strong stress concentration, leading to relatively complex crack propagation paths (see Figures 20c and 22d).
Figure 21 (left) compares the corrosion-induced expansion displacements at the characteristic times t1 and t2 for the confined structure when interfacial damage is neglected (the M2 model) and when it is taken into account (the M1 model). Figure 21 (right) presents the corresponding comparison for the unconfined structure between M1 and M2, including a comparison of experimental results [45] and the M1 model.
From these results, three main observations can be made. First, the displacement values of the unconfined structures are consistently smaller than those of the corresponding confined structures. Second, for both confined and unconfined configurations, the displacement values obtained when interfacial damage is neglected are larger than those obtained when interfacial effects are considered. Third, the results obtained from the M1 model show good agreement with the experimental results reported in [45], indicating that, in the laboratory structures, the bond between the cement mortar and the coarse aggregate was affected compared with that of the original uncorroded structure.
This behavior can be explained by the influence of the confinement layer on crack propagation. When the structure is confined, crack propagation and branching become more complex, which requires greater fracture energy to develop the crack network. Furthermore, when interfacial damage is neglected, cracks propagate entirely within the matrix phase, which generally exhibits higher properties compared with the interface, where debonding between two materials can occur more easily under loading.
4. CONCLUSION
This study employs the phase-field modeling considering interfacial damage (M1) and the phase-field modeling neglecting interfacial damage (M2), both formulated to satisfy the orthogonal condition of strain tensor. These modelings are applied to evaluate the damage evolution and the corrosion-induced expansion displacements at two characteristic times, t1 (crack initiation) and t2 (crack propagation to the structural boundary), in multiphase structures containing varying numbers of inclusions and voids. The influence of corrosion-induced expansion of rebar is considered, together with structural configurations that are either confined or unconfined by an external Carbon–epoxy layer. The main findings can be summarized as follows:
Using the M1 model, cracks initiate from the corroded rebar and propagate through the structure under the interaction of bulk damage in the matrix and interfacial damage between phases. When encountering inclusion phases, cracks tend to propagate along the interfaces and subsequently continue through the matrix until complete structural failure occurs.
Using the M2 model, cracks also initiate from the corroded rebar but propagate primarily within the matrix phase due to its relatively lower stiffness. When encountering inclusion phases, cracks are partially obstructed and tend to deviate toward regions of stress concentration, generally propagating within the matrix near the inclusions.
For the same structural configuration, the corrosion-induced expansion displacements at t1 and t2 for unconfined structures are smaller than those of the corresponding confined structures. This observation highlights the effectiveness of the confined structures using an external Carbon–epoxy layer when subjected to corrosion-induced damage.
For both confined and unconfined structures, the displacement values predicted by the M1 model at t1 and t2 are smaller than those obtained using the M2 model for the same structural configuration.
In all cases, the displacement values at the two times t1 and t2 for the configurations C20 are smaller than those for the configurations C40. This can be explained by the fact that when the concrete cover thickness is smaller, the deformation of elements induced by corrosion expansion of the rebar is less restrained compared with structures having a larger cover thickness. Moreover, crack paths in the configurations C20 reach the structural boundary more rapidly than in the configurations C40. This indicates that increasing the concrete cover thickness makes the structure more resistant to corrosion-induced damage.
Finally, for experimental RC structures containing inclusions with complex geometries randomly distributed within either confined or unconfined configurations, crack initiation and propagation become more difficult, making the determination of corrosion-expansion displacements at t1 and t2 more complicated. Nevertheless, the conclusions presented above remain valid for such structural configurations. This demonstrates that the M1 and M2 models are capable of effectively simulating structures containing multiple material phases subjected to corrosion of rebar or structures with multiple rebars under either confined or unconfined conditions. In future work, these phase-field modelings can be further extended to evaluate the effectiveness of commonly used strengthening techniques for RC structures affected by corrosion.
5. DATA AVAILABILITY
Data available upon request.
6. BIBLIOGRAPHY
-
[1] GHODS, P., ISGOR, O., BROWN, J., et al, “XPS depth profiling study on the passive oxide film of carbon steel in saturated calcium hydroxide solution and the effect of chloride on the film properties”, Applied Surface Science, v. 257, n. 10, pp. 4669–4677, 2011. doi: https://doi.org/10.1016/j.apsusc.2010.12.120.
» https://doi.org/10.1016/j.apsusc.2010.12.120 -
[2] CHALHOUB, C., FRANCOIS, R., CARCASSES, M., “Effect of cathode–anode distance and electrical resistivity on macrocell corrosion currents and cathodic response in cases of chloride induced corrosion in reinforced concrete structures”, Construction & Building Materials, v. 245, pp. 118337, 2020. doi: https://doi.org/10.1016/j.conbuildmat.2020.118337.
» https://doi.org/10.1016/j.conbuildmat.2020.118337 -
[3] CHI, J.-M., HUANG, R., YANG, C., “Effects of carbonation on mechanical properties and durability of concrete using accelerated testing method”, Journal of Marine Science and Technology, v. 10, n. 1, pp. 14–20, 2002. doi: https://doi.org/10.51400/2709-6998.2296.
» https://doi.org/10.51400/2709-6998.2296 -
[4] TRAN, T.-T., TRAN, T.-M., NGUYEN, X.-T., et al, “Influences of pre-bending load and corrosion degree of reinforcement on the loading capacity of concrete beams”, Journal of the Mechanical Behavior of Materials, v. 31, n. 1, pp. 554–563, 2022. doi: https://doi.org/10.1515/jmbm-2022-0061.
» https://doi.org/10.1515/jmbm-2022-0061 -
[5] OTIENO, M., BEUSHAUSEN, H., ALEXANDER, M., “Chloride-induced corrosion of steel in cracked concrete – Part I: Experimental studies under accelerated and natural marine environments”, Cement and Concrete Research, v. 79, pp. 373–385, 2016. doi: https://doi.org/10.1016/j.cemconres.2015.08.009.
» https://doi.org/10.1016/j.cemconres.2015.08.009 -
[6] AL-AMEERI, A.-S., RAFIQ, M.-I., TSIOULOU, O., et al, “Impact of climate change on the carbonation in concrete due to carbon dioxide ingress: experimental investigation and modelling”, Journal of Building Engineering, v. 44, pp. 102594, 2021. doi: https://doi.org/10.1016/j.jobe.2021.102594.
» https://doi.org/10.1016/j.jobe.2021.102594 -
[7] LIU, P., CHEN, Y., YU, Z., “Effects of temperature, relative humidity and carbon dioxide concentration on concrete carbonation”, Magazine of Concrete Research, v. 72, n. 18, pp. 936–947, 2020. doi: https://doi.org/10.1680/jmacr.18.00496.
» https://doi.org/10.1680/jmacr.18.00496 -
[8] LEPORACE-GUIMIL, B., CONFORTI, A., ZERBINO, R., et al, “Chloride-induced corrosion in reinforced concrete and fiber reinforced concrete elements under tensile service loads”, Cement and Concrete Composites, v. 124, pp. 104245, 2021. doi: https://doi.org/10.1016/j.cemconcomp.2021.104245.
» https://doi.org/10.1016/j.cemconcomp.2021.104245 -
[9] JAMALI, A., ANGST, U., ADEY, B., et al, “Modeling of corrosion-induced concrete cover cracking: A critical analysis”, Construction & Building Materials, v. 42, pp. 225–237, 2013. doi: https://doi.org/ 10.1016/j.conbuildmat.2013.01.019.
» https://doi.org/10.1016/j.conbuildmat.2013.01.019 -
[10] ANBAZHAKAN, A., SARANGAPANI, C., PALANISAMY, S., ““Effect of corrosion inhibitors on bond strength of reinforced concrete under various exposure conditions”, Matéria (Rio de Janeiro), v. 30, pp. e20240888, 2025. doi: https://doi.org/10.1590/1517-7076-rmat-2024-0888.
» https://doi.org/10.1590/1517-7076-rmat-2024-0888 -
[11] ALTOUBAT, S., MAALEJ, M., SHAIKH, F.-U.-A., “Laboratory simulation of corrosion damage in reinforced concrete”, International Journal of Concrete Structures and Materials, v. 10, n. 3, pp. 383–391, 2016. doi: https://doi.org/10.1007/s40069-016-0138-7.
» https://doi.org/10.1007/s40069-016-0138-7 -
[12] YU, L., FRANÇOIS, R., DANG, V.-H., et al, “Development of chloride-induced corrosion in pre-cracked RC beams under sustained loading: Effect of load-induced cracks, concrete cover, and exposure conditions”, Cement and Concrete Research, v. 67, pp. 246–258, 2015. doi: https://doi.org/10.1016/j.cemconres.2014.10.007.
» https://doi.org/10.1016/j.cemconres.2014.10.007 -
[13] ZHANG, R., CASTEL, A., FRANÇOIS, R., “Concrete cover cracking with reinforcement corrosion of RC beam during chloride-induced corrosion process”, Cement and Concrete Research, v. 40, n. 3, pp. 415–425, 2010. doi: https://doi.org/10.1016/j.cemconres.2009.09.026.
» https://doi.org/10.1016/j.cemconres.2009.09.026 -
[14] RAJAGOPAL, S., PANCHANATHAN, A., “Enhancing corrosion resistance and mechanical properties of reinforced concrete beams through nanomaterial incorporation: a comprehensive investigation”, v. 30”, Matéria (Rio de Janeiro), v. 30, pp. e20240665, 2025. doi: https://doi.org/10.1590/1517-7076-rmat-2024-0665.
» https://doi.org/10.1590/1517-7076-rmat-2024-0665 -
[15] NGUYEN, X.-H., NGUYEN, H.-C., LE, D.-D., et al, “Enhancing shear capacity in reinforced concrete deep beams with openings using textile reinforced concrete”, European Journal of Environmental and Civil Engineering, v. 29, n. 3, pp. 584–600, 2025. doi: https://doi.org/10.1080/19648189.2024.2409273.
» https://doi.org/10.1080/19648189.2024.2409273 -
[16] TREVISOL, C.A., SILVA, P.R.P., PAULA, M.M.S., et al, “Evaluation of corrosion inhibitors for reinforced concrete structures”, Matéria (Rio de Janeiro), v. 22, pp. e-11904, 2017. doi: https://doi.org/10.1590/S1517-707620170004.0238.
» https://doi.org/10.1590/S1517-707620170004.0238 -
[17] POURSAEE, A., HANSSON, C.-M., “The influence of longitudinal cracks on the corrosion protection afforded reinforcing steel in high performance concrete”, Cement and Concrete Research, v. 38, n. 8-9, pp. 1098–1105, 2008. doi: https://doi.org/10.1016/j.cemconres.2008.03.018.
» https://doi.org/10.1016/j.cemconres.2008.03.018 -
[18] SRINIVASAN, S.S., MUTHUSAMY, N., ANBARASU, N.A., “The structural performance of fiber-reinforced concrete beams with nanosilica”, Matéria (Rio de Janeiro), v. 29, n. 3, pp. e20240194, 2024. doi: https://doi.org/10.1590/1517-7076-rmat-2024-0194.
» https://doi.org/10.1590/1517-7076-rmat-2024-0194 -
[19] HOANG, V.H., DO, T.A., TRAN, A.T., et al, “Flexural capacity of reinforced concrete slabs retrofitted with ultra-high-performance concrete and fiber-reinforced polymer”, Innovative Infrastructure Solutions, v. 9, n. 4, pp. 113, 2024. doi: https://doi.org/10.1007/s41062-024-01410-y.
» https://doi.org/10.1007/s41062-024-01410-y -
[20] JIN, L., LIU, M., ZHANG, R., et al, “Cracking of cover concrete due to non-uniform corrosion of corner rebar: A 3D meso-scale study”, Construction & Building Materials, v. 245, pp. 118449, 2020. doi: https://doi.org/10.1016/j.conbuildmat.2020.118449.
» https://doi.org/10.1016/j.conbuildmat.2020.118449 -
[21] JIN, L., YANG, H., ZHANG, R., et al, “A multi-stage mesoscopic numerical approach to simulate the flexural behavior of concrete beams with corroded rebars”, Engineering Structures, v. 245, pp. 112913, 2021. doi: https://doi.org/10.1016/j.engstruct.2021.112913.
» https://doi.org/10.1016/j.engstruct.2021.112913 -
[22] GERMAN, M., PAMIN, J., “FEM simulations of cracking in RC beams due to corrosion progress”, Archives of Civil and Mechanical Engineering, v. 15, n. 4, pp. 1160–1172, 2015. doi: https://doi.org/10.1016/j.acme.2014.12.010.
» https://doi.org/10.1016/j.acme.2014.12.010 -
[23] JUNG, J.-S., JEONG, J.-W., LEE, K.-S., “Structural performance degradation of corrosion-damaged reinforced concrete beams based on finite element analysis”, Applied Sciences (Basel, Switzerland), v. 12, n. 4, pp. 2090, 2022. doi: https://doi.org/10.3390/app12042090.
» https://doi.org/10.3390/app12042090 -
[24] MISHRA, P., BEHERA, P.-K., MISRA, S., “Influence of rebar/concrete interface restraint in governing corrosion-induced cracking of reinforced concrete structures”, Journal of Structural Integrity and Maintenance, v. 11, n. 1, pp. 2595370, 2026. doi: https://doi.org/10.1080/24705314.2025.2595370.
» https://doi.org/10.1080/24705314.2025.2595370 -
[25] ŠAVIJA, B., LUKOVIĆ, M., PACHECO, J., et al, “Cracking of the concrete cover due to reinforcement corrosion: a two-dimensional lattice model study”, Construction & Building Materials, v. 44, pp. 626–638, 2013. doi: https://doi.org/10.1016/j.conbuildmat.2013.03.063.
» https://doi.org/10.1016/j.conbuildmat.2013.03.063 -
[26] AMALIA, Z., QIAO, D., NAKAMURA, H., et al, “Development of simulation method of concrete cracking behavior and corrosion products movement due to rebar corrosion”, Construction & Building Materials, v. 190, pp. 560–572, 2018. doi: https://doi.org/10.1016/j.conbuildmat.2018.09.100.
» https://doi.org/10.1016/j.conbuildmat.2018.09.100 -
[27] FU, L., YIN, Q., NAKAMURA, H., et al, “A numerical study on the influence of rebar cut-off on the shear performance of RC beam by using rigid-body-spring-method”, Structures (Oxford), v. 40, pp. 1025–1038, 2022. doi: https://doi.org/10.1016/j.istruc.2022.04.084.
» https://doi.org/10.1016/j.istruc.2022.04.084 -
[28] DEHESTANI, M., ASADI, A., MOUSAVI, S.-S., “On discrete element method for rebar-concrete interaction”, Construction & Building Materials, v. 151, pp. 220–227, 2017. doi: https://doi.org/10.1016/j.conbuildmat.2017.06.086.
» https://doi.org/10.1016/j.conbuildmat.2017.06.086 -
[29] JOSHI, S.-S., AVADH, K., KUNTAL, V.-S., et al, “Investigating the effect of rebar corrosion order and arrangement on cracking behaviour of RC panels using 3D discrete analysis”, Construction & Building Materials, v. 325, pp. 126730, 2022. doi: https://doi.org/10.1016/j.conbuildmat.2022.126730.
» https://doi.org/10.1016/j.conbuildmat.2022.126730 -
[30] AMBROSIO, L., TORTORELLI, V.-M., “Approximation of functionals depending on jumps by elliptic functionals via γ-convergence”, Communications on Pure and Applied Mathematics, v. 43, n. 8, pp. 999–1036, 1990. doi: https://doi.org/10.1002/cpa.3160430805.
» https://doi.org/10.1002/cpa.3160430805 -
[31] KUHN, C., MÜLLER, R., “A continuum phase-field model for fracture”, Engineering Fracture Mechanics, v. 77, n. 18, pp. 3625–3634, 2010. doi: https://doi.org/10.1016/j.engfracmech.2010.08.009.
» https://doi.org/10.1016/j.engfracmech.2010.08.009 -
[32] VU, B.-T., LE-QUANG, H., HE, Q.-C., “Modelling and simulation of fracture in anisotropic brittle materials by the phase-field method with novel strain decompositions”, Mechanics Research Communications, v. 124, pp. 103936, 2022. doi: https://doi.org/10.1016/j.mechrescom.2022.103936.
» https://doi.org/10.1016/j.mechrescom.2022.103936 -
[33] VU, B.T., NGUYEN, X.L., DO, A.T., “Strain orthogonal decomposition implemented within the phase field method with interfacial damage to model fracture in multi-phase heterogeneous materials”, Transport and Communications Science Journal, v. 74, n. 4, pp. 386–399, 2023. doi: https://doi.org/10.47869/tcsj.74.4.1.
» https://doi.org/10.47869/tcsj.74.4.1 -
[34] GRIFFITH, A.-A., “The phenomena of rupture and flow in solids”, Philosophical Transactions of the Royal Society of London. Series A, Containing Papers of a Mathematical or Physical Character, v. 221, n. 582-593, pp. 163–198, 1921. doi: https://doi.org/10.1098/rsta.1921.0006.
» https://doi.org/10.1098/rsta.1921.0006 -
[35] IRWIN, G.-R., “Analysis of stresses and strains near the end of a crack traversing a plate”, Journal of Applied Mechanics, v. 24, n. 3, pp. 361–364, 1957. doi: https://doi.org/10.1115/1.4011547.
» https://doi.org/10.1115/1.4011547 -
[36] VU, B.-T., LE-QUANG, H., HE, Q.-C., “A phase-field method of crack nucleation investigation for experimental validation by using the improved degradation functions and strain orthogonal decompositions”, Applications in Engineering Science, v. 17, pp. 100173, 2024. doi: https://doi.org/10.1016/j.apples.2023.100173.
» https://doi.org/10.1016/j.apples.2023.100173 -
[37] PHAM, K., MARIGO, J.-J., MAURINI, C., “The issues of the uniqueness and the stability of the homogeneous response in uniaxial tests with gradient damage models”, Journal of the Mechanics and Physics of Solids, v. 59, n. 6, pp. 1163–1190, 2011. doi: https://doi.org/10.1016/j.jmps.2011.03.010.
» https://doi.org/10.1016/j.jmps.2011.03.010 -
[38] REZAEI, S., HARANDI, A., BREPOLS, T., et al, “An anisotropic cohesive fracture model: advantages and limitations of length-scale insensitive phase-field damage models”, Engineering Fracture Mechanics, v. 261, pp. 108177, 2022. doi: https://doi.org/10.1016/j.engfracmech.2021.108177.
» https://doi.org/10.1016/j.engfracmech.2021.108177 -
[39] ALESSI, R., MARIGO, J.-J., VIDOLI, S., “Gradient damage models coupled with plasticity: Variational formulation and main properties”, Mechanics of Materials, v. 80, pp. 351–367, 2015. doi: https://doi.org/10.1016/j.mechmat.2013.12.005.
» https://doi.org/10.1016/j.mechmat.2013.12.005 -
[40] KARMA, A., KESSLER, A.-D., LEVINE, H., “Phase-field model of mode III dynamic fracture”, Physical Review Letters, v. 87, n. 4, pp. 045501, 2001. doi: https://doi.org/10.1103/PhysRevLett.87.045501. PubMed PMID: 11461627.
» https://doi.org/10.1103/PhysRevLett.87.045501 -
[41] TEICHTMEISTER, S., KIENLE, D., ALDAKHEEL, F., et al, “Phase-field modeling of fracture in anisotropic brittle solids”, International Journal of Non-linear Mechanics, v. 97, pp. 1–21, 2017. doi: https://doi.org/10.1016/j.ijnonlinmec.2017.06.018.
» https://doi.org/10.1016/j.ijnonlinmec.2017.06.018 -
[42] CLAYTON, J., KNAP, J., “Nonlinear phase-field theory for fracture and twinning with analysis of simple shear”, Philosophical Magazine, v. 95, n. 24, pp. 2661–2696, 2015. doi: https://doi.org/10.1080/14786435.2015.1076176.
» https://doi.org/10.1080/14786435.2015.1076176 -
[43] LI, B., PECO, C., MILLAN, D., et al, “Phase-field modeling and simulation of fracture in brittle materials with strongly anisotropic surface energy”, International Journal for Numerical Methods in Engineering, v. 102, n. 3-4, pp. 711–727, 2015. doi: https://doi.org/10.1002/nme.4726.
» https://doi.org/10.1002/nme.4726 -
[44] HE, Q.-C., SHAO, Q., “Closed-form coordinate-free decompositions of the two-dimensional strain and stress for modeling tension–compression dissymmetry”, Journal of Applied Mechanics, v. 86, n. 3, pp. 031007, 2019. doi: https://doi.org/10.1115/1.4042217.
» https://doi.org/10.1115/1.4042217 -
[45] VU, B.-T., TRAN, T.-T., NGUYEN, H.-C., “Phase-field method of fracture for experimental validation to simulate damage caused by reinforcement corrosion in clam-shell concrete beams”, Construction & Building Materials, v. 454, pp. 139065, 2024. doi: https://doi.org/10.1016/j.conbuildmat.2024.139065.
» https://doi.org/10.1016/j.conbuildmat.2024.139065 -
[46] VU, B.-T., NGUYEN, D.-D., TRAN, T.-T., et al, “Phase-field modeling for investigating the effect of rebar positioning and uniform versus non-uniform corrosion on concrete fracture”, Fracture and Structural Integrity, v. 19, n. 73, pp. 166–180, 2025. doi: https://doi.org/10.3221/IGF-ESIS.73.12.
» https://doi.org/10.3221/IGF-ESIS.73.12 -
[47] XU, W., ZHANG, C., LIU, H., et al, “Simulation and analysis of corrosion fracture of reinforced concrete based on phase field method”, Case Studies in Construction Materials, v. 17, pp. e01366, 2022. doi: https://doi.org/10.1016/j.cscm.2022.e01366.
» https://doi.org/10.1016/j.cscm.2022.e01366 -
[48] VU, B.-T., “Phase field method with strain orthogonal decompositions for modelling of damage in heterogeneous materials obtained by X-ray computed tomography images”, Transport and Communications Science Journal, v. 51, n. 1, pp. 20–34, 2023. doi: https://doi.org/10.47869/tcsj.74.1.3.
» https://doi.org/10.47869/tcsj.74.1.3 -
[49] NGUYEN, T.-T., YVONNET, J., ZHU, Q.-Z., et al, “A phase-field method for computational modeling of interfacial damage interacting with crack propagation in realistic microstructures obtained by microtomography”, Computer Methods in Applied Mechanics and Engineering, v. 312, pp. 567–595, 2016. doi: https://doi.org/10.1016/j.cma.2015.10.007.
» https://doi.org/10.1016/j.cma.2015.10.007 -
[50] VU, B.-T., “Phase field modelling combined with optimization algorithm for maximizing the resistance in two-phase composites”, Transport and Communications Science Journal, v. 74, n. 4, pp. 427–443, 2023. doi: https://doi.org/10.47869/tcsj.74.4.4.
» https://doi.org/10.47869/tcsj.74.4.4 -
[51] NGUYEN, H.-Q., LE, B.-A., TRAN, B.-V., et al., “Deep artificial neural network-powered phase field model for predicting damage characteristic in brittle composite under varying configurations”, Machine Learning: Science and Technology, v. 5, n. 2, pp. 025062, 2024. doi: https://doi.org/10.1088/2632-2153/ad52e8.
» https://doi.org/10.1088/2632-2153/ad52e8 -
[52] CHERNIN, L., VAL, D.V., VOLOKH, K.Y., “Analytical modelling of concrete cover cracking caused by corrosion of reinforcement”, Materials and Structures, v. 43, n. 4, pp. 543–556, 2010. doi: https://doi.org/10.1617/s11527-009-9510-2.
» https://doi.org/10.1617/s11527-009-9510-2 -
[53] ZHAO, Y., YU, J., JIN, W., “Damage analysis and cracking model of reinforced concrete structures with rebar corrosion”, Corrosion Science, v. 53, n. 10, pp. 3388–3397, 2011. doi: https://doi.org/10.1016/j.corsci.2011.06.018.
» https://doi.org/10.1016/j.corsci.2011.06.018 -
[54] TRAN, K. K., NAKAMURA, H., KAWAMURA, et al, “Analysis of crack propagation due to rebar corrosion using RBSM”, Cement and Concrete Composites, v. 33, pp. 906–917, 2011. doi: https://doi.org/10.1016/j.cemconcomp.2011.06.001.
» https://doi.org/10.1016/j.cemconcomp.2011.06.001 -
[55] LUNDGREN, K., “Modelling the effect of corrosion on bond in reinforced concrete”, Magazine of Concrete Research, v. 54, n. 3, pp. 165–173, 2002. doi: https://doi.org/10.1680/macr.2002.54.3.165.
» https://doi.org/10.1680/macr.2002.54.3.165 -
[56] MIEHE, C., HOFACKER, M., WELSCHINGER, F., “A phase-field model for rate independent crack propagation: Robust algorithmic implementation based on operator splits”, Computer Methods in Applied Mechanics and Engineering, v. 199, n. 45–48, pp. 2776–2788, 2010. doi: https://doi.org/10.1016/j.cma.2010.04.011.
» https://doi.org/10.1016/j.cma.2010.04.011 -
[57] DE MORAIS, A., DE MOURA, M., MARQUES, A., et al, «Mode-I interlaminar fracture of carbon/epoxy cross-ply composites», Composites Science and Technology, v. 62, n. 5, pp. 679–686, 2002. doi: https://doi.org/10.1016/S0266-3538(01)00223-8.
» https://doi.org/10.1016/S0266-3538(01)00223-8 - [58] VIETNAM STANDARD, TCVN 11823:2017 Vietnamese Highway Bridge Design Specification, Vietnam, Vietnam Standard, 2017.