 Study on the influence of thermal shock on the microstructural alterations and mechanical integrity of concrete
ABSTRACT
This study investigates the influence of thermal shock on the mechanical and microstructural properties of M20-grade concrete. A total of 15 cylinders, 9 cubes, and 4 prisms were cast and subjected to fire exposure using an LPG burner, reaching approximately 800 °C for 90 minutes, followed by sudden water quenching to simulate thermal shock. The specimens were tested for compressive, split tensile, and flexural strengths, and compared with unheated control samples. The thermoshocked concrete exhibited significant strength reductions: compressive strength decreased by 42.8%, split tensile strength by 26.9%, and flexural strength by 50.1%. Weight loss averaged 8–10%, indicating moisture evaporation and matrix degradation. FESEM analysis revealed severe microcracking, increased porosity, and decomposition of C–S–H and CH, while XRD confirmed phase transformations from C–S–H to AN and CC. A strong linear correlation (R2 = 0.91) was observed between mass loss and strength reduction. The results demonstrate that rapid cooling after fire exposure critically weakens the microstructure and mechanical integrity of concrete, emphasizing the need to evaluate residual performance in post-fire structures.
Keywords:
Thermoshock; Compressive strength; Split tensile strength; Flexural strength; Microstructure
1. INTRODUCTION
Every building contains materials susceptible to ignition, making it nearly impossible to eliminate fire risk entirely [1, 2, 3, 4, 5]. Fires can cause catastrophic structural damage, affecting functionality, stability, and load-bearing capacity [6, 7]. Although water is the most common firefighting medium, its sudden application can induce thermal shock in reinforced concrete (RC) structures [8]. Several buildings have shown inadequate post-fire and seismic performance, raising concerns about their long-term durability [9, 10, 11]. In RC structures, fire exposure not only causes thermal shock but also transforms ductile steel into a semi-brittle state [12, 13]. Most experimental studies on post-fire concrete strength have been performed under natural cooling, whereas actual fire scenarios involve water-based quenching, which produces more severe damage [14, 15, 16, 17, 18, 19, 20, 21]. The significance of quenching effects was emphasized following the major fire in Hengyang, China (2003) [10]. Thermal shock refers to the rapid temperature change causing expansion or contraction, which generates internal stresses leading to microcracking [19, 22, 23]. Studies confirm that water quenching significantly reduces residual compressive, tensile, and fracture energy properties compared with gradual cooling [24, 25, 26, 27, 28, 29, 30, 31]. Consequently, research based solely on natural cooling may overestimate concrete’s residual strength [10, 32]. Understanding thermal shock behavior is therefore crucial for ensuring the safety and longevity of RC structures [33, 34, 35]. Previous investigations also highlight the role of hybrid fibers in improving crack resistance under sudden cooling from temperatures up to 800 °C [28], though studies on RC members remain limited [10, 36]. Fire testing typically follows standard fire curves such as ISO 834 for building materials or hydrocarbon curves for petrochemical structures, while the RABT-ZTV curve accounts for cooling effects in tunnel fires [33, 36]. According to IS 3809, the test procedures align with BS 476, employing propane or LPG flames with controlled heating on the specimen’s exposed surfaces. Temperature measurement is performed using chromium–aluminium thermocouples (grade 0.75, 1 mm) [37]. At elevated temperatures, the interlayer water in C–S–H and bound water in sulfoaluminate hydrates evaporate near 300 °C, and calcium hydroxide decomposes around 530 °C, causing volumetric shrinkage. Above 600 °C, aggregates undergo chemical alteration, inducing severe microcracking and loss of strength [38]. The cooling method plays a key role: sudden quenching creates steep thermal gradients and tensile stresses that drastically reduce residual strength [39, 40, 41, 42]. Most prior studies examined natural cooling, revealing a need for comparative evaluation of different cooling regimes. For example, specimens heated to 300 °C lost 5% strength under natural cooling but 30% under sudden cooling [40]. At 300–800 °C, natural cooling caused 30–43% loss, while quenching reduced residual strength to only 7.5% [43]. At 900 °C, severe cracking rendered specimens untestable [40]. In practice, firefighting typically involves direct water application, creating thermal shock that severely affects the physical and mechanical behavior of RC components. Literature indicates that the effects of thermal shock on concrete structures are insufficiently explored, necessitating deeper understanding of its mechanisms and consequences. Therefore, this study aims to evaluate the influence of thermal shock on M20-grade concrete, comparing normal and thermally shocked specimens through compressive, flexural, and split tensile tests, weight loss measurements, and microstructural analyses, to elucidate the causes and effects of thermal shock–induced damage.
1.1. Research significance
Fire research often overlooks the distinction between furnace heating and real fire exposure. Unlike uniform furnace heating, actual fires expose only one or two faces of a structural element, creating steep thermal gradients, cracking, spalling, and stiffness loss; water spraying during firefighting further induces rapid cooling and severe thermal shock. To replicate these conditions, this study conducted open-fire testing using gas-fueled pipe burners in accordance with IS 3809:1979, applying single-face heating and rapid cooling to realistically simulate fire-induced damage.
2. EXPERIMENTAL PROGRAM
Flowchart to provide a clearer overview of the study design and main findings is presented in Figure 1.

2.1. Specimen size and detailing
A total of 28 concrete specimens were cast, including 15 cylinders (150 mm in diameter and 300 mm in height), 9 cubes (150 mm × 150 mm × 150 mm) and 4 prisms (100 mm × 100 mm × 500 mm). Cylindrical specimens were tested for both compressive and split tensile strength, with controlled (CCYSC1–CCYSC6, CCYSS7–CCYSS9) and thermally shocked (TCYSC10–TCYSC12, TCYSS13–TCYSS15) sets evaluated at 7 and 28 days. Cube specimens, comprising six controlled (CCUSC1–CCUSC6) and three thermally shocked (TCUSC7–TCUSC9) samples, were tested for compressive strength, while prisms (CPSF1–CPSF2 and TPSF3–TPSF4) were tested for flexural strength at 28 days. The first letters C and T in the specimen IDs denote controlled and thermally shocked specimens, respectively and the casting process is shown in Figure 2.

2.2. Loading setup
Concrete cubes, cylinders, and prisms were tested using a 2000 kN compression testing machine and a 3000 kN universal testing machine. A loading rate of 140 kg/cm2/min, as prescribed in IS 516, was employed for compressive strength evaluation to ensure test precision, consistency, and uniform stress distribution. The split tensile strength of cylinders was determined at a loading rate of 1.2 N/mm2/min in accordance with IS 5816. Thermal loading was conducted in line with IS 3809:1979, “Fire Resistance Test for Structures,” which aligns closely with ASTM E119 in terms of the temperature–time relationship and testing philosophy. An open-flame LPG burner system was utilized to simulate realistic fire exposure, following the ISO 834 standard fire curve. Temperature monitoring was performed continuously using K-type thermocouples and a thermal imaging camera to ensure accurate control and measurement. The thermal exposure lasted for 90 minutes, utilizing eight 1 m-long pipeline gas burners equipped with four-stage control valves. The burners were fueled by eight 5 kg LPG cylinders (10,900 kcal/kg) and operated at the third stage to achieve uniform heating. Four 2 kg CO2 fire extinguishers were kept on-site to ensure safety during testing. K-type thermocouples, with a sensitivity of 41 µV/°C and a measurement range of –270 °C to 1260 °C, were employed for temperature measurement [37, 39, 44, 45]. The positive lead consisted of 90% Ni and 10% Cr, while the negative comprised 95% Ni, 2% Al, 2% Mn, and 1% Si.
3. TEST RESULTS AND DISCUSSION
In this study, normal and thermally shocked companion specimens were tested and compared. This section presents the key findings, their implications, and a comparative evaluation with existing literature in relation to the research hypothesis.
3.1. Thermal gradient of companion specimen
The bottom surfaces of the cube, cylinder, and prism specimens were exposed to fire for approximately 90 minutes, reaching about 800 °C or higher at the bottom concrete surface.
Thermocouples (TC) were placed at 1) TC01-placed at bottom surface of concrete (fire Exposing face), 2) TC02- 20 mm from bottom extreme fibre, 3) TC03- at middle of concrete specimen and 4) TC04-20 mm from top extreme fibre, as indicated in Figure 3. The temperature distribution was monitored using a thermocouple thermometer and a thermal imaging camera for the cube, cylinder, and prism specimens. The heated specimens were quenched in water to induce thermal shock, as shown in Figure 4. The temperature readings recorded by the thermocouple thermometer for the TCUSC7 specimen are presented in Table 1, which shows that when the bottom surface temperature reached 612 °C after 60 minutes of exposure, the temperatures recorded at depths of 20 mm, 75 mm, and 130 mm were 428.2 °C, 242.7 °C, and 209.1 °C, respectively. With an exposure duration of 85 minutes, the bottom surface temperature increased to 800.4 °C, while the corresponding temperatures at the above depths were 470.8 °C, 394.2 °C, and 274.6 °C, respectively. After an additional five minutes of heating (i.e., at 90 minutes), the bottom surface temperature reached 835.2 °C, after which the burner regulator was turned off. At this point, the recorded temperatures at 20 mm, 75 mm, and 130 mm were 496.8 °C, 400.5 °C, and 292.8 °C, respectively. Upon the sudden application of cool water to induce the thermal shock effect, a rapid decrease in temperature was observed. The measured values at the bottom surface and at depths of 20 mm, 75 mm, and 130 mm were 162.5 °C, 124.9 °C, 90.8 °C, and 44.7 °C, respectively.


Concrete generally develops a reddish-brown or buff coloration when exposed to temperatures between 450 °C and 800 °C, primarily due to the oxidation of iron present in the aggregates. Cracking intensifies because of the unequal thermal expansion and contraction of the cement paste and aggregates. Around 340.5 °C (after roughly 45 minutes of exposure), microcracks began to appear. After 60 minutes, these cracks widened as bound water within the hydrated cement matrix started to evaporate. At approximately 800 °C, most of the free water migrated to the surface, and the entrapped moisture converted to steam, leading to spalling in concrete. The vaporization weakened the bond between the aggregate and cement paste, resulting in a more brittle structure. At temperatures between 850 °C and 900 °C, the thermocouple thermometer displayed erratic and declining readings, even though heating continued. This anomaly was attributed to the “green rot” phenomenon, a form of internal oxidation in chrome–nickel–iron alloys used in Type K thermocouples, which causes embrittlement, brittle fractures, and negative drift in readings, particularly under low-oxygen, high-temperature conditions. Consequently, fire exposure was terminated at approximately 850 °C, after which thermal shocking was applied. The representative images showing the surface changes of the concrete specimens at different exposure temperatures due to thermal loadings are presented in Figure 5, which shows the progression of visible surface cracks on the concrete specimens heated to 350°C, 550°C, and 810°C. At 350°C, minor surface discoloration was observed, while at 550°C, initial cracks appeared. At 810°C, extensive cracking and localized spalling became evident, as highlighted by yellow markings. It was observed that water expulsion began around 300°C in cylinder, and visible prism cracking at around 750°C and after the thermal shock, the specimens exhibited surface cracks, confirming internal stress release and microstructural damage due to rapid temperature gradients. The evaluation of fire-damaged concrete generally began with a visual inspection to identify changes in colour, the formation of cracks, and surface spalling in both conventional and geopolymer concrete. Noticeable colour changes were observed at temperatures of 200°C and above, where the concrete surface turned light Gray. As the temperature increased to 400°C, the colour further changed to Gray, and no visible thermal cracks appeared on the exposed surface. When the temperature reached 600°C, the colour shifted to light pink, accompanied by minor cracks and surface crazing. At 800°C, the surface exhibited a Gainsboro Gray appearance, with pronounced surface cracking and extensive crazing clearly visible [39]. A close correlation was found between the results of the present study and those reported in the literature [39], confirming the consistency and reliability of the observed trends.

Analysis of the temperature distribution charts displayed in Figure 6, revealed that the average thermal profile of concrete at the fire-exposed surface follows a sixth-degree polynomial expressed as:

with a coefficient of determination R2 = 0.967, showing excellent correlation. At a depth of 20 mm from the fire-exposed bottom surface, the average thermal gradient increase is expressed as:
with R2 = 0.936 indicating a strong fit. The average polynomial of thermal gradient rising pattern at 75 mm from the bottom layer of fire exposed surface is
with R2 = 0.958 again indicating a high degree of accuracy. The average polynomial of thermal gradient rising pattern at 130 mm from the bottom layer of fire exposed surface is
with R2 = 0.942 again demonstrating strong precision.
The temperature gradients for cube, cylinder, and prism specimens are shown in Figure 6 (a)–(j). In the cube specimens in Figure 6(a) TCUSC8 and Figure 6(b) TCUSC9, temperature increased progressively with time, exhibiting a clear vertical gradient in which the bottom region was hotter than the middle, and the middle was hotter than the top. Higher overall temperatures in TCUSC9 indicate greater thermal accumulation at the base. Cylindrical specimens in Figure 6(c)–(h) displayed varying thermal behaviors influenced by geometry and boundary conditions. TCYSC10 showed strong bottom-dominant heating with limited axial conduction, while TCYSC11 exhibited a more uniform rise, suggesting improved heat transfer along the height. TCYSC12 and TCYSC14 demonstrated top-surface dominant heating, possibly due to convective effects or altered heat input, whereas TCYSC13 and TCYSC15 showed more uniform gradients, indicating effective axial conduction and minimal resistance. Prism specimens in Figure 6(i) TPSF3 and Figure 6(j) TPSF4 revealed internal heat accumulation at the mid-section and a stable bottom-up temperature rise, respectively, reflecting geometry-driven variations in conductive and convective heat transfer. Overall, temperature distribution patterns confirm the influence of specimen shape, boundary contact, and heat input orientation on the transient thermal response. It was observed that the average temperature increases from the fire-exposed bottom surface to a depth of 20 mm above it was approximately 60.11%. At 75 mm from the exposed surface, the temperature rise was around 41.36%, and at a depth of 130 mm (about 20 mm below the top surface), the increase was 34.84%. Following thermal shock, the average temperature drop reached 82.33%. The bottom surfaces of all companion specimens attained temperatures close to 800 °C within 85–95 minutes, confirming that a nearly uniform thermal load had been applied to each specimen. These results are consistent with previous studies on the thermal response of concrete at elevated temperatures. Researchers have reported that steep temperature gradients between the heated face and the interior of concrete elements can produce significant thermal stresses, leading to the initiation and propagation of surface and internal cracks [46]. Similarly, investigations into fire-exposed concrete have shown that temperature gradients exceeding 40–60% through the depth of specimens contribute to progressive surface cracking and spalling [47, 48]. The temperature pattern observed in this study, where the surface reached 800 °C within 1.5 hour is comparable to those reported in controlled furnace testing and rapid-heating conditions used in previous fire resistance experiments [49]. The sharp temperature reduction following thermal shock indicates a high rate of cooling, which is known to generate contraction-induced tensile stresses in the concrete matrix. Such thermal gradients and stress reversals are recognized mechanisms responsible for the crack formation and surface damage observed in thermally shocked concrete specimens, consistent with established findings in the literature on thermal stress behavior [50].
3.2. Compressive strength of cube
Cube tests were performed using a 2000 kN compression testing machine in accordance with IS: 516–2018, at a loading rate of 140 kg/cm2/min until failure. Both control and thermally shocked cubes were examined (Figure 7), and the average compressive strengths (Figure 8) were 23.36 N/mm2 for control and 13.33 N/mm2 for thermally shocked specimens, with an average weight reduction of 10.22%. Specimens heated to 600 °C and air-cooled showed a 27% strength loss, while water-cooled specimens exhibited a 44% reduction. Tests above 600 °C were not conducted due to specimen disintegration [29] and because full-surface heating, typical of furnace exposure, does not reflect actual field conditions. Heat was applied only to the bottom surface to replicate realistic fire exposure at slab soffits, beam undersides, and wall or column faces.


3.3. Compressive strength of cylinder
Compressive strength test on cylinders were conducted using UTM of 3000 kN capacity. The compressive strength of cylinders were compared as shown in Figure 9. Average compressive strength of controlled cylinder specimen and thermally shocked cylinder specimen was 21.84 N/mm2 and 18.02 N/mm2 respectively which was 17.49% lesser than the controlled cylinder specimen’ strength. Figures 8 (cube specimens) and 9 (cylinder specimens) show distinct differences in residual compressive strength after thermal shock. Cubes exhibited a larger capacity loss (42.8%, from 23.36 to 13.33 N/mm2) compared to cylinders (17.5%, from 21.84 to 18.02 N/mm2). This contrast arises from three interrelated mechanisms reported in the literature. First, geometry and surface-to-volume ratio: cubes, having shorter dimensions, develop steeper temperature gradients and lose moisture more rapidly, causing greater near-surface cracking and spalling. Second, stress distribution and failure mode: cubes fail through brittle shear or crushing at edges and corners, while cylinders show progressive axial splitting with residual frictional confinement, retaining higher post-peak strength. Third, cooling regime: rapid quenching intensifies thermal shock through microcracking, pore expansion, and bond degradation, effects that are more severe in shapes with greater surface exposure such as cubes. Previous studies also report higher losses under quenching than gradual cooling. The observed compressive strength reductions—42.8% for cubes and 17.5% for cylinders—fall within reported ranges for non-uniform heating and sudden cooling. Overall, specimen geometry, thermal gradient intensity, and cooling method collectively govern residual compressive strength, underscoring their importance in post-fire evaluation.

3.4. Split tensile strength of cylinder
Split tensile strength tests were conducted on 150 × 300 mm concrete cylinders using a universal testing machine as per IS 5816:1999. M20-grade specimens were cured for 28 days and loaded along the diametral plane until failure. As shown in Figure 10, control specimens achieved an average strength of 2.19 N/mm2, while thermally shocked cylinders recorded 1.60 N/mm2, reflecting a 26.9% reduction and an average weight loss of 8.10%. The greater loss in tensile strength compared to compressive strength is attributed to microcrack development and propagation at elevated temperatures, which reduced the effective load-bearing area [51].

3.5. Flexure strength of prism
Flexural strength tests were conducted in accordance with IS 516:2018 on concrete prisms. Specimen dimensions and weights were recorded before testing. The load was applied smoothly at a rate of 0.7 kg/cm2/min until failure, and the maximum load was recorded (Figure 11). The mean flexural strength of control prisms was 3.30 N/mm2, while thermally shocked prisms showed 1.70 N/mm2, indicating a 50.06% reduction and an average weight loss of 7.93%. The control prisms prepared with M20 grade concrete achieved an average flexural strength of 3.30 N/mm2, complying with the standards specified in IS 516:1959 and IS 456:2000.

3.6. FESEM analysis of specimen
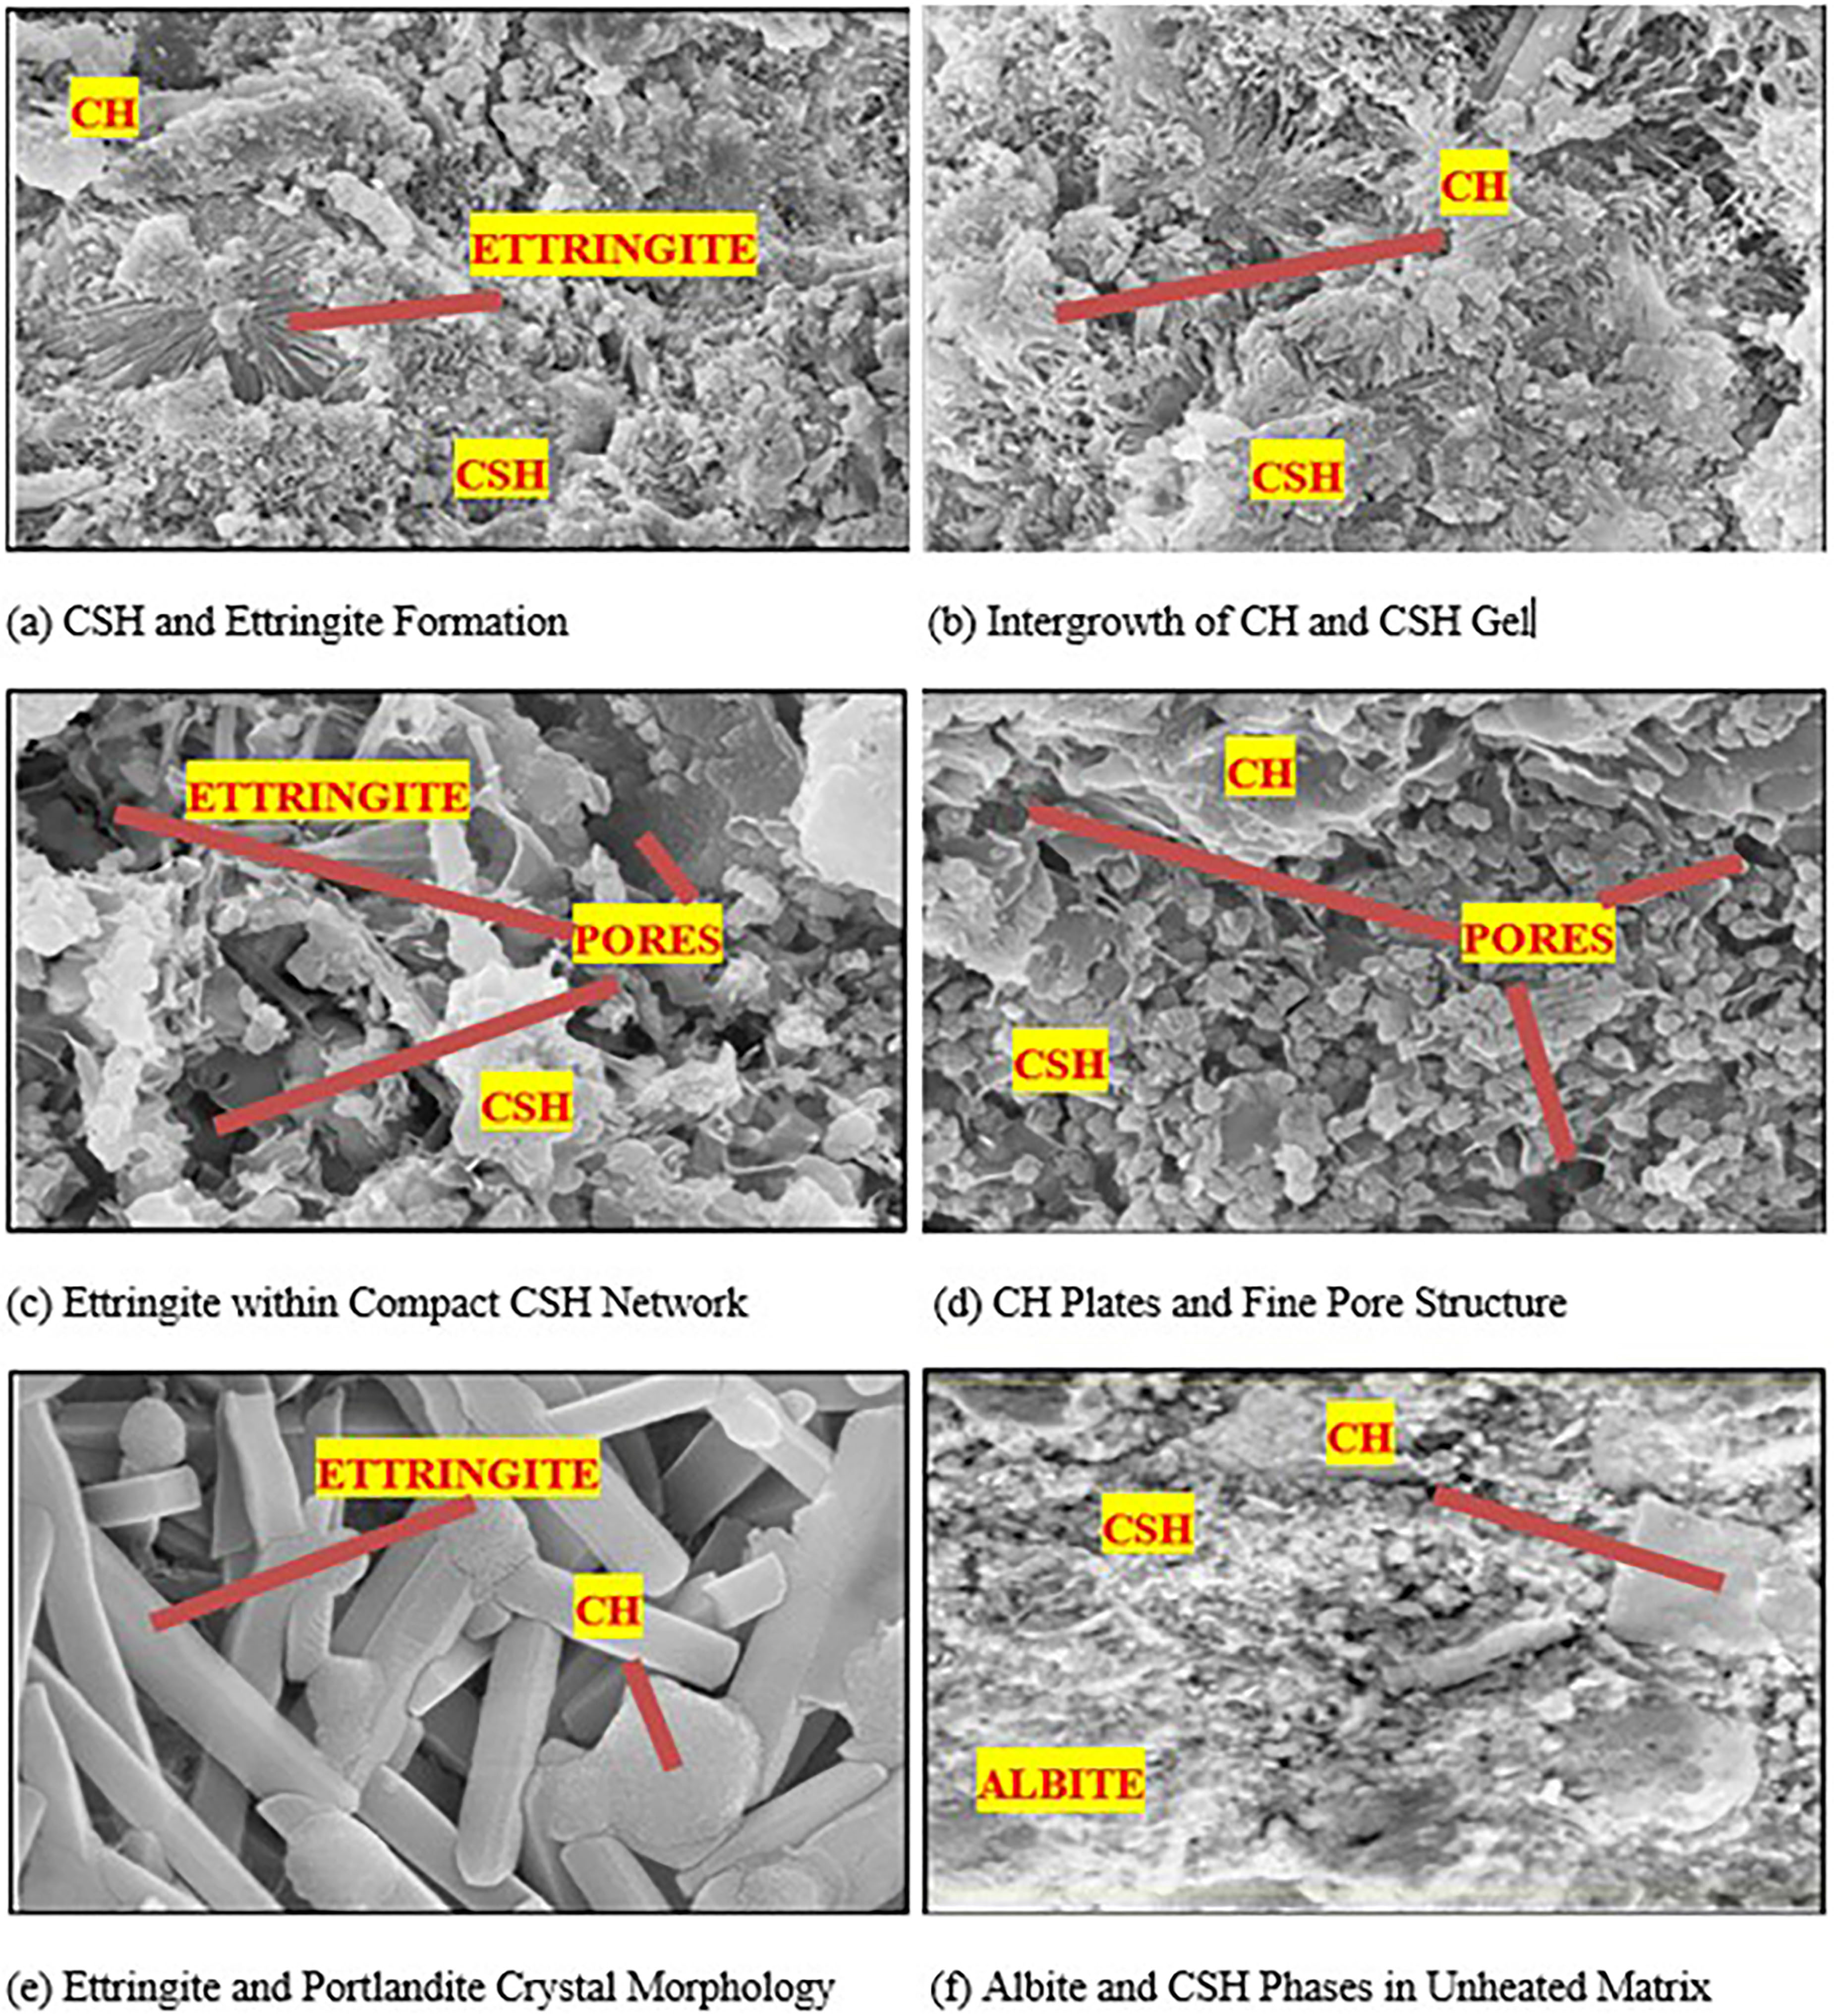
Microstructural mechanisms also explain these differences. As reported [52], the decomposition of CH and destabilization of C–S–H gel above 500–600 °C weakens the cement matrix, especially near the exposed surface. FESEM and XRD analyses from the present study corroborate this, showing pronounced C–S–H disintegration and a phase shift from Albite to Anorthite under thermal shock conditions. These transformations lead to microcrack propagation and bond rupture within the interfacial transition zone (ITZ), as previously described [53] and confirmed [47]. Figure 12(a) shows dense fibrous C–S–H gel interspersed with needle-like ettringite crystals. This indicates effective cement hydration, contributing to high early strength and compact microstructure. The uniform distribution of hydration products reflects a well-cured matrix. Figure 12(b) indicates that Plate-like CH (portlandite) crystals are embedded within the C–S–H matrix, providing strength and stiffness. The coexistence of these phases confirms normal hydration progress and balanced moisture availability during curing. Numerous ettringite formations are visible within a dense C–S–H background as displayed in Figure 12(c) indicating adequate sulphate availability and controlled setting. The close packing of crystals minimizes pore volume, enhancing impermeability and durability. Well-developed hexagonal portlandite crystals are seen surrounded by fine pores within the hydrated matrix as illustrated in Figure 12(d). Such micro voids are typical of normal hydration and do not indicate structural damage, maintaining good interfacial bonding. Distinct needle-shaped ettringite and hexagonal CH crystals are evident as depicted in Figure 12(e). These crystalline habits confirm the stability of hydration products at ambient temperature and contribute to the concrete’s compressive strength. This micrograph in Figure 12(f) highlights albite (feldspathic aggregate phase) embedded in a continuous C–S–H matrix with minor calcium hydroxide deposits. The compact texture and lack of microcracks suggest sound aggregate–paste bonding and dense microstructure. In the Normal Cube Specimen’ images shown in Figure 12 (a–f), exhibits the hexagon habit of CaOH and ettringite of needle habit & CSH of sheet like habit. The image also shows crystal forms which are more subhedral. The FESEM analysis confirms the presence of key hydration products (C-S-H, Ca (OH)2), which contribute to the strength of M20 grade concrete. The concrete exhibits a dense microstructure with minimal porosity and microcracking, aligning with its expected performance.

The Energy Dispersive X-ray Spectroscopy (EDS or EDX) spectrum analysis given in Figure 13, confirms the presence of major cementitious elements calcium (Ca), silicon (Si), oxygen (O), and aluminium (Al) along with minor constituents such as magnesium (Mg), sulphur (S), sodium (Na), potassium (K), iron (Fe), and titanium (Ti). The dominant peaks of Ca, Si, and O indicate the prevalence of calcium silicate hydrate (C–S–H), while the presence of Al and S supports the formation of ettringite and calcium aluminate phases. Trace elements such as Fe and Ti arise from the cement clinker or aggregate minerals. The overall elemental composition reflects a well-hydrated, chemically stable matrix characteristic of the unheated specimen, confirming the integrity of hydration products prior to thermal exposure.

Distinct cracks are observed in Figure 14(a), which are propagating through the calcium hydroxide matrix, indicating decomposition and volumetric instability caused by rapid temperature changes. The loss of crystal integrity reflects dehydration of portlandite during thermal shock. This image given in Figure 14(b) shows transformation of the C–S–H phase into anorthite, accompanied by surface cracking. The appearance of anorthite confirms high-temperature phase transition and structural breakdown due to rapid cooling. Figure 14(c) indicates that Interconnected cracks are visible within a matrix composed of CH and anorthite. These features indicate weakened interfacial bonding and microcrack coalescence typical of thermal shock damage. The image depicted in Figure 14(d) reveals dehydrated quartz particles embedded within a fractured matrix. The roughened particle boundaries and open cracks signify shrinkage and internal stress resulting from silica dehydration above 600 °C. From Figure 14(e), it is learnt that Dense clusters of anorthite crystals are surrounded by intersecting cracks, suggesting a brittle fracture zone. Such morphology indicates severe contraction and phase instability in the quenched specimen. Figure 14(f) exhibits large open cracks separating CH remnants and dehydrated quartz. The fragmented appearance and loss of cohesion confirm significant microstructural deterioration due to the combined effects of high temperature and sudden cooling. The surplus water in the concrete evaporates during the heating process, creating voids and capillary pores within the concrete paste, which are directly associated with its porosity. Choosing high-quality materials and an appropriate mix design are crucial factors in producing impermeable concrete. Concrete with a greater porosity rate absorbs water through its porous structure. The cement paste consists of CSH gel and pores. The influence of temperature is observed to further enhance the porosity in the concrete’s microstructure [54]. All images in Figure 14 (a–f) clearly demonstrate that thermal shock induces microcracking, dehydration, and phase transformation within the concrete matrix. The conversion of C–S–H and Ca (OH)2 into anorthite and dehydrated quartz and the formation of widespread cracks confirm serious deterioration in the microstructure and interfacial bonding, consistent with the observed loss in residual mechanical strength.

The EDX analysis of the thermally shocked specimen given in Figure 15, shows the presence of major cementitious elements oxygen (O), calcium (Ca), silicon (Si), and aluminium (Al) along with minor elements such as magnesium (Mg), sodium (Na), potassium (K), titanium (Ti), iron (Fe), phosphorus (P), and sulphur (S). The high peaks of Ca and Si confirm the dominance of calcium silicate-based compounds; however, the relative decrease in oxygen intensity indicates dehydration and breakdown of calcium silicate hydrate (C–S–H) due to thermal exposure. The emergence of new crystalline phases such as anorthite and dehydrated quartz, inferred from the altered Ca–Si ratio, aligns with the FESEM observations.

The reduction in Al and S signals suggests partial decomposition of ettringite and other sulphate phases, while the persistence of Fe and Ti peaks points to their thermal stability. Overall, the EDX spectrum confirms the chemical transformation and elemental redistribution associated with high-temperature damage and rapid cooling, validating the significant deterioration of the hydrated matrix observed in the microstructural analysis.
The EDX spectrum of the normal specimen given in Figure 13, shows a typical hydrated-cement signature dominated by oxygen, calcium and silicon with measurable aluminium, sulphur, sodium, potassium, magnesium and minor iron/titanium consistent with an intact C–S–H/CH/ettringite assembly. By contrast, the thermally shocked specimen given in Figure 15, exhibits a modified elemental balance indicative of thermal decomposition and phase transformation. Qualitatively, the thermally shocked spectrum shows (i) changes in the relative Ca:Si:O peak intensities consistent with partial breakdown of C–S–H and redistribution of Ca (appearance/relative enhancement of Ca-related peaks associated with new Ca–silicate phases such as anorthite), (ii) reduced relative signals for oxygen, aluminium and sulphur consistent with dehydration and decomposition of ettringite/sulphate phases, and (iii) persistence of Fe and Ti peaks as refractory/aggregate-derived constituents. The thermally shocked spectrum also displays clearer signatures of silica-related residues (dehydrated quartz) and small additional peaks that reflect secondary mineralization after high-temperature exposure. Quantitatively reporting the EDX atomic or weight percentages would confirm these trends numerically, but the present spectra jointly indicate loss of chemically bound water, C–S–H destabilization, and conversion toward more stable high-temperature phases observations that agree with the FESEM and XRD evidence for anorthite formation and increased porosity/cracking.
3.7. X-ray diffraction test on specimen
The XRD patterns for both the control and thermally shocked concrete specimens are shown in Figure 16 and Figure 17, respectively. The control specimen exhibits prominent peaks corresponding to C–S–H, CH (portlandite), AB (albite), and minor CC (calcite) phases, confirming a well-hydrated cementitious matrix with stable crystalline products. The strong reflections at 2θ are equal to 18°, 34°, and 47° correspond to CH, while the broad hump between 26° and 34° indicates the presence of semi-crystalline C–S–H gel, which is characteristic of hydrated Portland cement systems. In contrast, the thermally shocked specimen shows significant reduction in peak intensities for C–S–H and CH, indicating dehydration and decomposition of these hydration products due to exposure at around 800 °C. The disappearance of CH peaks around 2θ equals to 18° reflects its thermal decomposition into CaO, which subsequently undergoes carbonation during cooling to form CC (CaCO3). The increased intensity of CC peaks at 2θ is equal to 29.4° confirms this post-cooling carbonation effect. Additionally, new peaks corresponding to AN (anorthite, CaAl2Si2O8) appear around 2θ equals to 28°–30°, revealing the transformation of silicate and aluminate phases under high temperature. These findings clearly demonstrate the thermal instability of hydration compounds and the formation of new crystalline phases following exposure and rapid quenching. The transformation from C–S–H and CH to AN and CC phases is consistent with reports [28, 55] and [41], which observed similar mineralogical transitions in fire-exposed cement pastes.


The emergence of AN and CC correlates directly with the reduction in mechanical strength, as these phases are brittle and non-binding in nature, contributing to the observed microcracking and porosity in FESEM images. In Normal specimen as well as Thermally shocked specimen, the minerals Quartz & Portlandite exhibit hexagonal crystal but Anorthite mineral exhibits Anorthic crystals in thermally shocked specimen and Monoclinic crystals in Normal specimen. Albite mineral shows Anorthic crystalline and Calcite mineral shows Hexagonal crystalline in Normal and Thermally shocked specimen too.
Thermally shocked specimen contained Anorthite of 59.4 percentage where as in controlled specimen contained 19 percentage only. The Albite compound in Thermally shocked specimen was 14.9 percentage while the Normal specimen contains 53 percentage. It was due to the effect of thermal shock. Hence, the XRD results confirm that thermal shock causes irreversible phase transformations, leading to the loss of binding compounds and degradation of mechanical performance in the concrete matrix.
3.8. Comparisons between the effects caused by exposure to thermoshock on cubes and cylinders
Cubes generally exhibited higher compressive strength than cylinders under normal conditions due to their lower height-to-width ratio, which limits lateral expansion and end-friction effects. In the control specimens, cubes were about 5–10% stronger than cylinders. After exposure to elevated temperatures, cylinders lost approximately 18–20% of their strength, whereas cubes lost 35–45%, indicating a more severe reduction. This difference arises mainly from the following factors:
-
a)
Shape and Size Factor: The shorter geometry of cubes reduces lateral restraint but increases thermal gradients between the surface and core, promoting diagonal shear failure and extensive internal cracking. Cylinders, with greater height and end restraint, experienced more uniform stress confinement and failed predominantly by vertical splitting, showing slightly ductile behavior.
-
b)
Stress Distribution: Higher surface-to-volume ratios in cubes caused greater corner and edge cracking under heat exposure, creating weak zones for rapid shear propagation. Cylinders distributed compressive stresses more evenly, making them less vulnerable to temperature-induced microcracking. A quantitative comparison displayed in Figure 18, was made between the experimental compressive strength of thermally shocked concrete and the theoretical values predicted using the empirical relation recommended in IS 456:2000, expressed as: Characteristic compressive strength (fck) = 0.446 × cube compressive strength (fcu). The theoretical values obtained using this relation were compared with the experimentally measured strengths of control and thermally shocked specimens. The statistical correlation between experimental and theoretical data yielded a coefficient of determination (R2 = 0.93), indicating excellent agreement and validating the reliability of the experimental results. Minor deviations observed at higher temperature exposure levels are attributed to microstructural deterioration and non-uniform heat transfer, as confirmed by FESEM and XRD analyses. This correlation supports the consistency and accuracy of the experimental findings.
-
c)
Moisture Loss and Microcracking: The higher surface area-to-volume ratio in cubes led to faster moisture loss, promoting wider cracks after heating. Heat also weakened the matrix cohesion, allowing cracks to merge suddenly and cause brittle failure. In cylinders, although heat weakened the matrix, the failure progressed more gradually. A statistical correlation analysis displayed in Figure 19, between mass loss (%) and compressive strength reduction (%) for the thermally shocked specimens was conducted. Strength Reduction (%) = 4.21 X Mass Loss (%) + 5.34, with a coefficient of determination (R2 = 0.91), indicating a highly reliable correlation between the two parameters. This demonstrates that as the concrete loses mass primarily due to moisture evaporation, microcracking, and decomposition of C–S–H and CH, its load-bearing capacity decreases proportionally. The observed linear trend confirms that mass loss is a reliable indicator of thermal damage severity. These findings are consistent with the observations [28] and [27], which reported similar trends in fire-exposed concretes subjected to rapid cooling.
-
d)
Failure Mode: Cubes primarily failed through brittle shear cracking, which intensified after thermal damage. Fine surface cracks developed during heating and cooling, and under compression, cracks initiated near the mid-height and propagated diagonally at approximately 45° to the load axis, forming an crisscross fracture pattern. The cube often split into two wedge-shaped pieces. In contrast, cylinders exhibited gradual splitting failure, tolerating heat-induced microcracks more effectively. Fine longitudinal cracks appeared along their height and widened progressively under load, leading to eventual splitting into two or three vertical segments while retaining some post-peak load-bearing capacity due to friction between the split sections.


3.9. Relationship between tensile and compressive strength after exposure to thermoshock
The control specimens showed strength values consistent with M20-grade concrete, confirming the reliability of the testing procedure [12, 53]. The results clearly distinguished the effects of thermal shock on compressive and tensile properties. Controlled cubes averaged 23.26 N/mm2, which reduced to 15.00 N/mm2 after thermal exposure, retaining about 65% of their original strength. Cylinders showed a smaller loss, from 21.84 N/mm2 to 18.02 N/mm2 (82% retention). In contrast, split tensile strength declined from 2.19 N/mm2 to 1.61 N/mm2, retaining only 73% of the initial capacity, indicating that tensile strength deteriorates more rapidly than compressive strength under elevated temperatures. This greater loss is attributed to microcrack formation and propagation that reduce the effective cross-sectional area under tension [51].
The differential degradation arises from thermal incompatibility between aggregates and cement paste, which weakens the interfacial transition zone (ITZ). Because tensile strength depends on bond continuity, even minor microstructural damage causes substantial reduction [52]. Compressive strength, however, benefits from aggregate interlock and confinement, allowing partial stress transfer after cracking. These results agree with previous findings [56, 57, 58, 59, 60, 61], showing that the tensile-to-compressive strength ratio drops from about 0.10 at ambient temperature to 0.06–0.07 after heating to 600 °C. The current outcomes confirm that tensile degradation is typically 10–20% greater than compressive loss under similar conditions [7, 11, 32].
Overall, compressive strength decreased moderately (22–43%), whereas tensile and flexural strengths fell more sharply (27–50%), demonstrating the higher sensitivity of surface-dependent properties to temperature-induced microcracking and bond deterioration. Thermal gradients generate tensile stresses that accelerate cracking, while compression loads remain partly supported by confined zones. Flexural strength is most affected since surface cracks at the tension face critically reduce moment capacity. Consequently, post-fire performance is governed by the preservation of tensile integrity rather than compressive capacity. Therefore, rehabilitation and retrofitting efforts should prioritize restoring tensile and bond strength to ensure adequate ductility and seismic resilience in thermally damaged RC structures [62].
3.10. Practical implications and post-fire repair strategies
The experimental and microstructural findings of this study have direct implications for the assessment and rehabilitation of fire-damaged concrete structures. The observed degradation in C–S–H and CH phases, accompanied by the formation of porous and brittle phases (AN, CC), demonstrates that rapid cooling after fire exposure results in irreversible strength loss and bond failure within the concrete matrix. These effects are critical when evaluating the residual capacity of load-bearing members such as columns, beams, and slabs in post-fire conditions. In practical terms, the strong correlation (R2 = 0.91) between mass loss and compressive strength reduction provides a simple, quantifiable indicator for on-site damage assessment, allowing engineers to estimate residual strength based on measured mass loss or visual deterioration.
For post-fire repair, surface re-profiling and deep crack injection using polymer-modified mortars or epoxy resins can help restore structural continuity in moderately damaged members. Severely degraded components exhibiting significant C–S–H decomposition or spalling should be considered for sectional replacement or jacketing using Fiber-reinforced polymer (FRP) or steel encasement systems. Additionally, re-curing and application of pozzolanic coatings (e.g., silica fume or fly ash-based) can partially restore alkalinity and limit further carbonation of thermally affected zones. These strategies align with post-fire rehabilitation guidelines outlined in ACI 562 (2019) and IS 456:2000, providing a practical framework for assessing and improving the safety, serviceability, and durability of fire-exposed concrete structures [63, 64, 65, 66, 67, 68].
3.11. Societal importance of the study
Concrete structures exposed to fire often undergo severe thermal degradation, resulting in loss of strength and durability. Yet, the residual capacity of such fire-affected elements remains uncertain, frequently leading to unnecessary demolition instead of repair or reuse. This study addresses that gap by experimentally quantifying the loss of compressive and tensile strength in concrete subjected to controlled thermal shock, simulating real fire exposure where only one surface is directly heated. Unlike conventional furnace tests, which heat specimens uniformly, this approach replicates directional heating and rapid cooling typical of real fires. The findings provide reliable data for assessing post-fire residual strength and support decisions on repair, retrofitting, and reuse of damaged structures. Moreover, the derived strength reduction patterns can enhance numerical modelling in ANSYS for predicting post-fire performance. Ultimately, this research promotes safer, more sustainable, and economically viable approaches to managing fire-affected, thermally shocked concrete infrastructures.
4. CONCLUSIONS
Through extensive experimental investigation, this study elucidated the mechanisms and extent of thermal shock damage in concrete. In contrast to earlier furnace-heating studies reporting gradual strength degradation beyond 300 °C and significant losses between 500–600 °C [52, 69], the present fire exposure produced steeper thermal gradients and more severe deterioration. The recorded temperature time profile closely followed the ISO 834 standard fire curve for up to 90 minutes, confirming realistic exposure conditions, while subsequent rapid cooling simulated true thermal shock. Internal temperature gradients ranging from approximately 489 °C near the heated face to 282 °C at 130 mm depth generated high internal stresses, extensive microcracking, and matrix damage. Mechanical testing revealed marked reductions in strength and mass: compressive (42.86%), tensile (26.88%), flexural (50.06%), and weight loss (up to 10.22%), consistent with prior reports of intensified damage under quenching [62]. XRD analysis indicated a phase transformation from Albite (NaAlSi3O8) to Anorthite (CaAl2Si2O8), corroborating severe mineralogical alteration and C–S–H gel decomposition [29, 51, 52]. FESEM images further confirmed the pronounced microstructural deterioration in thermally shocked specimens. Strong correlations between experimental and theoretical compressive strengths (R2 = 0.93) and between mass loss and strength reduction (R2 = 0.91) [27, 28] validate the reliability of the results and confirm mass loss as a dependable indicator of fire-induced damage. Overall, thermal shock critically impairs both mechanical and microstructural integrity, underscoring the need for enhanced fire-resistant materials or protective systems to mitigate rapid degradation under real fire conditions.
5. BIBLIOGRAPHY
- [1] PHAN, L.T. Fire performance of high-strength concrete: a report of the state-of-the-art, NISTIR 5934, Building and Fire Research Laboratory, National Institute of Standards and Technology, Gaithersburg, 1996.
-
[2] SCHNEIDER, U., “Concrete at high temperatures: a general review”, Fire Safety Journal, v. 13, n. 1, pp. 55–68, 1988. doi: https://doi.org/10.1016/0379-7112(88)90033-1.
» https://doi.org/10.1016/0379-7112(88)90033-1 - [3] CHAN, Y.N., PENG, G.F., ANSON, M., “Fire behaviour of high-performance concrete made with silica fume at various moisture contents”, ACI Materials Journal, v. 96, pp. 405–409, 1999. http://worldcat.org/oclc/13846872, accessed in November, 2025.
-
[4] KALIFA, P., CHENE, G., GALLE, C., “High-temperature behaviour of HPC with polypropylene fibres from spalling to microstructure”, Cement and Concrete Research, v. 31, n. 10, pp. 1487–1499, 2001. doi: https://doi.org/10.1016/S0008-8846(01)00596-8.
» https://doi.org/10.1016/S0008-8846(01)00596-8 -
[5] BENTZ, D.P., “Fibers, percolation and spalling of high-performance concrete”, ACI Materials Journal, v. 97, pp. 3519, 2000. https://www.researchgate.net/publication/234155149_Fibers_Percolation_and_Spalling_of_HighPerformance_Concrete, accessed in November, 2025.
» https://www.researchgate.net/publication/234155149_Fibers_Percolation_and_Spalling_of_HighPerformance_Concrete -
[6] CHAN, Y.N., PENG, G.F., ANSON, M., “Residual strength and pore structure of high-strength concrete and normal strength concrete after exposure to high temperatures”, Cement and Concrete Composites, v. 23, n. 1, pp. 23–27, 1999. doi: https://doi.org/10.1016/S0958-9465(98)00034-1.
» https://doi.org/10.1016/S0958-9465(98)00034-1 -
[7] BOTTE, W., CASPEELE, R., “Post-cooling properties of concrete exposed to fire”, Fire Safety Journal, v. 92, pp. 142–150, 2017. doi: https://doi.org/10.1016/j.firesaf.2017.06.010.
» https://doi.org/10.1016/j.firesaf.2017.06.010 - [8] LUO, X., SUN, W., CHAN, S.Y.N., “Effect of heating and cooling on residual strength and microstructure of normal strength and high-performance concrete”, Cement and Concrete Research, v. 30, pp. 379–383, 2000.
- [9] ISHIHARA, S., GSHIMA, T., NOMURA, K., “Crack propagation behaviour of cermets and cemented carbides under repeated thermal shocks by the improved quench test”, Journal of Materials Science, v. 34, pp. 629–636, 1999.
-
[10] PENG, G.F., BIAN, S.H., GUO, Z.Q., et al., “Effect of thermal shock due to rapid cooling on residual mechanical properties of fibre concrete exposed to high temperatures”, Construction & Building Materials, v. 22, n. 5, pp. 948–955, 2008. doi: https://doi.org/10.1016/j.conbuildmat.2006.12.002.
» https://doi.org/10.1016/j.conbuildmat.2006.12.002 -
[11] HERTZ, K.D., “Concrete strength for fire safety design”, Magazine of Concrete Research, v. 57, n. 8, pp. 445–453, 2005. doi: https://doi.org/10.1680/macr.2005.57.8.445.
» https://doi.org/10.1680/macr.2005.57.8.445 - [12] BUREAU OF INDIAN STANDARDS, IS 456:2000 Code of Practice for Plain and Reinforced Concrete (Third revision), New Delhi, BIS, 2000.
- [13] BUREAU OF INDIAN STANDARDS, IS 516:1959 Method of test for strength of concrete, New Delhi, BIS, 1959.
- [14] NATARAJA, C., DHANG, N., GUPTA, A.P., “Splitting tensile strength of SFRC”, Indian Concrete Journal, v. 75, n. 4, pp. 287–290, 2001.
-
[15] MA, Z., YAO, P., YANG, D., et al., “Jiaxin Shena, “Effects of fire-damaged concrete waste on the properties of its preparing recycled aggregate, recycled powder and newmade concrete””, Journal of Materials Research and Technology, v. 15, pp. 1030–1045, 2021. doi: https://doi.org/10.1016/j.jmrt.2021.08.116.
» https://doi.org/10.1016/j.jmrt.2021.08.116 -
[16] KIRAN, T., YADAV, S.K., N, A., et al, “Performance evaluation of lightweight insulating plaster for enhancing the fire endurance of high strength structural concrete”, Journal of Building Engineering, v. 57, pp. 104902, 2022. doi: https://doi.org/10.1016/j.jobe.2022.104902.
» https://doi.org/10.1016/j.jobe.2022.104902 -
[17] ABDULRAHMAN, A.S., MOHAMED, R.A.K., “Behaviour and flexural strength of fire damaged high strength reinforced rectangular concrete beams after strengthening with CFRP sheets”, Ain Shams Engineering Journal, v. 13, pp. 101767, 2022. doi: https://doi.org/10.1016/j.cscm.2021.e00779.
» https://doi.org/10.1016/j.cscm.2021.e00779 -
[18] QIN, D., GAO, P., ASLAM, F., et al., “A comprehensive review on fire damage assessment of reinforced concrete structures”, Case Studies in Construction Materials, v. 16, pp. e00843, 2022. doi: https://doi.org/10.1016/j.cscm.2021.e00843.
» https://doi.org/10.1016/j.cscm.2021.e00843 -
[19] ELBAYOMY, M.S., SALEM, H.M., “Numerical assessment of midrise multi-storey reinforced concrete framed structures subjected to fire”, Alexandria Engineering Journal, v. 58, n. 2, pp. 773–788, 2019. doi: https://doi.org/10.1016/j.aej.2019.06.007.
» https://doi.org/10.1016/j.aej.2019.06.007 -
[20] MANICA, G.C., BOLINA, F.L., TUTIKIAN, B.F., et al, “Influence of curing time on the fire performance of solid reinforced concrete plates”, Journal of Materials Research and Technology, v. 9, n. 2, pp. 2506–2512, 2020. doi: https://doi.org/10.1016/j.jmrt.2019.12.081.
» https://doi.org/10.1016/j.jmrt.2019.12.081 -
[21] KODUR, V., HIBNER, D., AGRAWAL, A., “Residual response of reinforced concrete columns exposed to design fires”, Procedia Engineering, v. 210, pp. 574–581, 2017. doi: https://doi.org/10.1016/j.proeng. 2017.11.116.
» https://doi.org/10.1016/j.proeng.2017.11.116 -
[22] LIAO, F., HUANG, Z., “ An extended finite element model for modelling localised fracture of reinforced concrete beams in fire”, Computers & Structures, v. 152, pp. 11–26, 2015. doi: https://doi.org/10.1016/j.compstruc.2015.02.006.
» https://doi.org/10.1016/j.compstruc.2015.02.006 -
[23] XIANG, K., WANG, G.-H., “Calculation of flexural strengthening of fire-damaged reinforced concrete beams with CFRP Sheets”, Procedia Engineering, v. 52, pp. 446–452, 2013. doi: https://doi.org/10.1016/j.proeng.2013.02.167.
» https://doi.org/10.1016/j.proeng.2013.02.167 -
[24] CVETKOVSKA, M., KNEZEVIC, M., et al., “Fire scenario influence on fire resistance on reinforced concrete frame structure”, Procedia Engineering, v. 211, pp. 28–35, 2018. doi: https://doi.org/10.1016/j.proeng.2017.12.134.
» https://doi.org/10.1016/j.proeng.2017.12.134 -
[25] BALAJI, A., NAGARAJAN, P., PILLAI, T.M.M., “Predicting the response of reinforced concrete slab exposed to fire and validation with IS456 and Eurocode 2 provisions”, Alexandria Engineering Journal, v. 55, n. 3, pp. 2699–2707, 2016. doi: https://doi.org/10.1016/j.aej.2016.06.005.
» https://doi.org/10.1016/j.aej.2016.06.005 -
[26] TURKOWSKIA, P., ŁUKOMSKIA, M., SULIKA, P., et al., “Fire Resistance of CFRP-strengthened reinforced concrete beams under various load levels”, Procedia Engineering, v. 172, pp. 1176–1183, 2017. doi: https://doi.org/10.1016/j.proeng.2017.02.137.
» https://doi.org/10.1016/j.proeng.2017.02.137 -
[27] ARIOZ, O., “Effects of elevated temperatures on properties of concrete”, Fire Safety Journal, v. 42, n. 8, pp. 516–522, 2007. doi: https://doi.org/10.1016/j.firesaf.2007.01.003.
» https://doi.org/10.1016/j.firesaf.2007.01.003 -
[28] HAGER, G., “ Behaviour of cement concrete at high temperature”, Bulletin of the Polish Academy of Sciences. Technical Sciences, v. 61, n. 1, pp. 145–154, 2013. doi: https://doi.org/10.2478/bpasts-2013-0013.
» https://doi.org/10.2478/bpasts-2013-0013 -
[29] HUSEM, M., “The effects of high temperature on compressive and flexural strengths of ordinary and high-performance concrete”, Fire Safety Journal, v. 41, n. 2, pp. 155–163, 2006. doi: https://doi.org/10.1016/j.firesaf.2005.12.002.
» https://doi.org/10.1016/j.firesaf.2005.12.002 -
[30] KIZILKANAT, A.B., YÜZER, N., KABAY, N., “Thermo-physical properties of concrete exposed to high temperature”, Construction & Building Materials, v. 45, pp. 157–161, 2013. doi: https://doi.org/10.1016/j.conbuildmat.2013.03.080.
» https://doi.org/10.1016/j.conbuildmat.2013.03.080 -
[31] KODUR, V.K.R. “Spalling in high strength concrete exposed to fire: concerns, causes, critical parameters and cures”, In: Structures Congress 2000: Advanced Technology in Structural Engineering, pp. 1–9, Philadelphia, May 2000. doi: https://doi.org/10.1061/40492(2000)180.
» https://doi.org/10.1061/40492(2000)180 - [32] WAGHMARE, S., “Microstructural analysis of M30 grade concrete using Scanning Electron Microscopy (SEM) method”, International Journal of Engineering Research and Applications, v. 10, n. 5, pp. 65–71, 2020.
-
[33] GRAVIT, M., ZIMIN, S., LAZAREV, Y., et al. “Fire simulation of bearing structures for natural gas module plant”, In: VIII International Scientific Siberian Transport Forum (Trans Siberia 2019), pp. 1–12, Novosibirsk, May 2020. doi: https://doi.org/10.1007/978-3-030-37919-3_36.
» https://doi.org/10.1007/978-3-030-37919-3_36 - [34] SINGH, V., SINGH, J., “Effect of Fire on R.C.C. Structures”, International Journal of Engineering, Management, Humanities and Social Sciences Paradigms, v. 30, n. 2, pp. 47–50, 2018.
-
[35] SHYAMALA, G., MAHESH, V., RAJESH KUMAR, K., et al., “Thermal behavior of Concrete subjected to elevated temperature: Case Studies”, IOP Conference Series. Materials Science and Engineering, v. 981, n. 3, pp. 032068, 2020. doi: https://doi.org/10.1088/1757-899X/981/3/032068.
» https://doi.org/10.1088/1757-899X/981/3/032068 -
[36] INGASON, H., “Design fire curves for tunnels”, Fire Safety Journal, v. 44, n. 2, pp. 259–265, 2009. doi: https://doi.org/10.1016/j.firesaf.2008.06.009.
» https://doi.org/10.1016/j.firesaf.2008.06.009 -
[37] CHATURVEDI, S., VEDRTNAM, A., YOUSSEF, M.A., et al., “Fire-resistance testing procedures for construction elements: a review”, Fire, v. 6, n. 1, pp. 5, 2023. doi: https://doi.org/10.3390/fire6010005.
» https://doi.org/10.3390/fire6010005 -
[38] AYDIN, S., BARADAN, B., “Effect of pumice and fly ash incorporation on high temperature resistance of cement based mortars”, Cement and Concrete Research, v. 37, n. 6, pp. 988–995, 2007. doi: https://doi.org/10.1016/j.cemconres.2007.02.005.
» https://doi.org/10.1016/j.cemconres.2007.02.005 -
[39] ULAGAMBIKA, P., MURUGAN, M., “Behaviour of fire damaged cement and geopolymer concrete slabs under static and impact loading”, Matéria, v. 29, n. 2, pp. 4711, 2024. doi: https://doi.org/10.1590/1517-7076-rmat-2024-0033.
» https://doi.org/10.1590/1517-7076-rmat-2024-0033 -
[40] SOUZA, A., MORENO, A.L., “Effect of high temperatures on the compressive strength, tensile strength, and modulus of elasticity of concrete”, Revista IBRACON de Estruturas e Materiais, v. 3, n. 4, pp. 432–448, 2010. doi: https://doi.org/10.1590/S1983-41952010000400005.
» https://doi.org/10.1590/S1983-41952010000400005 -
[41] FERNANDES, B., GIL, A.M., BOLINA, F.L., et al., “Microstructure of concrete subjected to elevated temperatures: physico-chemical changes and analysis techniques”, Revista IBRACON de Estruturas e Materiais, v. 10, n. 4, pp. 838–863, 2017. doi: https://doi.org/10.1590/s1983-41952017000400004.
» https://doi.org/10.1590/s1983-41952017000400004 -
[42] PEREIRA, E., BRIK, E.M.J., PEREIRA, E., et al., “Physical, mechanical, and microstructural changes in concretes subjected to slow and fast cooling in a fire situation simulation”, Ambiente Construído, v. 24, pp. e133620, 2024. doi: https://doi.org/10.1590/s1678-86212024000100756.
» https://doi.org/10.1590/s1678-86212024000100756 -
[43] SEGALIN, L.Z., BALESTRA, C.E.T., SAVARIS, G., et al., “Effect of cooling method on concrete compressive strength after exposure to high temperatures”, Semina. Ciências Exatas e Tecnológicas, v. 41, n. 1, pp. 13–20, 2020. doi: https://doi.org/10.5433/1679-0375.2020v41n1p13.
» https://doi.org/10.5433/1679-0375.2020v41n1p13 - [44] AMERICAN SOCIETY FOR TESTING AND MATERIALS, ASTM E119 Standard Test Methods for Fire Tests of Building Construction and Materials, West Conshohocken, ASTM, 2000.
- [45] BUREAU OF INDIAN STANDARDS, IS 3809: Fire resistance test for structures, New Delhi, BIS, 1979.
-
[46] BENEŠ, M., ŠTEFAN, R. “Hygro-thermo-mechanical analysis of spalling in concrete walls at high temperatures as a moving boundary problem”, Computational Engineering, Finance, and Science, v. 1, arXiv:1401.1152, 2014. doi: https://doi.org/10.48550/arXiv.1401.1152.
» https://doi.org/10.48550/arXiv.1401.1152 -
[47] WANG, H., LV, N., LU, Z., et al., “Experimental study on mechanical properties and breakage of high temperature carbon fiber-bar reinforced concrete under impact load”, Scientific Reports, v. 14, n. 1, pp. 20566, 2024. doi: https://doi.org/10.1038/s41598-024-71292-8. PubMed PMID:39232076.
» https://doi.org/10.1038/s41598-024-71292-8 -
[48] DANYANG, S., CHUANLONG, H., XIE, L., et al., “Experimental study on pore structure and dynamic mechanical properties of different types of fiber reinforced concrete after elevated temperature action”, Scientific Reports, v. 15, n. 1, pp. 34005, 2025. doi: https://doi.org/10.1038/s41598-025-13409-1. PubMed PMID:41028174.
» https://doi.org/10.1038/s41598-025-13409-1 -
[49] NASER, M.Z., SEITLLARI, A., “Concrete under fire: an assessment through intelligent pattern recognition”, Engineering with Computers, v. 36, n. 4, pp. 1915–1928, 2019. doi: https://doi.org/10.1007/s00366-019-00805-1.
» https://doi.org/10.1007/s00366-019-00805-1 -
[50] KHOURY, G.A., “Effect of fire on concrete and concrete structures”, Progress in Structural Engineering and Materials, v. 2, n. 4, pp. 429–447, 2001. doi: https://doi.org/10.1002/pse.51.
» https://doi.org/10.1002/pse.51 -
[51] CHEN, B., LI, C., CHEN, L., “Experimental study of mechanical properties of normal-strength concrete exposed to high temperatures at an early age”, Fire Safety Journal, v. 44, n. 7, pp. 997–1002, 2009. doi: https://doi.org/10.1016/j.firesaf.2009.06.007.
» https://doi.org/10.1016/j.firesaf.2009.06.007 -
[52] THANARAJ, D.P., KIRAN, T., KANAGARAJ, B., et al., “Influence of heating–cooling regime on the engineering properties of structural concrete subjected to elevated temperature”, Buildings, v. 13, n. 2, pp. 295, 2023. doi: https://doi.org/10.3390/buildings13020295.
» https://doi.org/10.3390/buildings13020295 - [53] NEVILLE, A.M., Properties of Concrete, 5 ed., Harlow, Pearson Education Limited, 2011.
-
[54] OJALA, T., AHMED, H., KUUSELA, P., et al., “Monitoring of concrete segregation using AC impedance spectroscopy”, Construction & Building Materials, v. 384, pp. 131453, 2023. doi: https://doi.org/10.1016/j.conbuildmat.2023.131453.
» https://doi.org/10.1016/j.conbuildmat.2023.131453 -
[55] GEORGALI, B., TSAKIRIDIS, P.E., “Microstructure of fire-damaged concrete: a case study”, Cement and Concrete Composites, v. 27, n. 2, pp. 255–259, 2005. doi: https://doi.org/10.1016/j.cemconcomp.2004.02.022.
» https://doi.org/10.1016/j.cemconcomp.2004.02.022 -
[56] KHOURY, G.A., “Compressive strength of concrete at high temperatures: a reassessment”, Magazine of Concrete Research, v. 44, n. 161, pp. 291–309, 1992. doi: https://doi.org/10.1680/macr.1992.44.161.291.
» https://doi.org/10.1680/macr.1992.44.161.291 - [57] PHAN, L.T., PHAN, L.T, “Fireperformance of high-strength concrete: a report of NIST’s tests (NISTIR 5934)”, National Institute of Standards and Technology, Gaithersburg, 1996.
-
[58] BABALOLA, O.E., AWOYERA, P.O., LE, D.-H., et al., “A review of residual strength properties of normal and high strength concrete exposed to elevated temperatures”, Construction & Building Materials, v. 296, pp. 123448, 2021. doi: https://doi.org/10.1016/j.conbuildmat.2021.123448.
» https://doi.org/10.1016/j.conbuildmat.2021.123448 -
[59] RESENDE, H.F., REIS, E.D., ARROYO, F.N., et al., “Residual mechanical properties and durability of high performance concrete after elevated temperatures”, Materials, v. 15, n. 13, pp. 4711, 2022. doi: https://doi.org/10.3390/ma15134711. PubMed PMID:35806836.
» https://doi.org/10.3390/ma15134711 -
[60] SHAHRAKI, M., “Residual compressive strength of concrete after exposure to high temperatures (data synthesis)”, Fire Safety Journal, v. 135, pp. 103698, 2023. doi: https://doi.org/10.1016/j.firesaf.2022.103698.
» https://doi.org/10.1016/j.firesaf.2022.103698 -
[61] HERTZ, K., “Concrete strength for fire safety design”, Magazine of Concrete Research, v. 57, n. 8, pp. 445–453, 2005. doi: https://doi.org/10.1680/macr.2005.57.8.445.
» https://doi.org/10.1680/macr.2005.57.8.445 -
[62] FEHÉRVÁRI, S., “Effect of cooling methods on the residual properties of concrete exposed to elevated temperature”, Results in Engineering, v. 16, pp. 100797, 2022. doi: https://doi.org/10.1016/j.rineng.2022.100797.
» https://doi.org/10.1016/j.rineng.2022.100797 -
[63] DYSON, C., RAJAGOPAL, V.S.G., “Fortifying flames: boosting concrete fire resistance with hybrid fiber polymers”, Matéria, v. 29, n. 3, pp. e20240424, 2024. doi: https://doi.org/10.1590/1517-7076-rmat-2024-0424.
» https://doi.org/10.1590/1517-7076-rmat-2024-0424 -
[64] ULAGAMBIKA, P., MURUGAN, M., “Performance of fire damaged cement and geopolymer concrete slabs retrofitted with BFRP laminates under static loading”, Matéria, v. 29, n. 2, pp. e20240015, 2024. doi: https://doi.org/10.1590/1517-7076-rmat-2024-0015.
» https://doi.org/10.1590/1517-7076-rmat-2024-0015 -
[65] MALAYALI, A.B., R, V., ALHARBI, S.A., et al., “Hybridization of concrete by the inclusions of kaolin, alumina and silica fume: performance evaluation”, Heliyon, v. 10, n. 9, pp. e30674, 2024. doi: https://doi.org/10.1016/j.heliyon.2024.e30674. PubMed PMID:38765105.
» https://doi.org/10.1016/j.heliyon.2024.e30674 -
[66] FELIZARDO, V., NANDI, V.S., DONADEL, K., et al., “ Desenvolvimento de geopolímeros de baixa condutividade térmica”, Matéria, v. 21, n. 2, 429–436, 2016, doi: 10.1590/S1517-707620160002.0040.
» https://doi.org/10.1590/S1517-707620160002.0040 -
[67] MARZAK, M., SERROUKH, K., et al., “Thermal analysis of rubber concrete under the effect of two heat treatments: shock temperature and standard fire”, Journal of Thermal Analysis and Calorimetry, v. 148, n. 21, pp. 11535–11548, 2023. doi: https://doi.org/10.1007/s10973-023-12513-6.
» https://doi.org/10.1007/s10973-023-12513-6 -
[68] KANDASWAMY, S., SUNDARAM, H., RAJAMANICKAM, S., et al., “Durability of high-performance concrete at high temperatures: effects of water–binder ratios and use of silica fume”, Matéria, v. 30, pp. e20240704, 2025. doi: https://doi.org/10.1590/1517-7076-rmat-2024-0704.
» https://doi.org/10.1590/1517-7076-rmat-2024-0704 -
[69] PASZTETNIK, M., WRÓBLEWSKI, R., “A literature review of concrete ability to sustain strength after fire exposure based on the heat accumulation factor”, Materials, v. 14, n. 16, pp. 4719, 2021. doi: https://doi.org/10.3390/ma14164719. PubMed PMID:34443241.
» https://doi.org/10.3390/ma14164719