 Influence of microhardness on the abrasion resistance of cement pastes with bauxite residue
Abstract
The abrasion resistance of cementitious materials can be influenced by many factors, and hardness is one of the main ones. In concrete, the cement matrix usually has the lowest resistance when compared with that of the aggregates. To reduce costs and CO2 emissions, the cement industry usually includes supplementary materials in the cement composition. Bauxite residue (BR) emerges as a promising material for use as a filler in cementitious materials due to its chemical composition. Brazil annually generates between 11 and 16.5 million tons of BR, being the third-largest alumina producer in the world. While a projection of 10 billion tons of BR may have been accumulated by 2050, a maximum of 5 million tons of bauxite residue is recycled each year, mainly due to potential health risks and irreversible environmental impacts. With the aim of understanding the effect of BR insertion in cementitious elements, this study investigated the microhardness and its relationship with the abrasion resistance of cement matrices with insertion (as addition or replacement of the cement) of 15% and 30% g/g of BR “in natura”. Since the water-to-cement and water-to-solids ratios strongly influence the cement matrix properties, the results showed an increase in the studied properties when BR is inserted as an addition to the pastes, and some reduction when BR replaces cement. In the replacement, however, the properties did not reduce in the same proportion as the cement was removed from the mixture. Finally, it is possible to observe that there is a correlation between microhardness and the compressive and the abrasion resistance of the cement matrices. Therefore, the results of both the replacement and addition of BR in cement show potential applications of BR in cementitious components.
Keywords:
microhardness; microindentation; abrasion resistance; bauxite residue; red mud
Resumo
A resistência à abrasão de materiais cimentícios pode ser influenciada por diversos fatores, e a dureza é considerada um dos principais. Em concretos, a pasta de cimento costuma ter a menor resistência. Para reduzir custos e emissões de CO2, a indústria cimenteira incorpora materiais suplementares à composição do cimento. Quanto à sua composição química, o resíduo de bauxita (BR) apresenta-se como um material promissor para uso como fíler em materiais cimentícios. O Brasil gera anualmente entre 11 e 16,5 milhões de toneladas de BR, sendo o terceiro maior produtor de alumina do mundo. Embora se projete um acúmulo de 10 bilhões de toneladas de resíduos de bauxita até 2050, no máximo 5 milhões de toneladas desse resíduo são recicladas anualmente, principalmente devido aos riscos potenciais à saúde e aos impactos ambientais irreversíveis. Com o objetivo de verificar o efeito da inserção de BR em elementos cimentícios, este trabalho estudou a microdureza e sua relação com a resistência à abrasão de pastas de cimento com 15% e 30% de BR “in natura”, adicionado ou substituído. Uma vez que as propriedades mecânicas de pastas são fortemente influenciadas pelas relações água-cimento e água-sólidos, os resultados mostraram aumento nas propriedades estudadas quando o BR é adicionado às pastas e alguma redução quando o cimento é substituído por BR. Na substituição, entretanto, as propriedades não se reduziram na mesma proporção em que o cimento foi retirado da mistura. Por fim, é possível perceber que há correlação entre a microdureza e as resistências à compressão e à abrasão das pastas. Os resultados, tanto de substituição quanto de adição, evidenciam o potencial de aplicação do BR em componentes cimentícios.
Palavras-chave:
microdureza; microindentação; resistência à abrasão; resíduo de bauxita; lama vermelha
1 INTRODUCTION
Brazil contains the fifth-largest bauxite reserve in the world, with approximately 2.7 billion tons. In 2024, the country was the third-largest alumina producer, with an estimated production of 11 million tons (8% of global production) [1]. The bauxite market was negatively impacted in 2020 due to the COVID-19 pandemic; however, from 2021 onwards, it began to recover, and it is estimated to grow at an annual rate of 3.81% between 2024 and 2029 [2]. While a projection of 10 billion tons of BR may have been accumulated by 2050 [3], a maximum of 5 million tons of bauxite residue is recycled each year [4].
Bauxite residue (BR; also known as red mud) is generated during the beneficiation process of bauxite ore for alumina extraction, the primary raw material in aluminum production. It is estimated that for each ton of alumina produced, between 1 and 1.5 tons of BR are generated, although this average can vary significantly among different refineries worldwide [5].
Globally, BR is permanently stored each year due to its potential health hazards and irreversible environmental impacts, as its high alkalinity and heavy metal content can lead to water and soil contamination, as well as the degradation of fauna, flora, and aquatic ecosystems. Developing products that incorporate this residue could generate positive environmental impacts while also fostering a new market, creating jobs, and promoting social and economic development. This would increase the maximum of 5 million tons of BR annually recycled [3], [4].
Literature indicates that cementitious materials and components for civil construction are a promising sector for the application of BR [3], [6] –[9]. Despite the high alkalinity of BR, its mineralogical composition, predominantly composed of iron, aluminum, and silicon, can exhibit positive chemical interactions with Portland cement. Thus, BR can be used in cementitious compositions both as filler and as supplementary cementitious material [10].
When it comes to cementitious applications, concrete floors are widely used, and in this context, surface abrasion wear is one of the main deterioration mechanisms [11], [12]. Despite its technological significance in engineering materials, abrasion analysis is complex due to the simultaneous occurrence of several phenomena [13] –[16].
Concrete is a multiphase material, and its surface properties have a combined effect of factors due to differences in the properties of each material that constitutes its phases: coarse and fine aggregates typically exhibit the highest hardness, while the cement matrix and transition zone exhibit the lowest [17], [18]. The higher the water-to-solid ratio, the higher the difference between the cement matrix and the aggregates' microhardness. As the cement matrix is the first phase to come into contact with abrasive wear and is known to be the phase with the lowest hardness, the present study analyzed the abrasion resistance of cementitious matrices with the aim of contributing to research on concrete.
Standardized procedures for determining abrasion resistance have been published in several countries; however, the methodologies differ significantly, and no tests fully evaluate conditions in a completely standardized manner [19]. Therefore, this study adopts the testing methodology outlined in the concrete floors standard (NBR 9781, 2013) [20], but proposes that the analysis be conducted by standardizing the calculation of volume loss in cement pastes after abrasive wear. Silva et al. [21] investigated the abrasion resistance of concrete and confirmed that surface properties, such as macro and microscale hardness, can have even greater influence on abrasion resistance than mechanical properties of the composites already well-documented in the literature, such as compressive and tensile strength.
The instrumented indentation technique is considered an advancement over the traditional hardness determination methods, as it allows the measurement of applied force and penetration depth throughout the entire deformation process (plastic and elastic). Recognizing its significance, studies on the microhardness of cement pastes have been increasing; however, to date, only one study has been identified that analyzes cement pastes containing BR [22].
The present work aims to analyze the microhardness behavior and its relationship with the abrasion resistance (and compression strength) of cement pastes incorporating BR. Furthermore, to enhance feasibility and simplify its application, this study proposes the use of BR “in natura” in cementitious compositions, meaning BR without any prior treatment such as drying, grinding, or calcination, a low-cost recycling process.
2 EXPERIMENTAL PROGRAM
To understand the influence of microhardness on the abrasion resistance of cement pastes with bauxite residue (BR), the experimental program was divided into two stages (Figure 1). First of all, a reference paste was produced with a water-to-cement ratio (w/c) of 0.42. On the first stage, 15% and 30% of the cement mass was replaced by BR, maintaining a fixed water-to-solid ratio (w/s) of 0.42 while varying w/c; in the second stage, the same amount of BR was added while keeping w/c fixed at 0.42, resulting in variations in the w/s ratio.

2.1 Materials
In this study, cement, water, bauxite residue (BR), and a multifunctional plasticizer admixture were used. The ordinary Portland cement (OPC), classified as CPV in Brazil, was chosen due to its lower content of mineral admixture (< 10% by mass of limestone filler [23]) compared to other commercial cements. The BR was collected from the plant of an alumina production industry located in Brazil. The plasticizer used in this work, according to the supplier, is classified primarily as a water reducer and secondly as a set time retarder, according to NBR 11768 [24].
Table 1 presents the physical properties of the materials. From them, the density was determined in a gas He pycnometer, Micromeritics – AccuPyc II 1340. Figure 2 illustrates the particle size distribution of the cement and BR, which were evaluated in a Helos (Sympatec) laser granulometry using water as the medium [25]. Table 2 presents their chemical compositions (chemical species in the form of oxides) determined by X-ray fluorescence (XRF) in a PANalytical spectrometer, Zetium model. Finally, Figure 3 presents the XRD of the BR determined by X-ray diffraction (XRD), PANalytical diffractometer, Empyrean III model. All the characterization was performed in the laboratories of the University of São Paulo, and more details on the characterization methods can be obtained in [10], [26].

Percentage volume by granulometric class (a) and cumulative volume (b) of the cement and of the BR used in this work

Mineralogical composition (XRD) of bauxite residue. A (Anatase), Gb (Gibbsite), Go (Goethite), He (Hematite), K (Kaolinite), Qz (Quartz), R (Rutile), S (Sodalite).
Due to its finer particles compared to the cement used, BR has the potential to act as a filler, meaning a material capable of filling voids left by larger particles, in this case, the cement. This effect can be exploited to improve the packing of the paste. However, due to its high iron content, its higher density can interfere with rheological behavior. The high sodium content is another factor that deserves attention, as if BR is not associated with the appropriate cement, it may result in significant alkali leaching into the environment. Additionally, this was used as a limiting factor for the quantity of BR in the compositions of the study.
2.2 Preparation of mixtures
A mechanical mixer was used to produce the pastes. For the pastes containing BR, the dry materials (cement and BR) were first mixed, followed by the addition of water and diluted plasticizer (0.65% of the cement mass). The same mixing time of five minutes was ensured for all pastes, and then they were placed into molds. The compaction was performed gently on a vibrating table for 30 seconds to remove entrapped air and reduce the occurrence of molding defects. During the first 24 hours, the pastes were kept in an environment with approximately 90% relative humidity using sealed plastic bags containing water-filled cups. After this period, the specimens were demolded, identified, and immersed in water for 28 days in a wet curing chamber.
Table 3 and Figure 4 indicate the mix proportions of each paste (containing cement, bauxite residue, and water) and their w/c and w/s ratios. The reference paste composed of cement and water were designated as “CEM” and pastes incorporating BR were labeled as “ABR” or “SBR,” indicating addition or substitution, respectively; the percentage in the nomenclature represents the mass fraction of BR added relative to the cement mass; the final numbers in their nomenclature indicate the w/s ratio (in the case of cement pastes, both w/s and w/c have the same value).

2.3 Methods
2.3.1 Compressive strength
The compressive strength was determined according to Brazilian standard NBR 5739 [20], with load application adapted based on the specimen size. For each paste, at least 11 cylindrical samples were molded, measuring 25×50 mm. After 28 days immersed in water in a wet curing chamber, the samples were tested in a saturated surface-dry (SSD) condition using a universal testing machine (EMIC, model DL-10000) with a maximum capacity of 100 kN and a loading rate of 122 N/s (0.25 MPa/s). The diameters and heights of the samples were measured individually with a caliper at two different locations to calculate the force application area. Based on the failure load obtained from the test, the compressive strengths of the samples were calculated.
2.3.2 Microhardness
Microhardness was determined using instrumented indentation testing, according to ASTM E2546-07 [27] and ISO 14577-1 [28] standards. A Shimadzu ultra-microhardness tester, model DUH 211S, equipped with a Berkovich indenter (three-sided pyramid, 65.3° between the faces and the normal), was used. The equipment features sensors that allow force application ranging from 0.1 mN to 1960 mN (resolution of 0.1963 µN) and a maximum indentation depth of 10 µm. In this test, the samples are loaded up to the maximum force, the indenter is held in contact with the sample for 5 seconds, and then the unloading process is carried out slowly while the equipment records the force and depth values again. Based on this data, the load versus indentation depth curve is established, as exemplified in Figure 5a.

Standard microindentation test graph adapted from ASTM E2546-07 [27] (a) and test graph obtained in pastes of this study (b).
Microhardness (H) was calculated using Oliver-Pharr’s method [29]. The contact depth () (1) is determined from the maximum load (Fmax) and maximum depth (hmax) values and the contact stiffness (α). It can also be calculated using (the surface displacement at the contact perimeter). The projected contact area (Ac) (2) varies throughout the test depending on the loading and unloading process and can be determined based on values. The constants β and δ depend on the indenter geometry. For an ideal Berkovich indenter, these values are δ = 0.75 and β = 24.56 [30]. In this study, δ = 0.75 and β = 23.96 were used, following the equipment manual's guidelines [31]. The hardness (H) is then calculated using the maximum load value, according to (3).
The samples used in the microindentation test were cement pastes molded with BR and without BR (reference), which were cured in water in a wet chamber. The samples for microhardness tests were 55 days old because of equipment availability. It was decided to keep the samples curing until this age, then remove them from the water to prepare them for testing.
The five specimens used in the microhardness test were molded with dimensions of 50×110×15 mm. After curing, cubes of approximately 15 mm length were cut from the central region of each specimen and placed in an oven at 40 °C for 24 hours.
Subsequently, the cubes were embedded in epoxy resin, and then successive grinding was carried out using sandpapers with grits of 120, 500, and 1200. Following this, the sample was polished using diamond suspensions in kerosene with progressively finer particle sizes (6, 3, and 1 µm). At the end of the grinding process and after each polishing stage, the sample was cleaned in an ultrasonic bath for 5 minutes to remove fine debris left on the surface.
This procedure was carried out since the sample requires a flat surface and reduced roughness (to ensure proper contact) during the microindentation test. Once the preparation was completed, the samples (Figure 6) were kept in a desiccator until testing was performed.

The polyline method was used for selecting the indentation points, as mentioned in Wang et al. [32] (Figure 7). A total of 30 indentations were made on each paste. To avoid interference from the stress fields between adjacent indentations, a minimum distance of 20 µm was ensured.

As presented in Renuka et al. [33], the applied load can vary in the literature according to the material being tested. It is also seen that lower loads are applied in softer materials since the plastic formed zone tends to increase compared to harder materials. Thus, in this work, the applied load of the indenter was set at 100 mN for the CEM-042-ref, ABR15%-037, and ABR30%-033 samples, and 80 mN for SBR15%-042 and SBR30%-042. The latter had lower load values because of a higher w/c ratio (more porosity), which led to lower strength and hardness. These values were determined after several load tests and based on the research of Hay [30]. The adopted load values showed the most consistent curve and indentation shape. More details about the load determination are presented in Appendix A. It is important to note that there is no standard established for this, and the loads may vary depending on the type of sample being tested.
Figure 8 illustrates the sample (cement paste embedded in resin) fixed on the equipment before the test begins, with the 10x lens placed over it.

2.3.3 Abrasion resistance
Abrasion resistance was determined using one test method and two measurement strategies: first, according to the Brazilian standard NBR 9781 [20], and second, a new proposed method, using the worn volume, aiming for greater result precision. For each composition, at least seven specimens were tested in the saturated surface dry condition.
The Brazilian standard test used to determine the abrasion resistance is the NBR 9781 [20] and is intended for concrete pavers. The equipment used was manufactured to meet the specifications required by the standard (device illustrated in Figure 9). The sample was tested in the saturated surface-dry (SSD) condition and positioned in the equipment, keeping the surface in continuous contact with the metal cylinder. This contact is maintained under constant pressure via a counterweight system. The cylinder rotates at a steady speed while a constant flow of abrasive material (white fused aluminum oxide, F80 grit) is directed to the contact interface between the sample and the steel cylinder (100 g of abrasive material for every 100 rotations of the cylinder). The test continues for 75 revolutions of the cylinder, lasting 60 seconds.

By the end of the test, a groove forms in the sample, and the abrasion resistance is determined by measuring the width at the central position of this groove. This measurement is taken with a caliper that has a resolution of 0.1 mm.
The samples used in this work had the dimensions of 50×110×15 mm, which is different from the minimum 60 mm width specified in the standard. This decision was made to fit the sample mass inside the precision scale (resolution 0.01 g), thus using the same sample to determine the abrasion resistance by the Brazilian standard method and the worn volume.
The worn volume calculation method was proposed considering that the abrasion width could vary in the groove, and because, depending on the sample composition, the abrasion could be deeper, a value that is not considered in the results. This method was also proposed based on the ASTM C 1138 [34]. In the process, the sample mass was measured submersed immediately before and after the test. The sample volume was then calculated based on the density calculated following Archimedes' principle. The worn volume is the difference between the sample volume before and after the abrasion test.
2.3.4 Analysis of variance
One-way analysis of variance (ANOVA) with a significance level of 5% was performed to determine whether there was a treatment effect in the tests, that is, to check if the input variable significantly influenced the results. In the first analysis, the input variable analyzed was the w/s ratio, through the substitution of 15% and 30% of BR in the cement paste. In the second analysis, the variable analyzed was the w/c ratio, through the addition of 15% and 30% of BR to the cement paste. Results are presented in Appendix B.
In cases where significant differences were found (P < 0.05), a comparative test (Tukey's Test) was performed to analyze which means were different from each other.
For microhardness, ANOVA was calculated excluding some outlier values [35] without compromising the overall distribution of the results (detailed explanations later seen in section 3.3). High variability is expected when compared to the mean due to the presence of hydrated phases with higher and lower densities, anhydrous compounds, and pores in the pastes [32], [36].
3 RESULTS AND DISCUSSIONS
The results of compressive strength, microhardness, and abrasion resistance of the pastes are presented in Table 4 and are discussed in the following sections. The values given are the average of at least 11 samples for compressive strength, 30 indentations for microhardness, and at least 7 samples for abrasion, excluding the outliers. The obtained standard deviations (SD) can be considered high because the fracture behavior of cementitious materials is highly variable due to heterogeneities in crack distribution, pore size, shape, and orientation, as well as production-related factors such as particle agglomeration and bleeding. Considering this, SD values are within the expectations for cement pastes [32], [36], [37].
Mean compressive strength, microhardness, and abrasion resistance, with standard deviations in parentheses (*)
3.1 Comparison between NBR 9781 and the analysis strategy of this study o
According to NBR 9781 [20], the determination of abrasion resistance for concrete floors must be carried out by measuring the width of the worn groove formed on the specimen after the abrasive test. In this study, it is proposed that the abrasion resistance of cementitious components be determined by the worn volume of each specimen using a simple technique for determining the specimen density based on Archimedes' principle, by measuring the submerged mass and the masses before and after the test using a precision balance. Figure 10 presents the results obtained from both strategies, showing that there was a low correlation between the increase in the width of the worn groove and the increase in the worn volume (R2 = 0.17).

Comparison of two techniques for determining abrasion resistance: NBR 9781 and the strategy of this study.
3.2 Compressive strength
Figure 11 shows that when BR is incorporated into the pastes by replacing cement, the w/c ratio increases, leading to a reduction in compressive strength of 15% and 19% for 15% and 30% replacement, respectively. Besides the increase in the w/c ratio, the strength reduction can also be influenced by the lower quantity of cementitious materials, which could reduce the volume of hydrated products, such as C-S-H, since BR is a material with very low reactivity. However, the strength reduction is not proportional to the replacement level because of the pore-filling effect (filler effect). This is explained by the fact that BR has half the average particle size (d50) compared to the cement. Also, a higher degree of hydration can be achieved more rapidly when more water is available in the system [39]. On the other hand, a combined effect can be expected to reduce the compressive strength because of the sodalite presence in the BR [40].

When BR is added to the mixture, the w/c ratio remains unchanged, while the w/s ratio decreases. This addition results in an average increase in compressive strength of 7.3% and 19.5% for 15% and 30% additions, respectively. This is because, even though reducing the volume of cement hydrated products relative to the reference paste, BR fills the pores, leading to greater resistance to applied loads. As observed by Oliveira et al. [41], the observed variability is justified by the random position and size of pores and defects [42]. Since there are no aggregates, one randomly large defect can cause one sample to collapse under a lower load. Additionally, BR exhibits a small contribution in terms of binding capacity, as observed by the modified Chapelle test conducted according to ABNT NBR 15895:2010 [43], which indicated a consumption of 453 mg of Ca(OH)2 per gram of BR. Although this value is lower than, for example, the minimum required to consider pozzolanic activity in metakaolin (750 mg according to ABNT NBR 15894-1:2010 [44]), a slight contribution to the production of hydrated material cannot be entirely disregarded.
For pastes in which BR replaced cement, ANOVA showed that the w/c ratio significantly influenced compressive strength (p = 6.3 × 10⁻⁶). Tukey's test indicated a significant difference between the reference paste (CEM-042-ref) and the pastes SBR15%-042 and SBR30%-042 (p = 7.81 × 10⁻⁵ and 4.58 × 10⁻⁶, respectively), but no significant difference between the two BR-containing pastes (p = 0.165). For pastes in which BR was added, the w/s ratio significantly influenced the compressive strength results (p = 2.24 × 10⁻³). Tukey's test showed no significant difference between CEM-042-ref and ABR15%-037 (p = 0.20122), but a significant difference between CEM-042-ref and ABR30%-033 (p = 0.00039) and between ABR15%-037 and ABR30%-033 (p = 0.06394).
3.3 Microhardness
The microhardness results are shown in box-plot graphs in Figure 12 and Figure 17. 3-5 out of 30 results are considered outliers, in accordance with the interquartile analysis of the boxplots, which includes 50% of results of the valid indented results. There is no indication of normal distributions for the data based on the Kolmogorov-Smirnov normality test, and the Q-Q (quantile-quantile) plots suggest that two distinct populations were present in the data.

Microhardness of pastes with cement replacement by BR (a) and BR addition (b) presented as a box-plot chart (average and the interquartile range – IQR- representing 50% of results). Values higher than 1.5 times of the IQR are plotted as outliers (circles).

The first one, which represents most of the measurements, exhibits relatively lower hardness values and intrinsic variability attributed to hydration products, as observed in Wang et al. [32], with its heterogeneous nature in product density and pore structure. A normality test (Kolmogorov-Smirnov) indicated that the lower-hardness population follows a normal distribution.
The second population (outliers) shows markedly higher hardness values attributed to the presence of anhydrous phases (clinker, BR). This latter population was much less frequent (7-17% of the evaluated points), which is insufficient for specific statistical characterization in the Q-Q plots or normality test.
The macroscopic properties investigated, particularly abrasion resistance (later seen in section 3.4 and the subsequent ones), were found to correlate with the average hardness calculated exclusively from this dominant population. This indicates that the hardness of the hydrated matrix, which constitutes the largest fraction of the material, is the main contributor to the macroscopic behavior of the tested pastes. Therefore, subsequent statistical analyses (mean, standard deviation, ANOVA, and correlations with the other measured properties) were performed considering only the lower-hardness population.
As observed for compressive strength, the microhardness of the pastes was also affected by the incorporation of BR, both through substitution and addition. This influence, once again, resulted from changes in the w/c and w/s ratios. In the case of substitution, with an increase in the w/c ratio and, thus, in the porosity, the average microhardness of the pastes decreased by 22% and 33% compared to the reference paste. In the case of BR addition, while maintaining the w/c ratio and reducing the w/s ratio, microhardness increased by 55.6% and 77.8%. The presence of harder particles in the bauxite residue, such as iron oxide and quartz [45], [46], can contribute to increasing the paste microhardness. However, the percentage of this material is similar in the replacement and addition strategies, respectively. As mentioned, the hydration rate is slower in lower w/c ratios. Thus, besides the denser system in the cement-replaced pastes, some unreacted particles could also have elevated these pastes' hardness (ABR15%-037 and ABR30%-033).
For pastes in which cement was replaced with BR, ANOVA showed that the w/c ratio significantly influenced the microhardness of the pastes (p = 2.1 × 10⁻⁶). Tukey’s test indicated a significant difference between the reference paste CEM-042-ref and the pastes SBR15%-042 and SBR30%-042 (p = 4.76 × 10⁻⁴ and 3.56 × 10⁻⁵, respectively), but no significant difference between the two BR-containing pastes (p = 0.157). For pastes with BR addition, ANOVA showed that the w/s ratio significantly influenced microhardness (p = 9.1 × 10⁻⁷). Tukey’s test indicated a significant difference between the reference paste CEM-042-ref and the pastes ABR15%-037 and ABR30%-033 (p = 2.218 × 10⁻⁵ and 4.0 × 10⁻⁷, respectively), but no significant difference between the two BR-containing pastes (p = 0.897).
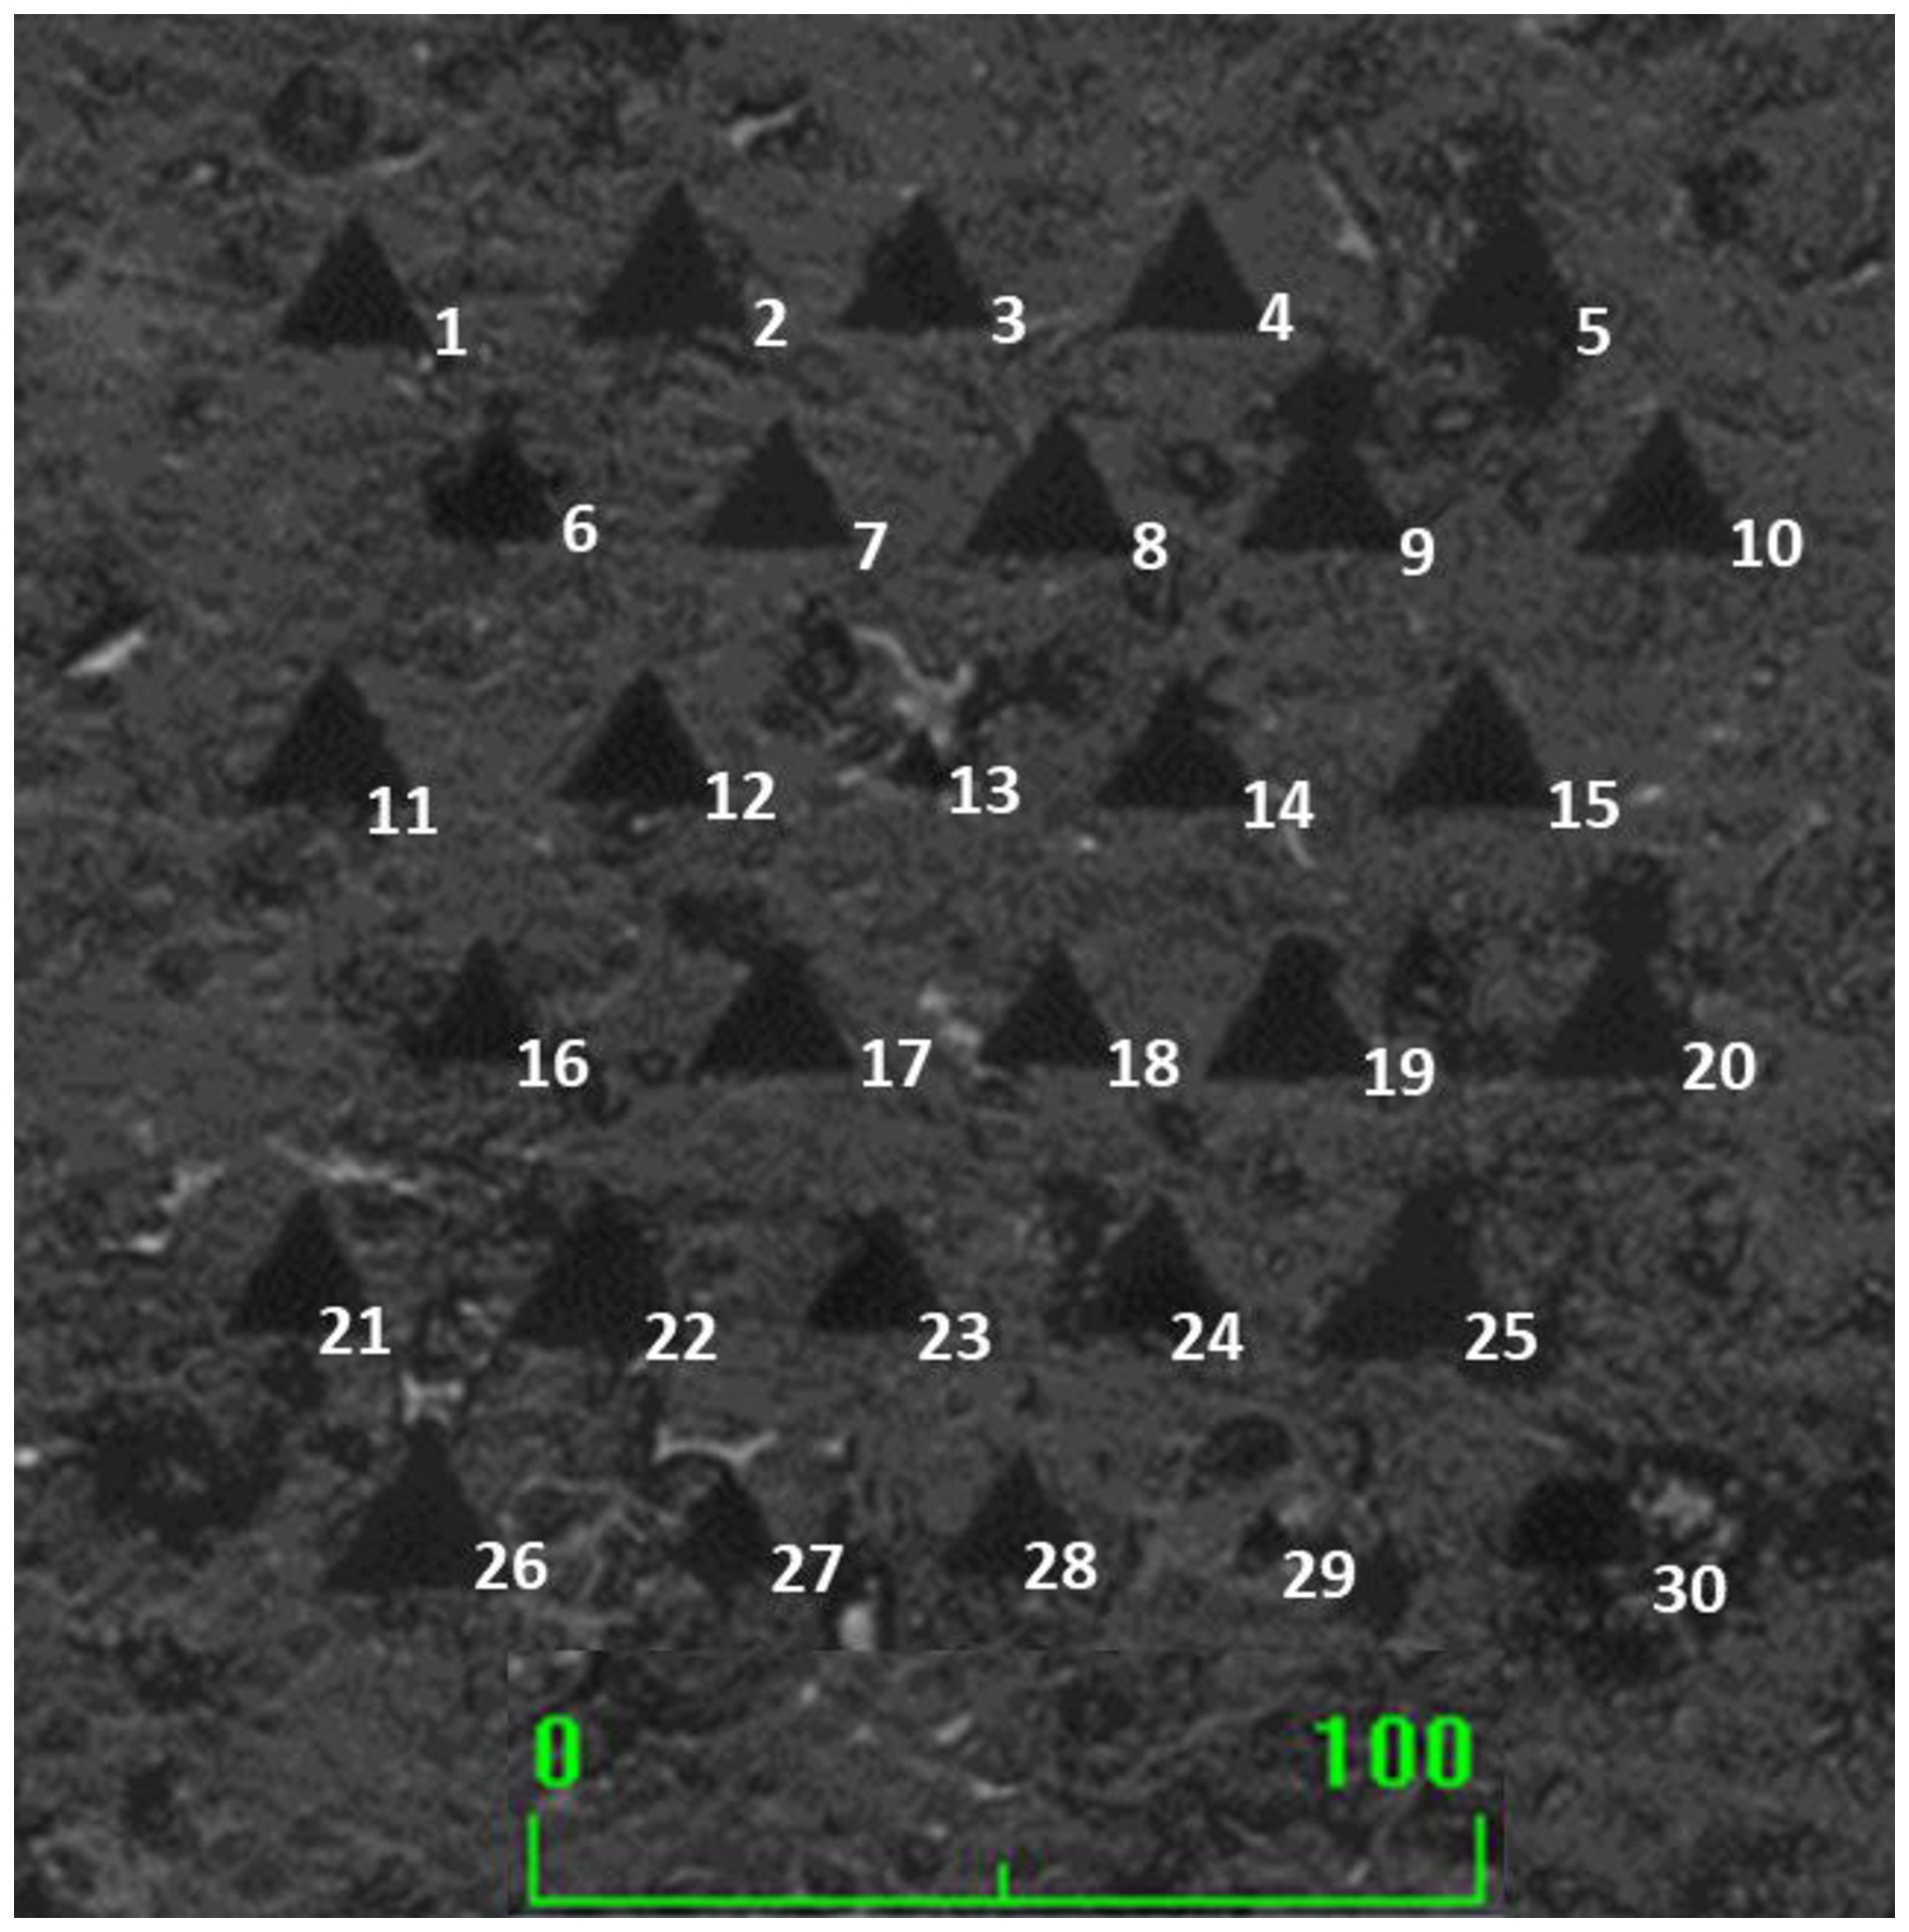
Figure 13 presents all the measured microhardness paste values. Figures 14 to 16 were obtained from the magnifiers of the microhardness tester immediately after the tests and illustrate all 30 indentations made in each of the five pastes.

Absolute microhardness values obtained in each indentation of the pastes: (a) CEM-042-ref; (b) SBR15%-042; (c) SBR30%-042; (d) ABR15%-037; (e) ABR30%-033. "Av." is the average of all the 30 measurements, and the error bar represents the confidence interval at a 95% significance level.

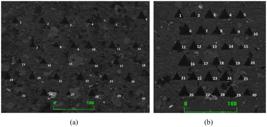
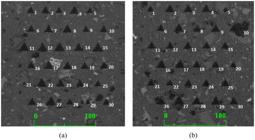
It is possible to observe that the points where the indentations are visually smaller correspond to those with the highest absolute microhardness values. In other words, the visual aspect of the indentation already indicates whether the microhardness value at that point is higher, lower, or around the average compared to the others. This can be seen, for example, in Figure 13a, which highlights points 13, 27, and 29 of the CEM-042-ref paste, showing higher microhardness values than the others. When compared to Figure 14, the smaller size of the indentations at these three points is evident, possibly indicating non-hydrated regions of the paste (clinker).
In the pastes containing BR, the highest microhardness values may be associated with non-hydrated regions of the paste (clinker), BR grains that did not undergo chemical interaction with the cement, or a third scenario where a chemical interaction occurred, and BR contributed — even if secondarily — to the microhardness of the paste. This could result from a combined effect of its iron- and aluminum-rich composition and the improved packing of the paste [47].
The average values obtained in this study for the reference paste CEM-042-ref were 0.94 GPa (potentially hydrated regions) and 4.66 GPa (possible non-hydrated points), which fall within the expected range. Wang et al. [32] reported values between 0.6 and 0.8 GPa for hydrated regions and 2.0 to 7.0 GPa for non-hydrated areas of cement paste with a w/c ratio of 0.3. Pastes with BR showed average values of 0.56 GPa and 0.66 GPa (cement replaced with 15% and 30% of BR, respectively) and values of 1.41 GPa and 1.62 GPa (addition of 15% and 30% of BR, respectively), confirming the results found by Chen et al. [22] (for pastes with a w/c ratio of 0.3 and cement replaced in 10% and 20% for BR, the microhardness average was 0.7 GPa and 0.6 GPa, respectively).
3.4 Abrasion resistance
For pastes in which cement was replaced with BR, ANOVA showed that the w/c ratio did not have a significant influence on abrasion resistance (p = 0.558). For pastes with BR addition, ANOVA showed that the w/s ratio did not have a significant influence on abrasion resistance (p = 0.407). Although no statistically significant improvement in abrasion resistance was observed, the addition of BR led to a reduction in the average values of the worn volume by 3% and 10% (for 15% and 30% addition, respectively).
3.5 Correlations between properties
The properties of microhardness, compressive strength, and abrasion resistance do not have a cause-and-effect relationship; however, correlations can be established since the same factors may influence these properties. Pastes analyzed in this study represent complex systems as their measured properties rarely reflect the influence of a single isolated factor. In most cases, the measured values reflect the entire system, which consists of hydrated phases with varying densities, anhydrous compounds, pores, and other components.
In cases where cement was replaced with BR, despite a reduction in properties, the decrease was not proportional to the reduction in cement content. This suggests a secondary contribution of BR, highlighting its potential for specific applications in cementitious components that do not require high values for these properties.
The improvement observed in the properties with the addition of BR to the system may be attributed to a combined contribution of BR: i) there was less water in both systems, leading to fewer pores; ii) the packing of the pastes improved due to the particle size and surface area of BR, which helped fill existing pores; iii) the non-hydrated chemical compounds in the bauxite residue, acting as filler material, may indirectly contribute due to their high hardness (iron and aluminum phases); iv) a slight pozzolanic contribution to hydration, as indicated by the modified Chapelle test. These improvements suggest the potential of BR for use in cementitious components that require good mechanical and surface performance.
As expected, the results showed correlations among the studied properties. In Figure 18, the following correlations can be observed: compressive strength vs. abrasion resistance (R2 = 0.98); compressive strength vs. microhardness (R2 = 0.94); and abrasion resistance vs. microhardness (R2 = 0.87).

4 CONCLUSIONS
To investigate the BR influence on the abrasion resistance of cement matrix, this study determined the microhardness of reference cement pastes and those with bauxite residue (BR) as a substitution or addition to cement. From this, it can be concluded that:
-
The study of cementitious compounds is complex, as their properties rarely reflect a single isolated factor, such as the characteristics of the constituent phase (e.g., the cement matrix). Instead, they typically represent the overall system, which comprises phases with varying densities, anhydrous compounds, pores, and other interacting elements.
-
The measurements of the worn groove width for determining abrasion resistance, as suggested by the Brazilian standard, showed a low correlation with the actual material loss detached from each specimen. This indicates that the method proposed in this study, based on the calculation of the worn volume, can be an alternative to the method suggested by the standard.
-
The results indicate a tendency for microhardness, compressive strength, and abrasion resistance to be interrelated. While this suggests that high-hardness materials could favor greater abrasion resistance, this relationship should be interpreted cautiously, as it may be influenced by additional factors not isolated in this study.
-
These findings suggest that BR can be strategically incorporated into cementitious materials depending on the desired properties. While its substitution for cement tends to reduce strength and hardness, the extent of these reductions was smaller than the proportion of cement replaced under the studied conditions, indicating potential for applications where lower mechanical performance is acceptable. When added while maintaining a fixed w/c ratio, BR showed the potential to improve microhardness and compressive strength. However, further investigation is needed to confirm these trends under different mix designs and exposure conditions. The possibility of optimizing cementitious materials by adjusting BR incorporation highlights its relevance in sustainable construction practices.
Furthermore, the conclusions drawn in this study are restricted to the specific bauxite residue investigated, whose physical, chemical, and mineralogical characteristics may differ from those of other sources.
APPENDIX A: LOAD TEST FOR THE MICROINDENTATION TEST
For the indentation test of the reference cement paste (CEM-042-ref), load values of 10, 50, 100, and 150 mN were tested. The 10 mN load was initially discarded as the indentations were barely visible, indicating the need for a higher load (Figure A.1.).

Indentations from the initial test load of 10 mN on the cement paste. At 10x magnification lens (a) and 50x magnification lens (b) of the Shimadzu DUH 211S ultra-microhardness tester.
The 50 mN load was discarded when compared to the 100 mN and 150 mN loads by analyzing their graphs and indentation impressions. Figure A.2 illustrates the indentations obtained with these three loads. The 100 mN and 150 mN loads showed very similar behavior (graph shown in Figure A.3). The same process was applied to the pastes containing bauxite residue.
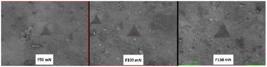
Indentations from the initial test with loads of 50, 100, and 150 mN on the cement paste. Images obtained using the 50x magnification lens of the Shimadzu DUH 211S ultra-microhardness tester.

Force vs. depth curves obtained from the test with loads of 100 mN (green curve) and 150 mN (black curve).
Although the indentation impression on the sample appeared slightly distorted under the 150 mN load (Figure A.2c), other tests showed a good impression. Both the 150 mN and 100 mN loads were suitable for the CEM-042-ref, ABR15%-037, and ABR30%-033. However, the 100 mN load was too high for samples SBR15%-042 and SBR30%-042, for which an 80 mN load was defined. Therefore, to avoid significant load differences, we decided to adopt a 100 mN load for the initial samples.
APPENDIX B: ONE-WAY ANALYSIS OF VARIANCE
Table B.1 ANOVA one way analyzing the influence of w/c on compressive strength| Group | Count | Sum | Mean | Variance | ||
|---|---|---|---|---|---|---|
| CEM-042-ref | 17 | 947.954 | 55.762 | 37.024 | ||
| SBR15%-042 | 8 | 378.294 | 47.287 | 7.595 | ||
| SBR30%-042 | 10 | 451.889 | 45.189 | 11.258 | ||
| ANOVA | ||||||
| Source of variation | SQ | gl | MQ | F | P-value | Critical F |
| Between groups | 832.154 | 2 | 416.077 | 17.827 | 6.28E-06 | 3.295 |
| Within groups | 746.876 | 32 | 23.340 | |||
| Total | 1579.030 | 34 |
| Group | Count | Sum | Mean | Variance | ||
|---|---|---|---|---|---|---|
| CEM-042-ref | 17 | 947.954 | 55.762 | 37.024 | ||
| ABR15%-037 | 11 | 659.109 | 59.919 | 83.029 | ||
| ABR30%-033 | 10 | 666.521 | 66.652 | 40.872 | ||
| ANOVA | ||||||
| Source of variation | SQ | gl | MQ | F | P-value | Critical F |
| Between groups | 746.825 | 2 | 373.412 | 7.299 | 2.24E-03 | 3.267 |
| Within groups | 1790.528 | 35 | 51.158 | |||
| Total | 2537.354 | 37 |
| Group | Count | Sum | Mean | Variance | ||
|---|---|---|---|---|---|---|
| CEM-042-ref | 27 | 25.501 | 0.944 | 0.096 | ||
| SBR15%-042 | 25 | 16.377 | 0.655 | 0.061 | ||
| SBR30%-042 | 26 | 14.631 | 0.563 | 0.044 | ||
| ANOVA | ||||||
| Source of variation | SQ | gl | MQ | F | P-value | Critical F |
| Between groups | 2.108 | 2 | 1.054 | 15.645 | 2.10E-06 | 3.119 |
| Within groups | 5.052 | 75 | 0.067 | |||
| Total | 7.159 | 77 |
| Group | Count | Sum | Mean | Variance | |||||||||
|---|---|---|---|---|---|---|---|---|---|---|---|---|---|
| CEM-042-ref | 27 | 25.501 | 0.944 | 0.096 | |||||||||
| ABR15%-037 | 28 | 39.468 | 1.410 | 0.177 | |||||||||
| ABR30%-033 | 27 | 37.499 | 1.389 | 0.062 | |||||||||
| ANOVA | |||||||||||||
| Source of variation | SQ | gl | MQ | F | P-value | Critical F | |||||||
| Between groups | 3.754 | 2 | 1.877 | 16.666 | 9.15E-07 | 3.112 | |||||||
| Within groups | 8.897 | 79 | 0.113 | ||||||||||
| Total | 12.651 | 81 | |||||||||||
| Group | Count | Sum | Mean | Variance | ||
|---|---|---|---|---|---|---|
| CEM-042-ref | 8 | 3.170 | 0.396 | 0.008 | ||
| SBR15%-042 | 8 | 3.582 | 0.448 | 0.052 | ||
| SBR30%-042 | 10 | 4.724 | 0.472 | 0.009 | ||
| ANOVA | ||||||
| Source of variation | SQ | gl | MQ | F | P-value | Critical F |
| Between groups | 0.0262 | 2 | 0.013 | 0.597 | 5.58E-01 | 3.422 |
| Within groups | 0.503 | 23 | 0.022 | |||
| Total | 0.529 | 25 |
| Group | Count | Sum | Mean | Variance | ||
|---|---|---|---|---|---|---|
| CEM-042-ref | 8 | 3.170 | 0.396 | 0.008 | ||
| ABR15%-037 | 9 | 3.488 | 0.388 | 0.007 | ||
| ABR30%-033 | 11 | 3.927 | 0.357 | 0.004 | ||
| ANOVA | ||||||
| Source of variation | SQ | gl | MQ | F | P-value | Critical F |
| Between groups | 0.008 | 2 | 0.004 | 0.932 | 4.07E-01 | 3.385 |
| Within groups | 0.112 | 25 | 0.004 | |||
| Total | 0.120 | 27 |
-
FINANCIAL SUPPORT:
Tatiane I. Hentges received the research grants of FAPESP, number 2021/01351-8. S. C. Angulo thanks CNPq for the research productivity scholarship; process 305.564/2018-8.
-
Data Availability:
The data that support the findings of this study are available from the corresponding author, [A.B.F.], upon reasonable request.
-
How to cite:
A. B. Figueiroa, T. I. Hentges, M. S. Rebmann, and S. C. Angulo, “Influence of microhardness on the abrasion resistance of cement pastes with bauxite residue”, Rev. IBRACON Estrut. Mater., vol. 19, no. 3, e19118, 2026, https://doi.org/10.1590/S1983-41952026000100018
REFERENCES
-
1 U.S. Geological Survey. “Mineral Commodity Summaries 2025.” 2025. https://doi.org/10.3133/mcs2025
» https://doi.org/10.3133/mcs2025 -
2 Mordor Intelligence. “Tamanho do Mercado de Bauxita e Análise de Ações: Tendências e Previsões de Crescimento (2024-2029).” 2025. Accessed: Mar. 14, 2025. [Online]. Available: https://www.mordorintelligence.com/pt/industry-reports/bauxite-market
» https://www.mordorintelligence.com/pt/industry-reports/bauxite-market -
3 International Aluminium Institute, Technology Roadmap: Maximizing the use of Bauxite Residue in Cement, 1st ed. London: World Aluminium, 2020. Accessed: Oct. 24, 2025. [Online]. Available: https://international-aluminium.org/resources/technology-roadmap-maximizing-the-use-of-bauxite-residue-in-cement/
» https://international-aluminium.org/resources/technology-roadmap-maximizing-the-use-of-bauxite-residue-in-cement/ -
4 International Aluminium Institute, Bauxite Residue: an Introduction Factsheet London: World Aluminium, 2022. Accessed: Oct. 24, 2025. [Online]. Available: https://international-aluminium.org/resources/bauxite-residue-an-introduction-factsheet/
» https://international-aluminium.org/resources/bauxite-residue-an-introduction-factsheet/ -
5 K. Evans, "The history, challenges, and new developments in the management and use of bauxite residue," J. Sustain. Metall., vol. 2, no. 4, pp. 316–331, Dec 2016, https://doi.org/10.1007/s40831-016-0060-x
» https://doi.org/10.1007/s40831-016-0060-x -
6 X. Liu and N. Zhang, "Utilization of red mud in cement production: a review," Waste Manag. Res., vol. 29, no. 10, pp. 1053–1063, Oct 2011, https://doi.org/10.1177/0734242X11407653
» https://doi.org/10.1177/0734242X11407653 - 7 R. C. O. Romano et al, “Impact of using bauxite residue in microconcrete and comparison with other kind of supplementary cementitious material,” in 35th Int. ICSOBA Conf., Hamburg, Germany, 2017, pp. 505–517.
-
8 T. Danner and H. Justnes, "Bauxite residue as supplementary cementitious material: efforts to reduce the amount of soluble sodium," Nord. Concr. Res., vol. 62, no. 1, pp. 1–20, Jun 2020, https://doi.org/10.2478/ncr-2020-0001
» https://doi.org/10.2478/ncr-2020-0001 -
9 R. C. D. O. Romano et al, "Combined evaluation of oscillatory rheometry and isothermal calorimetry for the monitoring of hardening stage of Portland cement compositions blended with bauxite residue from Bayer process generated in different sites in Brazil," Rev. IBRACON Estrut. Mater., vol. 14, no. 2, e14211, 2021, https://doi.org/10.1590/s1983-41952021000200011
» https://doi.org/10.1590/s1983-41952021000200011 -
10 L. M. V. Silveira, M. A. Cincotto, R. C. O. Romano, and R. G. Pileggi, "Early-age properties of Portland cement with untreated bauxite residue (UBR) as SCM for large-scale adoption," Constr. Build. Mater., vol. 464, pp. 140139, Feb 2025, https://doi.org/10.1016/j.conbuildmat.2025.140139
» https://doi.org/10.1016/j.conbuildmat.2025.140139 - 11 American Concrete Institute, Guide to Durable Concrete, ACI 201.2R-08, 2008.
- 12 P. K. Mehta, Concreto: microestrutura, propriedades e materiais. São Paulo: IBRACON, 2014.
-
13 F. W. Zok and A. Miserez, "Property maps for abrasion resistance of materials," Acta Mater., vol. 55, no. 18, pp. 6365–6371, Oct 2007, https://doi.org/10.1016/j.actamat.2007.07.042
» https://doi.org/10.1016/j.actamat.2007.07.042 -
14 C. V. Silva, “Estudo da influência das propriedades relacionadas à superfície e à matriz na resistência à abrasão de concretos para pisos,” Ph.D. dissertation, UFRGS, Porto Alegre, 2015. Accessed: Oct. 24, 2025. [Online]. Available: http://hdl.handle.net/10183/139378
» http://hdl.handle.net/10183/139378 -
15 H. Hirani, Fundamentals of Engineering Tribology with Applications Cambridge: Cambridge Univ. Press, 2016. https://doi.org/10.1017/CBO9781107479975
» https://doi.org/10.1017/CBO9781107479975 -
16 A. Warudkar and S. Elavenil, "A comprehensive review on abrasion resistance of concrete," Int. J. Appl. Sci. Eng., vol. 17, no. 1, Mar 2020, https://doi.org/10.6703/IJASE.202003_17(1).029
» https://doi.org/10.6703/IJASE.202003_17(1).029 -
17 Y. Dang, X. Shi, J. Qian, Y. Jiang, and X. Li, "Statistical characteristics of microhardness of hardened cement paste," J. Wuhan Univ. Technol. Mater. Sci. Ed., vol. 33, no. 4, pp. 924–931, Aug 2018, https://doi.org/10.1007/s11595-018-1914-9
» https://doi.org/10.1007/s11595-018-1914-9 -
18 H. Peng, C. Cui, C. S. Cai, Y. Liu, and Z. Liu, "Microstructure and microhardness property of the interface between a metakaolin/GGBFS-based geopolymer paste and granite aggregate," Constr. Build. Mater., vol. 221, pp. 263–273, Oct 2019, https://doi.org/10.1016/j.conbuildmat.2019.06.090
» https://doi.org/10.1016/j.conbuildmat.2019.06.090 -
19 M. S. Rebmann, “Durabilidade de concretos estruturais com baixo consumo de cimento Portland e alta resistência,” M.S. thesis, Univ. São Paulo, São Carlos, 2011. https://doi.org/10.11606/D.18.2011.tde-10062011-150726
» https://doi.org/10.11606/D.18.2011.tde-10062011-150726 - 20 Associação Brasileira de Normas Técnicas, Peças de Concreto para Pavimentação: Especificação e Métodos de Ensaio, ABNT NBR 9781, 2013.
-
21 C. V. Silva, J. E. Zorzi, R. C. D. Cruz, and D. C. C. Dal Molin, "Experimental evidence that micro and macrostructural surface properties markedly influence on abrasion resistance of concretes," Wear, vol. 422–423, pp. 191–200, Mar 2019, https://doi.org/10.1016/j.wear.2019.01.063
» https://doi.org/10.1016/j.wear.2019.01.063 -
22 Z. X. Chen, C. Y. Zhang, Y. Jia, L. Y. Lin, Q. X. Zhao, and S. H. Chu, "CO2 sequestration in green porous concrete using red mud," ACS Sustain. Chem.& Eng., vol. 13, no. 8, pp. 3036–3051, Mar 2025, https://doi.org/10.1021/acssuschemeng.4c06004
» https://doi.org/10.1021/acssuschemeng.4c06004 - 23 Associação Brasileira de Normas Técnicas, Cimento Portland: Requisitos, ABNT NBR 16697, 2018.
- 24 Associação Brasileira de Normas Técnicas, Aditivos Químicos para Concreto de Cimento Portland - Parte 1: Requisitos, ABNT NBR 11768-1, 2019.
-
25 V. Kocaba, E. Gallucci, and K. L. Scrivener, "Methods for determination of degree of reaction of slag in blended cement pastes," Cement Concr. Res., vol. 42, no. 3, pp. 511–525, Mar 2012, https://doi.org/10.1016/j.cemconres.2011.11.010
» https://doi.org/10.1016/j.cemconres.2011.11.010 -
26 R. C. O. Romano, H. M. Bernardo, M. H. Maciel, R. G. Pileggi, and M. A. Cincotto, "Hydration of Portland cement with red mud as mineral addition," J. Therm. Anal. Calorim., vol. 131, no. 3, pp. 2477–2490, Mar 2018, https://doi.org/10.1007/s10973-017-6794-2
» https://doi.org/10.1007/s10973-017-6794-2 -
27 American Society for Testing and Materials, Practice for Instrumented Indentation Testing, ASTM E2546-07, 2015. https://doi.org/10.1520/E2546-07
» https://doi.org/10.1520/E2546-07 - 28 International Organization for Standardization, Materiais Metálicos – Teste de Indentação Instrumentado para Parâmetros de Dureza e Materiais - Parte 1: Método de Teste, ISO 14577-1, 2015.
-
29 W. C. Oliver and G. M. Pharr, "An improved technique for determining hardness and elastic modulus using load and displacement sensing indentation experiments," J. Mater. Res., vol. 7, no. 6, pp. 1564–1583, Jun 1992, https://doi.org/10.1557/JMR.1992.1564
» https://doi.org/10.1557/JMR.1992.1564 -
30 J. Hay, "Introduction to instrumented indentation testing," Exp. Tech., vol. 33, no. 6, pp. 66–72, 2009, https://doi.org/10.1111/j.1747-1567.2009.00541.x
» https://doi.org/10.1111/j.1747-1567.2009.00541.x - 31 Shimadzu Corporation, DUH 211S – Instruction Manual – Principle. Tokyo, 2025.
-
32 M. Wang, Y. Xie, G. Long, C. Ma, and X. Zeng, "Microhardness characteristics of high-strength cement paste and interfacial transition zone at different curing regimes," Constr. Build. Mater., vol. 221, pp. 151–162, Oct 2019, https://doi.org/10.1016/j.conbuildmat.2019.06.084
» https://doi.org/10.1016/j.conbuildmat.2019.06.084 -
33 V. Renuka, S. Venkateswara Rao, and T. Tadepalli, "Nanoindentation technique in characterizing cementitious materials: a review," Mater. Today Proc., no. abr, 2023, https://doi.org/10.1016/j.matpr.2023.04.107
» https://doi.org/10.1016/j.matpr.2023.04.107 -
34 American Society for Testing and Materials, Standard Test Method for Abrasion Resistance of Concrete (Underwater Method), ASTM C1138M-19, 2019. Accessed: Oct. 24, 2025. [Online]. Available: https://store.astm.org/c1138m-19.html
» https://store.astm.org/c1138m-19.html - 35 J. C. C. Waeny, Controle Total da Qualidade em Metrologia. São Paulo: Makron Books, 1992.
-
36 S. Sasmal and M. B. Anoop, “Nanoindentation for evaluation of properties of cement hydration products,” in Nanotechnology in Eco-efficient Construction (Woodhead Publishing Series in Civil and Structural Engineering), 2nd ed., F. Pacheco-Torgal, M. V. Diamanti, A. Nazari, C. G. Granqvist, A. Pruna and S. Amirkhanian, Eds., Cambridge: Woodhead Publishing, 2019, p. 141–161. https://doi.org/10.1016/B978-0-08-102641-0.00007-4
» https://doi.org/10.1016/B978-0-08-102641-0.00007-4 -
37 F. C. Oliveira, M. P. Kassab, N. V. Silva, S. C. Angulo, L. M. Tavares, and D. A. Lange, "Probabilistic functions of mechanical properties of plain cement pastes determined by a reduced-size test," Constr. Build. Mater., vol. 286, pp. 122907, Jun 2021, https://doi.org/10.1016/j.conbuildmat.2021.122907
» https://doi.org/10.1016/j.conbuildmat.2021.122907 -
38 M. U. Salim, M. A. Mosaberpanah, A. Danish, N. Ahmad, R. A. Khalid, and C. Moro, "role of bauxite residue as a binding material and its effect on engineering properties of cementitious composites: a review," Constr. Build. Mater., vol. 409, pp. 133844, Dec 2023, https://doi.org/10.1016/j.conbuildmat.2023.133844
» https://doi.org/10.1016/j.conbuildmat.2023.133844 -
39 H. Fanghui, W. Qiang, L. Mutian, and M. Yingjun, "Early hydration properties of composite binder containing limestone powder with different finenesses," J. Therm. Anal. Calorim., vol. 123, no. 2, pp. 1141–1151, Feb 2016, https://doi.org/10.1007/s10973-015-5088-9
» https://doi.org/10.1007/s10973-015-5088-9 - 40 G. Skripkiūnas, V. Sasnauskas, M. Daukšys, and D. Palubinskaite, "Peculiarities of hydration of cement paste with addition of hydrosodalite," Mater. Sci. Pol., vol. 25, no. 3, pp. 627–635, 2007.
-
41 F. C. D. Oliveira, N. V. Silva, T. I. Hentges, L. M. Tavares, and S. C. Angulo, "Mechanical properties of reduced-sized limestone filler-cement pastes and their variability using an instrumented point load test," J. Build. Eng., vol. 94, pp. 109802, Oct 2024, https://doi.org/10.1016/j.jobe.2024.109802
» https://doi.org/10.1016/j.jobe.2024.109802 -
42 J. B. Wachtman, W. R. Cannon, and M. J. Matthewson, Mechanical Properties of Ceramics. New York: John Wiley & Sons, 2009. https://doi.org/10.1002/9780470451519
» https://doi.org/10.1002/9780470451519 - 43 Associação Brasileira de Normas Técnicas, Materiais Pozolânicos – Determinação do Teor de Hidróxido de Cálcio Fixado – Método Chapelle Modificado, ABNT NBR 15895, 2010.
- 44 Associação Brasileira de Normas Técnicas, Metacaulim para Uso com Cimento Portland em Concreto, Argamassa e Pasta - Parte 1: Requisitos, ABNT NBR 15894-1, 2010.
-
45 D. L. Whitney, M. Broz, and R. F. Cook, "Hardness, toughness, and modulus of some common metamorphic minerals," Am. Mineral., vol. 92, no. 2–3, pp. 281–288, Feb 2007, https://doi.org/10.2138/am.2007.2212
» https://doi.org/10.2138/am.2007.2212 -
46 National Library of Medicine, “Hematite (Fe2O3).” NCBI. https://pubchem.ncbi.nlm.nih.gov/compound/14833 (accessed Mar. 4, 2026).
» https://pubchem.ncbi.nlm.nih.gov/compound/14833 -
47 L. M. V. Silveira, M. H. Maciel, J. A. F. S. Mesquita, M. A. Cincotto, R. C. O. Romano, and R. G. Pileggi, "Hydration and chemical shrinkage of Portland cement with bauxite residue from Bayer process," J. Therm. Anal. Calorim., vol. 148, no. 14, pp. 6715–6729, Jul 2023, https://doi.org/10.1007/s10973-023-12201-5
» https://doi.org/10.1007/s10973-023-12201-5
Edited by
-
Editors:
Edna Possan, Leandro Trautwein
The data that support the findings of this study are available from the corresponding author, [A.B.F.], upon reasonable request.