 Evaluation of the maximum load value and cracking load in fiber-reinforced concrete
Abstract
In fiber-reinforced fluid concrete (FRFC), it is possible to use the casting flow of the concrete to guide the fibers in the places and directions of greater stresses, which is a relevant aspect when you want to use the fiber-reinforced concrete (FRC) for structural purposes. However, the normative instructions referring to the sizing aspects of the FRC still do not verify the validity of this preferential orientation of the fibers since they consider that the maximum load corresponds to the cracking load when using dispersed fibers in the matrix, and they base their studies on this hypothesis. In view of this and knowing the significant change that the preferential orientation of the fibers can provide to the FRC, it is necessary to carry out a study regarding the relationship between this orientation and the resistance load of the concrete. From this, a study is presented associated with the relationship between the maximum load and the cracking load of a sample of concrete reinforced with steel fibers (SFRC) and another of concrete reinforced with polymeric fibers (PFRC), both with the preferential orientation of the fibers that will be used later for structural applications. According to the study, it was observed that when the element exhibits hardening behavior and the fiber has a high modulus of elasticity, there is no statistically significant difference between the loads. However, when the element exhibits softening behavior and the fiber has a low modulus of elasticity, there is a statistically significant difference between the loads. Thus, it can be concluded that, when using the preferential orientation of the fibers in the composite, the maximum load may not correspond to the cracking load, making it necessary later to determine the design load and, consequently, the possible variations in the dimensioning aspects.
Keywords:
fiber-reinforced concrete; preferential orientation of the fibers; maximum load; cracking load
Resumo
No concreto fluido reforçado com fibras (CFRF), é possível utilizar o fluxo de lançamento do concreto para orientar as fibras nos locais e nas direções de maiores tensões, o que é um aspecto relevante quando se deseja utilizar o concreto reforçado com fibras (CRF) para fins estruturais. No entanto, as instruções normativas referentes aos aspectos de dimensionamento do CRF ainda não verificam a validade dessa orientação preferencial das fibras, pois consideram que a carga máxima corresponde a carga de fissuração, ao utilizar fibras dispersas na matriz, e baseiam seus estudos nessa hipótese. Diante disso, e sabendo da significativa mudança que a orientação preferencial das fibras pode proporcionar ao CRF, faz-se necessário um estudo referente a relação dessa orientação com a carga resistente do concreto. A partir disso, apresenta-se um estudo associado a relação existente entre a carga máxima com a carga de fissuração de uma amostra de concreto reforçado com fibras de aço (CRFA) e outra de concreto reforçado com fibras poliméricas (CRFP), ambos com orientação preferencial das fibras que serão posteriormente utilizados para aplicação estrutural. De acordo com o estudo realizado, observou-se que, quando o elemento apresenta comportamento de endurecimento e a fibra apresenta alto módulo de elasticidade, não existe uma diferença estatisticamente significativa entre as cargas. No entanto, quando o elemento apresenta comportamento de amolecimento e a fibra denota baixo módulo de elasticidade, existe uma diferença estatisticamente significativa entre as cargas. Assim, pode-se concluir que, ao utilizar a orientação preferencial das fibras no compósito, a carga máxima pode não corresponder a carga de fissuração, sendo necessário posteriormente determinar a carga de projeto e, consequentemente, as possíveis variações nos aspectos de dimensionamento.
Palavras-chave:
concreto reforçado com fibras; orientação preferencial das fibras; carga máxima; carga de fissuração
1 INTRODUCTION
The use of fiber-reinforced concrete (FRC) has gradually increased worldwide and has undergone several advances since the 1970s. This evolution has been happening because several studies have been developed, including those related to the matrix, the fibers, and the fiber-matrix interface [1]–[3]. Given this advancement, there are several applications of FRC in civil construction, such as its use in concrete floors and pavements, steel decks, precast concrete and shotcrete. However, as studies progress, the applications of fiber-reinforced concrete are also expanding, and FRC is being extensively studied in structural applications, such as using FRC in beams and slabs [2]–[4].
However, despite the expansion do FRC illustrated previously in several examples, this type of composite also has some technological limitations, and because of them, its use in some applications is attenuated [4]–[7]. Due to these limitations, such as the negative effect of reducing the workability of the composite with the incorporation of fibers and the random dispersion of these fibers in the matrix, the development of FRC required more than 50 years for this type of concrete to spread throughout the world [7]–[10].
In view of this, aspects related to the workability of the composite and the spreading of fibers in the matrix, as well as other aspects that may hinder the dissemination of FRC, such as the influence of the method of placing fresh concrete in the molds, were studied in order to no longer impair the performance of this type of composite for the application and analysis of FRC elements [11]–[14].
After several studies, it was noticed that the mentioned negative aspects (reduced workability of the composite and random fiber dispersion) could be reverted with the use of additives. These additives make the matrix fluid and present themselves as an important factor when used together with the addition of fibers in concrete, as fiber-reinforced fluid concrete can have high fluidity and self-consolidation properties and can provide fiber alignment in the tensile direction [3], [14]–[17]
This is justified because the fluidity of the composite allows the fibers to be distributed uniformly, making it possible to use the flow of concrete to guide the fibers, allowing them to be concentrated in the places and directions of greater stress, a relevant aspect when you want to use the FRC for structural purposes, for example [16], [18]–[21]. In addition, another advance related to the application of FRC is that research with this type of composite also began to show the application of fibers as a structural material, and this growth trend is exemplified by the emergence of several normative instructions, highlighting the material described in fib Model Code 2010 [22], in ACI 544.8R [23], and in ABNT NBR 16935: 2021 [24].
These regulations describe the dimensioning aspects that must be considered to conceive a structural project produced with FRC elements, where this project must be based on the study of the residual resistance provided by the reinforcement of the fibers. However, for the study of this resistance, the cited regulations do not verify the validity of the preferential orientation of the fibers since they consider that the maximum load corresponds to the cracking load when using dispersed fibers in the matrix, and they base their studies on this hypothesis [18], [25], [26].
In view of this and knowing the significant change that the orientation of the fibers can provide to the FRC, such as when the fibers are aligned with the lines of tension, the efficiency of the reinforcement can be up to 100%, while in the case of random dispersion of the fibers, the efficiency of the reinforcement can be reduced to up to 30%, it is necessary to study the relationship between the orientation of the fibers and the resistant load of the concrete because depending on the type and orientation of the fiber used, the maximum load can reach a different value of the cracking load, which, consequently, promotes variations in design aspects [18], [25], [26].
Based on this problem, the present work aims to evaluate the relationship between the maximum load and the cracking load of a sample of reduced-scale beams of concrete reinforced with steel fibers (SFRC) and another sample of reduced-scale beams of concrete reinforced with polymeric fibers (PFRC), both with the preferential orientation of the fibers that will be later used for structural applications. Thus, if variations between the analyzed loads exist, the design load and possible variations in dimensioning aspects must be evaluated later.
2 METHODOLOGY
In this chapter, an approach is taken regarding the production methodology of both SFRC and PFRC, which illustrates the description and dosage of materials, the method of production, molding, and curing of concrete, and how the test procedure was carried out bending standardized by EN 14651 [27]. It is worth remembering that EN 14651 [27] was used because the three-point bending test (RILEM) can be carried out based on this standard and the test procedure is represented in its entirety.
Furthermore, the tests were carried out in 2020; however, with the intention of reproducing or doing some work similar to this, the methodology illustrated in ABNT NBR 16940:2021 [28] is recommended, a more up-to-date standard compared to that used previously. In addition, it is worth noting that this study is part of one of the studies carried out by the Fibers Reinforced Concrete Group at the University Federal of Alagoas (UFAL).
2.1 Description and dosage of materials
The matrix used in the production of concrete is composed of the following materials: fine aggregate (sand), coarse aggregate (gravel), CP V ARI RS cement, mineral addition (RBMG – Residue of Beneficiation of Marble and Granite), water, and superplasticizer additive. Regarding reinforcement of SFRC, steel fibers with a modulus of elasticity of 210 GPa and tensile strength of 1100 MPa were used (Table 1), and in relation to PFRC, polymeric fibers with a modulus of elasticity of 9.5 GPa and resistance to a tensile strength of 600 MPa were used (Table 1).
With regard to matrix dosage, an adaptation of the method by Gomes et al. [29] was used for fluid concrete, where the procedure must be carried out in three phases: obtaining the paste composition, determining the mixing proportion of the aggregates and selecting the paste content. Furthermore, proportions must be established: water/cement (w/c), superplasticizer/cement (sp/c), RBMG/cement (r/c) and initial water/total water (iw/tw). As an illustration, Table 2 shows the relationships calculated by the Fibers Reinforced Concrete Group at UFAL.
After establishing the proportions illustrated in Table 2, Equations 1 to 11 were used to calculate the matrix dosage.
Where →: amount of cement; : volume of paste; : RBMG/cement ratio; : water/cement ratio; : superplasticizer/cement ratio; : specific mass of cement; : specific mass of RBMG; : specific mass of water; : specific mass of superplasticizer.
Where → : amount of total water; : amount of initial water; initial water/total water ratio.
Where → : amount of water contained in the superplasticizer; : superplasticizer/cement ratio; : superplasticizer water volume.
Where → : amount of total mass of aggregates; : volume of paste; : volume of fine aggregate; : volume of coarse aggregate; specific mass of fine aggregate; : specific mass of coarse aggregate; : amount of fine aggregate; : amount of coarse aggregate; : amount of absorption water; : amount of complementary water.
With regard to the fiber addition content, this parameter was determined using the concept of critical fiber volume proposed by Bentur and Mindess [9]. This volume refers to the maximum number of fibers that, after the matrix rupture, maintain the concrete with the same capacity to receive loads, being defined by Equation 12.
Where → : ultimate strength of the matrix to direct traction in the absence of fiber; : maximum tangential friction stress; : form factor of fiber.
From Equation 12, using the FF of the fibers and the reference values adopted by Lima [30], it is found that the critical volume for the adopted fiber is 1.1%. For the present work, with regard to beams with SFRC, the volumetric content corresponding to 0.4% was adopted and, for beams with PFRC, the content of 1.0% was adopted. These values were also established from previous studies developed by the Fibers Reinforced Concrete Group at UFAL, and material consumption is represented in Table 3.
After defining the consumption of materials (Table 3), 16 reduced-scale prismatic beams were produced with dimensions equivalent to 150×150×550 mm, which have a test span of 500 mm, as recommended by EN 14651 [27], where the production procedure, molding, and curing of concretes are illustrated in the next section.
2.2 Concrete production, molding, and curing
Concrete production was carried out at the Laboratory of Structures and Materials (LSMA) at the UFAL in an inclined shaft mixer (concrete mixer) with a capacity of 400 liters and a drum rotation of 26 rpm. Considering the procedure described by Gomes et al. [29] and Barboza [31], the mixing process was performed according to the guidelines of these authors.
It is worth noting that, in this study, the objective was to produce a fluid concrete, not necessarily a self-compacting concrete. Therefore, tests that allow classifying the concrete as self-compacting were not carried out (the L box method and the V funnel method). However, to verify the fluidity condition of the composites, the test carried out to characterize the concrete in the fresh state was the slump-flow test.
According to ABNT NBR 15823-2: 2017 [32], for concrete to be considered fluid, the spread of the mixture and the flow time of the concrete must fall within the range of 650 to 850 mm and 3.0 to 7.0 seconds, respectively. For the SFRC, the spread and flow time corresponded to 700 mm and 4.0 seconds, respectively. And for the PFRC, the spread and flow time corresponded to 710 mm and 4.4 seconds, respectively. In view of the above, it is noted that the fluidity condition of the analyzed concretes can be proven.
In this context, the molding of the specimens was carried out by placing the concrete content in the central region of the forms, where this procedure was carried out for the 16 reduced-scale prismatic beams. Due to the high fluidity, there was no need to carry out external mechanical consolidation with subsequent finishing and leveling of the surface in the forms used, as shown in Figure 1.

Furthermore, to produce fluid concrete and promote a preferential orientation of the fibers from the molding, the practical way adopted was to induce this orientation through the concrete casting flow, taking into account the dimensions of the fibers, the process of pouring the concrete, and the dimensions of the molds. The proof of this preferential orientation in concrete casting was found in previous works developed by the Fibers Reinforced Concrete Group at the UFAL, where the illustration of this affirmative is seen in the work of Melo [33].
Another limitation to producing concrete with preferential orientation of the fibers with good characteristics, in addition to using the concrete casting flow to orient these fibers, was casting the fluid concrete in the center of the test piece, allowing the concrete to flow to the entire length of the molds.
Regarding the concrete’s curing time, the elements were immersed in water for 28 days in a curing tank. These elements, as previously mentioned, are designated by 16 reduced-scale prismatic beams, produced in compliance with EN 14651 [27] for the three-point bending test, which are eight beams of steel fiber-reinforced concrete (SFRC) and eight beams of polymeric fiber-reinforced concrete (PFRC), both concrete characterized as fluid.
It is worth mentioning that the established quantity of eight beams for each study was determined considering a margin of error of ±1, a confidence level of 95% and a standard deviation of 1.4. After the curing time, the beams were characterized using the test standardized by EN 14651 [27], and this approach is illustrated in the next section.
2.3 Application of the bending test
The three-point bending test (RILEM), standardized by EN 14651 [27], is based on a closed displacement speed control system, where it is recommended to use a clip-gage to monitor the crack opening. Furthermore, the crack opening can be used as a test control parameter and, if the crack starts outside the notch, the test must be discarded. For the present work, the crack opening was used as a test control parameter and the experiments with the SFRC and PFRC beams were completed when this opening reached 8 mm and 5 mm, respectively. Furthermore, to induce crack positioning, the specimens must have a notch 5 mm wide by a maximum of 25 mm high. To illustrate this test, Figure 2 presents the schematization of the methodology used.

Regarding test setup, as mentioned previously, EN 14651 [27] recommends that a clip-gage should be used to monitor crack opening. However, due to the absence of this equipment in the laboratory, an adaptation was made with LVDTs to measure the crack opening. In this sense, the assembly occurred as follows: (a) two “L” shaped aluminum angles (3 x 3 x 3 cm) were fixed to the right and left of the notch, (b) where two LVDT type transducers were placed horizontally (c) with the aid of a magnetic base and an aluminum arm with support for the LVDTs (Figure 3). From the assembly described, it was possible to collect crack opening data for each beam, this value being the sum of each LVDT.

Thus, to apply the three-point bending test, the Shimadzu universal testing machine (model AG-X Plus) with a capacity of 100 kN was used, where in this machine, the test script was previously configured in the Trapezium X software. In parallel, displacement values were recorded in real time using the Spider 8 acquisition system and ITOM software. As an illustration, Figure 4 represents the experiment setup.
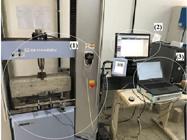
From Figure 4, one can observe the scheme that represents the experiment setup, in which (1) shows the Shimadzu universal testing machine together with the test specimen and positioned LVDTs (these transducers feature a measurement capability of 10 mm of displacement); (2) displays the computer running the Trapezium X software; and (3) displays the Spider 8 acquisition system (600 Hz) along with the computer featuring the ITOM software. From this, the Trapezium X software provided data that related the test time to the applied load, while the ITOM software provided data that related the time to the crack opening.
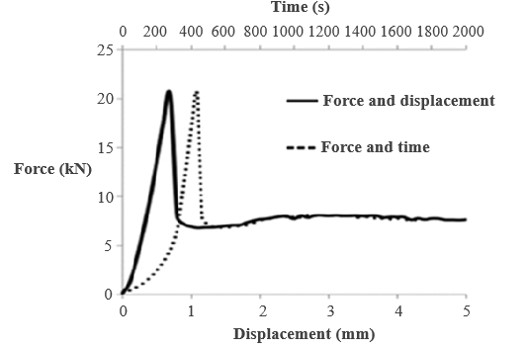
In order to make the two aforementioned sets of data compatible, a scan of the time values recorded by ITOM was carried out, returning the associated load values in the spreadsheets provided by Trapezium X, which made it possible to relate the load parameters with the crack opening recorded by LVDTs. Furthermore, the displacement corresponding to each crack opening obtained can be determined. Thus, it was possible to carry out a graphical analysis of the results, as proposed by EN 14651 [27], where two curves were generated, one relating to force versus displacement and the other relating to force versus test time (Figure 5).

Through Figure 5, it is observed that it is possible to obtain the load resisted by the composite for certain crack openings and that, at pre-established times, its associated loads are obtained. Furthermore, in parallel with the tests, photos were taken every 10 seconds, a pre-established time in previous works defined by the Fibers Reinforced Concrete Group at the UFAL, referring to the crack opening progress of the test specimens, with the objective of verifying the cracking time for each of the beams studied from the analysis of the images through ITOM software. Observation: More details of the procedure referring to the determination of the cracking time of the beams can be verified in Lima [30].
It is worth noting that the ITOM software is an open-source computational program in Python and C++ language, and the interface of this software has been implemented by researchers from the Research Group “Mechanics of Structures and Advanced Materials” at the Scientific Computing and Visualization Laboratory (SCVL) from the Federal University of Alagoas, to assist in the process of acquiring data generated by images and LVDTs.
Thus, through image analysis, it is possible to verify the moment of formation of the first crack for each of the beams and, from this, the cracking time of the tested beams was established. Therefore, after establishing this time, the associated load was determined using the graphs from the test. Thus, this load referring to the formation of the first crack corresponds to the cracking load, which, in accordance with ABNT NBR 16935: 2021 [24], is related to the proportionality limit load. Furthermore, the application of this test also provides data regarding the loads resisted by the composite (Figure 5) and the value of the highest load supported corresponds to the maximum load.
With this, a comparative study can be made between the mentioned loads to verify the relationship between the maximum load and the cracking load. Thus, to analyze these loads, average homogeneity tests were applied, and, in order to carry out this application properly, a preliminary study was carried out regarding the normality of the sample data and then a study on the homoscedasticity of the sample data.
3 RESULTS AND DISCUSSIONS
In this chapter, the results from the three-point bending test are presented, corresponding to the maximum load and cracking load values of the SFRC and the PFRC, where statistical analysis was performed regarding the relationship of these loads. But before presenting the results of the bending test, it is worth mentioning that the concretes analyzed have the following characteristics: SFRC → Compressive average strength: = 36.12 MPa and longitudinal modulus of elasticity: = 30.7 GPa; PFRC → Compressive average strength: = 30.43 MPa and longitudinal modulus of elasticity: = 30.7 GPa.
3.1 Analysis of SFRC beams
The statistical characterization of the data referring to the beams with steel fibers was carried out using the software Maple and Excel, where the data set from the bending test (maximum load and cracking load) was treated individually, as shown in Table 4. Furthermore, the curves obtained from the bending test referring to the force versus displacement of the beams are illustrated in Figure 6, where it is worth remembering that the load referring to the formation of the first crack corresponds to the cracking load and the value of the largest load supported by the composite corresponds to maximum load.

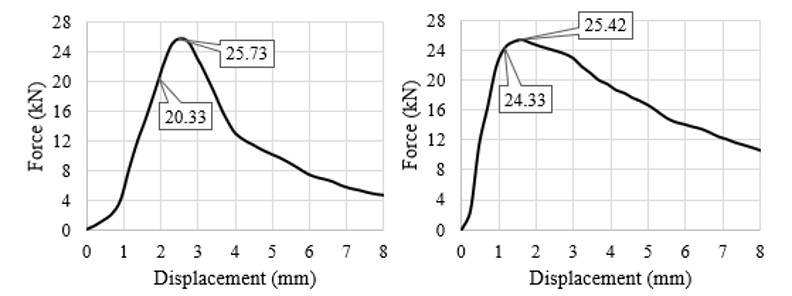
According to Table 4, and through the analysis of the graph force versus displacement (Figure 6), it is possible to observe that the beams present a hardening behavior, i.e., they denote a load in a certain time greater than the load corresponding to crack formation. This means that, after the formation of the first crack, the redistribution of efforts provided by the fibers allowed an increase in the post-cracking strength of the composite, causing the maximum load resisted by the composite to be greater than the load necessary to form the first crack in the matrix. To make this statement more evident, Figure 7 shows the individual behavior of beams 4 and 5 (beams with similar behavior), where the cracking load is equivalent to 20.33 kN and 24.33 kN, respectively, and the maximum load equivalent to 25.73 kN and 25.42 kN, respectively.
Still analyzing Table 4, it is also verified that the maximum load presents higher dispersion values than the cracking load. Regarding the standard deviation, which is a measure of the dispersion of observations within a data set, the maximum load has a higher value, which means that the cracking load data are more homogeneous. With regard to the variance, which describes the variability of the observations in relation to the arithmetic mean, the maximum load also has a higher value, which means that the cracking load data are closer to the mean. Regarding the coefficient of variation, which describes the data variation in relation to the arithmetic mean, the maximum load also has a higher value, meaning that the cracking load data have less dispersion around the mean.
In summary, the analysis shown in the previous paragraph implies that the maximum load presents greater data variability and, consequently, denotes a greater value dispersion referring to the variables. To verify this load variation in relation to the other, Table 5 shows the results referring to the variation of the maximum load in relation to the cracking load.
From Table 5, it can be seen again that the maximum load presents a higher value, and this may occur due to the high modulus of elasticity that steel fibers present. This fact can be explained because this type of fiber is little deformable and contributes to stiffening the composite post-cracking, showing that after the formation of the first crack in the matrix, the addition of these fibers can alter the mechanical behavior of the composite, which can increase the energy absorption capacity of concrete and enable an increase in the load supported by the composite [13], [34]–[37].
This shows that the steel fibers act on the post-cracking behavior of the concrete, causing the beams to present a load greater than the cracking load, where the maintenance of this load is above the cracking load, thus characterizing the hardening behavior. Thus, using ABNT NBR 16935: 2021 [24] as an aid for analyzing concrete with a random distribution of fibers, this behavior was already expected, and this same performance occurred in a similar way for concrete that presents a preferential orientation of the fibers (investigated study).
Continuing the statistical analysis related to the behavior of loads, a preliminary study was carried out regarding the normality of sample data for the proper application of average homogeneity tests. For this, the Jarque-Bera test was used as an aid, and a significance level of = 5% was adopted (Table 6).
The data analyzed in Table 6 shows that, for both analyzed parameters, the p-value is greater than , and it is concluded that the data follow a normal distribution. Therefore, from the application of this test, it is noted that both the maximum load and the cracking load meet the normality criteria. To graphically verify the adherence of the behavior of the variables with the normal distribution, the probability density histogram was used as an aid, as it serves as an approximation of the PDF (Probability Density Function) of the observed data (Figure 8).

Observing Figure 8, for both parameters, it is visually verified that the data approximately follow a normal distribution, as previously verified, since the normal curve tracing presents good adherence with the probability density histogram. Therefore, this histogram type approximates the PDF of the observed data and can serve as a basis for a visual comparison when performing an adherence test to verify the distribution that characterizes a sample.
Continuing the analysis related to the behavior of loads, for the proper application of average homogeneity tests, similar to what was shown for data normality, a study was carried out regarding the homoscedasticity of sample data. Thus, it was demonstrated that, for both parameters analyzed, the data followed a normal distribution, and both Bartlett and Hartley tests were used as aids. Moreover, a significance level of = 5% was used, and the data referring to this study are shown in Table 7.
The data in Table 7 show that for the Bartlett test, the p-value is greater than and it is concluded that the variances of the loads are equivalent; for the Hartley test, the p-value is also greater than , and it is also concluded that the variances of the loads are equivalent. Given the above, the normality and homoscedasticity of the analyzed data can be verified. Therefore, to evaluate the homogeneity of the samples, the T-test was used as an aid. Also, a significance level of = 5% was used, and the data referring to this study are shown in Table 8.
The data analyzed in Table 8 show that the p-value is greater than , and the conclusion is that the loads are statistically equivalent. Therefore, it is concluded that the samples come from an equally distributed population, as the difference is not statistically significant. Therefore, despite the differences previously shown in the analyses, it can be seen through the application of this test that the two parameters present homogeneity in the samples, meaning that there is no statistically significant difference between the maximum load and the cracking load, ensuring that the analyzed loads have equal distribution functions, even when the concrete has a preferential orientation of the fibers.
From this, it is noted that the results of the SFRC beams investigated in this work, despite presenting the preferential orientation of the fibers as a parameter, present behavior similar to that already illustrated in the literature for concretes with random dispersion of the fibers, as can be seen in the fib Model Code 2010 [22] and in ABNT NBR 16935: 2021 [24]. This shows that for the SFRC beams analyzed, the preferential orientation of the fibers did not directly influence the differentiation of the investigated loads.
3.2 Analysis of PFRC beams
In continuation, similar to what was shown above, the same statistical analysis procedure was carried out for the loads for the PFRC. Therefore, the statistical characterization of the data referring to the beams with polymeric fibers was also carried out using Maple and Excel software programs. Data regarding the maximum load and cracking load of the PFRC can be seen in Table 9. Furthermore, the curves obtained from the bending test referring to the force versus displacement of the beams are illustrated in Figure 9.
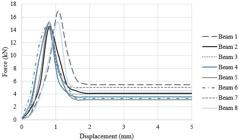
According to the data presented in Table 9 and through the analysis of the graph force versus displacement (Figure 9), it is possible to observe that the beams present a softening behavior. This means that, after reaching the maximum load, there was a gradual reduction in the force values, i.e., the softening behavior represents a progressive loss of stiffness in the matrix after the composite reaches the maximum load. To make this statement more evident, Figure 10 shows the individual behavior of beams 1 and 3 (beams with similar behavior), where the maximum load is equivalent to 16.92 kN and 14.92 kN, respectively, and the cracking load equivalent to 6.33 kN and 4.42 kN, respectively.

Still analyzing Table 9, it is also verified that the maximum load presents higher values of standard deviation and variance; however, the coefficient of variation referring to the cracking load is higher. Regarding the standard deviation, the maximum load has a higher value, which means that the cracking load data are more homogeneous. Regarding the variance, the maximum load also has a higher value, meaning that the cracking load data are closer to the average. Moreover, with regard to the coefficient of variation, the cracking load has a higher value, which means that the maximum load data have less dispersion around the mean.
From this and continuing the analysis, to verify this variation of a load in relation to the other, Table 10 displays the results referring to the variation of the maximum load in relation to the cracking load. From Table 10, it can be seen again that the maximum load values are higher than the cracking load. Still, it can be seen that all variations are significant, showing discrepancies greater than 100%, which shows that the cracking loads are much smaller than the maximum loads. In view of this and to investigate these significant variations, the load versus time graph was analyzed and it was possible to observe that, for the time corresponding to the cracking load, the matrix had already ruptured and reached its maximum load.
This means that the element reached the maximum load, but only cracked afterward (which corresponds to the cracking load). This delay in cracking may have occurred due to the modulus of elasticity of the polymeric fibers because these fibers increase the deformation capacity, which allows better control of the speed of crack propagation [38]–[43]. This behavior can be seen in Figure 10, for example, where beam 1 presents a maximum load equivalent to 16.92 kN and shortly after a cracking load equivalent to 6.33 kN, referring to a greater displacement than for the load maximum due to the increase in time of test.
This shows that polymeric fibers can delay the appearance of cracks and, consequently, influence the formation of cracks, which is related to the cracking load. Thus, taking into account that for concretes with random fiber distribution, the softening behavior is characterized by post-cracking mechanical behavior in which the load maintenance is below the cracking load, where the maximum load is equivalent to the cracking load, it is verified in this work that for concrete with preferential orientation of the fibers, the softening behavior is characterized by post-rupture mechanical behavior of the matrix in which the maintenance of the load is below the maximum load, regardless of the formation of the crack, which can happen equally or after the matrix rupture.
In this context, using ABNT NBR 16935: 2021 [24] as an aid for the analysis of concrete with random fiber distribution, the behavior of concrete with preferential fiber orientation (study investigated) occurred differently from the behavior expected for concrete with random fiber distribution. Furthermore, this study was not compared with similar studies because no works were found in the literature addressing the relationship between the maximum load and the cracking load of concrete with preferential fiber orientation.
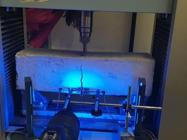
Continuing, it is important to mention that when analyzing the time corresponding to the formation of cracks, it was possible to observe the cracking pattern in the beams tested. Thus, taking into account the influence of the preferential orientation of the fibers in the matrix, it can be said that there is a tendency to have only one larger (predominant) crack in the beams, as can be seen in the work of Singh et al. [41]. As an illustration, Figure 11 shows the cracking pattern of the beams tested at the end of the test. It is worth noting that this behavior occurred for both the PFRC and SFRC beams.
Still, continuing the analysis related to the behavior of the loads, for the proper application of average homogeneity tests, a preliminary study was carried out regarding the normality of the data. For this, the Jarque-Bera test was used as an aid and a significance level of = 5% was adopted (Table 11).
Table 11 shows that, regarding the maximum load, the p-value is less than , and it is concluded that the data do not follow a normal distribution. In relation to the cracking load, the p-value is greater than , and it is concluded that the data follow a normal distribution. Thus, to graphically verify the adherence of the behavior of the variables to the normal distribution, the probability density histogram was used as an aid (Figure 12).

Figure 12 shows that, for the maximum load, there is not such good adherence between the normal curve and the probability density histogram since a good part of the histogram does not fit the normal curve, illustrating that the data for the maximum load do not follow a normal distribution. As for the cracking load, it can be seen that the normal curve traces good adherence with the probability density histogram, which illustrates that the data approximately follow a normal distribution.
In continuing the analysis related to the behavior of loads, a study was carried out regarding homoscedasticity. Therefore, as the application of the homoscedasticity test evaluates the variance of the two samples together, it was preferred to consider that the samples do not fit the behavior of a normal distribution since the maximum load data do not follow a normal distribution. Thus, the Levene test was used as an aid, with a significance level of = 5% was adopted (Table 12).
The data analyzed in Table 12 showed that the p-value is greater than and it is concluded that the variances of the analyzed loads are equivalent. Thus, in summary, the variances of the analyzed loads are equivalent, and it is verified that, for the maximum load, the data do not follow a normal distribution, and for the cracking load, the data follow a normal distribution. Therefore, as the application of the average homogeneity tests evaluates the samples together, it was preferred to consider for this analysis that the samples do not fit the behavior of a normal distribution. For this, the Mann-Whitney test was used as an aid for the study of homogeneity, and a significance level of = 5% was adopted (Table 13).
Analyzing the data illustrated in Table 13, it appears that the p-value is smaller than and it is concluded that the loads are not statistically equivalent. Therefore, it is noted that the samples do not come from an equally distributed population, as the difference is statistically significant, which means that the maximum load is statistically different from the cracking load for the PFRC sample studied.
It is worth remembering that, according to the fib Model Code 2010 [22] for example, the softening behavior represents a gradual loss of stiffness in the matrix after the composite reaches the cracking load, and the hardening behavior indicates that, after reaching the cracking load, the element may present a redistribution of forces and have a load greater than the cracking load. This shows that, when the fibers are randomly distributed in the matrix, the loads can be considered statistically equivalent. In the softening phase, the maximum load assumes a value comparable to the cracking load, whereas, in the hardening phase, the maximum load assumes a value greater than the cracking load.
In view of this, when the elements show softening and the fibers are randomly distributed in the matrix, the maximum load is equivalent to the cracking load. However, this behavior did not occur for the work analyzed, where the influence of the preferential orientation of the fibers in the matrix can be noted. Thus, it is noted that the results of the investigated PFRC beams present different behavior to what is illustrated in the literature for concretes with random fiber dispersion, as can be seen in the fib Model Code 2010 [22] and in ABNT NBR 16935: 2021 [24]. This shows that for the analyzed PFRC beams, the preferential orientation of the fibers can directly influence the differentiation of the investigated loads.
In addition, when the FRC elements have fibers with a preferential orientation, there may be no statistical equivalence between loads, as observed in the study in question. As an illustration, when there is no statistical equivalence as has been considered in the literature, after the matrix rupture process, the neutral axis of the element may not correspond to the theoretical value admitted for concretes with random fiber distribution, which promotes variations in the design aspects of the element studied.
Furthermore, standards such as the fib Model Code 2010 [22] and ABNT NBR 16935: 2021 [24] do not verify the influence of the preferential orientation of fibers in concrete and base their studies on the hypothesis of random dispersion. In this context, for fibers randomly distributed in the matrix, are developed hypotheses related to forces, residual tensile strengths in flexure (, , , ) and deformations ( ), for example. Thus, when considering residual loads as an analysis parameter, it must be taken into account that this possibility of non-equivalence between loads may result in variations in the study of these residual loads.
However, it is worth mentioning that fiber orientation is not a simple parameter to achieve, since this orientation can be influenced by several factors, ranging from the mixing procedure to the final phase of concrete hardening. Thus, for the preparation of this work, the method adopted to induce this preferential orientation was with the concrete casting flow, taking into account the dimensions of the fibers, the concrete casting process (fresh concrete cast in the center) and the dimensions of the molds, as mentioned in the methodology.
Therefore, although the performance of fibers in concrete is associated, for example, with fiber content, fiber shape factor and fiber-matrix adhesion, and these parameters vary depending on the fiber used, it is clear in this work that the preferential orientation of the fibers can directly influence the differentiation of the loads investigated, which, consequently, promotes variations in the post-cracking mechanical behavior of the concrete.
In view of the above, it is noted that there may be a difference in behavior for concretes that have a preferential fiber orientation in relation to concretes with random fiber dispersion. In this context, future work is suggested to experimentally analyze models with random dispersion of fibers in relation to concrete with this preferential orientation. Furthermore, this study was not compared with other similar studies because no studies were found in the literature that analyze the relationship between the maximum load and the cracking load of concrete with preferential fiber orientation.
Another relevant aspect to be mentioned is that this study was developed for reduced-scale beams and for concretes with characteristic compressive strength less than or equal to 50 MPa, and the behavior for other structural elements and for concretes with higher strengths may be different from what was observed. However, although this work cannot be adapted to all situations of fiber-reinforced concrete structural elements, it is clear from the investigation that there may be an influence of the preferential orientation of the fibers in the differentiation of the FRC loads, which shows future perspectives for new works on the subject.
4 CONCLUSIONS
According to the investigation carried out for the SFRC beams, it was verified that the maximum load presented a greater variability of the data since the cracking load data were more homogeneous, closer to the average, and presented less dispersion around the mean. Regarding the PFRC beams, the maximum load showed higher standard deviation and variance values. However, the coefficient of variation referring to the cracking load was higher. Furthermore, this happened because, in relation to the standard deviation and variance, the cracking load data were more homogeneous and closer to the mean. Regarding the coefficient of variation, the maximum load data had less dispersion around the mean.
In view of this and continuing the analysis regarding the variations in loads for the SFRC beams, it was observed that when the element exhibits hardening behavior and the fiber exhibits a high modulus of elasticity (with the fiber presenting a preferential orientation), the maximum load can assume a higher value than the cracking load; however, there is no statistically significant difference between the maximum load and the cracking load, which means that the loads have equal distribution functions. Thus, despite some observed differences, it can be seen through the application of homogeneity tests that the two parameters present statistical equality in the samples.
Regarding PFRC beams, when the beam exhibits a softening behavior and the fiber denotes a low modulus of elasticity (with the fiber presenting a preferential orientation), the maximum load can assume a value much higher than the cracking load, showing discrepant variations between the two analyzed loads. In addition, it was found that there is a statistically significant difference between the maximum load and the cracking load for the PFRC beams, which means that the loads do not come from an equally distributed population and that they do not show statistical equality in the samples.
Therefore, it can be said that the present work achieved the initially suggested goals, where it was verified the relationship between the maximum and cracking loads of an SFRC sample and another one of PFRC, both with preferential fiber orientation and that will later be used for structural application, where it was found that, when using the preferential fiber orientation in the composite, the maximum load value may not correspond to the same cracking load value, showing that one will be higher than the other depending on the elasticity modulus of the fiber used and the post-cracking mechanical behavior of the FRC.
Thus, as there were variations between the analyzed loads (maximum load and cracking load) when using a preferential orientation of the fibers in the PFRC sample, the design load should be determined later and, consequently, the possible variations in the dimensioning aspects that this preferential orientation of the fibers can provide to the composite, as in the variations in the determination of the positioning of the neutral line of the structure.
ACKNOWLEDGEMENTS
The authors thank the Postgraduate Program in Civil Engineering and the Laboratory of Structures and Materials of the Federal University of Alagoas for supporting this research.
-
Financial support:
The authors declare that funds were received from the Coordination for the Improvement of Higher Education Personnel (CAPES) during the preparation of this manuscript.
-
Data Availability:
The data that support the findings of this study are available from the corresponding author, [IEPL], upon reasonable request.
-
How to cite:
I. E. P. Lima, and A. S. R. Barboza, “Evaluation of the maximum load value and cracking load in fiber-reinforced concrete,” Rev. IBRACON Estrut. Mater., vol. 18, no. 2, e18212, 2025, https://doi.org/10.1590/S1983-41952025000200012
REFERENCES
-
1 M. Di Prisco, M. Colombo, and D. Dozio, “Fibre-reinforced concrete in fib Model Code 2010: Principles, models and test validation,” Struct. Concr., vol. 14, no. 4, pp. 342–361, Sep 2013, http://dx.doi.org/10.1002/suco.201300021
» http://dx.doi.org/10.1002/suco.201300021 -
2 M. Di Prisco, G. Plizzari, and L. Vandewalle, “Fibre reinforced concrete: new design perspectives,” Mater. Struct., vol. 42, no. 9, pp. 1261–1281, Sep 2009, http://dx.doi.org/10.1617/s11527-009-9529-4
» http://dx.doi.org/10.1617/s11527-009-9529-4 -
3 E. Vassaneli, F. Micelli, M. A. Aiello, and G. Plizzari, “Crack width prediction of FRC beams in short and long term bending condition,” Mater. Struct., vol. 47, no. 1-2, pp. 39–54, Mar 2012, http://dx.doi.org/10.1617/s11527-013-0043-3
» http://dx.doi.org/10.1617/s11527-013-0043-3 -
4 L. Ferrara, Y. D. Park, and S. P. Shah, “A method for mix-design of fiber-reinforced self-compacting concrete,” Cement Concr. Res., vol. 37, no. 6, pp. 957–971, Mar 2007, http://dx.doi.org/10.1016/j.cemconres.2007.03.014
» http://dx.doi.org/10.1016/j.cemconres.2007.03.014 - 5 E. García-Taengua et al. “Self-compactability and strength criteria for concrete mixes with mineral additions and fibres”, in Concrete – Innovation and Design, fib Symposium, Copenhagen, May, 2015, pp. 18–20.
- 6 M. M. Lopes, “Substituição parcial de armaduras de flexão em vigas de concreto”, Ph.D. dissertation, Postgraduate Engineering Program, Federal University of Rio de Janeiro, Rio de Janeiro, 2005.
- 7 A. E. Naaman “Fiber reinforcements for concrete: looking back, looking ahead”, in Fifth International RILEM Symposium on Fibre-Reinforced Concrete (FRC), U.S.: RILEM Publications SARL, 2000, pp. 65–86.
-
8 S. J. Barnett, J. F. Lataste, T. Parry, S. G. Millard, and M. N. Soutsos, “Assessment of fibre orientation in ultra high performance fibre reinforced concrete and its effects on flexural strength,” Mater. Struct., vol. 43, no. 7, pp. 1009–1023, Oct 2010, http://dx.doi.org/10.1617/s11527-009-9562-3
» http://dx.doi.org/10.1617/s11527-009-9562-3 - 9 A. Bentur and S. Mindess Fiber Reinforced Cementitious Composites, 2nd ed. New York, U.S: Modern Concrete Technology Series, 2007.
-
10 S. T. Kang and J. K. Kim, “Investigation on the flexural behavior of UHPCC considering the effect of fiber orientation distribution,” Constr. Build. Mater., vol. 28, no. 1, pp. 57–65, Oct 2012, http://dx.doi.org/10.1016/j.conbuildmat.2011.07.003
» http://dx.doi.org/10.1016/j.conbuildmat.2011.07.003 -
11 A. Abrishambaf, J. A. O. Barros, and V. M. C. F. Cunha, “Relation between fibre distribution and post-cracking behaviour in steel fibre reinforced self-compacting concrete panels,” Cement Concr. Res., vol. 51, pp. 57–66, Apr 2013, http://dx.doi.org/10.1016/j.cemconres.2013.04.009
» http://dx.doi.org/10.1016/j.cemconres.2013.04.009 -
12 M. Di Prisco, P. Martinelli, and B. Parmentier, “On the reliability of the design approach for FRC structures according to fib Model Code 2010: the case of elevated slabs,” Struct. Concr., vol. 17, Feb 2016, http://dx.doi.org/10.1002/suco.201500151
» http://dx.doi.org/10.1002/suco.201500151 -
13 J. M. Torrents, A. Blanco, P. Pujadas, A. Aguado, P. J. García, and M. A. S. Moragues, “Inductive method for assessing the amount and orientation of steel fibers in concrete,” Mater. Struct., vol. 45, no. 10, pp. 1577–1592, Apr 2012, http://dx.doi.org/10.1617/s11527-012-9858-6
» http://dx.doi.org/10.1617/s11527-012-9858-6 -
14 D. Y. Yoo, S. T. Kang, and Y. S. Yoon, “Effect of fiber length and placement method on flexural behavior, tension-softening curve, and fiber distribution characteristics of UHPFRC,” Constr. Build. Mater., vol. 64, pp. 67–81, Apr 2014, http://dx.doi.org/10.1016/j.conbuildmat.2014.04.007
» http://dx.doi.org/10.1016/j.conbuildmat.2014.04.007 - 15 L. Ferrara “High performance fiber reinforced self-compacting concrete (HPFRSCC): a smart material for high end engineering applications”, in 3rd International Workshop on Heterogeneous Architectures and Computing, Madrid, 2012.
-
16 F. Laranjeira, A. Aguado, C. Molins, S. Grünewald, J. Walraven, and S. Cavalaro, “Framework to predict the orientation of fibers in FRC: A novel philosophy,” Cement Concr. Res., vol. 42, no. 6, pp. 752–768, Feb 2012, http://dx.doi.org/10.1016/j.cemconres.2012.02.013
» http://dx.doi.org/10.1016/j.cemconres.2012.02.013 -
17 L. Martinie, P. Rossi, and N. Roussel, “Rheology of fiber reinforced cementitious materials: classification and prediction,” Cement Concr. Res., vol. 40, no. 2, pp. 226–234, Aug 2010, http://dx.doi.org/10.1016/j.cemconres.2009.08.032
» http://dx.doi.org/10.1016/j.cemconres.2009.08.032 - 18 L. Ferrara, “Tailoring the orientation of fibres in high performance fibre reinforced cementitious composites: Part 1-experimental evidence, monitoring and prediction,” Int. J. Mater. Struct. Integr., vol. 9, no. 1-3, pp. 72–91, 2015.
-
19 P. Martinelli, M. Colombo, P. Pujadas, A. De La Fuente, S. Cavalaro, and M. Di Prisco, “Characterization tests for predicting the mechanical performance of SFRC floors: identification of fibre distribution and orientation effects,” Mater. Struct., vol. 54, no. 2, Jan 2021, http://dx.doi.org/10.1617/s11527-020-01598-2
» http://dx.doi.org/10.1617/s11527-020-01598-2 -
20 L. Martinie and N. Roussel, “Simple tools for fiber orientation prediction in industrial practice,” Cement Concr. Res., vol. 41, no. 10, pp. 993–1000, May 2011, http://dx.doi.org/10.1016/j.cemconres.2011.05.008
» http://dx.doi.org/10.1016/j.cemconres.2011.05.008 -
21 A. Mudadu, G. Tiberti, F. Germano, G. Plizzari, and A. Morbi, “The effect of fiber orientation on the post-cracking behavior of steel fiber reinforced concrete under bending and uniaxial tensile tests,” Cement Concr. Compos., vol. 93, pp. 274–288, Oct 2018, http://dx.doi.org/10.1016/j.cemconcomp.2018.07.012
» http://dx.doi.org/10.1016/j.cemconcomp.2018.07.012 - 22 Federation Internationale du Béton, fib Model Code for concrete structures 2010 Switzerland, fib, 2013.
- 23 American Concrete Institute, Indirect method for obtaining the stress/strain response of fiber-reinforced concrete, ACI 544.8R-16, 2016.
- 24 Brazilian Association of Technical Standards, Design of fiber-reinforced concrete structures – Procedure, ABNT NBR 16935, 2021.
- 25 R. D. Toledo, “Materiais compósitos reforçados com fibras naturais: caracterização experimental”, M.S. thesis, Catholic Pontifical University of Rio de Janeiro, Rio de Janeiro, 1997.
-
26 I. H. Yang, C. Joh, and B. S. Kim, “Structural behavior of ultra high performance concrete beams subjected to bending,” Eng. Struct., vol. 32, no. 11, pp. 3478–3487, Aug 2010, http://dx.doi.org/10.1016/j.engstruct.2010.07.017
» http://dx.doi.org/10.1016/j.engstruct.2010.07.017 - 27 European Committee for Standardization, Test method for metallic fiber-reinforced concrete – Measuring the flexural tensile strength (limit of proportionality (LOP), residual), EN 14651, 2007.
- 28 Brazilian Association of Technical Standards, Fiber reinforced concrete – Determination of flexural tensile strengths (proportionality limit and residual strengths) – Test method, ABNT NBR 16940, 2021.
- 29 P. C. C. Gomes, R. Gettu, and L. Agulló “Uma nova metodologia para obtenção de concreto autoadensável de alta resistência com aditivos minerais”, in 5th EPUSP Symposium on concrete structures, São Paulo, 2003.
- 30 I. E. P. Lima, “Estudo dos aspectos de dimensionamento de elementos estruturais de concreto reforçado com fibras com base na teoria de flexão em vigas”, Ph.D. dissertation, Postgraduate Program in Civil Engineering, Federal University of Alagoas, Maceió, Alagoas, 2020.
- 31 A. S. R. Barboza, “Análise da relação de causa e efeito entre a orientação das fibras metálicas e o comportamento estrutural de vigas de concreto com fibras e agregados reciclados”, M.S. thesis, São Carlos School of Engineering, University of São Paulo, São Carlos, São Paulo, 2016.
- 32 Brazilian Association of Technical Standards, Self-compacting concrete. Part 2 – Determination of spreadability, flow time and visual stability index – Abrams cone method, ABNT NBR 15823-2, 2017.
- 33 A. H. V. Melo, “Análise experimental da influência do fluxo de lançamento na orientação das fibras em elementos planos de concreto autoadensável reforçado com fibras de aço”, Ph.D. dissertation, Federal University of Alagoas, Maceió, Alagoas, 2018.
- 34 A. R. Barros, “Avaliação do comportamento do concreto auto-adensável reforçado com fibras de aço”, Ph.D. dissertation, Postgraduate Program in Civil Engineering, Federal University of Alagoas, Maceió, Alagoas, 2009.
- 35 A. Blanco, “Characterization and modelling od SFRC elements”, M.S. thesis, Universitat Politècnica de Catalunya, Spain, 2013.
- 36 A. Jansson, “Effects of steel fibres on cracking in reinforced concrete”, M.S. thesis, Department of Civil and Environmental Engineering, Chalmers University of technology, Gothenburg, Sweden, 2011.
-
37 B. Mobasher, Y. Yao, and C. Soranakom, “Analytical solutions for flexural design of hybrid steel fiber reinforced concrete beams,” Eng. Struct., vol. 100, pp. 164–177, Jun 2015, http://dx.doi.org/10.1016/j.engstruct.2015.06.006
» http://dx.doi.org/10.1016/j.engstruct.2015.06.006 - 38 L. F. Caetano, A. G. Graeff, E. O. Garcez, S. T. Bernardi, and L. C. Silva Filho “Compósito de matriz cimentícias reforçada com fibras”, in 2nd Building Pathology Seminar, Porto Alegre, 2004.
-
39 S. H. P. Cavalaro and A. Aguado, “Intrinsic scatter of FRC: an alternative philosophy to estimate characteristic values,” Mater. Struct., vol. 48, no. 11, pp. 3537–3555, Sep 2015, http://dx.doi.org/10.1617/s11527-014-0420-6
» http://dx.doi.org/10.1617/s11527-014-0420-6 - 40 M. A. F. Onuki and P. A. Gasparetto, “Comparativo das propriedades do concreto no estado fresco e endurecido com adição de fibras de aço e de polipropileno”, Ph.D. dissertation, Federal Technological University of Paraná, Curitiba, Paraná, 2013.
-
41 M. Singh, A. H. Sheikh, M. S. Mohamed Ali, P. Visintin, and M. C. Griffith, “Experimental and numerical study of the flexural behaviour of ultra-high performance fibre reinforced concrete beams,” Constr. Build. Mater., vol. 138, pp. 12–25, Feb 2017, http://dx.doi.org/10.1016/j.conbuildmat.2017.02.002
» http://dx.doi.org/10.1016/j.conbuildmat.2017.02.002 - 42 J. T. Santos, “A influência das fibras de polipropileno no controle da fissuração por retração”, Ph.D. dissertation, Polytechnic School of the University of São Paulo, University of São Paulo, São Paulo, 1999.
-
43 H. Zhu, Z. Li, C. Wen, S. Cheng, and Y. Wei, “Prediction model for the flexural strength of steel fiber reinforced concrete beams with fiber-reinforced polymer bars under repeated loading,” Compos. Struct., vol. 250, pp. 112609–112634, Jun 2020, http://dx.doi.org/10.1016/j.compstruct.2020.112609
» http://dx.doi.org/10.1016/j.compstruct.2020.112609
Edited by
-
Editors:
Vladimir Haach, Daniel Cardoso.
The data that support the findings of this study are available from the corresponding author, [IEPL], upon reasonable request.