 Predictive models for concrete strength estimation of existing bridges in Brazil
Abstract
Abstract This work presents a review of nondestructive techniques for concrete strength estimation. Also, five predictive models are proposed for existing bridges in Brazil, based on ultrasonic pulse velocity (UPV) measurements. The models were calibrated through empirical random regression, cross-validation procedure, bi-objective approach, Bayesian updating, and using a 95% confidence interval. The models were assessed within the database and against datasets found in the literature. The empirical regression, cross-validation, and bi-objective techniques provided the most accurate results for the present dataset. The 95% confidence interval avoids overestimating the concrete strength, but it results in poor model correlation. The Bayesian inference model was the one that best predicted the strength of datasets outside its scope of validation.
Keywords:
concrete strength; UPV; existing structures; bridges; predictive model
Resumo
Resumo Este trabalho apresenta uma revisão de técnicas não-destrutivas para estimativa da resistência do concreto em estruturas existentes. Além disso, são propostos cinco modelos preditivos para pontes Brasileiras, a partir de medições de velocidade de pulso ultrassônico (UPV). Os modelos foram calibrados por meio de regressão empírica, validação cruzada, abordagem biobjetiva, atualização Bayesiana e através de um intervalo de confiança de 95%. Os modelos foram avaliados dentro do banco de dados e comparados com conjuntos de dados da literatura. A regressão, a validação cruzada e a abordagem biobjetiva forneceram os resultados mais precisos para os dados deste trabalho. O intervalo de confiança de 95% evitou a superestimativa da resistência do concreto, mas obteve uma correlação fraca do modelo. O modelo de inferência bayesiana melhor previu a resistência fora de seu escopo de validação.
Palavras-chave:
resistência do concreto; UPV; estruturas existentes; pontes; modelos preditivos
1 INTRODUCTION
The analysis of existing and new structures involves distinct considerations and approaches. Whereas a new structure is analyzed by its construction plans, the evaluation of an existing one must consider its age, the materials used, historical context, and any previous modifications or repairs. It also requires a careful examination of the structural integrity, potential deterioration, and the effects of aging. Thus, understanding the original design intent and construction methods becomes crucial to assessing deviations or vulnerabilities.
Ordinarily, an existing structure is assessed by visual inspections, which provide data on the defects found, but are not enough for structural evaluation [1]. The structural safety assessment of existing bridges requires knowledge of some concrete properties, including the concrete strength (CS) [2]. An alternative to estimating CS is seeking information from original design specifications or building test reports; however, experience has shown poor reliability when related to the actual concrete properties [3]. Thus, the use of more complex techniques is required. The most reliable strategy is to extract concrete cores from the structure and test them in laboratories, but it is expensive, time-consuming, and may affect the overall structural capacity [3] –[7]. Another possibility is to obtain data based on non-destructive techniques (NDT), which are preferable due to their simplicity and practical application.
Some studies have used NDT for the safety assessment of structures without construction plans, including existing bridges [8] –[13]. In Brazil, there are approximately 137,000 bridges, of which 6,612 are under the responsibility of the National Department of Transport Infrastructure (DNIT) [14]. Managing so many bridges, considering Brazil’s continental dimensions and using conventional inspection methods, becomes a costly task. The lack of policies and new strategies aimed at the maintenance of public structures over the past decades has intensified the process of wear and deterioration of highways, directly affecting bridges, which, in general, present structural and functional damage [14].
1.1 Concrete strength estimation with NDT
The use of NDT measurements for concrete strength estimation is well-established in literature, as it has been a field of study since the 1960s [15]. Accordingly, the challenges involved in NDT application are also known. Currently, NDTs are a tool for analyzing the homogeneity of concrete, and when combined with coring strategies, they may result in predictive models [16]. Over the past few decades, several predictive models have been created; however, the improper use of non-destructive data may yield incorrect estimates of the concrete properties [3], [16]. The current issue regarding strength estimation is not to estimate the true concrete strength, but to limit the risk of a wrong evaluation and how to mitigate the errors arising from random NDT measurements or coring without accounting for the inherent randomness and variability of the material [17], [18].
It is well-known among researchers that concrete compressive strength is highly dependent on its constitution, which is influenced by regional features, such as resource availability, most used techniques, and materials composition. Other limitations not addressed as often are the uncertainties associated with predicting concrete compressive strength based on NDT measurements [19] and the potential errors in interpreting results for existing structures based on models developed and calibrated in laboratories [16].
Beyond the challenges involved in data acquisition, choosing which model to employ is a crucial step in resolving practical data science issues [20]. Although there are a large number of semi-empirical models to correlate NDT measurements with concrete strength, none of these models can be universally applied [21]. When incorrectly used, these models show significant deviations from the foreseen values and huge discrepancies between the estimated and measured strengths.
This paper discusses the current scenario for concrete strength estimation in existing structures worldwide. Also, a dataset of concrete strength and UPV values obtained in bridges located in Brazil is used for predictive model calibration. A few techniques are tested to evaluate the error metrics in models created using these tools.
2 BIBLIOMETRIC ANALYSIS
Many approaches and techniques are used to estimate the concrete strength in existing structures. The bibliometric analysis identifies the current global scenario of the application of NDT (Non-Destructive Testing) to diagnose the concrete strength in existing structures. The bibliometric analysis methodology is a two-phase process. First, four distinct queries were entered into the Scopus database, defined in Table 1. Query 01 is the more general search correlating NDT to concrete strength estimation conducted for the first time on November 6, 2023, and updated on November 6, 2024, while the others were conducted on March 27, 2025. All queries included documents published from 2014 onwards and limited to English
When assessing the use of NDT for strength estimation in existing structures (Query 02), the number of results reduces from 892 to 180. For bridge assessments (Query 03), 122 documents were found. When we restrict the search to using NDT for existing bridges (Query 04) and filter study areas limited to engineering and materials science, the result drops to only 15 publications, which means that, within the criteria adopted in this work, only 15 studies were found that addresses the use of ultrasound testing to evaluate existing bridge structures, in the last 10 years, highlighting the scarcity of research on this topic at a global level.
Subsequently, the documents found through Query 01 were analyzed using the Scopus result analysis tool and imported into VOSviewer and Bibliometrix software. The data were mapped based on keyword co-occurrence, most relevant authors and sources, publication date, and location.
Query 01 found 892 documents, of which 632 were articles, 201 conference papers, 21 conference reviews, 21 book chapters, and 11 reviews. An analysis by year of publication, shown in Figure 1, reveals a growing trend in research on the topic, reaching over 100 documents published in the last three years. These numbers show that this field has been highly studied and is a major concern in the structural analysis of existing buildings.

To refine the search results, information from the 892 documents found was exported as a CSV file and imported into VOSviewer software, where a network of relevant terms was created based on the co-occurrence of publication keywords. Figure 2 shows the result obtained for keywords cited at least five times. Similar terms that appeared in different writings were merged and considered as the same, such as “non-destructive test”, “nondestructive techniques” and “NDT”. Of the initial 2110 keywords, only 64 met the minimum number of occurrences. Based on the analysis, it is evident that the most commonly used NDTs for estimating concrete strength are ultrasonic pulse velocity (UPV) and the rebound hammer (RHT). Other frequently used terms referring to the concrete evaluation and strength estimation process include “prediction”, “sonreb”, “concrete variability”, “cores”, and “quality control”. The average publication year analysis shows that these keywords fall within the last five years, indicating that these are trending topics for estimating concrete strength. A promising area is the use of computational tools, which appeared in the keyword network represented by “machine learning”, “artificial neural networks” (ANN) and “artificial intelligence”.

Keywords network related to NDT use for concrete strength estimation obtained using VOSviewer.
The bibliometric analysis also showed the top 10 most relevant authors, who are those with the highest number of publications, as shown in Table 2. “Breysse D.” and “Sbartai, Z.M.” stand out as the authors with the highest number of published documents during the analyzed period, with 17 and 15, respectively. Authors whose names appeared more than once or in different writings were unified.
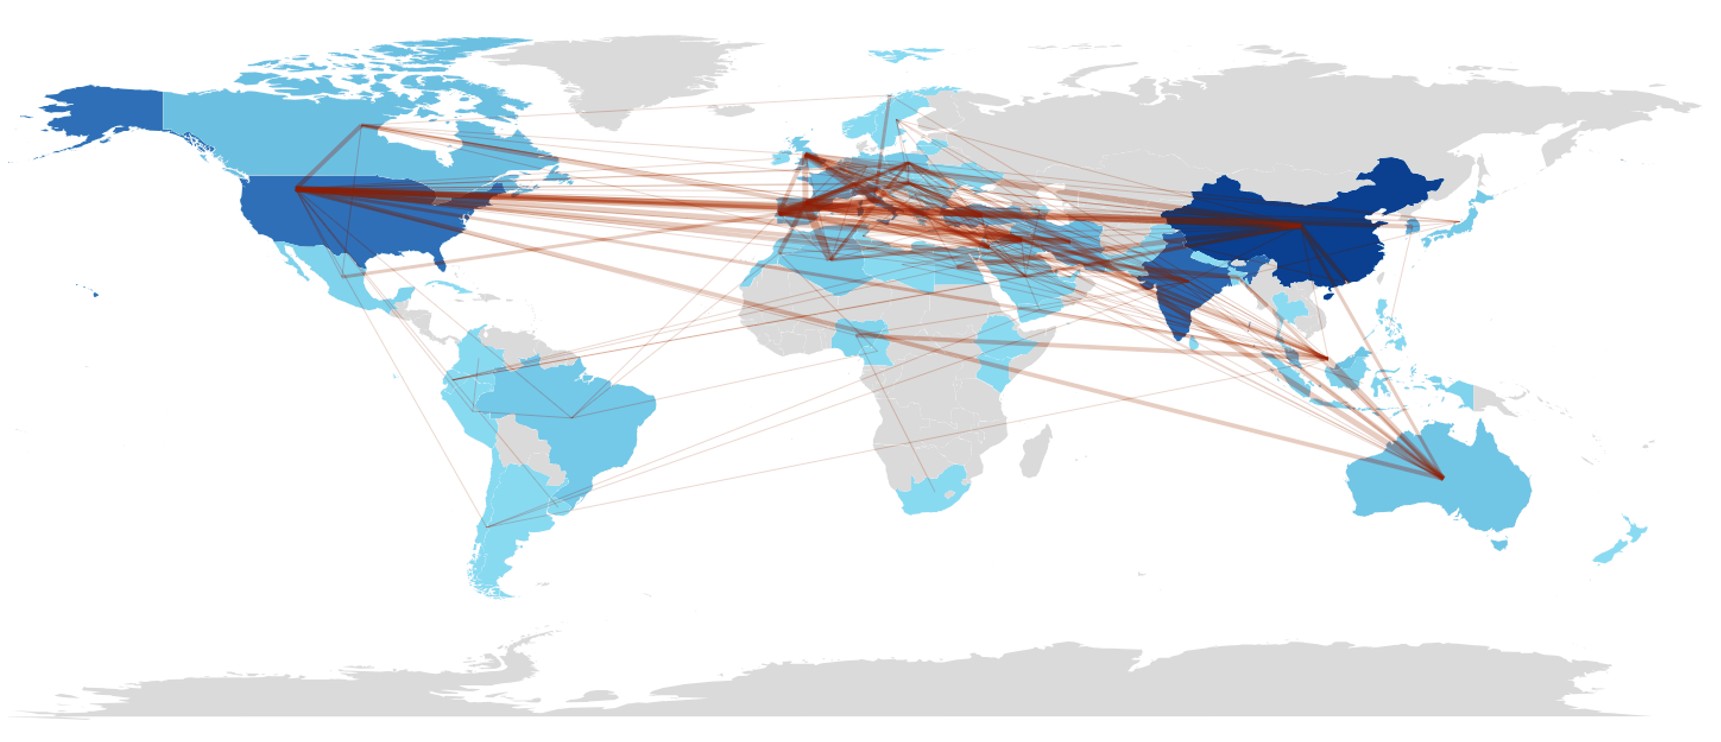
A collaboration analysis of the countries was created in Bibliometrix, as shown in Figure 3. The color of each country represents knowledge and scientific production, while the links represent collaboration between them. Countries with darker shades of blue have the highest number of publications, while those in gray have no publications among the analyzed documents.

As shown in Figures 3 and 4, China, India, and the United States have more publications and stronger connections. In Europe, Italy stands out as the country with the most publications. Additionally, European countries collaborate well with other continents, especially France. The strength of France's connections results from the relevance of Breysse D., affiliated to the University of Bordeaux, and Sbartai, Z.M., affiliated to the Institute of Mechanics and Engineering of Bordeaux, both in France. On the other hand, South America appears to be somewhat isolated in this context, with fewer and weaker connections to other continents. This scenario shows how research is concentrated in more developed countries, raising questions about the strategies used for estimating concrete strength in third-world countries, where research is focused on countries with close ties to Europe or the U.S. The scarcity of research may reflect the lack of resources that enable better evaluation strategies. Therefore, this article also focuses on achieving an ideal analysis framework that can be applied regardless of these limitations. It can also be observed in Figure 3 that Brazil has few published documents and connections with Cameroon, Morocco, Portugal, Peru, and the USA, corresponding to three collaborative works that address the use of NDT for studies on the technological control of materials. Additionally, nine international publications include Brazilian references.
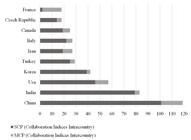
Top 10 countries with the largest collaborations and publications according to the Bibliometrix database based on the Corresponding Author’s Country.
Conducting a new search through Scopus on March 27, 2025, using the same terms from Query 01 in Table 1, this time restricting, in addition to the year of publication and document type, the language (in Portuguese or English) and the country of origin limited to Brazil, the results found decreased significantly. In this new query, 24 results were obtained, of which only 17 addressed the use of ultrasonic pulse velocity tests. The 17 selected documents were organized according to the area of study, as shown in Figure 5.
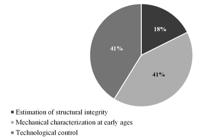
The graph in Figure 5 was generated based on the search results, showing that among the 24 Brazilian articles covering NDT, only 18% (three publications) aim to assess the structural integrity of aged structures. Of these, only one publication [22] specifically addresses the structural integrity assessment of bridges, highlighting the lack of studies on this topic at the national level.
3 ULTRASONIC PULSE VELOCITY
Ultrasonic pulse velocity (UPV) is a non-destructive testing (NDT) method that evaluates the characteristics of concrete by propagating an ultrasonic pulse through the material. The ultrasonic pulse is emitted by a transmitting transducer and received by a receiver [23]. The wave propagation can be related to material properties such as density, Poisson’s ratio, and dynamic modulus of elasticity [24], [25], which in turn can be correlated with the concrete strength [21]. Numerous predictive models have been developed to estimate compressive strength for early ages [26] –[30] and for existing structures [11], [16], [21], [31], [32].
Moreover, direct pulse propagation velocity values do not vary considerably between 25 MPa and 40 MPa, generally by less than 400 m/s [21]. Although less commonly used, indirect UPV has also been correlated with concrete strength [33], [34]. Direct UPV typically exhibits higher velocities than indirect UPV; however, the difference between direct and indirect UPV measurements decreases as the concrete strength increases [33].
3.1 Existing Standardized procedures for concrete strength estimation
3.1.1 EN 13791:2019
The methodology proposed by EN 13791:2019 [35] has two main options, which are the estimation based on direct (DT) and indirect (NDT) measurements and the assessment based solely on core strength data. If the estimation method includes the nondestructive evaluation of the structure, the first step is to define the test regions (TR), which are the region of homogeneous concrete. If the TR is smaller than 30 m3, the coring must include a minimum of three cores in locations defined by the NDT results. Otherwise, at least ten pairs (NDT, DT) are necessary for model identification. The second assessment path addresses situations when NDTs are not used. In this case, if the test region is smaller than 10 m3 and comprises fewer than four elements, the coring must include a minimum of three cores in each region. On the other hand, if these criteria are not met, a minimum of eight valid results of in situ compressive strength is required.
Ali-Benyahia et al. [36] assessed the EN 13791 requirements in an on-site scenario, and the analysis revealed the advantageous impact of the updated procedures introduced in the recent edition of EN 13791 on strength assessment. These procedures encompass the selection of coring positions, the prescribed number of cores, and the identification method of the conversion model. However, the statistical procedures suggested in the new version for calculating the in-situ characteristic strength may underestimate the outcomes and exhibit an excessively conservative approach compared to the 2007 version. Another difference between the recommendations of EN 13791 [35] and the 2007 version is the reduction in the minimum number of cores from 18 to 8 when an NDT method is used to evaluate the compressive strength.
3.1.2 Rilem TC 249-ISC
According to RILEM TC 249-ISC [37], the assessment has four main stages. The first stage is to decide the Estimation Quality Level (EQL), which describes the accuracy in predicting the mean concrete strength, the variability (standard deviation) of the estimated data, and the error in the estimation at each location. The second stage is the data collection step, in which the test regions are defined, and the Test Result Precision (TRP) is evaluated. According to the TRP, the number of concrete cores is determined based on tabular requirements. The core location is defined within the test regions identified, and the strength is measured. The third stage is the identification of the conversion model, which requires the selection of the identification approach and the conversion model mathematical format. The model establishment ends with the identification of the model parameters. Finally, the last stage is the model performance assessment and strength estimation.
4 MODEL CALIBRATION TECHNIQUES
4.1 Empirical Regression Fitting
Several conversion models have been created to estimate the concrete strength based on NDT measurements. Breysse [21] comprehensively reviewed 70 UPV conversion models. Exponential models (Equation 1 were the most common, with 26 models published between 1957 and 2010, combining laboratory and on-site measurements. The author identified that exponential and power law models followed a linear relationship between the coefficients a and b (Equation 2 in a semi-log diagram.
Accordingly, Pereira and Romão [38] also observed that exponential or power models are the best options for representing the relationship between the concrete strength and NDT measurements. The main challenge for empirical regression fitting is the amount of data required to achieve a predictive model with good performance indicators.
Cristofaro et al. [11] worked with 860 sets of data (RN, UPV, and fcore) from 263 buildings built between the 50s and 80s in Italy. Five mathematical SonReb models were created (linear, polynomial, power, exponential, and logarithmic). The proposed models proved to be very effective in predicting the strength of concrete of buildings made in Italy in the second half of the 20th century. This result indicates that concrete strength estimation could also be adopted for a portfolio of similar structures rather than one predictive model for each structure. It is worth noting that the models were created based on a vast database that included different concrete classes from various buildings evaluated over three decades. Still, [11] were able to correlate this dataset with concrete strength.
Even though empirical regression fitting is one of the most used model identification approaches, many authors have tried this approach and failed to obtain a significant correlation between NDT measurements and concrete compressive strength. Another issue concerning conventional empirical regressions is that they only correlate mean strength and do not describe the data distribution; thus, completely different data distributions may apparently fit the same model.
4.2 Bi-objective approach
The bi-objective approach is a methodology proposed by Alwash et al. [39] that aims to simultaneously optimize two objectives related to concrete strength prediction: the concrete strength based on NDT measurements and the associated uncertainty. For usual empirical models, two parameters are necessary for describing the shape of mathematical models, such as the exponential model described by Equation 1. These parameters are obtained by two conditions, which depend on the type of model adopted. The bi-objective approach assumes the conditions for determining the parameters are the two objectives related to concrete strength prediction, assuring that both the mean strength and the standard deviation are equal for real and estimated values [18], as described by Equations 3 and 4.
Alwash et al. [40] verified the robustness of the bi-objective approach in assessing concrete mean strength and variability. Even though the bi-objective approach is efficient for estimating the mean strength and the concrete variability, it fails to predict the local strengths at NDT locations [39], [41]. Saleh et al. [41] studied different model identification approaches to estimate concrete mean strength, variability, and characteristic strength. Based on synthetic and real datasets, all approaches can predict the mean strength with roughly the same confidence level. The bi-objective approach was the most efficient in quantifying concrete strength variability with the minimum number of cores, while quantile regression and regularized regression have the best estimates of local strengths.
4.3 Probabilistic approach
From a probabilistic point of view, the challenge is not to estimate the concrete strength but to limit the risk of a wrong estimation within an admissible interval [17]. The probabilistic approach inserts the idea of representing the NDT measurements through random variables with known distributions and ultimately incorporates risk into compressive strength estimation. The probabilistic approach accounts for the uncertainties involved in the strength estimation process, which means that to increase reliability, the uncertainties must be reduced by specifying and controlling their influencing factors [40].
The concrete strength usually fits a Gaussian distribution, and the European Standard EN 13791 [35] recommends that all data should be checked to ensure that it fits the Gaussian distribution, including RN, UPV measurements, and core strength. Other researchers have observed that the data usually fits a Gaussian distribution [42], [43]. However, in a practical study, Akgul [44] used multiple NDT techniques to evaluate a network of 100 bridges in Turkey. The bridges in this network were built between 1951 and 1977, with an average age of 56 years. Based on the data collected in the network, statistical distribution parameters were obtained using the maximum likelihood estimation (MLE) technique. Weibull distribution was fitted to the concrete strength, while UPV was fitted to a logistic distribution.
Mata et al. [45] proposed a novel correlation method, using probability interpretations to estimate the compressive strength of concrete based on in-situ ultrasonic pulse velocity (UPV) measurements. This method also considers the dispersion observed in UPV measurements. The results demonstrated the feasibility of determining the confidence interval for concrete compressive strength, given a specific percentile of the UPV measured on-site.
Confidence intervals are a statistical tool to quantify the uncertainty surrounding concrete strength predictions. A confidence interval provides a range within which the true value of the actual concrete compressive strength is expected to fall with a certain level of confidence – typically 95%. For strength estimation, the confidence interval incorporates a statistical margin that accounts for measurement variability and model uncertainties and limits the chance of overestimation or underestimation, which is critical for ensuring the structural integrity of existing bridges.
4.4 Bayesian Inference
Bayesian inference is a probabilistic approach to updating the probability function of concrete strength constructed using only NDT measurements [46]. This approach requires a prior distribution, which could be one of the challenges for its application [41]. While other probabilistic methods provide only point estimates of the model parameters, the Bayesian approach also provides the distribution of the parameters. Once the UPV test is calibrated, each NDT measure results in a Probability Density Function (PDF) [43].
Faroz et al. [43] proposed a Bayesian data fusion approach in which the statistical variability measured through NDT was combined with core strength to determine the probability distribution of in situ crushing strength and the characteristic value in each homogeneous zone. Giannini [46] conducted a similar study in which the prior distribution function was created only with UPV measurements. Even though the assessment conducted by Giannini et al. [46] had limited direct measurements (core strength), the authors observed that the estimation of the characteristic value of concrete strength is highly stable when there is a significant number of NDT measurements.
Miano et al. [7] used the probabilistic approach with Bayesian updating for RN and UPV readings of a dataset of multiple old buildings in Italy. The approach showed that RN readings were not significant for the SonReb model, and the UPV logarithmic linear model could be used without substantial loss of accuracy. The Bayesian inference framework was able to quantify the relative error of the non-destructive tests concerning the destructive core tests. A Bayesian calibration approach has also been used by Faroz et al. [47] alongside Bayesian model class selection and forward estimation for calibrating an NDT instrument in a probabilistic framework. Although the instrument calibrated in this study was not UPV or RH, the methodology could also be applied to these NDTs.
4.5 Cross-validation Procedure
The Cross-Validation Procedure (CVP) was proposed by Vasanelli et al. [48] to serve as a model validation technique that evaluates the ability of a statistical analysis to generalize its results to an external dataset. CVP assumes 80% of the data as a training set (TS) and 20% as a validation set (VS). Then, for each possible combination of TS and VS, a model is created and the RMSE is calculated, providing an estimation of the prediction error for each model and an estimate of the standard deviation of prediction errors (). Finally, the value of in situ compressive strength (UCS) is calculated at each testing location based on , and the CVP model is obtained through the curve passing from all the (NDT, UCS) points. An illustrative example of the CVP is shown in Figure 6, which is composed of five sets of data combined in five different ways to generate the models and obtain the CVP model.

One of the main advantages observed by Vasanelli et al. [48] is that the cross-validation procedure resulted in better reliability in estimating the compressive strength, even with a lower number of cores used to obtain the relationships. Even though it may seem like a simple process, the CVP could lead to high computational costs since the combination of all possible TS and VS grows quickly. In Figure 6, a total of five sets resulted in five different combinations; however, in the paper where the authors propose this approach, 18 sets (14 TS and 4 VS) resulted in 3060 different combinations.
5 UNCERTAINTIES IN STRENGTH ESTIMATION BASED ON NDT
Breysse et al. [49] describe four main groups of uncertainties involved in strength estimation based on NDT measurements: statistical uncertainty, measurement uncertainty, assessment methodology uncertainty, and material uncertainty. The statistical uncertainty is related to the limited dataset used for the model calibration. The measurement uncertainty includes both concrete strength measurements and NDT measurements, which would account for the environmental factors and the uncertainties related to the equipment, the operator, the device, and the measurement repeatability. The assessment uncertainty accounts for choosing the mathematical model and selecting the cores’ location. Finally, the material uncertainty includes the material’s statistical parameter itself, the average strength, and its standard deviation, which influence the fitting of the conversion model and the prediction error.
The within-test-repeatability uncertainty has a vital influence on the precision of NDT strength estimation [50] and should be quantified in each on-site investigation. Three levels of Test Result Precision (TRP) were identified by Breysse and Balayssac [49] and later adopted by EN 13791 [35] and RILEM [37]. The repeatability uncertainty can be homogeneous over the investigation domain or larger in some test regions; thus, the TRP should be evaluated before NDT application on the structure. Furthermore, reducing the uncertainty in the precision of test results enables a significant reduction in the number of cores required to estimate the concrete properties [17].
The uncertainty of the assessed compressive strength is highly dependent on the conversion model error, which depends on the model parameter identification based on a limited dataset [5]. Other uncertainties involved in data acquisition for model application are related to the difference between in-situ and core measurements since the in-situ data underestimates the velocities obtained in the core samples [16], [31], which could be related to the surface degradation of the in-situ concrete. The core velocities show lower variability and better fit the data from compressive strength [16]. This kind of uncertainty should also be accounted for when analyzing the concrete strength and variability in an existing structure since the prediction models are created based on core UPV measurements but the model is applied in measurements in situ.
Moreover, the location of the testing area inside the element also incorporates uncertainties into the estimation process. Thus, testing regions must preferably be located in zones without damage or cracking, where stresses due to applied loads are absent or at lower values [3]. Masi and Chiauzzi [51] observed a remarkable decrease in surface velocity along the beam alignment, especially in the central part, possibly due to the flexural moment. For columns, the casting process also affects the concrete strength [52]; however, the influence may depend on the technique used since contrasting results have reported increased and reduced concrete strength in the lower third of columns [52], [53]. Nevertheless, irrespective of the casting technique, the upper third of the column has lower density and strength, and both NDT measurements and core extractions should be located at the intermediate part of the column [52], [53].
Thus, the uncertainties can be divided into three groups based on their origin: the data acquisition uncertainties, the model creation uncertainties, and the application uncertainties, as shown in Figure 7.

The most local uncertainty in the data acquisition stage is the NDT repeatability error, which could be addressed by equipment calibration and operator training. Although the repeatability error cannot be eliminated, it can be reduced, which increases the reliability of the final strength estimation, as described by the TRP levels considered by standards [35], [37]. The material variability accounts for concrete randomness and spatial variability, which is related to where, inside the element, the NDT measurements should be conducted. A thorough NDT analysis is recommended, although some areas within the elements are known to provide an under or over-conservative strength estimation.
After the prior NDT assessment, the data obtained has to be evaluated to define regions that could be considered homogeneous. Furthermore, the location of core extraction inside the evaluated area is another source of uncertainties. Some sampling strategies can be used to better fit the conversion model. The final item for data acquisition is the interpretation of the NDT measurements, which considers the environmental factors and how they affect NDT results. Many influencing parameters affect UPV and RH measurements, such as concrete mix, age, humidity, and defects [21], and these parameters are relevant for the analysis of existing structures since the advanced age implies the carbonation of the concrete surface [54].
The uncertainties related to the model generation include statistical uncertainty, which corresponds to the amount of data used for creating the model and could be addressed by increasing the number of datasets. The model-identification approach and, consequently, the model performance highly affect the reliability of the estimated strength. Finally, the last group of uncertainties is related to the application of the model created, which encompasses the difference between core assessment and in-situ measurements observed by Vona [16], the difference between NDT and DT variability observed by Vona [16], Masi and Chiauzzi [51], and the overall model prediction error.
6 DATASET
The dataset evaluated in this work contains 25 pairs of data collected from four bridges located in Minas Gerais - Brazil, as shown in Table 3. Each pair represents the data for a core extracted from an existing bridge and contains a UPV measure and a compressive strength measure. All extracted cores are cylindrical with a 100 mm diameter and 200 mm height, and the UPV value presented is the average of three observations taken at each core.
7 PREDICTIVE MODELS
Based on the available dataset, prediction models for concrete strength were developed following the techniques previously described. In all cases, exponential models were chosen, following Equation 1. The results obtained through all techniques are presented in Table 4, using parameters a and b that describe the exponential model. Additionally, error metrics (MAE and RMSE) and the fit of the data to the models are also provided (R2).
7.1 Empirical Regression
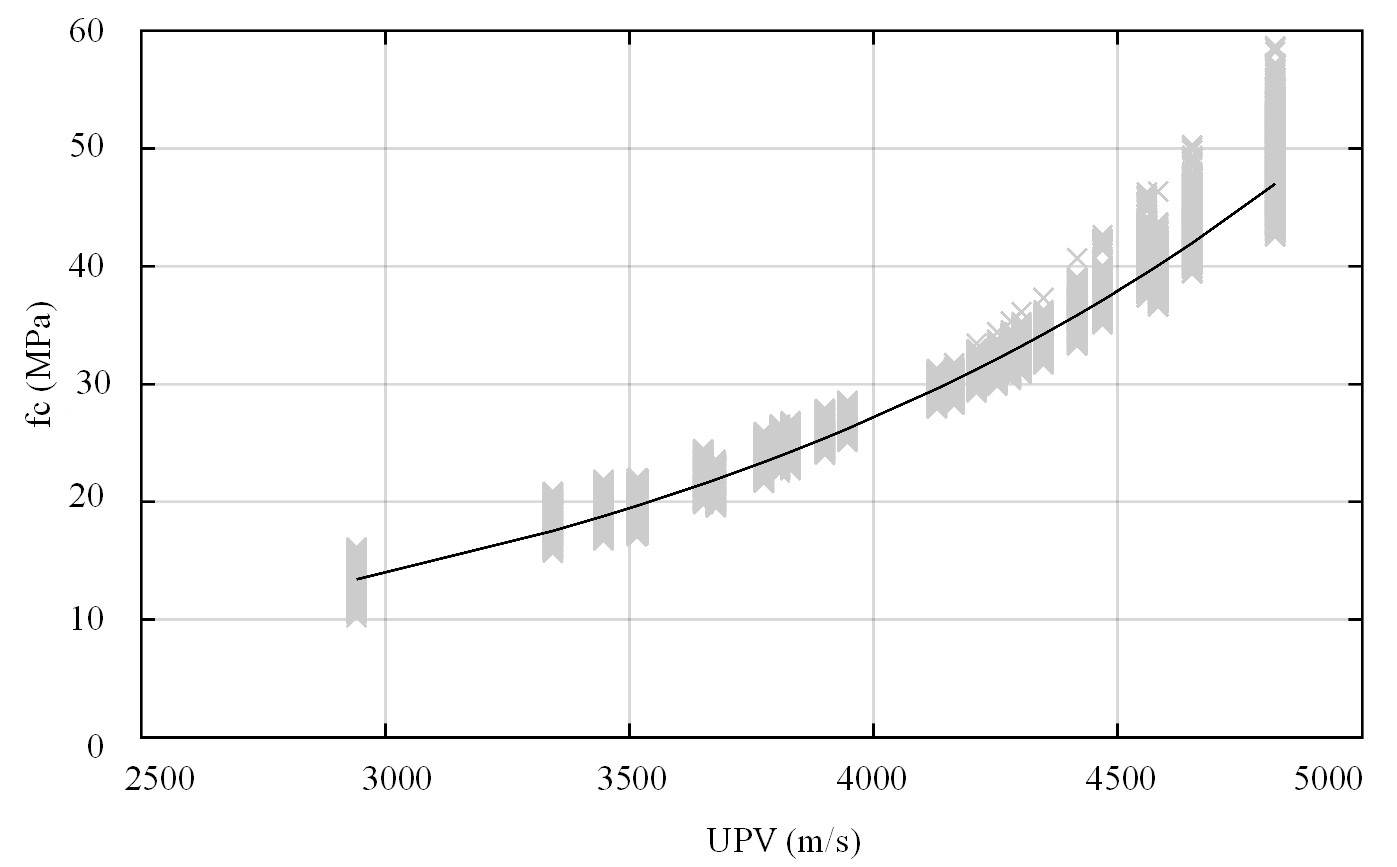
The dataset for the empirical regression model was divided into 80% for training and 20% for validation. The training sets for the models were obtained randomly from all possible combinations of the available data. The random empirical model follows an exponential form, described by the coefficients presented in Table 4 and illustrated in Figure 8.

The random empirical model yielded a Mean Absolute Error (MAE) of 5.15 MPa and a Root Mean Square Error (RMSE) of 5.47 MPa. RMSE is similar to MAE but penalizes larger deviations more heavily, making it a measure of error dispersion. The fit of the data to the proposed model resulted in an R2 value of 0.7071.
It should be pointed out that this model was built using a random selection of calibration and validation data sets. As such, different combinations of data sets could result in models with varying levels of accuracy. Therefore, cross-validation was performed to assess other combinations of data.
7.2 Cross-validation
Cross-validation followed the same data proportion for defining the training and validation sets. The 25 data pairs (UPV, fc) were combined into 53,130 combinations, using 20 data pairs for calibration and five for model application. All models created in this stage followed an exponential format, and the errors associated with each model were estimated. Based on these models, the concrete strength values were calculated for the validation sets, resulting in 265,650 samples, which originated the final cross-validation model, as presented in Figure 9. The coefficients that describe the model are listed in Table 4
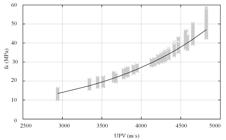
Error metrics were calculated by comparing the predicted values with those in Table 3. When the predicted samples were analyzed individually, the cross-validation model presented an MAE of 4.86 MPa and an RMSE of 5.39 MPa, with a data fit of R2 equal to 0.7053. On the other hand, when comparing the average strength obtained through the mean velocity with the average resistance obtained for each bridge, the MAE and RMSE decreased to 3.24 MPa and 4.91 MPa, respectively.
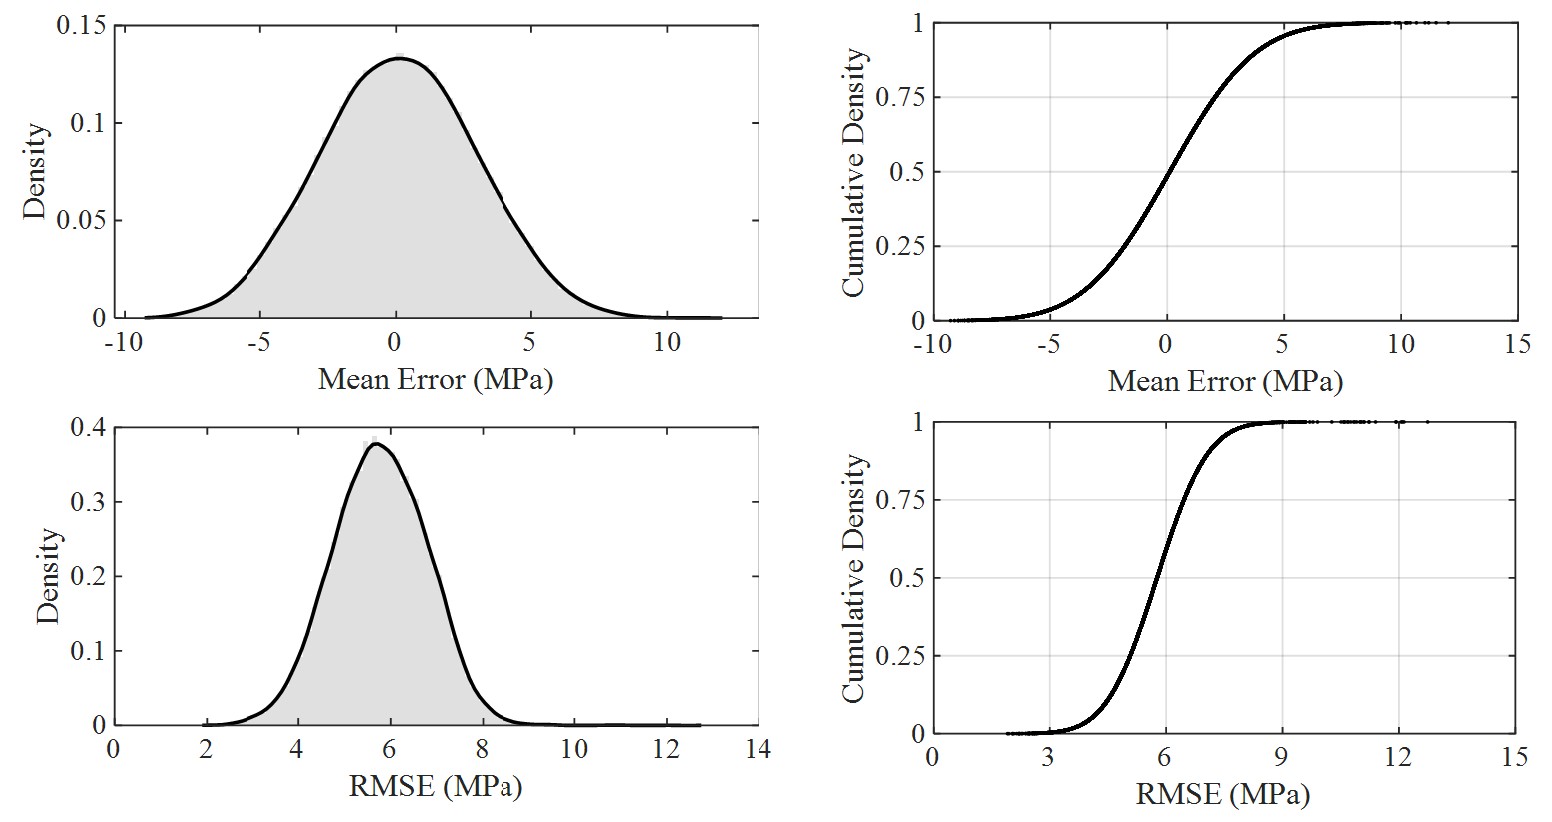
In general, cross-validation reduced estimation errors compared to the random empirical model. However, despite the overall improvement, a higher variability in individual values was observed, particularly for UPV values above 4500 m/s. The prediction errors of the models created follow a normal distribution, and the average MAE and RMSE obtained across all models were 5.27 MPa and 5.77 MPa, respectively. Figure 10 presents the probability density and cumulative density distributions of the Mean Error and RMSE, which follow a normal distribution. The error had a mean of 0.10 MPa and a standard deviation of 5.86 MPa, which resulted in the 5.27 MPa MAE, while the RMSE had a mean of 5.77 MPa and a standard deviation of 1.07 MPa.

The cross-validation procedure is a measure of the original dataset's stability. Since all possible combinations are analyzed, the prediction errors of each combination are calculated, as shown in Figure 10. Also, the prediction errors of the final cross-validation model tend to be close to the mean metrics observed for all models. In this case, the MAE and RMSE of the cross-validation model are smaller than the mean values observed among all other models, indicating that this procedure will provide a good approximation to the average model that could be created with a given dataset.
The cross-validation procedure allows the identification of the model with the least metric errors, enabling the active choice of the best possible prediction model. However, the error metrics analyzed only evaluate the mean values for each dataset combination and do not evaluate the variability of the predicted results. Other model calibration techniques could be used to ensure that the model also accounts for the variability of the tested data, such as the bi-objective approach, which will be addressed later in this paper.
7.3 Confidence interval
Since the error metrics follow a normal distribution, it is possible to determine the prediction confidence interval of the model. To do this, the RMSE value corresponding to 95% of the cumulative distribution is estimated, which ensures that 95% of the tested sets will have an RMSE below this threshold. Similarly, the error value that will be exceeded in only 5% of cases is estimated. The error can then be calculated according to Equation 5, and concrete strength estimates are corrected as per Equation 6.
By creating a new model correlating UPV with fc,est,95, it is possible to ensure that the resistance estimate has a 95% probability of not exceeding the actual value. This model is presented in Figure 11, in comparison with the original cross-validation model and the real data. This new model prediction error metrics are equal to 9.34 MPa and 10.83 MPa, for MAE and RMSE respectively. Although it has higher errors, using the 95% confidence interval aims to prevent the model from overestimating concrete resistance, thereby reducing the chance of an unsafe strength prediction.

Predictive model based on cross-validation procedure with 95% confidence interval that will not overestimate concrete strength.
Applying the 95% confidence interval leads to an R2 of -0.1930. The negative R2 indicates that the model has been adjusted to capture variability within this interval, resulting in a shift in predictions. Therefore, it is crucial to understand that this calibration aims to ensure predictions within a desired confidence interval, even if it compromises the quality of fit as evaluated by R2.
7.4 Bi-objective approach
To improve the local estimation of resistance, a bi-objective model was created to simultaneously minimize the error in estimating the average strength and the variability of the estimation errors, represented in this case by the standard deviation of the errors. The NSGA-II (Non-dominated Sorting Genetic Algorithm II), a multi-objective optimization algorithm proposed by Deb et al [55], was used for this purpose.
The optimal parameters found are shown in Figure 12, which presents the Pareto frontier. The Pareto frontier refers to a set of solutions where improving the result of one objective cannot be achieved without worsening the other. The black dots in Figure 12 indicate the frontier, while the green dot represents the chosen point for defining the bi-objective model. It can be observed that, along the entire frontier, the RMSE is very close to that obtained through the cross-validation process. Additionally, the optimal parameters that lead to the frontier presented in Figure 12 closely resemble the results obtained from the cross-validation process, demonstrating that, for the dataset considered in this work, the cross-validation process was able not only to minimize the error in the average estimate but also to minimize the standard deviation.

The model obtained through the bi-objective is very similar to the one obtained through cross-validation and has MAE and RMSE values of 4.85 MPa and 5.38 MPa, respectively. Similarly, the coefficient of determination for the fit of the data to the proposed model, R2, is 0.7053, the same result achieved through the cross-validation process. This might indicate that the cross-validation process was enough to predict not only the mean value but also the variability of the actual data.
7.5 Probabilistic Model
The probabilistic model for estimating concrete strength leads to an assessment of results not in average terms but rather in terms of a distribution of values. Initially, an evaluation is conducted on the local variability of UPV readings taken from cores extracted from the bridges. Additionally, the relationship between the results obtained from the structure and those from the cores is assessed, including the variability due to differences between these data. Finally, using the model obtained through cross-validation, distributions of data related to the concrete strength in the evaluated bridges are derived.
7.5.1 UPV Local variability
As shown previously, the UPV values in Table 3 are the average of three observations taken at each core. Based on the complete dataset, a distribution of the variation in UPV readings around the observed mean at each point was created, as shown in Figure 13. This distribution indicates the local variability of the test or bias involved in data collection. The variability follows a normal distribution with a mean of 1.0 and a standard deviation of 0.0073.

The uncertainty involved in data collection can be identified as repeatability uncertainty within the test. This uncertainty significantly impacts the accuracy of resistance estimation using NDT [50] and should be quantified at each field investigation site. Furthermore, reducing the uncertainty in result accuracy can lead to a decrease in the number of core samples required for resistance estimation [17].
7.5.2 Bayesian Inference
The Bayesian inference-based resistance estimation relies on prior distributions and observed values of UPV and fc, along with initial values for the parameters a and b of the exponential model. The prior UPV and fc distributions were obtained from a dataset of 20 random pairs selected from the original 25 pairs, maintaining the proportion between the calibration and test sets. The prior values of a, b, and standard deviation are the values obtained from empirical regression analysis.
The methodology employs Markov Chain Monte Carlo (MCMC) sampling. In each iteration, proposed values for a and b are drawn from normal distributions centered around the current values, starting from the prior estimates. An acceptance criterion evaluates the likelihood of the proposed parameters given the observed data. A total of 1 million iterations were executed, and probability density curves were plotted for each evaluated parameter, as depicted in Figure 14. After discarding a burn-in period, the means of the sampled parameters were calculated to estimate the relationship between UPV and concrete strength. Finally, the estimated strengths were compared with the observed values using metrics such as RMSE, MAE, and R2.
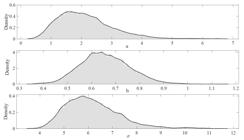
The probability density curves for parameters a, b, and the standard deviation (σ) were plotted using the samples generated through the Markov Chain Monte Carlo (MCMC) process. These curves represent the posterior distributions of the parameters after 1 million iterations. Each curve reflects the likelihood of the respective parameter values given the observed data. The probability density curves for a and σ exhibit wider tails for higher values, suggesting that their distributions allow for more variability in larger values. This could indicate greater uncertainty or possible outliers in the data influencing these parameters. On the other hand, b seems more symmetrical. This overall distribution format provides insight into where the model predictions may face more uncertainty or variability.
For this model, the Mean Absolute Error (MAE) and Root Mean Square Error (RMSE) obtained were 4.58 MPa and 5.54 MPa, respectively. These values suggest that the Bayesian inference model performs reasonably well in terms of reducing average prediction errors. However, the model's fit to the data, as reflected by the R2 value of 0.4279, is not optimal. The low R2 value indicates that the model explains only 43% of the variance in the data, which implies that, despite the model's ability to produce relatively accurate point estimates, it may not generalize well to unseen data or other values within the same range. This could result in larger errors when applied to different samples from the same population.
8 PREDICTIVE MODELS ASSESSMENT
The performance of these models is analyzed based on Monte Carlo Simulation. Based on the distribution of local variability of ultrasonic pulse velocity and the proposed models, the strength distribution provided by each model was determined based on 1 million simulated samples of concrete strength. The samples were obtained using Equation 9, where a and b are the parameters of the proposed models, B represents the distribution of local variability of the readings, and V represents the distribution of velocity data used as the basis to generate the samples.
In this case, the velocity distribution (V) was obtained from the readings presented in Table 3. A normal distribution was assumed for the readings, with a mean of 4016 m/s and a standard deviation of 464 m/s. The distributions of the simulated samples are shown in Figure 15. All distributions exhibit a lognormal shape, which is intrinsically related to the exponential models used to generate the samples. The models created by empirical regression, cross-validation, and the bi-objective method closely approximate the actual values observed in the sample. On the other hand, the Bayesian Inference model tends to overestimate the mean resistances by nearly 5 MPa, which reflects the low R2 found in the model calibration.

8.1 Comparison between the proposed models
The results presented in Table 4 indicate that models created through Empirical Regression, Cross-validation, Bi-objective, and Bayesian Inference have a similar mean error, suggesting that for a given set of samples, the average strength would be predicted roughly with the same error. However, the Bayesian Inference model presents higher errors for individual readings, reaching 11.89 MPa compared to errors ranging from 9.43 to 9.89 for the other models, as presented in Table 5. Additionally, the Bayesian Inference and the Confidence interval models have a higher error standard deviation and coefficient of variation, indicating a higher variability of the prediction error.
Among the models that present similar results, one factor to consider when selecting a model identification approach is the computational cost associated with the calibration procedure. An empirical regression has the least requirements and is the easiest model approach because it is calibrated based on a random combination of samples. On the other hand, the cross-validation approach calibrates several models to fit all the possible combinations of samples, and the number of models rapidly increases when the number of samples is large. For example, the 25 samples in this work resulted in 53,130 possible combinations, which required computational tools for processing the amount of data. The bi-objective approach also required computational tools for optimization and achieving both objectives in parallel. Although the regression fitting is the simplest model analyzed in this work, it yielded similar results to those of other more advanced techniques, which indicates that, for the dataset tested in this work, improving the model identification approach did not improve the prediction metrics.
As previously discussed, the 95% confidence interval model underestimates the concrete strength. Although it results in a higher mean error and individual errors, the values predicted using this model have a 95% chance of underestimating the concrete strength, which is critical for ensuring the structural integrity of existing bridges.
8.2 Models’ performance against existing models
As observed by Breysse [21], exponential models tend to follow a linear relationship when plotted on a semi-logarithmic graph. The positioning of the proposed models is shown in Figure 16 compared to various models found in the literature. In this regard, the proposed models fit within the general pattern observed among existing models. Additionally, except for the 95% confidence interval model, all other models are clustered in a particular region of the graph.

The proposed models are also analyzed using datasets available in the literature. Table 6 shows the number of data pairs gathered from multiple references and the MAE observed for the proposed models with each dataset. For each UPV measurement, the compressive strength was estimated using models A, B, D, and E and compared to the strength value observed by the references. The model with a 95% confidence interval was not used because it severely underestimated resistance within the present dataset. Figure 17 shows the actual concrete strength histogram of the literature data alongside the actual data distribution and the distributions predicted by the model proposed in this work. Generally, models A through E tend to underestimate the concrete strength when applied to data outside its scope of application. The general behavior of the models was very similar with MAE ranging from 6.16 to 6.52. However, the behavior differs significantly in each dataset separately. The proposed models fit better the dataset from Cristofaro et al. [11], with maximum MAE of 4.72 MPa. On the other hand, the worst behavior is for Pucinotti [31], which minimum MAE was 9.01 Mpa.

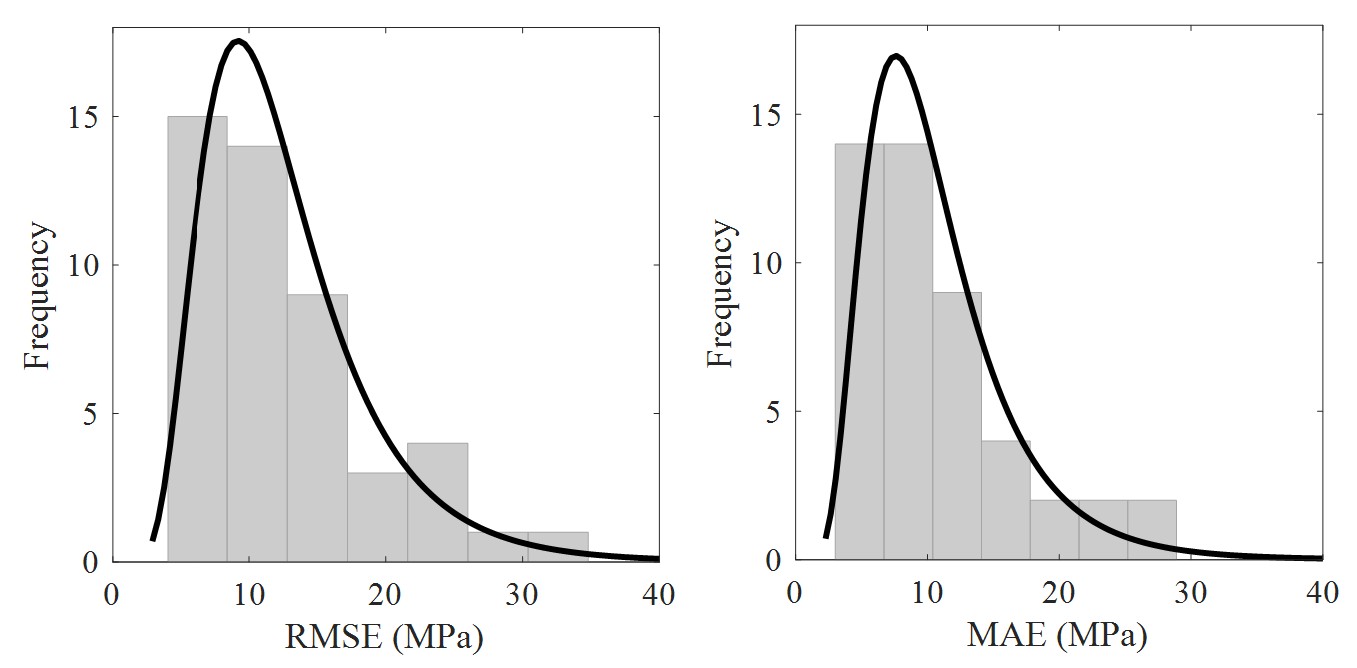
Additionally, the behavior of several existing predictive models was analyzed for the dataset presented in this work by estimating the mean compressive strength and calculating MAE and RMSE. Figure 18 shows the histogram and fitted distribution to the error metrics of 37 predictive models found in literature. Both MAE and RMSE follow a lognormal distribution, with average values of 10.77 MPa and 11.09 MPa, respectively. Once again, the lognormal distribution is related to the predictive models’ format, which follow exponential mathematical equations. The predictive capacity of these models is not good and could lead to gross errors in strength estimation, in some cases resulting in a 30 MPa error. Even though the general behavior of different models presents high values of mean error metrics, a few models performed similar to those proposed in this work.

Both applying the models proposed in this work to existing datasets and evaluating the present dataset with existing models showed a wide variety of behaviors. Mostly, using models to predict the strength outside its validation scope tends to result in high MAE and RMSE, even though there are a few exceptions. This prediction inadequacy is present not only in the error metrics but also in the data variability, which was shown not to be entirely representative of the real data. Thus, it is not recommended to use pre-existing models for strength prediction.
9 CONCLUSIONS
This paper explores strategies for obtaining predictive models to estimate the concrete strength in existing structures. Cristofaro et al. [11], developed models for a set of structures deemed similar. Likewise, this study also works with a set of structures aiming to create a model that can be applied to all of them. It is expected that by creating a model using data from more than one structure, this model will be more representative of the population of bridges in the same region.
Mostly, the choice of which model identification approach is the best depends on the model’s purpose. Some techniques are focused on evaluating only the mean value, while others ensure that both the mean value and the variability of the predicted strengths match the actual data. For a structural evaluation assessment, in which concrete strength is an unknown value, one may be extra cautious and use a confidence interval to ensure they do not overestimate the real strength.
Using more robust calibration techniques did not significantly improve the results for the dataset tested in this work. The closeness between empirical regression and cross-validation results attests to the dataset's consistency. The inefficiency of robust techniques could also be related to the ratio between the validation and test datasets used in the model. Since these are non-linear models, the mean estimated strengths do not equate to applying the model to the average velocity. Furthermore, individual point application tends to indicate a higher predictive error than the application of the model on average values.
The 95% confidence interval considerably underestimates the strength values, which indicates a high model error; however, it could enable the model application on other bridges within the same region by minimizing the chance of an error in strength estimation by overestimating the actual strength.
The comparison with existing models showed that the proposed models may underestimate the compressive strength when applied for structures outside its scope. Even though predictive models cannot be universally applied, the existence of models calibrated for Brazilian bridges is a reference for future work that requires such information.
ACKNOWLEDGEMENTS
This study was financed by the Departamento Nacional de Infraestrutura e Transporte (DNIT) through the DNIT/UFV Project 291 of TED No. 00703/2020. The authors also acknowledge the support provided by the Federal University of Viçosa (UFV) Department of Civil Engineering. The authors also thank the research group TechBIM/CNPq for the infrastructure and collaboration. Finally, thanks are also due to the Construction Materials Laboratory, and the Mechanical Tests Laboratory.
-
Financial support:
This study was financed by the Departamento Nacional de Infraestrutura de Transportes – Brasil (DNIT). The authors also acknowledge the support provided by the Civil Engineering Department of the Federal University of Viçosa (UFV).
-
Data Availability:
Due to the nature of this research, which includes real structures, participants of this study do not agree for their data to be shared publicly, so supporting data are unavailable.
-
How to cite:
M. S. Andrade et al., “Predictive models for concrete strength estimation of existing bridges in Brazil” Rev. IBRACON Estrut. Mater., vol. 18, no. 3, e18309, 2025, https://doi.org/10.1590/S1983-41952025000300009
REFERENCES
-
1 C. Gomez-Cardenas, Z. M. Sbartaï, J. P. Balayssac, V. Garnier, and D. Breysse, "New optimization algorithm for optimal spatial sampling during non-destructive testing of concrete structures," Eng. Struct., vol. 88, pp. 92–99, Apr 2015, http://doi.org/10.1016/j.engstruct.2015.01.014
» http://doi.org/10.1016/j.engstruct.2015.01.014 -
2 V. Pfister, A. Tundo, and V. A. M. Luprano, "Evaluation of concrete strength by means of ultrasonic waves: a method for the selection of coring position," Constr. Build. Mater., vol. 61, pp. 278–284, Jun 2014, http://doi.org/10.1016/j.conbuildmat.2014.03.017
» http://doi.org/10.1016/j.conbuildmat.2014.03.017 -
3 A. Masi, L. Chiauzzi, and V. Manfredi, "Criteria for identifying concrete homogeneous areas for the estimation of in-situ strength in RC buildings," Constr. Build. Mater., vol. 121, pp. 576–587, Sep 2016, http://doi.org/10.1016/j.conbuildmat.2016.06.017
» http://doi.org/10.1016/j.conbuildmat.2016.06.017 -
4 B. Craeye, H. van de Laar, J. van der Eijk, W. Gijbels, and L. Lauriks, "On-site strength assessment of limestone based concrete slabs by combining non-destructive techniques," J. Build. Eng., vol. 13, pp. 216–223, 2017, http://doi.org/10.1016/j.jobe.2017.08.006
» http://doi.org/10.1016/j.jobe.2017.08.006 -
5 K. Ali-Benyahia, Z. M. Sbartaï, D. Breysse, M. Ghrici, and S. Kenai, "Improvement of nondestructive assessment of on-site concrete strength: influence of the selection process of cores location on the assessment quality for single and combined NDT techniques," Constr. Build. Mater., vol. 195, pp. 613–622, Jan 2019, http://doi.org/10.1016/j.conbuildmat.2018.10.032
» http://doi.org/10.1016/j.conbuildmat.2018.10.032 -
6 G. Santarsiero et al., “Experimental and numerical evaluation of coring effects in reinforced concrete columns,” in COMPDYN Proc., Athens, 2019, pp. 5094–5106, http://doi.org/10.7712/120119.7290.18643
» http://doi.org/10.7712/120119.7290.18643 -
7 A. Miano, H. Ebrahimian, F. Jalayer, and A. Prota, "Reliability estimation of the compressive concrete strength based on non-destructive tests," Sustainability, vol. 15, no. 19, pp. 14644, Oct 2023, http://doi.org/10.3390/su151914644
» http://doi.org/10.3390/su151914644 -
8 A. M. Cuaron, D. V. Jáuregui, and B. D. Weldon, "Simple procedure for load rating reinforced concrete slab bridges without plans research objective and literature review," J. Perform. Constr. Facil., vol. 34, no. 5, pp. 04020083, 2020, http://doi.org/10.1061/(ASCE)CF.1943-5509.0001476
» http://doi.org/10.1061/(ASCE)CF.1943-5509.0001476 -
9 A. Bagheri, M. Alipour, O. E. Ozbulut, and D. K. Harris, "A nondestructive method for load rating of bridges without structural properties and plans," Eng. Struct., vol. 171, pp. 545–556, Sep 2018, http://doi.org/10.1016/j.engstruct.2018.05.114
» http://doi.org/10.1016/j.engstruct.2018.05.114 -
10 R. R. Armendariz Briones, “Bridge Load rating: a general procedure for load rating bridges without plans,” Ph.D. dissertation, Purdue Univ., West Lafayette, IN, 2018. [Online]. Available: https://docs.lib.purdue.edu/open_access_dissertations/1683
» https://docs.lib.purdue.edu/open_access_dissertations/1683 -
11 M. T. Cristofaro, S. Viti, and M. Tanganelli, "New predictive models to evaluate concrete compressive strength using the SonReb method," J. Build. Eng., vol. 27, pp. 100962, Jan 2020, http://doi.org/10.1016/j.jobe.2019.100962
» http://doi.org/10.1016/j.jobe.2019.100962 - 12 A. D’ambrisi, M. T. Cristofaro, and M. De Stefano, “Predictive models for evaluating concrete compressive strength in existing buildings,” in 14th World Conf. Earthquake Eng., Beijing, 2008.
-
13 M. T. Cristofaro, R. Nudo, M. Tanganelli, A. D’Ambrisi, M. De Stefano, and R. Pucinotti, "Issues concerning the assessment of concrete compressive strength in existing buildings: application to a case study," Struct. Concr., vol. 19, no. 3, pp. 795–805, Jun 2018, http://doi.org/10.1002/suco.201700070
» http://doi.org/10.1002/suco.201700070 - 14 M. B. M. F. Silva and R. A. Melo, “Condições de pontes rodoviárias: cenário, diagnóstico e manutenção,” in XII Cong. Bras. Pont. Estrut., Rio de Janeiro 2021, pp. 10.
- 15 British National Committee for Non-destructive Testing. Institution of Civil Engineers, Eds., Symposium on Non-Destructive Testing of Concrete and Timber. London: ICE, 1969.
-
16 M. Vona, "Characterization of in situ concrete of existing RC constructions," Materials, vol. 15, no. 16, pp. 5549, Aug 2022, http://doi.org/10.3390/ma15165549
» http://doi.org/10.3390/ma15165549 -
17 D. Breysse, X. Romão, M. Alwash, Z. M. Sbartaï, and V. A. M. Luprano, "Risk evaluation on concrete strength assessment with NDT technique and conditional coring approach," J. Build. Eng., vol. 32, pp. 101541, Nov 2020, http://doi.org/10.1016/j.jobe.2020.101541
» http://doi.org/10.1016/j.jobe.2020.101541 -
18 Z.-M. Sbartaï, M. Alwash, D. Breysse, X. Romão, and V. A. M. Luprano, "Combining the bi-objective approach and conditional coring for a reliable estimation of on-site concrete strength variability," Mater. Struct., vol. 54, no. 6, pp. 230, Dec 2021, http://doi.org/10.1617/s11527-021-01820-9
» http://doi.org/10.1617/s11527-021-01820-9 -
19 A. El-Mir, S. El-Zahab, Z. M. Sbartaï, F. Homsi, J. Saliba, and H. El-Hassan, "Machine learning prediction of concrete compressive strength using rebound hammer test," J. Build. Eng., vol. 64, pp. 105538, Apr 2023., http://doi.org/10.1016/j.jobe.2022.105538
» http://doi.org/10.1016/j.jobe.2022.105538 -
20 R. Kumar, B. Rai, and P. Samui, "A comparative study of prediction of compressive strength of ultra-high performance concrete using soft computing technique," Struct. Concr., vol. 24, no. 4, pp. 5538–5555, 2023, http://doi.org/10.1002/suco.202200850
» http://doi.org/10.1002/suco.202200850 -
21 D. Breysse, "Nondestructive evaluation of concrete strength: an historical review and a new perspective by combining NDT methods," Constr. Build. Mater., vol. 33, pp. 139–163, Aug 2012, http://doi.org/10.1016/j.conbuildmat.2011.12.103
» http://doi.org/10.1016/j.conbuildmat.2011.12.103 -
22 F. B. Lima, J. F. Fernandes, M. C. Sahuinco, and T. N. Bittencourt, “Estimation of concrete compressive strength through ultrasonic waves with different frequencies applied to a concrete bridge,” in Maintenance, Monitoring, Safety, Risk and Resilience of Bridges and Bridge Networks, T. N. Bittencourt, D. Frangopol, A. Beck, Eds., London: CRC Press, 2016, http://doi.org/10.1201/9781315207681-286
» http://doi.org/10.1201/9781315207681-286 - 23 British Standards Institution, Specification for Testing Concrete – Part 203 – Recommendations for Measurement of Velocity of Ultrasonic Pulses in Concrete, BS 1881:203, 1986.
-
24 L. Qixian and J. H. Bungey, "Using compression wave ultrasonic transducers to measure the velocity of surface waves and hence determine dynamic modulus of elasticity for concrete," Constr. Build. Mater., vol. 10, no. 4, pp. 237–242, 1996, http://doi.org/10.1016/0950-0618(96)00003-7
» http://doi.org/10.1016/0950-0618(96)00003-7 -
25 L. Belagraa, A. Bouzid, N. Logzit, N. Badache, and A. Belguendouz, “Local concrete characterization assessment by the means of non-destructive tests (NDT) methods,” in Concr. Solutions, Proc. 5th Int. Conf. Concr. Repair, 2014, pp. 761–769, http://doi.org/10.1201/b17394-118
» http://doi.org/10.1201/b17394-118 -
26 M. Velay-Lizancos, I. Martinez-Lage, M. Azenha, J. Granja, and P. Vazquez-Burgo, "Concrete with fine and coarse recycled aggregates: E-modulus evolution, compressive strength and non-destructive testing at early ages," Constr. Build. Mater., vol. 193, pp. 323–331, Dec 2018, http://doi.org/10.1016/j.conbuildmat.2018.10.209
» http://doi.org/10.1016/j.conbuildmat.2018.10.209 -
27 S. Hong, S. Yoon, J. Kim, C. Lee, S. Kim, and Y. Lee, "Evaluation of condition of concrete structures using ultrasonic pulse velocity method," Appl. Sci., vol. 10, no. 2, pp. 706, Jan 2020, http://doi.org/10.3390/app10020706
» http://doi.org/10.3390/app10020706 -
28 M. Ju, K. Park, and H. Oh, "Estimation of compressive strength of high strength concrete using non-destructive technique and concrete core strength," Appl. Sci., vol. 7, no. 12, pp. 1249, Dec 2017, http://doi.org/10.3390/app7121249
» http://doi.org/10.3390/app7121249 -
29 K. Rashid and R. Waqas, "Compressive strength evaluation by non-destructive techniques: an automated approach in construction industry," J. Build. Eng., vol. 12, pp. 147–154, Jul 2017, http://doi.org/10.1016/j.jobe.2017.05.010
» http://doi.org/10.1016/j.jobe.2017.05.010 -
30 T. Demir, M. Ulucan, and K. E. Alyamaç, "Development of combined methods using non-destructive test methods to determine the in-place strength of high-strength concretes," Processes, vol. 11, no. 3, pp. 673, Mar 2023, http://doi.org/10.3390/pr11030673
» http://doi.org/10.3390/pr11030673 -
31 R. Pucinotti, "Reinforced concrete structure: non destructive in situ strength assessment of concrete," Constr. Build. Mater., vol. 75, pp. 331–341, Jan 2015, http://doi.org/10.1016/j.conbuildmat.2014.11.023
» http://doi.org/10.1016/j.conbuildmat.2014.11.023 -
32 Y. C. Kog, "Estimating in situ compressive strength of existing concrete structures," Pract. Period. Struct. Des. Constr., vol. 23, no. 3, pp. 04018013, Aug 2018, http://doi.org/10.1061/(ASCE)SC.1943-5576.0000374
» http://doi.org/10.1061/(ASCE)SC.1943-5576.0000374 -
33 K. B. Najim, "Strength evaluation of concrete structures using ISonReb linear regression models: Laboratory and site (case studies) validation," Constr. Build. Mater., vol. 149, pp. 639–647, Sep 2017, http://doi.org/10.1016/j.conbuildmat.2017.04.162
» http://doi.org/10.1016/j.conbuildmat.2017.04.162 - 34 M. S. Andrade et al., “Aplicabilidade de ensaios não-destrutivos para obtenção de dados de projeto e avaliação da condição estrutural de pontes de concreto armado,” in XIV Cong. Bras. Pont. Estrut., Rio de Janeiro, 2023.
- 35 European Committee for Standardization, Assessment of In-Situ Compressive Strength in Structures and Precast Concrete Components, BS EN 13791:2019, 2019.
-
36 K. Ali-Benyahia, S. Kenai, M. Ghrici, Z. M. Sbartaï, and S. M. Elachachi, "Analysis of the accuracy of in-situ concrete characteristic compressive strength assessment in real structures using destructive and non-destructive testing methods," Constr. Build. Mater., vol. 366, pp. 130161, Feb 2023, http://doi.org/10.1016/j.conbuildmat.2022.130161
» http://doi.org/10.1016/j.conbuildmat.2022.130161 -
37 D. Breysse and J.-P. Balayssac, “Non-destructive in situ strength assessment of concrete practical application of the RILEM TC 249-ISC recommendations,” in RILEM State-of-the-Art Reports, P. Riva, Ed., Cham: Springer, 2021. Accessed: Jan. 30, 2025. [Online]. Available: http://www.springer.com/series/8780
» http://www.springer.com/series/8780 -
38 N. Pereira and X. Romão, "Assessing concrete strength variability in existing structures based on the results of NDTs," Constr. Build. Mater., vol. 173, pp. 786–800, Jun 2018, http://doi.org/10.1016/j.conbuildmat.2018.04.055
» http://doi.org/10.1016/j.conbuildmat.2018.04.055 -
39 M. Alwash, Z. M. Sbartaï, and D. Breysse, "Non-destructive assessment of both mean strength and variability of concrete: a new bi-objective approach," Constr. Build. Mater., vol. 113, pp. 880–889, Jun 2016, http://doi.org/10.1016/j.conbuildmat.2016.03.120
» http://doi.org/10.1016/j.conbuildmat.2016.03.120 -
40 M. Alwash, D. Breysse, Z. M. Sbartaï, K. Szilágyi, and A. Borosnyói, "Factors affecting the reliability of assessing the concrete strength by rebound hammer and cores," Constr. Build. Mater., vol. 140, pp. 354–363, Jun 2017, http://doi.org/10.1016/j.conbuildmat.2017.02.129
» http://doi.org/10.1016/j.conbuildmat.2017.02.129 -
41 E. F. Saleh, A. N. Tarawneh, and H. N. Katkhuda, "A comprehensive evaluation of existing and new model-identification approaches for non-destructive concrete strength assessment," Constr. Build. Mater., vol. 334, pp. 127447, Jun 2022, http://doi.org/10.1016/j.conbuildmat.2022.127447
» http://doi.org/10.1016/j.conbuildmat.2022.127447 -
42 S. Dauji and S. Karmakar, "Estimating concrete strength from nondestructive testing with few core tests considering uncertainties," ASCE-ASME J. Risk Uncertain Eng. Syst. Part B Mech. Eng., vol. 8, no. 4, pp. 041102, Dec 2022, http://doi.org/10.1115/1.4053639
» http://doi.org/10.1115/1.4053639 -
43 S. A. Faroz, S. Ghosh, and A. M. Faroz, "Tri-level framework for realistic estimation of concrete strength using bayesian data fusion of UPV and guided coring," J. Nondestr. Eval., vol. 41, no. 4, pp. 78, Dec 2022, http://doi.org/10.1007/s10921-022-00909-7
» http://doi.org/10.1007/s10921-022-00909-7 -
44 F. Akgul, "Inspection and evaluation of a network of concrete bridges based on multiple NDT techniques," Struct. Infrastruct. Eng., vol. 17, no. 8, pp. 1076–1095, 2021, http://doi.org/10.1080/15732479.2020.1790016
» http://doi.org/10.1080/15732479.2020.1790016 -
45 R. Mata, R. O. Ruiz, and E. Nuñez, "Correlation between compressive strength of concrete and ultrasonic pulse velocity: A case of study and a new correlation method," Constr. Build. Mater., vol. 369, pp. 130569, Mar 2023, http://doi.org/10.1016/j.conbuildmat.2023.130569
» http://doi.org/10.1016/j.conbuildmat.2023.130569 -
46 R. Giannini, L. Sguerri, F. Paolacci, and S. Alessandri, "Assessment of concrete strength combining direct and NDT measures via Bayesian inference," Eng. Struct., vol. 64, pp. 68–77, Apr 2014, http://doi.org/10.1016/j.engstruct.2014.01.036
» http://doi.org/10.1016/j.engstruct.2014.01.036 -
47 S. A. Faroz and S. Ghosh, "Comprehensive framework for the hyper-robust Bayesian calibration of a nondestructive testing instrument," Struct. Saf., vol. 92, pp. 102105, Sep 2021, http://doi.org/10.1016/j.strusafe.2021.102105
» http://doi.org/10.1016/j.strusafe.2021.102105 -
48 E. Vasanelli, D. Colangiuli, A. Calia, and V. A. M. Luprano, "Estimating in situ concrete strength combining direct and indirect measures via cross validation procedure," Constr. Build. Mater., vol. 151, pp. 916–924, Oct 2017, http://doi.org/10.1016/j.conbuildmat.2017.06.141
» http://doi.org/10.1016/j.conbuildmat.2017.06.141 -
49 D. Breysse and J. P. Balayssac, "Strength assessment in reinforced concrete structures: From research to improved practices," Constr. Build. Mater., vol. 182, pp. 1–9, Sep 2018, http://doi.org/10.1016/j.conbuildmat.2018.06.093
» http://doi.org/10.1016/j.conbuildmat.2018.06.093 -
50 M. Alwash, D. Breysse, and Z. M. Sbartaï, "Using Monte-Carlo simulations to evaluate the efficiency of different strategies for nondestructive assessment of concrete strength," Mater. Struct., vol. 50, no. 1, pp. 90, Feb 2017, http://doi.org/10.1617/s11527-016-0962-x
» http://doi.org/10.1617/s11527-016-0962-x -
51 A. Masi and L. Chiauzzi, "An experimental study on the within-member variability of in situ concrete strength in RC building structures," Constr. Build. Mater., vol. 47, pp. 951–961, 2013, http://doi.org/10.1016/j.conbuildmat.2013.05.102
» http://doi.org/10.1016/j.conbuildmat.2013.05.102 -
52 H. Qasrawi, "Effect of the position of core on the strength of concrete of columns in existing structures," J. Build. Eng., vol. 25, pp. 100812, Sep 2019, http://doi.org/10.1016/j.jobe.2019.100812
» http://doi.org/10.1016/j.jobe.2019.100812 -
53 D. Breysse et al., "Non destructive assessment of in situ concrete strength: comparison of approaches through an international benchmark," Mater. Struct., vol. 50, no. 2, pp. 1, 2017, http://doi.org/10.1617/s11527-017-1009-7
» http://doi.org/10.1617/s11527-017-1009-7 -
54 R. A. Medeiros-Junior, M. G. Lima, R. Yazigi, and M. H. F. Medeiros, "Carbonation depth in 57 years old concrete structures," Steel Compos. Struct., vol. 19, no. 4, pp. 953–966, Oct 2015, http://doi.org/10.12989/scs.2015.19.4.953
» http://doi.org/10.12989/scs.2015.19.4.953 -
55 K. Deb, A. Pratap, S. Agarwal, and T. Meyarivan, "A fast and elitist multiobjective genetic algorithm: NSGA-II," IEEE Trans. Evol. Comput., vol. 6, no. 2, pp. 182–197, Apr 2002, http://doi.org/10.1109/4235.996017
» http://doi.org/10.1109/4235.996017 -
56 F. Cianfrone and I. Facaoaru, "Study on the introduction into Italy on the combined non-destructive method, for the etermination of in situ concrete strength," Mater. Constr., vol. 12, pp. 413–424, 1979, http://doi.org/10.1007/BF02478819
» http://doi.org/10.1007/BF02478819 -
57 L. Nobile, "Prediction of concrete compressive strength by combined non-destructive methods," Meccanica, vol. 50, no. 2, pp. 411–417, Dec 2015, http://doi.org/10.1007/s11012-014-9881-5
» http://doi.org/10.1007/s11012-014-9881-5
Edited by
-
Editors:
Bernardo Horowitz, Daniel Cardoso.
Due to the nature of this research, which includes real structures, participants of this study do not agree for their data to be shared publicly, so supporting data are unavailable.