 Evaluation of predictive models for water absorption and saturation in cementitious materials
Abstract
Abstract This study presents a comparative analysis of the performance and accuracy of predictive models for capillary absorption and water saturation in cementitious materials. Water absorption data from the literature are evaluated using formulations based on the power law, stretched exponential function, Weibull distribution, and the enhanced Terzaghi model to describe the temporal dynamics of water penetration and characterize the transport mechanisms involved. The ability of each model to represent the distinct phases of the absorption process is evaluated, with emphasis on anomalous water absorption, characterized by an initial rapid flow in capillary pores followed by a slower flow in gel pores. The distinction between these flows is essential for describing the interaction between the microstructure of cementitious materials and the evolution of absorption over time. The results provide a quantitative basis for assessing the suitability of the models in predicting the transition between absorption and saturation stages, contributing to the improvement of concrete durability modeling under real-world conditions and to the revision of technical standards. The results of the modeling and statistical analyses show that Weibull-type and stretched exponential models more accurately describe water absorption in concrete, while the square-root-of-time method produces significant errors.
Keywords:
capillary water uptake; imbibition; water anomalous transport; concrete durability
Resumo
Resumo Este estudo apresenta uma análise comparativa do desempenho e da precisão de modelos preditivos para absorção capilar e saturação de água em materiais cimentícios. Os dados de absorção de água provenientes da literatura são avaliados utilizando formulações baseadas na lei de potência, na função exponencial estendida, na distribuição de Weibull e no modelo de Terzaghi aprimorado, com o objetivo de descrever a dinâmica temporal da penetração de água e caracterizar os mecanismos de transporte envolvidos. A capacidade de cada modelo em representar as distintas fases do processo de absorção é avaliada, com ênfase na absorção anômala de água, caracterizada por um fluxo inicial rápido nos poros capilares seguido por um fluxo mais lento nos poros de gel. A distinção desses fluxos é essencial para descrever a interação entre a microestrutura dos materiais cimentícios e a evolução da absorção ao longo do tempo. Os resultados fornecem uma base quantitativa para avaliar a adequação dos modelos na previsão da transição entre as etapas de absorção e saturação, contribuindo para o aprimoramento da modelagem da durabilidade do concreto em condições reais e para a revisão de normas técnicas. A partir dos resultados da análise estatística verifica-se que os modelos do tipo Weibull e da função exponencial estendida descrevem com maior acurácia a absorção de água no concreto, enquanto o método da raiz quadrada do tempo produz erros significativos.
Palavras-chave:
absorção capilar; imbibição; transporte anômalo de água; durabilidade do concreto
1 INTRODUCTION
The durability of reinforced concrete structures is a fundamental requirement to ensure the safety and serviceability of buildings and infrastructure over time. Among the various factors influencing their lifespan, capillary water absorption emerges as a key parameter, as it directly affects the permeability of the cementitious matrix and its susceptibility to the ingress of deleterious agents dissolved in water, such as chlorides and carbon dioxide [1], [2]. Consequently, the ability of cementitious materials to absorb and retain water plays a decisive role in durability assessment, highlighting the need for accurate characterization of this phenomenon.
Water absorption in cementitious systems typically occurs in two distinct stages: primary and secondary absorption, both governed by capillary forces but driven by different transport mechanisms. The primary stage is characterized by rapid water uptake through capillary pores until mechanical equilibrium is achieved. In contrast, the secondary stage is controlled by the diffusion of dissolved air within the pores, in a considerably slower process due to the limited solubility of air and the constraints imposed by molecular diffusion, which extend the time required to reach full saturation [3]. The distinction of these two stages is essential for evaluating the lifespan of cement-based materials, as secondary absorption is directly linked to progressive degradation processes.
Experimentally, gravimetric techniques commonly assess water absorption, whereby the mass gain of concrete specimens over time is monitored to track moisture ingress. However, interpreting these measurements poses several challenges due to influencing factors such as microstructural heterogeneity, initial moisture content, gravitational effects, and delayed hydration [4], [5]. Coarser pore structures exhibit lower water saturation at a given relative humidity, whereas finer pores fill rapidly [6], [7]. Moreover, conventional predictive models often fail to accurately describe the transition between absorption stages and full saturation, limiting their effectiveness in durability modeling and service life prediction. Developing and applying models that can reliably capture absorption kinetics and moisture evolution are crucial for understanding the underlying transport mechanisms in cementitious materials.
Recently, modeling approaches have been proposed in the literature. Time-based models, such as those employing square-root or fourth-root time dependencies, have been widely adopted to describe typical absorption behavior [8], [9]. Alternative formulations, such as the stretched exponential model [10], the Weibull distribution [11], [12], and the improved Terzaghi model [13], have shown promise in providing more comprehensive representations of the absorption process and the transition to saturation. Appropriate model selection depends on how well it fits experimental data and on the model’s capacity to capture the underlying physical mechanisms governing moisture transport, representing experimental profiles consistently and precisely.
In light of these considerations, this study aims to evaluate the predictive performance and accuracy of various modeling approaches in describing the water absorption and saturation behavior of cementitious materials. Through comparative analysis, the study seeks to assess the suitability of various models in representing the distinct absorption phases, their effectiveness in capturing the transition to saturation, and the physical interpretability of their parameters. Additionally, the work aims to quantify the limitations of conventional models and identify more robust alternatives for durability evaluation. The findings are expected to contribute to improved service life prediction methodologies for concrete structures, support the revision eof technical standards, and develop enhanced maintenance and rehabilitation strategies for reinforced concrete structures.
2 MATHEMATICAL MODELS FOR WATER ABSORPTION
Among the various models presented in the literature, this study analyzed the Power-type, Simple Weibull, Double Porosity Weibull, Improved Terzaghi, and Stretched Exponential models, selected based on their reliability, physical interpretability, and simplicity.
2.1 Power-law model
Liquid infiltration and moisture front propagation in unsaturated porous media are commonly described by diffusion equations, which predict a scaling law of the form t0.5 (square root of time) in one dimension. This model, grounded in the unsaturated flow theory, has been widely employed to describe water movement in cementitious materials [14].
However, experimental results frequently deviate from the t0.5 prediction, characterizing a phenomenon known as anomalous capillary absorption [15]. Villagrán Zaccardi et al. [8] proposed three potential causes for this discrepancy: (i) gravitational effects, (ii) porosity, and (iii) volumetric changes in the material. The latter is the most plausible explanation, as neither gravitational effects nor the assumption of one-dimensional transport alone can adequately justify the anomalies observed over short time intervals. Thus, volumetric variation emerges as the primary factor associated with the divergence between experimental data and theoretical predictions, whereas the other mechanisms exhibit limitations in accurately capturing such irregularities.
Considering experimentally observed discrepancies, a theoretical model based on the assumption of non-Fickian diffusion can be employed to investigate the anomalous capillary absorption of water in cementitious materials. This model assumes that water uptake in partially saturated materials follows a general nonlinear diffusion equation, as described by Küntz and Lavallée [16], and presented in Equation 1:
where n is a real number, t is time, D is the diffusion coefficient, θ is the moisture content, and x is the distance from the absorption surface.
For one-dimensional water absorption, the moisture content θ can be expressed in terms of the variable φ*=xt-α, with α = 1/(n + 1), and the water absorption C is given by Kaufmann [17], as shown in Equation 2.
Equation 2 can be interpreted as a power-type model for describing water absorption in cementitious materials and is generalized as Equation 3 [18], [19]:
where C = water absorption; t = time; S = sorptivity; α = dimensionless constant.
The parameter S quantifies the water uptake rate upon contact of cementitious material with water. Its interpretation is directly influenced by the value of α [8]. Sorptivity is a critical parameter for predicting the performance of cementitious materials under aggressive environmental conditions, as substances potentially harmful to concrete and reinforcement may be carried by water and compromise the material's durability.
Studies indicate that for cementitious materials, the exponent α typically ranges between 0.25 and 0.5 [20]. The value of α determines the diffusion regime: α=0.5 corresponds to normal diffusion (P1), whereas values below 0.5 represent a subdiffusive regime (P2) [10].
2.2 Weibull-Based Models
Power-type models P1 and P2 assume a constant absorption rate over time and neglect an asymptotic saturation limit for water absorption, compromising their adequacy in realistically modeling the absorption phenomenon. Although they may fit experimental profiles, these models fail to represent the underlying physical mechanisms, resulting in the unrealistic prediction of unlimited absorption, contrary to the practical observation that materials eventually reach saturation.
To overcome these limitations, models based on the Weibull distribution have emerged as more robust alternatives. These models enable a more accurate temporal representation of the absorption process, capturing the smooth and continuous transition between primary and secondary transport regimes [2]. Comparative studies by Wu et al. [21] and Saeidpour and Wadsö [5] have demonstrated that the Weibull model offers better agreement with the anomalous absorption behavior observed in cementitious materials compared to the square-root-of-time model (P1). Additionally, the Weibull model incorporates an asymptotic limit, allowing a more realistic representation of the material's finite water absorption capacity, thus addressing the shortcomings of models that predict unlimited absorption [10].
In summary, adopting Weibull-based models represents a significant advancement in modeling water absorption in cementitious materials. These models offer a realistic representation of the transition between absorption regimes, incorporating an asymptotic saturation limit, which makes them more consistent with observed physical behavior.
2.2.1 Simple Weibull Model
The Weibull Simple Model (WS1) is the Avrami exponential function, a form of the Weibull distribution in stochastic theory [10], shown in Equation 4:
where Cmax = maximum absorption capacity after a considerable time; k = scale parameter defining the temporal location of the transition between absorption regimes; β = shape parameter related to the rate of change of the absorption process.
Parameter k is crucial in characterizing absorption in cementitious materials, as it defines the instant of transition between the rapid and slow absorption phases [22]. This transition occurs at instant t = k, corresponding to the time at which C ⁄ Cmax = 0.6321 [23]. This relation indicates that 63.21% of maximum absorption was reached.
The shape parameter β governs absorption kinetics: lower values indicate a fast initial absorption followed by a gradual decline, whereas higher values represent slower initial absorption, with a delayed but accelerated increase, until stabilization when it reaches Cmax. Considering k and β parameters together allows for a more appropriate description of the water absorption process in cementitious materials.
A second model (WS2), proposed by Raimondo et al. [12], is described by Equation 5:
where d = fitting parameter.
Despite the WS1 and WS2 models representing distinct formulations, both yield equivalent absorption curves when β = 0.5, suggesting a specific condition under which both models converge to describe the absorption process. Raimondo et al. [12] introduced a coefficient analog to sorptivity, called S2, as a product of Cmax and d, with d=(1⁄k)0.5.
Although the WS2 model adopts a fixed value for β, it maintains flexibility by allowing adjustment of the transition time coordinate (k). This adjustment enables the analysis of different scenarios, capturing variations in the absorption process and allowing a more detailed understanding of the influence of transition conditions on the dynamics of water absorption in cementitious materials.
2.2.2 Double-Porosity Weibull Model
Double-porosity Weibull models effectively describe water transport in porous materials, capturing a pattern defined as an intense initial absorption rate followed by a prolonged and slower process extending for a long period [2], [24].
Zhang et al. [25] developed the Double Porosity Weibull model (WDP1), assuming two overlapping pore networks: large capillary pores and small gel pores. The authors classify pores as large when their size is > 50 nm and small when < 10 nm, with intermediate pores being assigned to either domain. This classification is not purely geometric but reflects a functional distinction based on dominant moisture transport mechanisms. In larger pores, transport is mainly governed by conventional Fickian diffusion, whereas in smaller pores, mechanisms such as Knudsen diffusion and surface diffusion become significant. Water uptake is described as the sum of the contributions from both pore networks, as expressed in Equation 6:
where k1 and k2 = scale parameters for large and small pores, respectively; β = shape parameter; a = weighting factor for large pores, in the interval [0,1].
WDP1 reduces S1 for a = 0 or a = 1. A high value for parameter “a” indicates rapid initial absorption dominated by large pores, whereas a low value for parameter “a” implies dominance of smaller pores and slower uptake. The parameter β also influences the absorption. For β ≤ 1, fast initial absorption is observed, followed by a more extended phase until saturation (Cmax). In contrast, for β > 1, the initial wetting phase occurs more slowly, and saturation is reached more quickly.
Furthermore, the k2 and k1 ratios significantly influence the absorption dynamics and total time to saturation. The parameter k1 governs the primary phase, while k2 determines the secondary phase. A ratio k2/k1 > 2 indicates a prolonged time to reach saturation, characterizing materials with lower permeability. Thus, the appropriate selection of the WDP1 model parameters allows for representing different absorption curve shapes, enabling a more accurate modeling of the wetting process in porous cementitious materials.
A second model (WDP2), proposed by Wallach et al. [24] for the food industry, not yet applied to cementitious materials, is expressed as Equation 7:
where k1 and k2 = scale parameters; β1 and β2 = shape parameters; C1,max = maximum absorption of small pores; C2,max = maximum absorption of big pores.
The WDP2 model can be interpreted as an extension of WDP1, differing in that it includes two shape parameters (β1 and β2) and explicitly considers the maximum absorption capacity of both large and small pores. This formulation enables a more detailed description of the evolution of the absorption process in cementitious materials, allowing for a direct evaluation of the contribution of each pore class to water retention.
2.3 Improved Terzaghi model
The classical Terzaghi model, derived from Darcy's law, overestimates capillary rise in cementitious materials due to the assumption of time-invariant hydraulic conductivity [13]. Liang et al. [13] proposed an improved version (IT) incorporating variable hydraulic conductivity, yielding a simplified fitting form shown in Equation 8:
where λ, τ, and p are adjustable model parameters.
The parameters λ and p are related to properties such as porosity, surface tension, water viscosity, and contact angle. Similar to power law-based models, the IT formulation does not incorporate an asymptotic limit, resulting in a prediction of water absorption that increases indefinitely over time.
2.4 Stretched exponential model
Based on advances in reaction kinetics and stochastic relaxation, fractional kinetics provides a consistent theoretical framework for describing anomalous behaviors in complex systems, such as water uptake in cementitious materials [10]. This approach accounts for memory effects and temporal dependence, characteristics of non-linear phenomena.
Zeng and Xu [10] applied this methodology to develop the stretched exponential model (SE), whose formulation is derived from a time-dependent fractional-order differential equation. This structure allows for a unified representation of both the rapid initial phases and the slower transitions of the absorption process, capturing the multiscale nature of water penetration in cementitious materials. Equation 9 presents the mathematical formulation of the SE model.
where τ = characteristic time defined as ; K = sorption constant; n = sorption order; α = time index.
The dynamics of the SE model are governed by the parameters n and α, whose combination defines different patterns of water absorption. When n = 1 and α = 1, the model reduces to the pseudo-first-order kinetic equation. For n = 2 and α = 1, the equation's behavior converges toward the pseudo-second-order model. Additionally, when n = 1 and α ≠ 1, the SE model exhibits behavior similar to the WS1 and WS2 models.
By fixing n = 1 or n = 2 and varying α within the range 0.1 ≤ α ≤ 3, the results curves indicate rapid absorption for t ≤ τ, followed by a slower phase for t > τ. This flexibility makes the SE model a powerful tool for describing anomalous absorption processes in cementitious materials, allowing for a more accurate representation of the transition between different wetting phases.
3 METHODOLOGY
The performance and accuracy of the water absorption models were evaluated using experimental data reported by Alderete et al. [9], obtained from mortar and concrete specimens produced under controlled laboratory conditions. This study was selected due to its comprehensive dataset, which includes high-resolution measurements at early exposure times and long-term monitoring up to four months. Measurements were conducted at 0.5, 1, 2, 3, 4, 5, 6, and 24 h, followed by daily measurements during the first week, weekly measurements over the first two months, and monthly measurements thereafter. This dataset enables the assessment of model performance across both primary and secondary capillary imbibition.
Mortars were prepared with a 1:3 ratio (OPC Type CEM I 42.5 N: sand) and a water-to-cement ratio (w/c) of 0.45, with mixing carried out in accordance with NBN EN 196-1. Concrete mixtures were produced using the same cement and water-to-binder ratio (w/b = 0.45). Cylindrical specimens were cast with dimensions of 50 mm in diameter and 75 mm in height for mortars, and 100 mm in diameter and 200 mm in height for concrete. The specimens were laterally sealed to ensure one-dimensional flow. Preconditioning consisted of water immersion followed by oven drying at 50 °C until mass stabilization. Capillary imbibition tests were performed with a constant immersion depth of (3 ± 1) mm, with evaporation minimized and the water level regularly maintained. Further details can be found in Alderete et al. [9].
Model performance was evaluated by comparing experimental data with predictions from the water absorption models—Power-Type (P), Weibull Simple (WS), Weibull Double (WD), Improved Terzaghi (IT), and Stretched Exponential (SE). Model parameters were estimated using a nonlinear least-squares fitting procedure implemented in a spreadsheet environment, in which the residual sum of squares (RSS) was minimized, as defined in Equation 10:
where C(ti) = water absorption at time t; M(θ) = water absorption model with parameter vector θ; n = number of data points used for curve fitting.
The fitting procedure comprised four main steps [26]: (i) organization of experimental data and computation of model predictions and RSS; (ii) definition of adjustable parameters; (iii) iterative optimization using the Solver tool with different initial parameter values to improve convergence; and (iv) assessment of parameter robustness through sensitivity analysis.
Given that the coefficient of determination is widely recognized as an inadequate metric for assessing the goodness-of-fit of nonlinear models [27], it was not considered in this study. Instead, model performance was evaluated using a set of complementary metrics, namely the mean error (ME), mean absolute error (MAE), and Willmott’s index of agreement (d) [28], as defined in Equations 11-13 [29].
where Mᵢ = estimated value from the water absorption model; Oᵢ = observed value.
The selected performance metrics provide complementary information on model behavior. The ME quantifies bias, the MAE measures overall accuracy, and d evaluates the degree of agreement between observed and predicted values. Although these metrics do not explicitly account for model complexity, they offer a consistent and interpretable basis for comparing model performance.
4 RESULTS AND DISCUSSION
4.1 Mortar
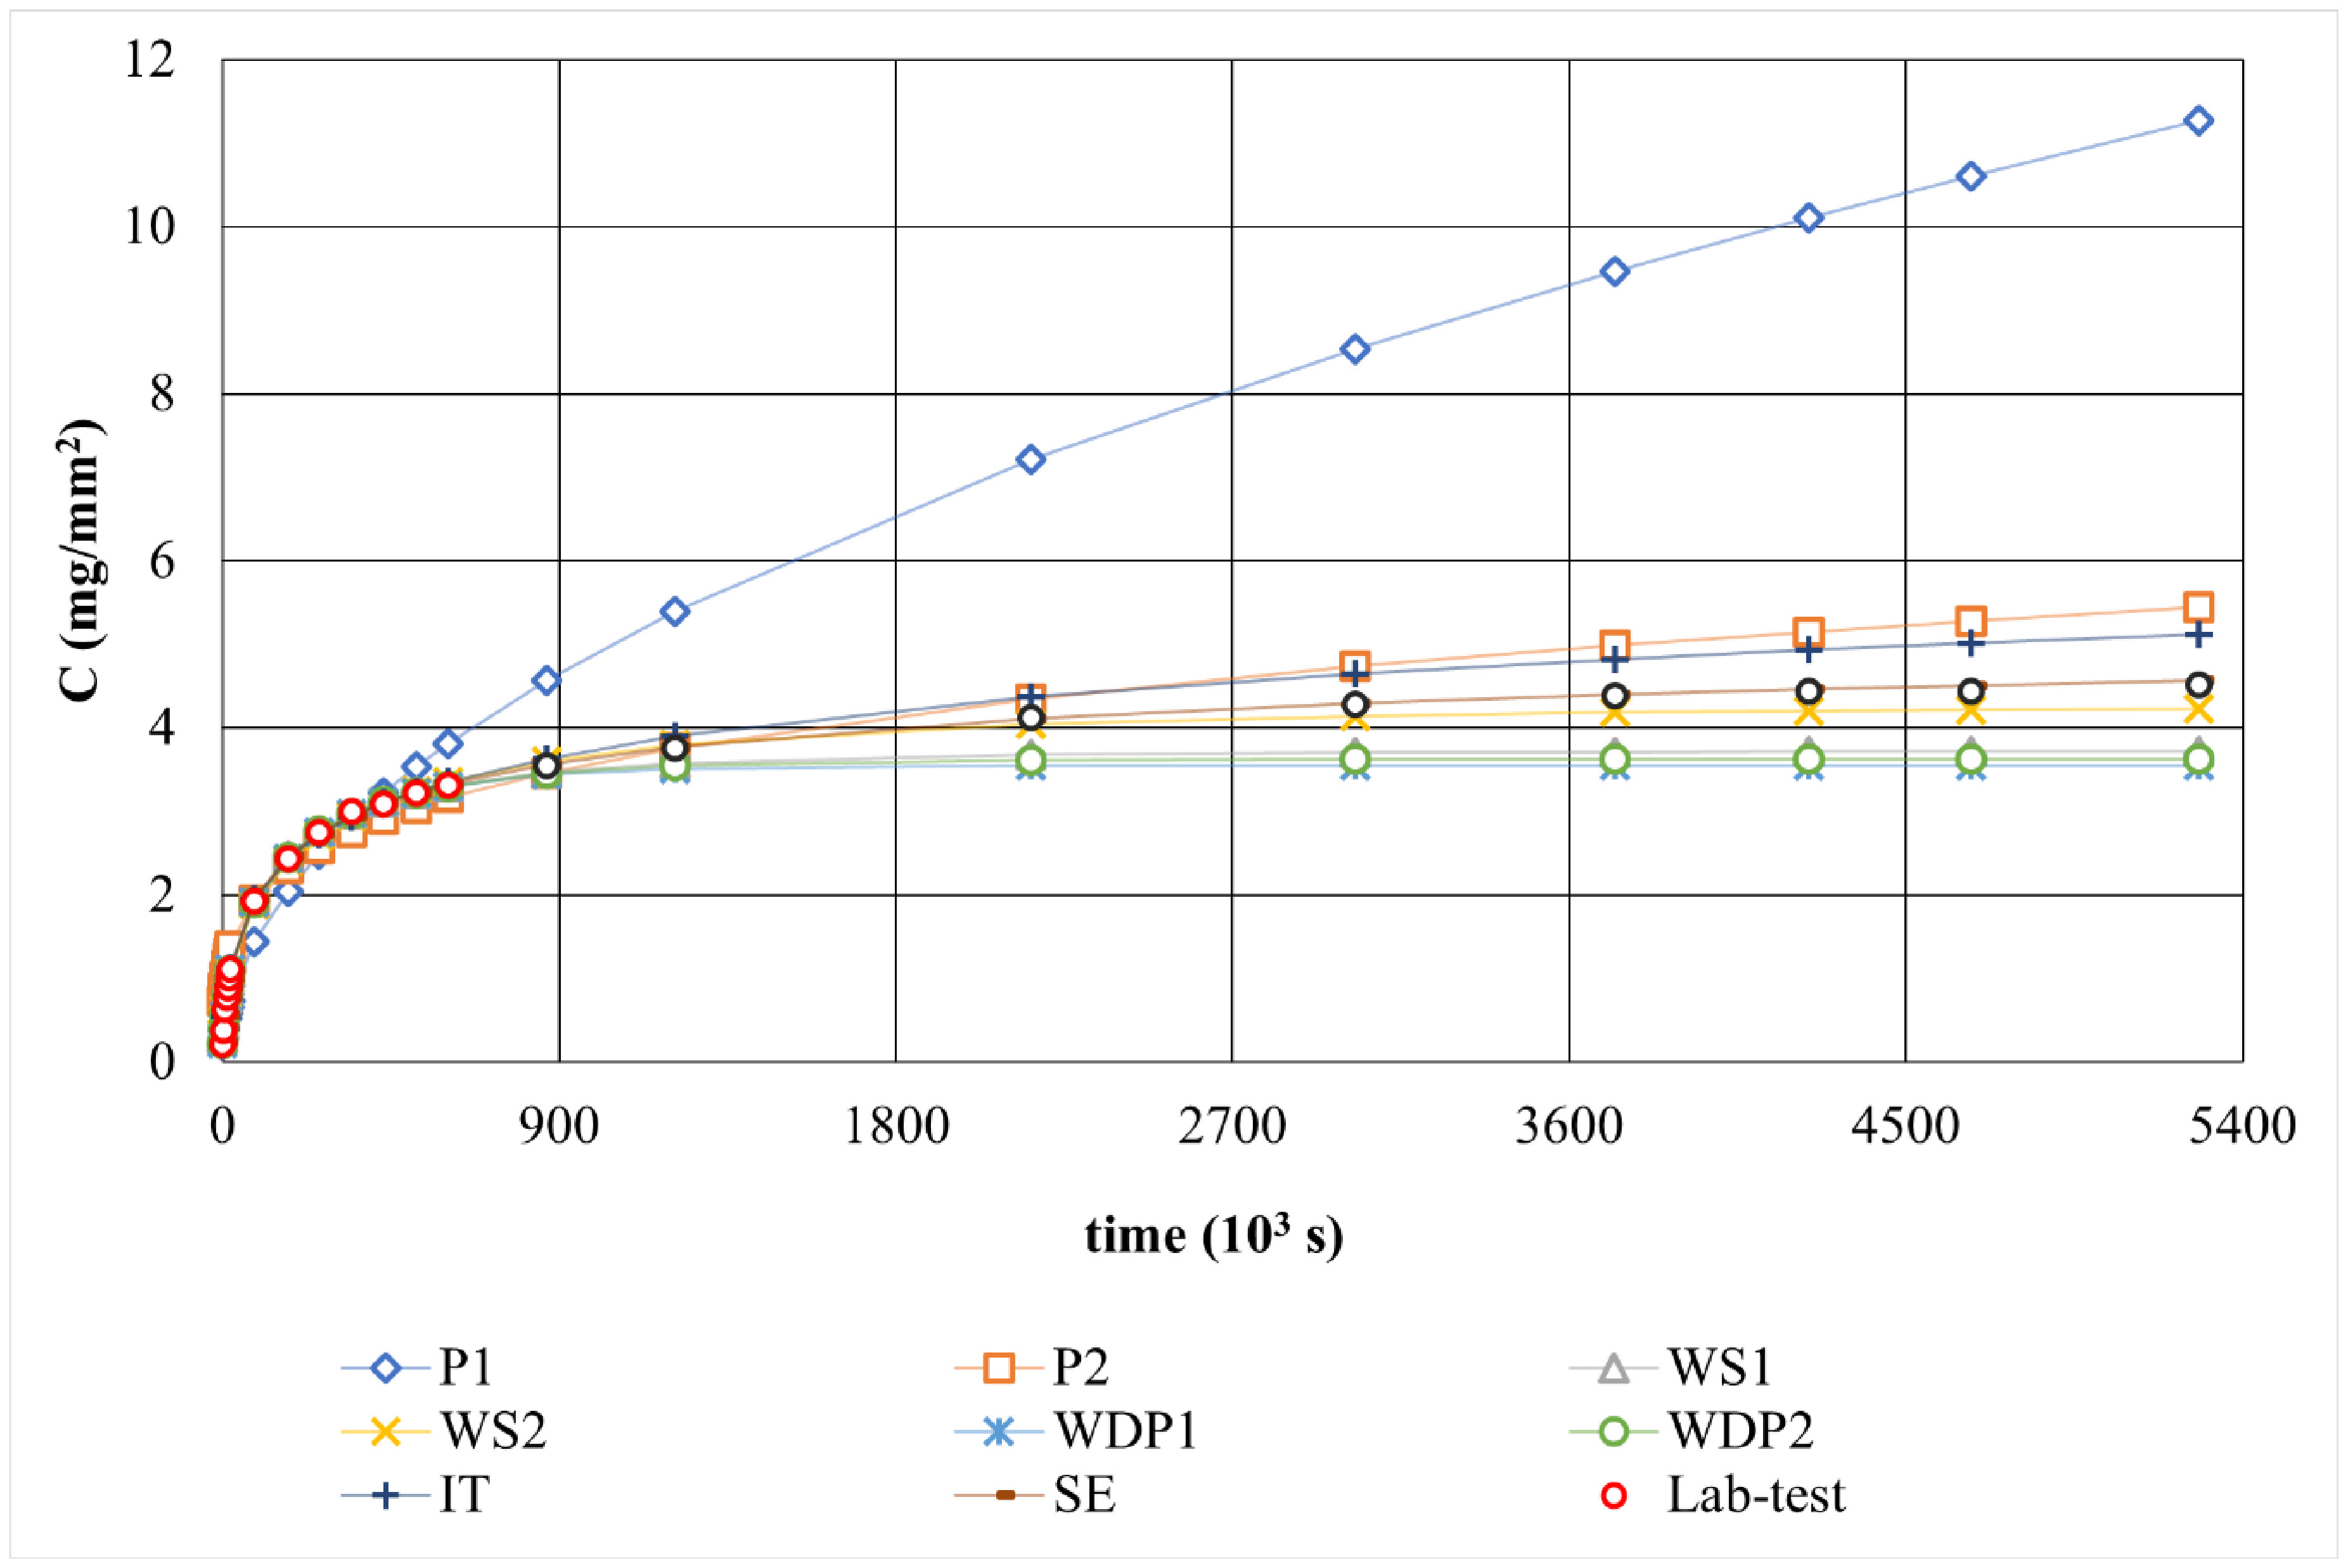
Figure 1 presents the experimental water absorption data and the fitted curves for the evaluated models. Two distinct behaviors can be identified. Models P1, P2, and IT exhibit non-asymptotic responses, characterized by continuous growth without a saturation limit, which is inconsistent with the physical mechanism of capillary absorption and limits their applicability for long-term predictions. In contrast, models WS1, WS2, WDP1, WDP2, and SE display asymptotic behavior, approaching a plateau from approximately 4 × 10³ s onward. This behavior is physically consistent with the progressive reduction in capillary suction as saturation is reached and results in a closer agreement with the experimental data, particularly at longer times.

Table 1 presents the performance metrics for the evaluated models. Model P1 showed the lowest concordance index (d) and the highest MAE, reaching 42%, with a tendency to underestimate, as indicated by ME. Model P2, although slightly better than P1, had the second lowest d, an MAE of 30%, and a tendency to overestimate (ME = 22%). On the other hand, the remaining models exhibited significantly better performance, with d values > 0.98, MAE below 10%, and minimal overestimation (ME < 5%).
Figure 2 shows the evolution of ME over time. In the first 120 minutes (Figure 2a), models P1 and P2 exhibited high errors (~50%). Model P2 showed a significant reduction in error afterward, while P1 maintained errors above 50% during this period.

After the first day of testing (Figure 2b), model errors generally stabilized around 10%. However, P1 continued to exhibit varying error magnitudes, with underestimation until approximately day 36, followed by overestimation. Model P2 behaved similarly, though with fewer minor errors than P1.
4.2 Concrete
Figure 3 shows the model fitting to the concrete data. As with mortar, model P1 was inadequate for describing water absorption. In contrast, the remaining models performed well, with WDP1 and WDP2 showing the best asymptotic behavior. This can be attributed to their ability to realistically describe the transition between primary and secondary absorption phases, capturing the pore structure's influence on capillarity and the diffusion of dissolved air, which are crucial factors in concrete saturation.

Table 2 presents performance metrics for the concrete data. ME values indicate that most models tend to underestimate water absorption. Model P1 performed the worst, with an MAE around 45%, similar to the mortar case. Models P2 and WS2 presented MAE nearly 10%, while other models had MAE values below 5%.
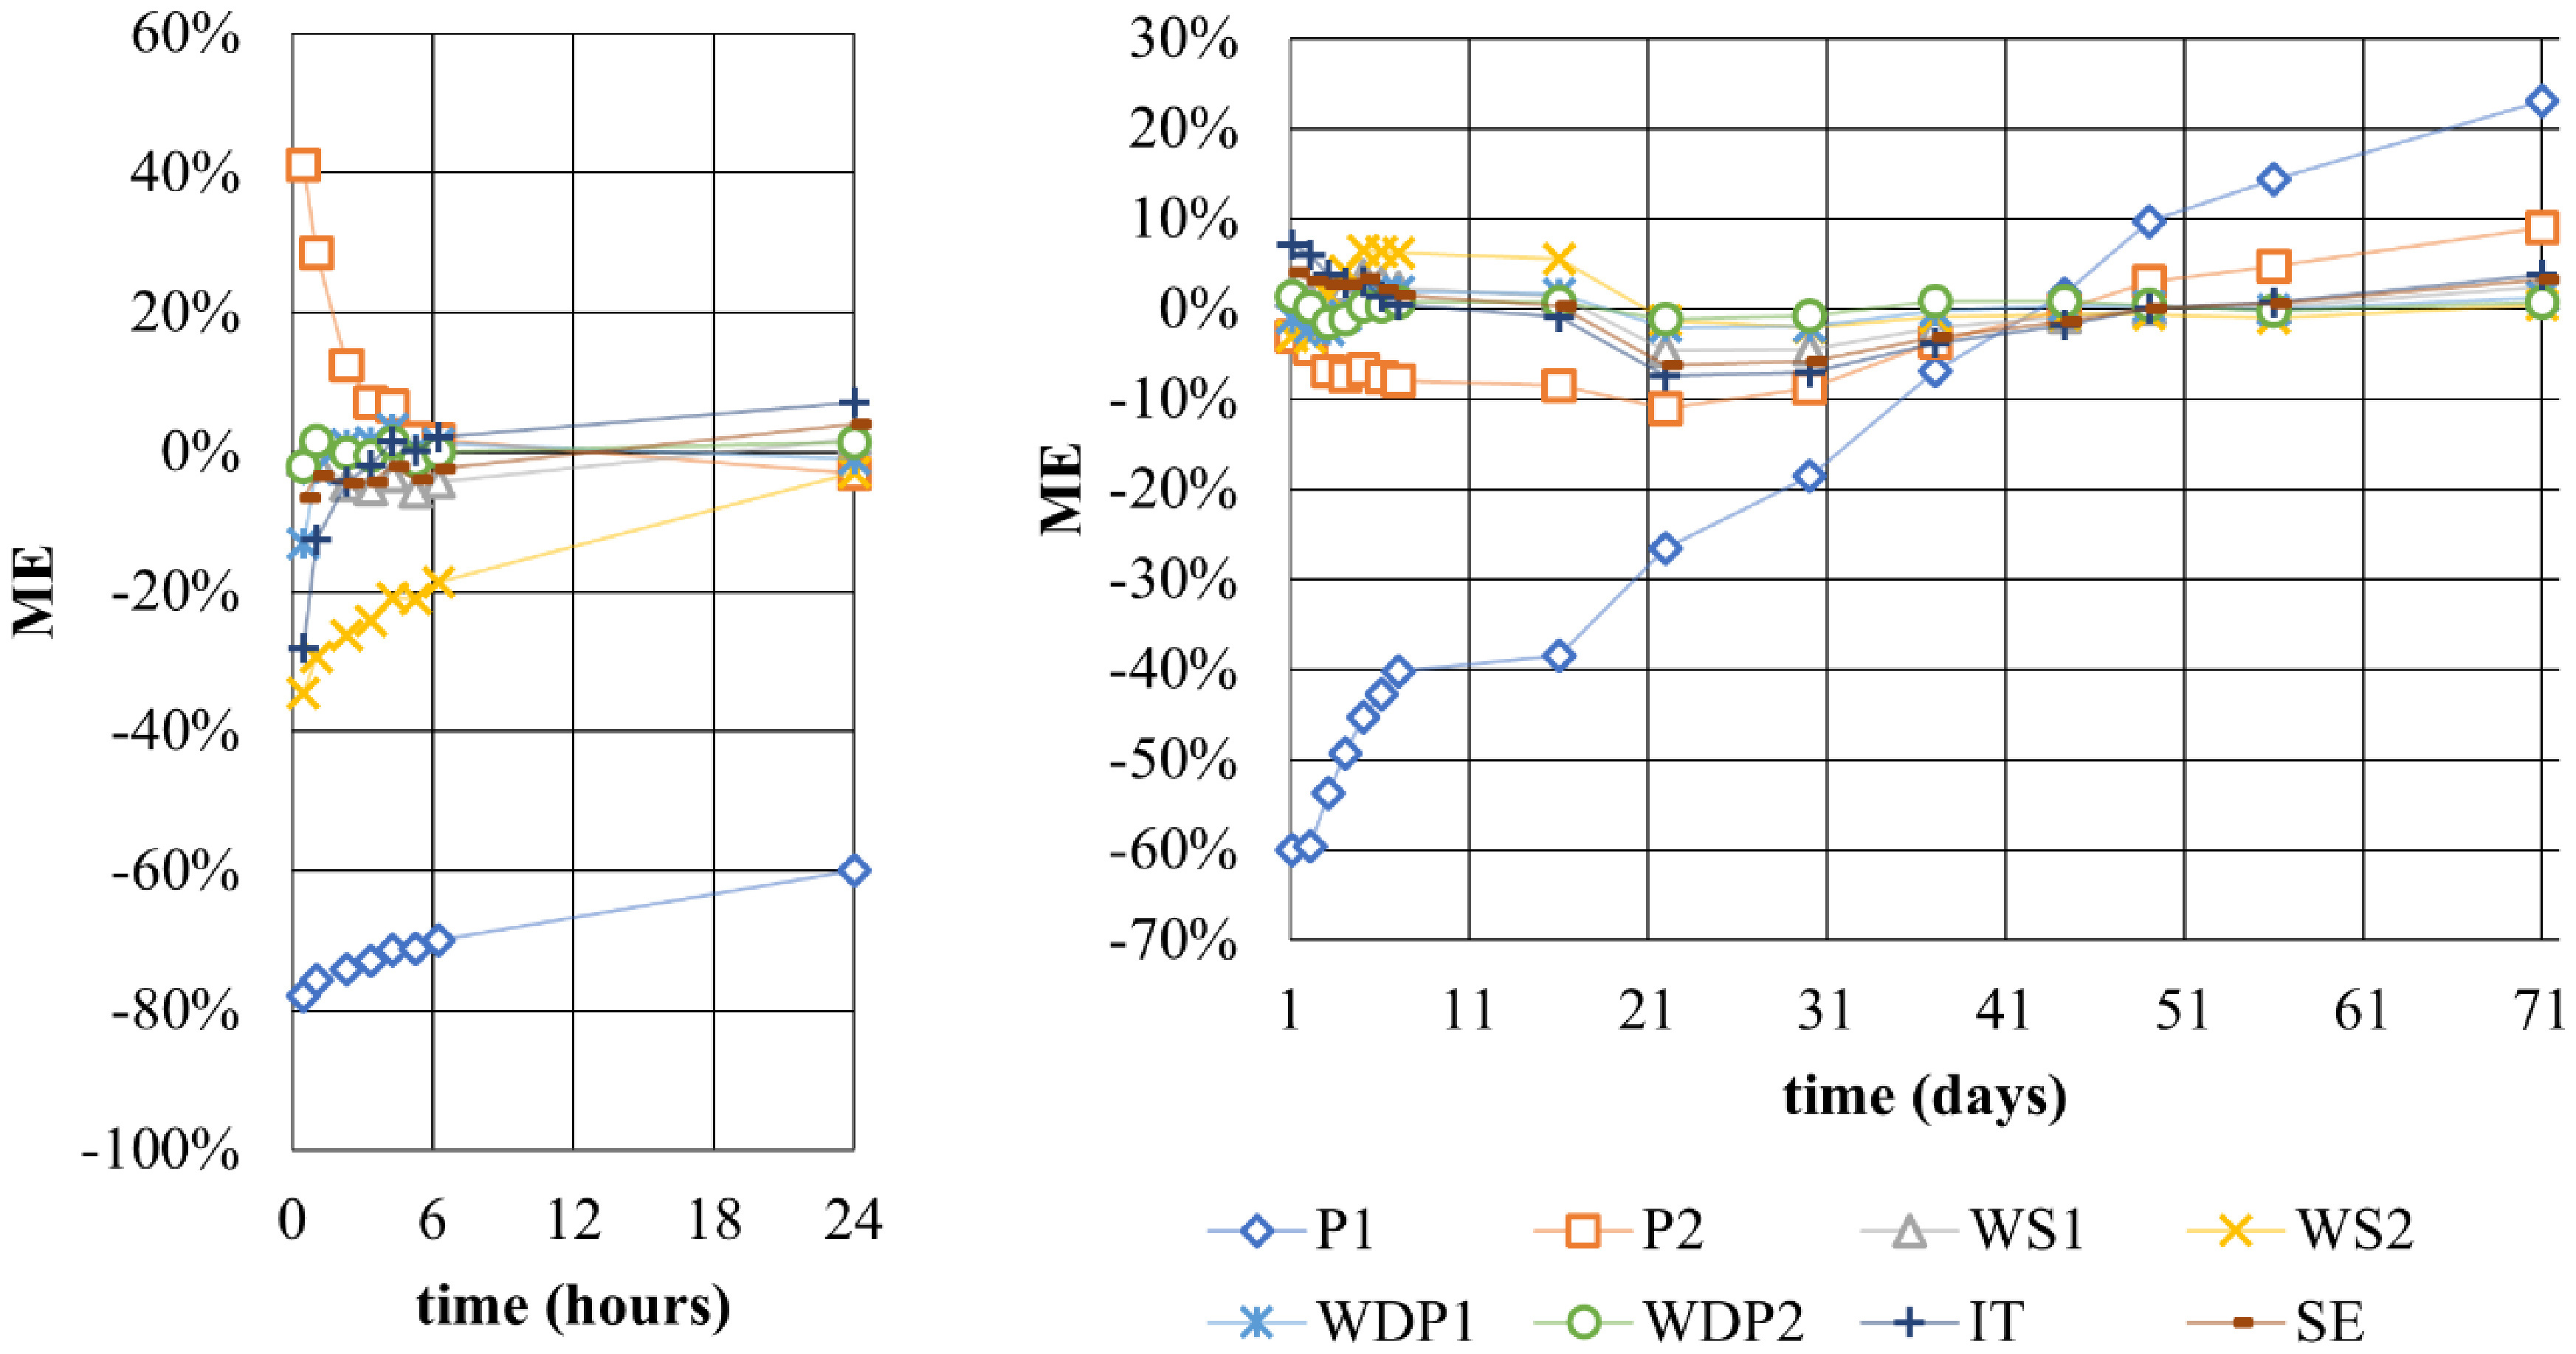
Figure 4 presents the ME of each model over time. Higher errors were observed in the initial hours of testing, with models P2, WS2, and IT reaching ME values of approximately 40%, whereas other models had errors around 10%. After 24 hours, the errors dropped to approximately 10%, remaining at this level until the tests concluded. Model P1 stood out for its high underestimation until day 41, followed by overestimation.

4.3 Model Parameter Estimation and Analysis
Table 3 presents the parameter estimates for all water absorption models for mortar and concrete data. Models WS1 and WS2 yielded similar Cmax values for mortar, but not for concrete. Additionally, parameter β was nearly identical between WS1 and WS2 for mortar but differed for concrete, possibly due to differences in cement content between mortar and concrete, as well as the presence of coarse aggregates in concrete, which affect the pore structure, especially at the interfacial transition zone (ITZ).
In Table 3, the k parameter for WS1 was estimated at approximately 91 h for mortar data, and approximately 86 h for WS2 (indirectly obtained; see Section 2.2.1). Alderete et al. [9] empirically observed a transition at approximately 96 h, indicating that both models can identify the phase transition in mortars. For concrete, k was estimated at approximately 7 and 4 days for WS1 and WS2, respectively. Alderete et al. [9] estimate that the water absorption transition phase will be completed within 7 days, suggesting that WS1 better describes water absorption in concrete.
Model WDP1 yielded Cmax and β values similar to WS1 and WS2 for mortar. Values for β smaller than 1 indicate rapid initial absorption followed by slower absorption, as reflected in k1 and k2 parameters estimated as 15 hours and 12 days, respectively. The parameter “a” equal to 0.41 suggests a higher proportion of small pores. Thus, absorption through larger pores dominates for up to 15 hours from the start of the wetting process, after which capillarity and diffusion occur for approximately 12 days. After this period, larger pores are saturated, and smaller pores saturation continues by diffusion, resulting in a long time to reach Cmax.
For concrete data (Table 3), WDP1 resulted in a Cmax similar to WS2 and different from WS1. The β value for WDP1 was lower than 1, but higher than WS1 and WS2. The parameters k1 and k2 were estimated to be approximately 2 hours and 7 days, respectively. Parameter a = 0.22 suggests a predominance of smaller pores, implying a similar interpretation to mortar. Furthermore, the WDP1 model identified different phases for water absorption phenomena in cementitious materials.
WDP2 parameters k1 and k2 for mortar (Table 3) were similar to WDP1, with β1 and β2 close to β obtained for WDP1, leading to similar interpretations. However, for concrete, the WDP2 parameters β1 and β2 differed from those of WDP1, with k1 and k2 estimated as 6 hours and 10 days, respectively, leading to different interpretations. WDP2 model, in both case studies, presented the ratio C2,max/(C1,max+C2,max) close to 0.6, and similar to the theoretical value presented by Uribe et al. [23], equal to 0.6321, for the transition between phases of the water absorption process. Hence, WDP2 can also identify absorption phases.
Model SE yielded higher Cmax values than models WS1, WS2, WDP1, and WDP2. Zeng and Xu [10] attribute this discrepancy between models to their behavior and test interaction. Additionally, it is impossible to assume that the Cmax obtained for SE is right, because once α is lower than 1, this indicates a decrease in absorption rate over time. Parameter n close to 4 aligns with Zeng and Xu [10] findings for cementitious materials. The parameter τ, which defines the time past the phase transition, was approximately 46 hours for mortar and 11 days for concrete.
Despite the insights provided, some limitations should be acknowledged. The interpretation of model parameters in terms of pore structure and transport mechanisms is based on indirect inference from empirical fitting, without independent microstructural validation. Moreover, the analysis relies on a limited number of experimental datasets, which may restrict the general applicability of the results to other cementitious systems with different compositions and pore structures. In addition, the estimated parameters may be influenced by specific testing conditions and material characteristics, which should be considered when extending the proposed interpretations. Future studies incorporating independent microstructural characterization may help to further validate the physical interpretation of the model parameters.
4.4 Relationship Between Model Parameters and Absorption Phases
Identifying the primary and secondary absorption phases using estimated parameters is a crucial step in water absorption modeling. Models P1, P2, and IT, despite their physical basis, do not directly link parameters to the process phases. Additionally, the absence of asymptotic limits results in unbounded absorption, which is physically unrealistic, as evident in P1 in Figures 1 and 3. This is a limitation for their utility in durability studies of cementitious materials and service life prediction.
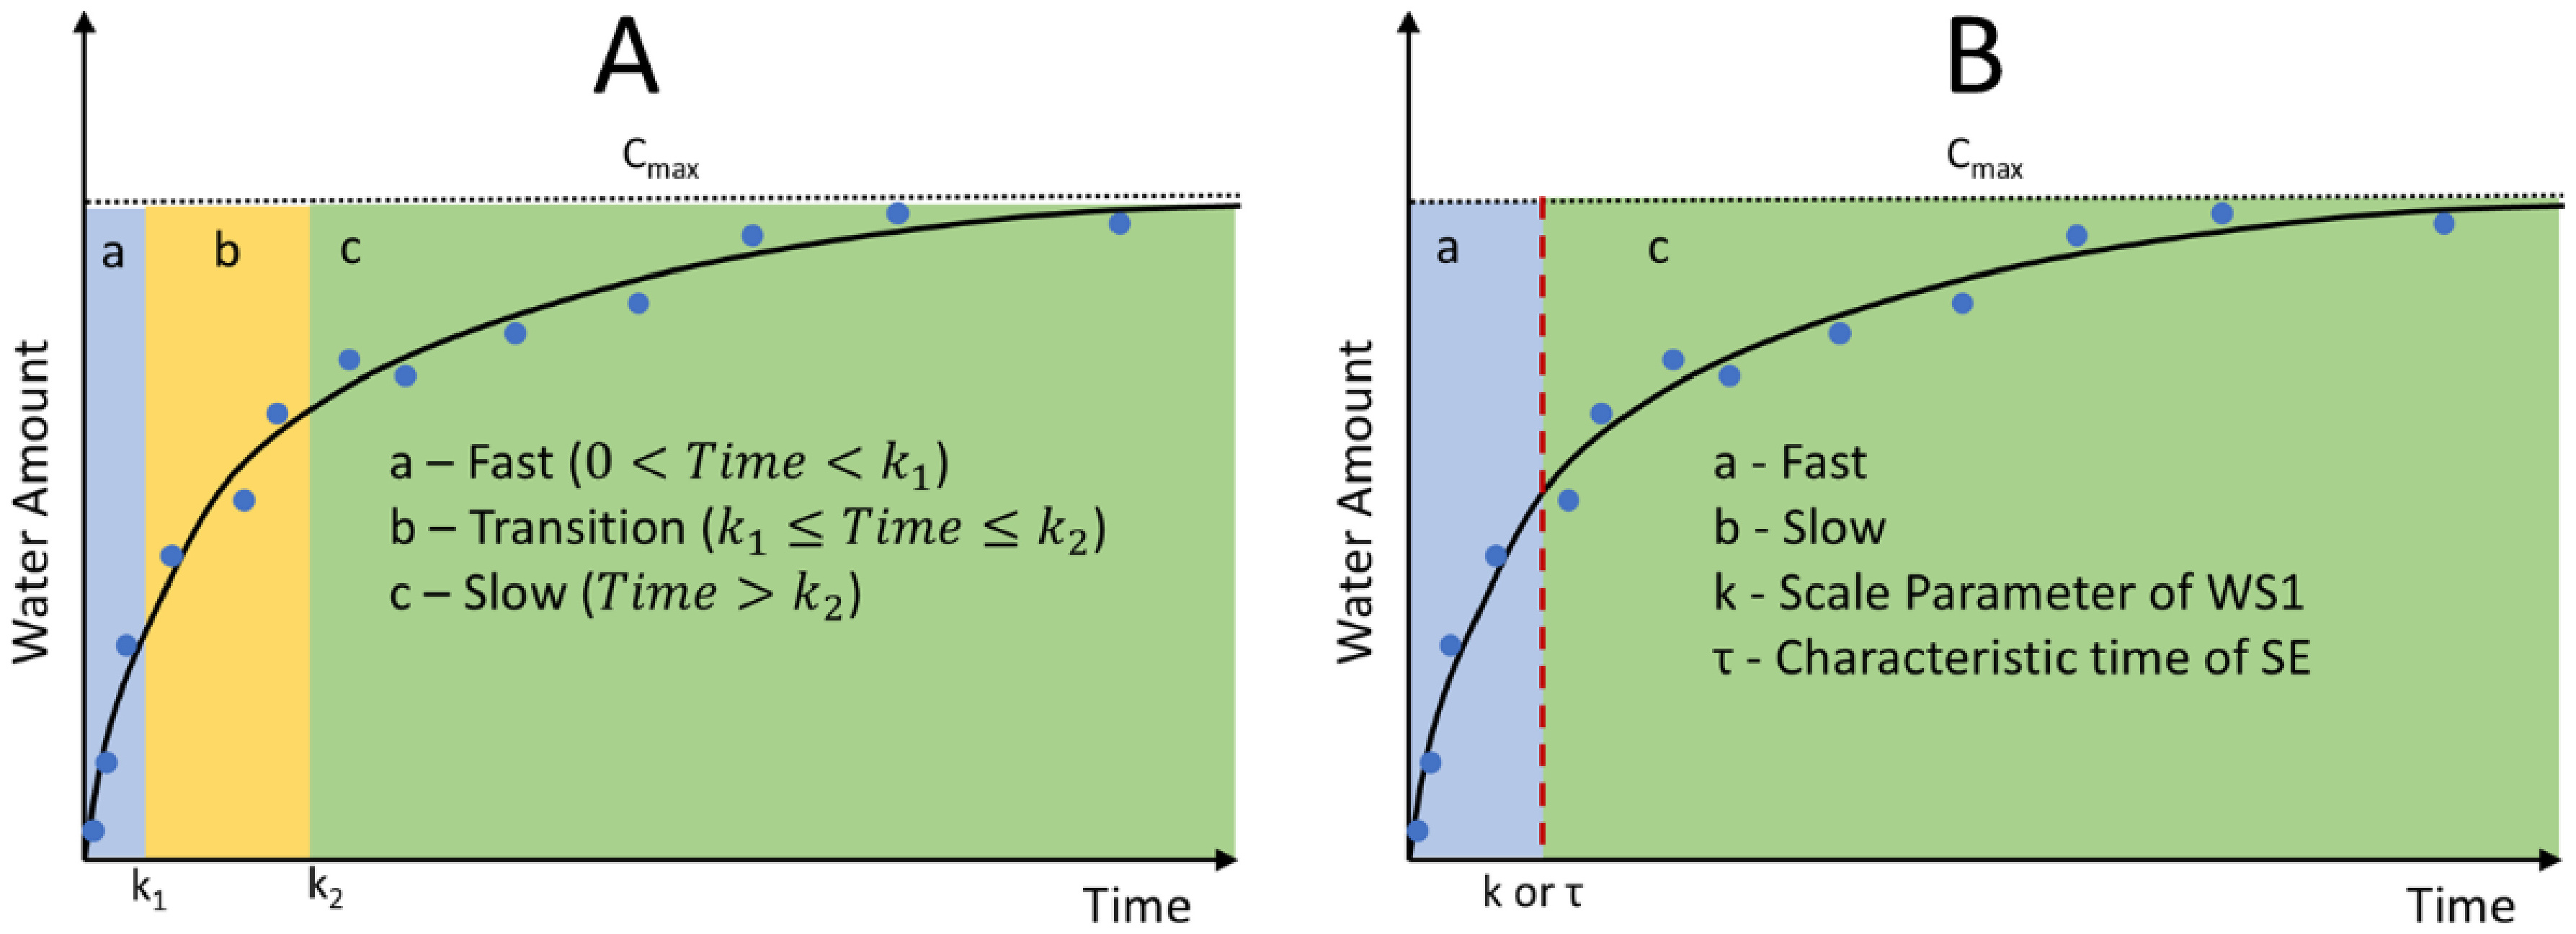
Conversely, model SE’s parameter τ identifies the transition phase. Weibull-type models (particularly WS1 and WDP1) also identify distinct phases in the water absorption process using scale parameters. Based on assumptions made by Alderete et al. [9], a model for interpreting the absorption process through time is proposed and presented in Figure 5.
In Figure 5, the three absorption phases are presented, and their relationship can be defined through the SE, WDP1, and WS1 models. The WDP1 model identifies the three phases in the absorption process: rapid, transition, and slow (Figure 5A). In contrast, the WS1 and SE models do not explicitly capture the transition phase, dividing the process into only two phases: rapid and slow (Figure 5B).
4.5 Evaluation of Models for Long-Term Prediction Based on One-Week Testing
Another essential aspect to be evaluated is the model's ability to predict the long-term behavior of the water absorption process using data from short-duration tests. The standard method recommended by ASTM C1585 [30] involves periodic measurements over approximately one week. The initial procedure consists of recording the mass at specific intervals shortly after the first contact with water: first at 60 seconds, then at 5 minutes, followed by 10, 20, 30, and 60 minutes. After that, measurements are taken every hour up to 6 hours. Beyond the first 6 hours, one measurement is taken daily until the third day. Between the fourth and seventh day, three measurements are taken at 24-hour intervals, and a final measurement is performed at the end of the 7 days.
Based on the data from Alderete et al. [9], which provide measurements only after the initial 30 minutes, this study considers values at 0.5 h, 1 h, 2 h, 3 h, 4 h, 5 h, 6 h, 1 day, 2 days, 3 days, 4 days, 5 days, 6 days, and 7 days for model calibration. The water absorption models were fitted using only these data points, corresponding to the typical duration of standard tests. The calibrated models were then extrapolated beyond this period and compared with the experimentally observed data available up to four months, which were not used in the fitting process. This procedure allows for a direct assessment of the models’ predictive capability under extrapolation conditions, as illustrated in Figures 6 and 7.

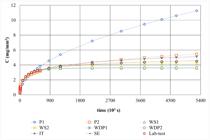
The analysis of Figure 6 (concrete data) reveals that the P1 model significantly overestimated values beyond the experimental period used in the laboratory test, while the WS2 model considerably underestimated them. The WDP2, WS1, and SE models stood out for their superior performance. Although the WDP1 and P2 models could represent behavior beyond the experimental data, a trend of overestimation was observed.
For the mortar data presented in Figure 7, the P1 model showed the worst performance, with significant overestimation beyond the experimental period. On the other hand, the P2 and IT models showed satisfactory performance, although they tended to overestimate. The WS1, WDP2, and WDP1 models also showed satisfactory performance but with the opposite trend, characterized by underestimation in the modeled values. Among all the models evaluated, WS2 and SE were the most accurate, as they adequately reproduced the water absorption behavior.
It is evident that the P1 model (square root of time) is not suitable for describing the water absorption process in cementitious materials, as it failed to accurately represent the observed behavior and significantly overestimated values when extrapolated beyond the experimental data. In contrast, the SE model demonstrated satisfactory performance for both concrete and mortar, albeit with a slight tendency toward overestimation.
The Weibull-type model results depend directly on the type of cementitious material being analyzed, revealing a sensitivity to its composition. The best performance for concrete was observed with the WDP2 model. The IT model stood out for consistently reproducing water absorption behavior, including for periods beyond the experimental range. However, there is a slight tendency to extrapolate the data to infinity, indicating that while it is a simpler modeling tool, a careful interpretation of its results is essential when evaluating the durability and service life of concrete structures.
5 CONCLUSIONS
This study analyzed various models available in the literature to describe the behavior of cementitious materials during the water absorption process, assessing their predictive capabilities and the physical interpretation of their parameters. The main conclusions are as follows:
The results highlight that model structure plays a key role in both physical consistency and extrapolation capability. Within the scope of the analyzed data, non-asymptotic formulations (e.g., P1 and IT) showed limitations in representing long-term water absorption, particularly when calibrated using short-duration data. In contrast, asymptotic models provided more consistent predictions at extended times, reflecting the progressive saturation of the pore system.
Weibull-based models (WS1, WS2, WDP1, and WDP2) enabled a more comprehensive representation of the absorption process, capturing distinct stages and transition behavior. In particular, models incorporating multiple characteristic times improved the description of the transition between rapid and slower absorption regimes. The SE model also showed good predictive performance; however, differences in parameter estimates indicate that caution is required in their physical interpretation.
Overall, the results indicate that both the duration of calibration data and the intrinsic properties of cementitious materials significantly influence model performance and extrapolation reliability. However, the findings are based on a limited number of experimental datasets, and parameter interpretation relies on indirect inference from empirical fitting. Therefore, the applicability of the results to other cementitious systems should be considered with caution.
-
Financial support:
None.
-
Data Availability:
Data-sharing is not applicable to this article as no new data were created or analyzed in this study.
-
How to cite:
W. A. Pansera, C. E. T. Balestra, and G. Savaris, “Evaluation of predictive models for water absorption and saturation in cementitious materials,” Rev. IBRACON Estrut. Mater., vol. 19, no. 3, e19122, 2026, https://doi.org/10.1590/S1983-41952026000100022
REFERENCES
-
1 S. R. Pinto, A. L. Macedo, and R. A. Medeiros Jr, "Effect of preconditioning temperature on the water absorption of concrete," J. Build. Pathol. Rehabil., vol. 3, no. 1, pp. 3, 2018, https://doi.org/10.1007/s41024-018-0032-6
» https://doi.org/10.1007/s41024-018-0032-6 -
2 Q. Zhang, Q. Zeng, D. C. Zheng, J. Wang, and S. L. Xu, "Oven dying kinetics and status of cement-based porous materials for in-lab microstructure investigation," Adv. Cement Res., vol. 30, no. 5, pp. 204–215, 2018, https://doi.org/10.1680/jadcr.17.00075
» https://doi.org/10.1680/jadcr.17.00075 -
3 C. Hall and A. Hamilton, "Beyond the sorptivity: definition, measurement, and properties of the secondary sorptivity," J. Mater. Civ. Eng., vol. 30, no. 4, pp. 04018049, 2018, https://doi.org/10.1061/(ASCE)MT.1943-5533.0002226
» https://doi.org/10.1061/(ASCE)MT.1943-5533.0002226 -
4 S. C. Taylor, W. D. Hoff, M. A. Wilson, and K. M. Green, "Anomalous water transport properties of Portland and blended cement-based materials," J. Mater. Sci. Lett., vol. 18, no. 23, pp. 1925–1927, 1999, https://doi.org/10.1023/A:1006677014070
» https://doi.org/10.1023/A:1006677014070 -
5 M. Saeidpour and L. Wadsö, "Evidence for anomalous water vapor sorption kinetics in cement-based materials," Cement Concr. Res., vol. 70, pp. 60–66, 2015, https://doi.org/10.1016/j.cemconres.2014.10.014
» https://doi.org/10.1016/j.cemconres.2014.10.014 -
6 Q. X. Xiong, L. Y. Tong, Z. Zhang, C. Shi, and Q. F. Liu, "A new analytical method to predict permeability properties of cementitious mortars: The impacts of pore structure evolutions and relative humidity variations," Cement Concr. Compos., vol. 137, pp. 104912, 2023, https://doi.org/10.1016/j.cemconcomp.2022.104912
» https://doi.org/10.1016/j.cemconcomp.2022.104912 -
7 L. Y. Tong, Q. X. Xiong, X. Ke, N. M. Alderete, N. D. Belie, and Q. F. Liu, "Advanced modelling of moisture transport process in unsaturated cementitious materials considering multi-modal pore size distributions," Cement Concr. Res., vol. 198, pp. 107973, 2025, https://doi.org/10.1016/j.cemconres.2025.107973
» https://doi.org/10.1016/j.cemconres.2025.107973 -
8 Y. A. Villagrán-Zaccardi, N. M. Alderete, and N. De Belie, "Improved model for capillary absorption in cementitious materials: Progress over the fourth root of time," Cement Concr. Res., vol. 100, pp. 153–165, 2017, https://doi.org/10.1016/j.cemconres.2017.07.003
» https://doi.org/10.1016/j.cemconres.2017.07.003 -
9 N. M. Alderete, Y. A. Villagrán-Zaccardi, and N. De Belie, "Mechanism of long-term capillary water uptake in cementitious materials," Cement Concr. Compos., vol. 106, pp. 103448, 2020, https://doi.org/10.1016/j.cemconcomp.2019.103448
» https://doi.org/10.1016/j.cemconcomp.2019.103448 -
10 Q. Zeng and S. Xu, "A two-parameter stretched exponential function for dynamic water vapor sorption of cement-based porous materials," Mater. Struct., vol. 50, no. 2, pp. 128, 2017, https://doi.org/10.1617/s11527-017-0997-7
» https://doi.org/10.1617/s11527-017-0997-7 -
11 Z. Zhang and U. Angst, "Modeling anomalous moisture transport in cement-based materials with kinetic permeability," Int. J. Mol. Sci., vol. 21, no. 3, pp. 837, 2020, https://doi.org/10.3390/ijms21030837
» https://doi.org/10.3390/ijms21030837 -
12 M. Raimondo, M. Dondi, D. Gardini, G. Guarini, and F. Mazzanti, "Predicting the initial rate of water absorption in clay bricks," Constr. Build. Mater., vol. 23, no. 7, pp. 2623–2630, 2009, https://doi.org/10.1016/j.conbuildmat.2009.01.009
» https://doi.org/10.1016/j.conbuildmat.2009.01.009 -
13 K. Liang et al, "Investigation of the capillary rise in cement-based materials by using electrical resistivity measurement," Constr. Build. Mater., vol. 173, pp. 811–819, 2018, https://doi.org/10.1016/j.conbuildmat.2018.02.155
» https://doi.org/10.1016/j.conbuildmat.2018.02.155 -
14 F. Ren, C. Zhou, Q. Zeng, Z. Wang, and W. Wang, "Numerical investigations into the physical significance of sorptivity for cement-based materials considering water sensitivity," J. Build. Eng., vol. 66, pp. 105952, 2023, https://doi.org/10.1016/j.jobe.2023.105952
» https://doi.org/10.1016/j.jobe.2023.105952 -
15 C. Hall, "Anomalous diffusion in unsaturated flow: fact or fiction," Cement Concr. Res., vol. 37, no. 3, pp. 378–385, 2007, https://doi.org/10.1016/j.cemconres.2006.10.004
» https://doi.org/10.1016/j.cemconres.2006.10.004 -
16 M. Küntz and P. Lavallée, "Experimental evidence and theoretical analysis of anomalous diffusion during water infiltration in porous building materials," J. Phys. D Appl. Phys., vol. 34, no. 16, pp. 2547–2554, 2001, https://doi.org/10.1088/0022-3727/34/16/322
» https://doi.org/10.1088/0022-3727/34/16/322 -
17 J. Kaufmann and W. Studer, "One-dimensional water transport in covercrete—application of non-destructive methods," Mater. Struct., vol. 28, no. 2, pp. 115–124, 1995, https://doi.org/10.1007/BF02473185
» https://doi.org/10.1007/BF02473185 -
18 D. A. Lockington and J. Y. Parlange, "Anomalous water absorption in porous materials," J. Phys. D Appl. Phys., vol. 36, no. 6, pp. 760–767, 2003, https://doi.org/10.1088/0022-3727/36/6/320
» https://doi.org/10.1088/0022-3727/36/6/320 -
19 C. Hall, "Capillary imbibition in cement-based materials with time-dependent permeability," Cement Concr. Res., vol. 124, pp. 105835, 2019, https://doi.org/10.1016/j.cemconres.2019.105835
» https://doi.org/10.1016/j.cemconres.2019.105835 -
20 N. S. Martys and C. F. Ferraris, "Capillary transport in mortars and concrete," Cement Concr. Res., vol. 27, no. 5, pp. 747–760, 1997, https://doi.org/10.1016/S0008-8846(97)00052-5
» https://doi.org/10.1016/S0008-8846(97)00052-5 -
21 M. Wu, B. Johannesson, and M. Geiker, "Application of water vapor sorption measurements for porosity characterization of hardened cement pastes," Constr. Build. Mater., vol. 66, pp. 621–633, 2014, https://doi.org/10.1016/j.conbuildmat.2014.06.004
» https://doi.org/10.1016/j.conbuildmat.2014.06.004 -
22 D. Eriksson, T. Gasch, and A. Ansell, "A hygro-thermo-mechanical multiphase model for long-term water absorption into air-entrained concrete," Transp. Porous Media, vol. 127, no. 1, pp. 113–141, 2019, https://doi.org/10.1007/s11242-018-1182-3
» https://doi.org/10.1007/s11242-018-1182-3 -
23 E. Uribe, A. Vega-Gálvez, K. Di Scala, R. Oyanadel, J. Saavedra Torrico, and M. Miranda, "Characteristics of convective drying of pepino fruit (solanum muricatum ait.): application of weibull distribution," Food Bioprocess Technol., vol. 4, no. 8, pp. 1349–1356, 2011, https://doi.org/10.1007/s11947-009-0230-y
» https://doi.org/10.1007/s11947-009-0230-y -
24 R. Wallach, O. Troygot, and I. S. Saguy, "Modeling rehydration of porous food materials: II. The dual porosity approach," J. Food Eng., vol. 105, no. 3, pp. 416–421, 2011, https://doi.org/10.1016/j.jfoodeng.2011.01.024
» https://doi.org/10.1016/j.jfoodeng.2011.01.024 -
25 C. Zhang, S. Zhang, J. Yu, and X. Kong, "Water absorption behavior of hydrophobized concrete using silane emulsion as an admixture," Cement Concr. Res., vol. 154, pp. 106738, 2022, https://doi.org/10.1016/j.cemconres.2022.106738
» https://doi.org/10.1016/j.cemconres.2022.106738 -
26 G. Kemmer and S. Keller, "Nonlinear least-squares data fitting in Excel spreadsheets," Nat. Protoc., vol. 5, no. 2, pp. 267–281, 2010, https://doi.org/10.1038/nprot.2009.182
» https://doi.org/10.1038/nprot.2009.182 -
27 A. N. Spiess and N. Neumeyer, "An evaluation of as an inadequate measure for nonlinear models in pharmacological and biochemical research: a Monte Carlo approach," BMC Pharmacol., vol. 10, no. 1, pp. 1–11, 2010, https://doi.org/10.1186/1471-2210-10-6
» https://doi.org/10.1186/1471-2210-10-6 -
28 C. J. Willmott, S. M. Robeson, and K. Matsuura, "A refined index of model performance," Int. J. Climatol., vol. 32, no. 13, pp. 2088–2094, 2012, https://doi.org/10.1002/joc.2419
» https://doi.org/10.1002/joc.2419 -
29 C. E. T. Balestra, T. A. Reichert, W. A. Pansera, and G. Savaris, "Chloride profile modeling contemplating the convection zone based on concrete structures present for more than 40 years in different marine aggressive zones," Constr. Build. Mater., vol. 198, no. 20, pp. 345–358, Feb 2019, https://doi.org/10.1016/j.conbuildmat.2018.11.271
» https://doi.org/10.1016/j.conbuildmat.2018.11.271 -
30 American Society for Testing and Materials, Standard Test Method for Measurement of Rate of Absorption of Water by Hydraulic-Cement Concretes, ASTM C1585, 2020. https://doi.org/10.1520/C1585-20
» https://doi.org/10.1520/C1585-20
Edited by
-
Editors:
Edna Possan, Leandro Trautwein
Data-sharing is not applicable to this article as no new data were created or analyzed in this study.