 Performance of anthropometric indices in early detection of diabetes and prediabetes in the Brazilian population: a cross-sectional study, Brazil, 2013
Abstract
Objective: To assess the diagnostic performance of anthropometric adiposity metrics for diabetes and prediabetes detection in Brazilian adults.
Methods: This was a cross-sectional study using data from national surveys, such as glycated hemoglobin laboratory test data. Diabetes was defined as glycated hemoglobin ≥6.5% or when hypoglycemic agents were being taken; prediabetes was defined as glycated hemoglobin ≥5.7% and <6.5%. Diabetes and prediabetes prevalence rates were estimated with 95% confidence intervals (95%CI). The diagnostic performance of anthropometric indices - body mass index (BMI), waist circumference (WC), waist-to-height ratio (WHR), and body shape index - were evaluated using the area under the ROC curve (AUC), sensitivity, specificity, positive and negative predictive value, and Youden's index, stratified by sex and age group.
Results: 8,435 individuals participated in the study. Diabetes prevalence was 8.6% (95%CI 7.8; 9.3), while prediabetes prevalence was 16.2% (95%CI 15.1; 17.3). In males <40 years old, the AUC for the anthropometric indices was close to 0.5; among males between 40 and 59 years old, it ranged from 0.66 to 0.71; in older males, the AUC for WC was 0.72. Among females <40 years old, the WHR AUC was 0.77; for those between 40 and 59 years old, it ranged from 0.64 to 0.69; and in older females, the WC AUC was 0.66. The AUCs were lower for prediabetes: in males, they ranged from 0.58 to 0.63; while in females they ranged from 0.60 to 0.65.
Conclusion: WC was the index with the best performance for differentiating individuals with diabetes, while the ROC curve showed greater accuracy among adults <60 years old.
Keywords:
Prediabetic State; Diabetes Mellitus; ROC Curve; Cross-Sectional Studies; Anthropometry.
Resumo
Objetivo: Avaliar o desempenho diagnóstico de medidas antropométricas de adiposidade para detecção de diabetes e pré-diabetes em adultos brasileiros.
Métodos: Estudo transversal com dados de inquéritos nacionais, como exames laboratoriais de hemoglobina glicada. Considerou-se diabetes com hemoglobina glicada ≥6,5% ou quando havia uso de hipoglicemiantes; pré-diabetes com hemoglobina glicada ≥5,7% e <6,5%. As prevalências de diabetes e pré-diabetes foram estimadas com os intervalos de confiança de 95% (IC95%). O desempenho diagnóstico dos índices antropométricos - índice de massa corporal (IMC), circunferência da cintura (CC), razão circunferência/altura (RCE) e índice de forma corporal - foram avaliados por meio da área sob a curva ROC (AUC), a sensibilidade, a especificidade, o valor preditivo positivo e negativo e o índice de Youden, estratificados por sexo e faixa etária.
Resultados: 8.435 indivíduos participaram do estudo. A prevalência de diabetes foi 8,6% (IC95% 7,8; 9,3), e a de pré-diabetes 16,2% (IC95% 15,1; 17,3). Em homens <40 anos, a AUC dos índices antropométricos foi próxima de 0,5; entre 40 e 59 anos, variou de 0,66 a 0,71; em idosos, a CC apresentou AUC de 0,72. Em mulheres <40 anos, a AUC da RCE foi 0,77; entre 40 e 59 anos, variou de 0,64 a 0,69; e em idosas, a AUC da CC foi 0,66. Para pré-diabetes, as AUCs foram menores: em homens, variaram de 0,58 a 0,63; em mulheres, de 0,60 a 0,65.
Conclusão: A CC foi o índice de melhor desempenho para discriminar indivíduos com diabetes, enquanto a RCE mostrou maior acurácia entre adultos <60 anos.
Palavras-chave:
Estado Pré-Diabético; Diabetes Mellitus; Curva ROC; Estudos Transversais; Antropometria.
Resumen
Objetivo: Evaluar el rendimiento diagnóstico de los índices antropométricos de adiposidad para la detección de diabetes y prediabetes en adultos brasileños.
Métodos: Estudio transversal con datos de encuestas nacionales, como análisis de laboratorio de hemoglobina glucosilada. La diabetes se definió como hemoglobina glucosilada ≥6,5% o cuando se utilizaron hipoglucemiantes; la prediabetes se definió como hemoglobina glucosilada ≥5,7% y <6,5%. Las prevalencias de diabetes y prediabetes se estimaron con intervalos de confianza del 95% (IC95%). El rendimiento diagnóstico de los índices antropométricos - índice de masa corporal (IMC), circunferencia de la cintura (CC), índice cintura-talla (ICT) e índice de forma corporal - se evaluó mediante el área bajo la curva ROC (AUC), la sensibilidad, la especificidad, el valor predictivo positivo y negativo, y el índice de Youden, estratificados por sexo y grupo de edad.
Resultados: 8.435 individuos participaron en el estudio. La prevalencia de diabetes fue del 8,6% (IC95%: 7,8; 9,3) y la de prediabetes del 16,2% (IC95%: 15,1; 17,3). En hombres <40 años, el AUC de los índices antropométricos fue cercano a 0,5; entre 40 y 59 años, osciló entre 0,66 y 0,71; en hombres mayores, el CC tuvo un AUC de 0,72. En mujeres <40 años, el AUC del ICT fue de 0,77; entre 40 y 59 años, osciló entre 0,64 y 0,69; y en mujeres mayores, el AUC del CC fue de 0,66. Para la prediabetes, las AUC fueron menores: en hombres, oscilaron entre 0,58 y 0,63; En mujeres, de 0,60 a 0,65.
Conclusión: La CC fue el índice con mejor rendimiento para discriminar a las personas con diabetes, mientras que la curva ROC mostró mayor precisión en adultos menores de 60 años.
Palabras clave:
Estado Prediabético; Diabetes Mellitus; Curva ROC; Estudios Transversales; Antropometría.
This research respected ethical principles, having obtained the following approval data: Research ethics committee: Comissão Nacional de Ética em Pesquisa. Opinion number: 328,159. Approval date: 26/6/2013. Certificate of submission for ethical appraisal: 10853812.7.0000.0008. Informed consent record: Obtained from all participants prior to data collection.
Introduction
Diabetes has a significant impact on the global burden of disease. In 2021, worldwide there were 537 million people with diabetes and projections indicate that there will be 780 million in 20451. When uncontrolled, diabetes can increase the risk of cardiovascular disease, nephropathy, neuropathy, retinopathy and result in increased hospitalizations2.
Overweight is one of the main determinants of diabetes3. Accumulation of adipose tissue, above the normal level, contributes to the pathophysiological process of insulin resistance, responsible for initiating the causal chain of generalized metabolic outcomes, such as hypertension, hyperinsulinemia, diabetes and dyslipidemia, conditions collectively known as metabolic syndrome4. Thus, it is believed that anthropometric indices indicating excess accumulation of adipose tissue can be useful as diabetes screening and prevention indicators5,6.
Body mass index (BMI) is widely used as an estimate of nutritional status and is frequently employed in diagnosis of obesity, both in clinical and population contexts7. Its use has limitations, as it does not distinguish between the components of body mass and those of accumulated peripheral adipose tissue8,9.
Waist circumference (WC) allows for an indirect measurement of the amount of fat located in the abdomen and is used as one of the components of metabolic syndrome10. It can also incorporate height into its calculation, which generates the waist circumference-to-height ratio (WHR)11. A meta-analysis involving 300,000 participants from studies published between 1950 and 2008, identified that WHR was the best indicator among cardiometabolic risk factors3, associated with the same outcomes3.
Anthropometric metrics are easy to take, non-invasive and low cost12. Among other composite metrics, the body shape index (BSI) has been proposed, which incorporates WC, height and BMI13. This indicator has been shown to be a good index of body fat accumulation14.
There is no global consensus, nor even consensus in Brazil, on the cut-off points for anthropometric metrics that can identify adults at risk of metabolic disorders. Studies carried out with Brazilians, conducted with local or non-representative samples of the population15,16, and with other populations, have already demonstrated that these metrics are associated with metabolic diseases, such as diabetes6.
This study aimed to assess the diagnostic performance of different anthropometric metrics of adiposity for diabetes and prediabetes detection in Brazilian adults using data from the 2013 National Health Survey.
Methods
Design
This is a cross-sectional study, with data from the 2013 National Health Survey. Laboratory test data were collected in 2014 and 2015, and the two databases were linked.
Setting
The 2013 National Health Survey was conducted by the Brazilian Institute of Geography and Statistics in collaboration with the Ministry of Health and the Oswaldo Cruz Foundation. It is a population-based survey, with a representative sample of the Brazilian population, which aims to provide national-level data on the health status and lifestyle habits of the population, as well as information related to health care, such as access to and use of health services, prevention actions, continuity of care and health care funding17.
Participants
All adults aged 18 years or older who answered the National Health Survey in 2013 and who had biological samples collected in 2014-2015 were included in the study.
Variables
The following were included as independent variables: sex (male; female), race/skin color (White; Black; Asian; Brazilian mixed-race; Indigenous), age group (in years: 18-30; 31-40; 41-50; 51-60; 61-104), schooling (from illiterate to complete elementary; incomplete and complete high school; incomplete and complete higher education), region of residence (North; Northeast; Southeast; South; Midwest), alcohol consumption (non-drinker; light/moderate; excessive), smoking (non-smoker; former smoker; smoker), leisure-time physical activity (yes; no), measured hypertension (yes; no), self-reported heart disease (yes; no), altered high-density lipoprotein (yes: ≤40 mg/dL in males and ≤50 mg/dL in females; no: >40 mg/dL in males and >50 mg/dL in females). Self-rated health (good and excellent; poor, very poor; fair), altered waist circumference (yes: ≥88 cm in females and ≥102 cm in males; no: <88 cm in females and <102 cm in males), altered waist-to-height ratio (yes: ≥0.5; no: <0.5) and body mass index (underweight: <18.5; healthy weight: ≥18.5 and <25; overweight and obesity: ≥25).
Data sources and measurement
Regarding diabetes as the outcome, pregnant women, women who did not know whether or not they were pregnant, and individuals who had not undergone a glycated hemoglobin test were excluded. Regarding prediabetes at the outcome, individuals with diabetes (glycated hemoglobin ≥6.5% and those taking oral hypoglycemic agents and insulin) were not considered, as these conditions could overlap.
Participants were defined as diabetic when they had serum glycated hemoglobin levels ≥6.5% or were using medication to control diabetes18, as per the answers to the question: "In the last two weeks, because of diabetes, did you: Take oral medications to lower your blood sugar?/Use insulin?". Prediabetes was determined when individuals presented glycated hemoglobin levels ≥5.7 and <6.5%18.
For the purpose of anthropometric measurements, participants were instructed to be barefoot, without heavy clothing or accessories. Weight was measured using portable digital scales. Height was measured using a portable stadiometer. Waist circumference (WC) was measured with an anthropometric tape measure at the midpoint between the last rib and the iliac crest, without clothing around the waist. Interviewees stood with their arms flexed and crossed in front of their chests, feet apart and abdomen relaxed. Interviewees was asked to inhale and exhale completely until the measurement was taken. All measurements followed international recommendations, were performed three times, and average measurements were obtained19.
Based on anthropometric metrics of weight, height and WC, it was possible to build the following variables: body mass index (BMI) (weight/height²), waist-to-height ratio (WHR) (waist circumference in cm/height in cm), and body shape index (BSI). The latter was calculated using WC adjusted for height and BMI13. WC itself was also used. BMI was categorized as underweight (<18.5), healthy weight (≥18.5 and <25), and overweight and obesity (≥25). Altered WHR was dichotomized into no (<0.5) and yes (≥0.5). Altered WC was defined as follows: no (<88 cm for females and <102 cm for males men) and yes (≥88 cm for females and ≥102 cm for males).
The smoking variable (non-smoker; former smoker and smoker) was built from the following questions: "Do you currently smoke any tobacco product?" and "And in the past, did you smoke any tobacco product?".
The alcohol consumption variable (non-drinker; light/moderate; excessive) was consolidated from the following questions: "How many days a week do you usually drink alcoholic beverage?" and "In general, on the day you drink, how many doses of alcoholic beverage do you consume?"20.
Physical activity was defined as at least 150 minutes of moderate-intensity sports activities per week or 75 minutes of vigorous-intensity leisure activities per week. This variable was built from the following questions: "How many days a week do you usually exercise or play sports?", "In general, on the day you exercise or play sports, how many hours does this activity last?", and "In general, on the day you exercise or play sports, how many minutes does this activity last?".
The "heart disease" variable (yes; no) was built from the question: "Has a doctor ever diagnosed you with a heart disease such as a heart attack, angina, heart failure, or other heart disease?".
The altered high-density lipoprotein variable was built based on the following categories: no (>40 mg/dL for males and >50 mg/dL for females) and yes (≤40 mg/dL for males and ≤50 mg/dL for females)21.
Study size
The sampling plan for the 2013 National Health Survey was developed using three-stage cluster sampling17. The primary sampling units were selected from the Brazilian Institute of Geography and Statistics master sample and correspond to census tracts17. The second stage consisted of selecting households in each primary sampling unit. The third stage corresponded to the random selection of the household resident17. A questionnaire was administered by means of face-to-face interviews, as well as anthropometric measurements and blood pressure level checks, among individuals aged ≥18 years and residing in urban or rural areas of Brazil17. From the total number of household interviews, a subsample of 25% was extracted for biological material and biochemical analysis.
Statistical analysis
Descriptive analysis was performed based on sociodemographic and lifestyle variables, and anthropometric metrics. Diabetes and prediabetes prevalence rates and their respective 95% confidence intervals (95%CI) were estimated. Descriptive data analyses were performed using the Stata 14.0 survey module, which includes complex sample data structures for population estimates.
Diagnostic performance assessment was conducted using MedCalc Statistical Software version 16.4.3. For each anthropometric index, Receiver Operating Characteristics (ROC) curves were built, allowing estimation of cut-off points with the best diagnostic performance and the largest area under the curve. Other parameters were estimated to assess anthropometric index diagnosis in diabetes detection: sensitivity, specificity, positive and negative predictive values, and Youden's index. All analyses were stratified by sex (male; female) and age group (18 to 40; ≥40 to 60; ≥60 years).
Results
The final sample of individuals who had biological material collected and who met the study's inclusion criteria was 8,435. Diabetes prevalence was 8.6% (95%CI 7.8; 9.3) and was even higher in the population that self-identified as Indigenous (13.9%; 95%CI 6.8; 25.8), in those aged ≥60 years (20.9%; 95%CI 18.8; 23.3), with low education levels (11.7%; 95%CI 10.6; 12.9), former smokers (13.5%; 95%CI 11.5; 15.7), those who self-reported having received a medical diagnosis of heart disease (20.7%; 95%CI 16.2; 26.0) and those with low high-density lipoprotein cholesterol (11.3%; 95%CI 10.2; 12.5) (Table 1).
Prediabetes prevalence was 16.2% (95%CI 15.1; 7.3). The highest prediabetes prevalence rates were found in those aged ≥60 years (32.8%; 95%CI 29.9; 35.8), those with low education levels (20.7%; 95%CI 19.1; 22.3), former smokers (21.3%; 95%CI 18.7; 24.1), those who did not practice physical activities (16.8%; 95%CI 15.6; 18.1), those with hypertension (24.5%; 95%CI 32.9; 27.3) and those with low high-density lipoprotein cholesterol (19.6%; 95%CI 18.0; 21.3) (Table 1).
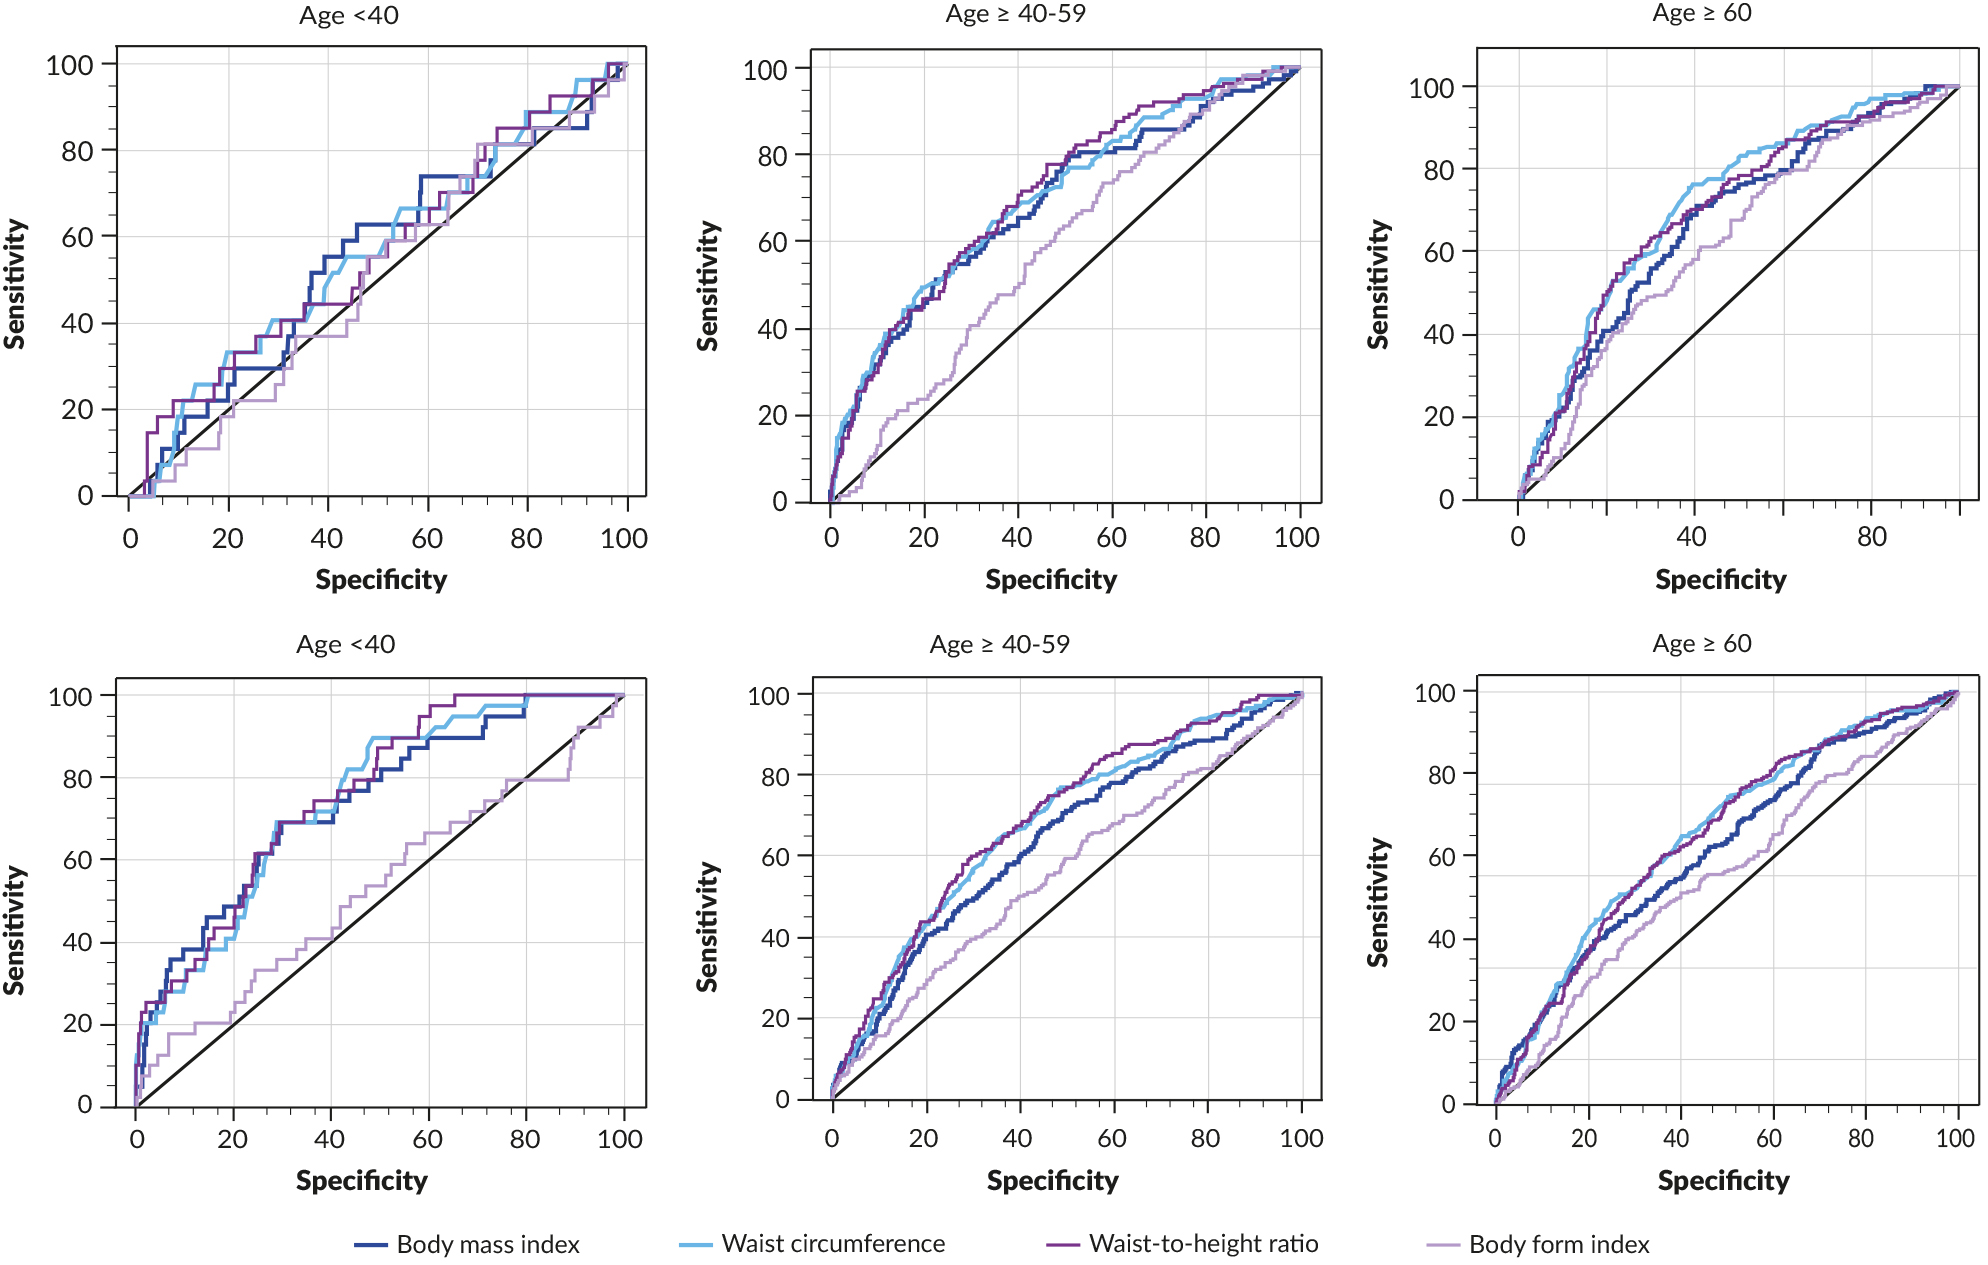
The diagnostic performance indicators of anthropometric indices for differentiating diabetes by age group and sex are presented in Table 2. The area under the curve for all anthropometric metrics was close to 0.5 in the male population aged <40 years. The area under the curve values were close to 0.7 in the ≥40 to <60 year age group, with the exception of the body shape index (BSI), which was 0.6. Waist circumference (WC) stood out in terms of sensitivity, specificity and positive predictive value in the elderly population.
The areas under the curve were above 0.75 in females aged <40 years, except for the BSI (Table 2). The waist-to-height ratio (WHR) stood out with good balance between sensitivity and specificity (both 71%) and a higher positive predictive value (Figure 1; Table 3). The areas under the curve were greater than 0.64 in the ≥40 and <60 year age range, except for the BSI (0.55). The WHR showed a positive predictive value of 18% in this age range. The areas under the curve were greater than 0.63 in the elderly group, except for the BSI (0.55), with emphasis on the positive predictive values of the BMI, WC and WHR (Table 2).
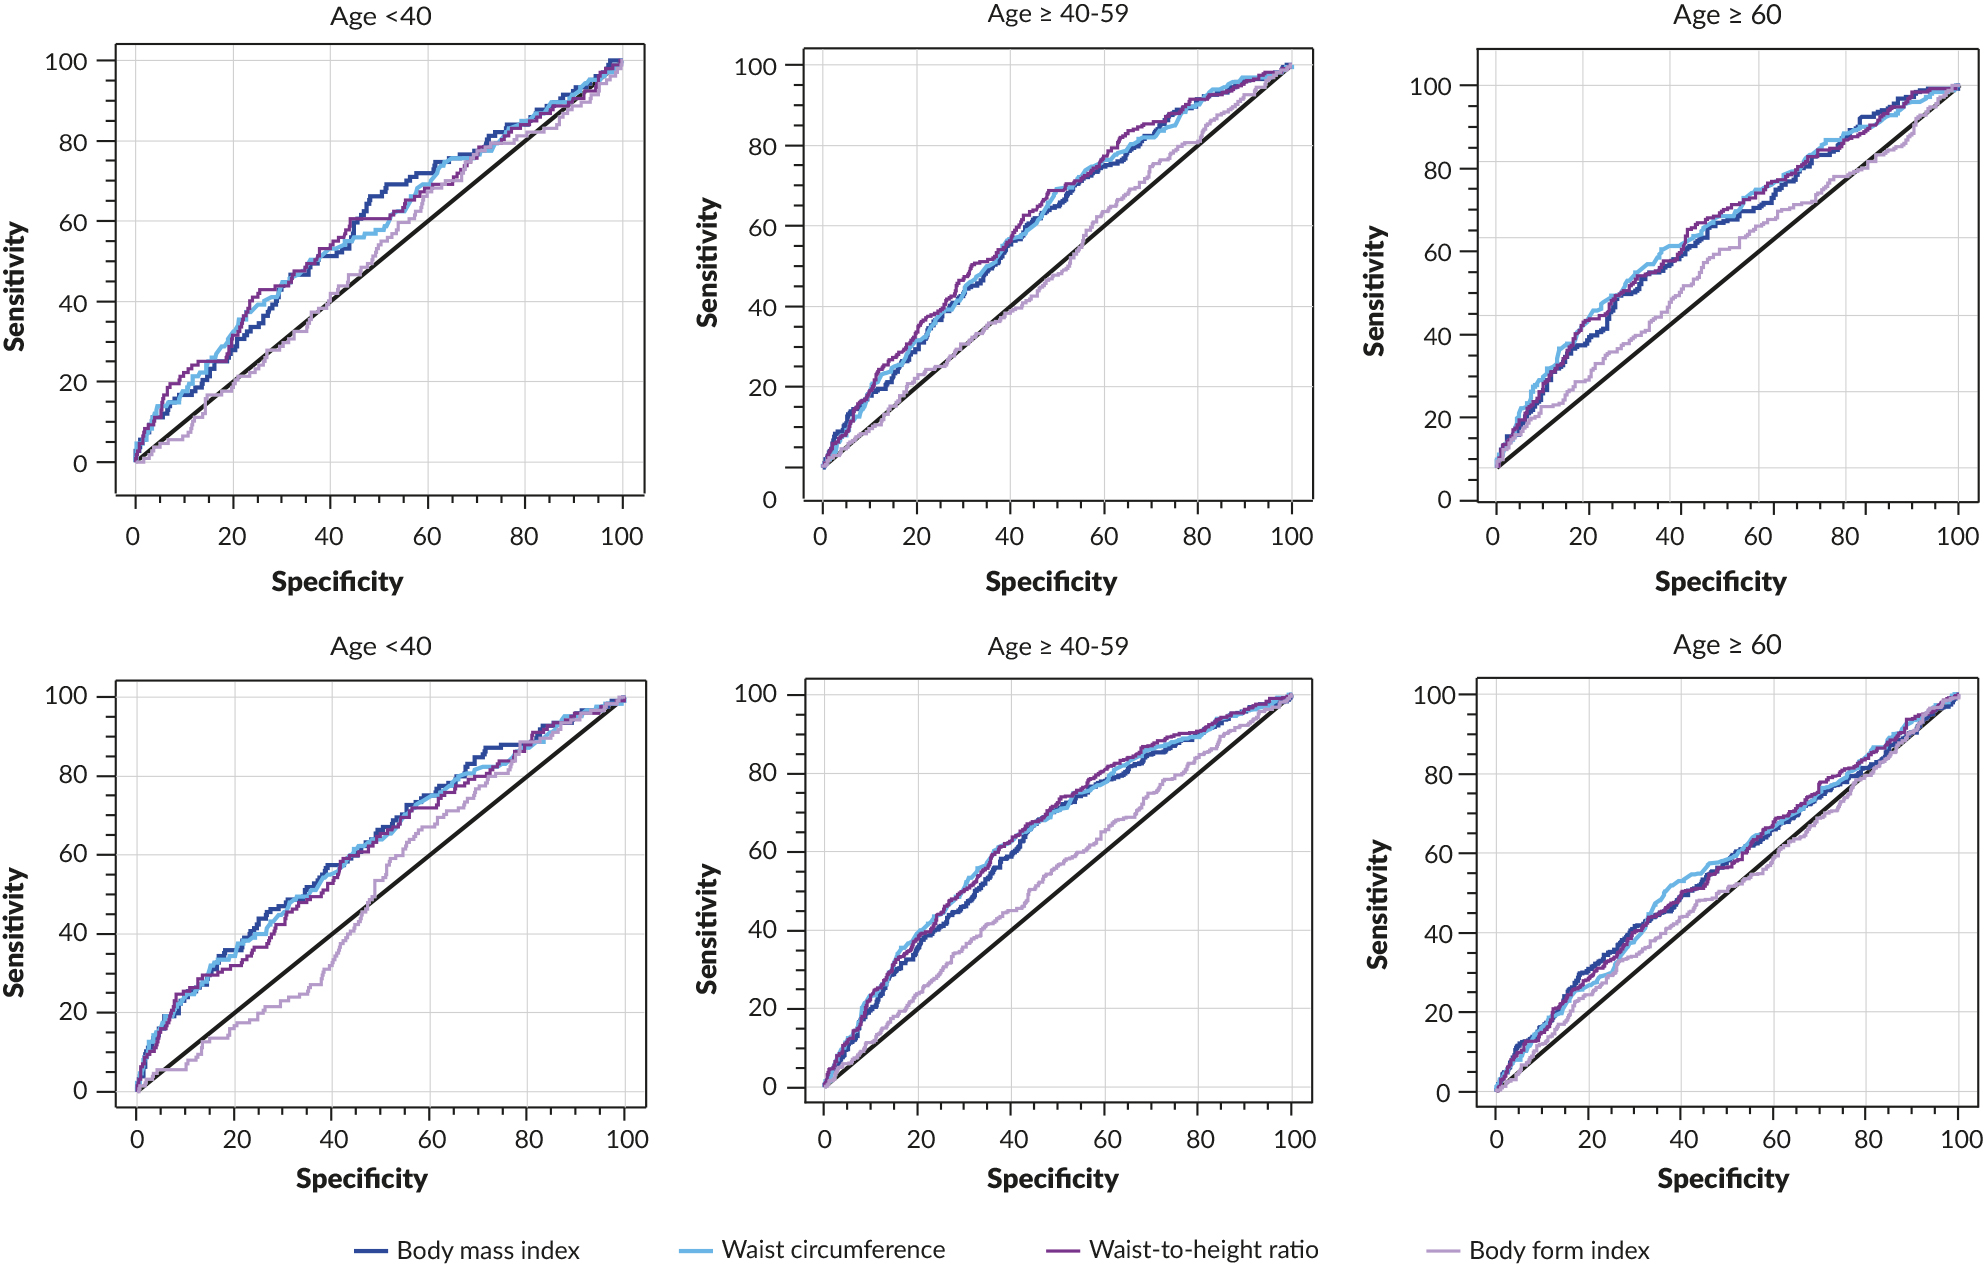
The diagnostic performance indicators of anthropometric metrics for prediabetes differentiation are presented in Table 3 and Figure 2. The area under the curve for all anthropometric metrics was close to 0.5 in the male population aged <40 years. The area under the curve values were close to 0.62 in the ≥40 to <60 years age range, except for the BSI, which was 0.5. The area under the curve values were also close to 0.6 in the elderly population, except for the BSI (0.52), with WC standing out in terms of positive predictive value.
The areas under the curve were above 0.6 in women in the <40 age group, except for the BSI (Table 3). The areas under the curve for all participants were above 0.62 in the ≥40 and <60 age groups, except for the BSI (0.54) (Table 3). The areas under the curve for all anthropometric metrics were close to 0.5 in the elderly group (Table 3).
Diabetes and prediabetes prevalence and 95% confidence intervals in the adult population, according to sociodemographic and lifestyle characteristics and anthropometric metrics. Brazil, 2014-2015 (n=8,435)
Performance indicators of anthropometric indices for differentiating diabetes in the adult population, according to age and sex. Brazil, 2014-2015 (n=8,435)
Area under the ROC curve of the anthropometric indices for diabetes diagnosis by age group in males <40 years old (A), in males ≥40 and ≥50 years old (B), in males ≥60 years old (C), in females <40 years old (D), in females ≥40 and ≥50 years old (E), and in females ≥60 years old (F). Brazil, 2014-2015 (n=8,435)
Performance indicators of anthropometric indices for differentiating prediabetes in the adult population, according to age and sex. Brazil, 2014-2015 (n=7,675)
Area under the ROC curve of the anthropometric indices for prediabetes diagnosis by age group in males <40 years old (A), in males ≥40 and ≥50 years old (B), in males ≥60 years old (C), in females <40 years old (D), in females ≥40 and ≥50 years old (E), and in females ≥60 years old (F). Brazil, 2014-2015 (n=7,675)
Discussion
This study found that anthropometric indicators of central obesity, especially waist circumference (WC), showed better diagnostic performance for diabetes and prediabetes compared to overall obesity indices. Diagnostic capacity varied according to sex and age, with better performance in the group under 60 years old.
Standing out among the limitations of this study is its cross-sectional design, preventing the establishment of temporal relationships between anthropometric metrics and development of diabetes, thus limiting causal inferences. The absence of laboratory data in the 2019 National Health Survey, a similar representative survey, prevented the replication of the analysis with more recent data. Hip circumference was not measured, which could improve the accuracy of the models and reduce limitations. The possibility of information bias in sociodemographic variables should also be noted, although this would not have affected the analyses performed in this study.
While the World Health Organization recommends WC cut-off points ≥94 cm (males) and ≥80 cm (females) for increased risk, and ≥102 cm (males) and ≥88 cm (females) for substantially increased risk22, in this study, the best performance for differentiating diabetes was observed between 97 and 103 cm. These were rationally supported by the metabolic effects of obesity18,23 and were shown to be representative of the extent of visceral adiposity and increased risk of cardiovascular disease24. Reduction in WC measurements can be achieved through healthy behaviors25. This study demonstrated that the capacity to differentiate WC between sexes was similar, but with relatively different cut-off points, mainly in the <40 age group. This result can be explained by differences in body composition or distribution of body adipose tissue, body dimensions and other physiological events between the sexes, such as during menopause, a period in which changes occur in the distribution of abdominal adiposity26.
Stratified analysis by age group showed that, in older adults, WC remained the most sensitive indicator, which may be attributed to redistribution of body fat and loss of muscle mass that occurs with aging. The waist-to-height ratio (WHR) also showed good accuracy, but its operational complexity is greater than that of waist circumference on its own, especially in primary care contexts3.
The better performance of WC in diabetes screening was consistent with studies conducted in Latin American countries, such as Chile, in which WC showed similar performance in adult women27.
WC is an accessible, low-cost metric with good clinical acceptability12, but its incorporation is not yet systematic in health services, as evidenced in studies of medical records and prenatal cards. Measurement technique standardization and health professional training are essential for expanding its use as a cardiometabolic risk marker.
A systematic review of more than 120,000 individuals from 18 countries showed that WHR also performs well, especially in women28, although its applicability may be limited, mainly in the elderly population, which has potential height reduction due to musculoskeletal problems.
Analysis of 31 studies with both males and females confirmed that WHR association with diabetes and cardiovascular disease is similar to that of WC, sometimes even greater28. Inclusion of height in the WHR measurement is justified by the increased prediction of risk of cardiovascular disease, demonstrated in meta-analysis, due to short stature being directly associated with increased risk of development of coronary heart disease29.
The main contribution of this study was demonstrating that WC has relevant applicability for diabetes screening in the general population, based on representative national data and using glycated hemoglobin as the gold standard for diabetes diagnosis18. This reinforces its adoption as a risk marker in primary care protocols, with the potential to guide preventive actions even before diagnosis, especially in more vulnerable groups.
References
-
1. Magliano DJ, Boyko EJ. IDF DIABETES ATLAS [Internet]. 10th ed. Brussels: International Diabetes Federation ; 2021 [cited 2026 Jan 06]. 141p. Available from:Available from:https://www.ncbi.nlm.nih.gov/books/NBK581934/
» https://www.ncbi.nlm.nih.gov/books/NBK581934/ -
2. Lai YR, Huang CC, Chiu WC, Liu RT, Tsai NW, Wang HC et al. HbA1C variability is strongly associated with the severity of cardiovascular autonomic neuropathy in patients with type 2 diabetes after longer diabetes duration [Internet]. Front Neurosci. 2019 [cited 2026 Jan 06]; 13. Available from: Available from: https://pubmed.ncbi.nlm.nih.gov/30814926/
» https://pubmed.ncbi.nlm.nih.gov/30814926/ -
3. Browning LM, Hsieh SD, Ashwell M. A systematic review of waist-to-height ratio as a screening tool for the prediction of cardiovascular disease and diabetes: 0·5 could be a suitable global boundary value [Internet]. Nutr Res Rev. 2010 [cited 2026 Jan 06]; 23(2):247-69. Available from: Available from: https://pubmed.ncbi.nlm.nih.gov/20819243/
» https://pubmed.ncbi.nlm.nih.gov/20819243/ -
4. Steinberger J, Daniels SR. Obesity, Insulin Resistance, Diabetes, and Cardiovascular Risk in Children [Internet]. Circulation.2003 [cited 2026 Jan 06]; 107(10):1448-53. Available from: Available from: https://www.ahajournals.org/doi/10.1161/01.CIR.0000060923.07573.F2
» https://www.ahajournals.org/doi/10.1161/01.CIR.0000060923.07573.F2 -
5. Battie CA, Borja-Hart N, Ancheta IB, Flores R, Rao G, Palaniappan L. Comparison of body mass index, waist circumference, and waist to height ratio in the prediction of hypertension and diabetes mellitus: Filipino-American women cardiovascular study [Internet]. Prev Med Rep. 2016 [cited 2026 Jan 06]; 4:608-13. Available from: Available from: https://www.sciencedirect.com/science/article/pii/S2211335516301206
» https://www.sciencedirect.com/science/article/pii/S2211335516301206 -
6. Wei J, Liu X, Xue H, Wang Y, Shi Z. Comparisons of Visceral Adiposity Index, Body Shape Index, Body Mass Index and Waist Circumference and Their Associations with Diabetes Mellitus in Adults [Internet]. Nutrients. 2019 [cited 2026 Jan 06]; 11(7) :1580.. Available from: Available from: https://www.mdpi.com/2072-6643/11/7/1580/html
» https://www.mdpi.com/2072-6643/11/7/1580/html -
7. Original A, Canaan FA, Lina R, Frandsen E, Lima P, Sylvia R et al. Aplicabilidade do índice de massa corporal na avaliação da gordura corporal [Internet]. Rev. Bras. Med. Esporte. 2010 [cited 2026 Jan 06]; 16(2):90-4. Available from: Available from: https://www.scielo.br/j/rbme/a/y5rNM97t3JpfshH5gHVfx6K/?lang=pt
» https://www.scielo.br/j/rbme/a/y5rNM97t3JpfshH5gHVfx6K/?lang=pt -
8. Gómez-Ambrosi J, Silva C, Galofré JC, Escalada J, Santos S, Millán D et al. Body mass index classification misses subjects with increased cardiometabolic risk factors related to elevated adiposity [Internet]. Int J Obes (Lond). 2012 [cited 2026 Jan 06]; 36(2):286-94. Available from: Available from: https://www.nature.com/articles/ijo2011100
» https://www.nature.com/articles/ijo2011100 -
9. Nevill AM, Stewart AD, Olds T, Holder R. Relationship between adiposity and body size reveals limitations of BMI [Internet]. Am J Phys Anthropol. 2006 [cited 2026 Jan 06] 129(1):151-6. Available from: Available from: https://onlinelibrary.wiley.com/doi/abs/10.1002/ajpa.20262
» https://onlinelibrary.wiley.com/doi/abs/10.1002/ajpa.20262 - 10. Ehrampoush E, Arasteh P, Homayounfar R, Cheraghpour M, Alipour M, Naghizadeh MM et al. New anthropometric indices or old ones: Which is the better predictor of body fat? Diabetes Metab Syndr. 2017;11(4) :257-263.
-
11. Alberti KGMM, Zimmet P, Shaw J, George : K, Alberti MM, Aschner P et al. Metabolic syndrome - a new world-wide definition. A Consensus Statement from the International Diabetes Federation [Internet]. Diabet Med. 2006 [cited 2026 Jan 06]; 23(5):469-80. Available from: Available from: https://pubmed.ncbi.nlm.nih.gov/16681555/
» https://pubmed.ncbi.nlm.nih.gov/16681555/ -
12. da Rocha NP, Siqueira-Catania A, Barros CR, Pires MM, Folchetti LD, Ferreira SRG. Análise de diferentes medidas antropométricas na identificação de síndrome metabólica, com ou sem alteração do metabolismo glicídico [Internet]. Arq Bras Endocrinol Metab. 2010 [cited 2026 Jan 06]; 54(7):636-43. Available from: Available from: https://www.scielo.br/j/abem/a/VC8xMsnnShVJKZQ58tsTc5c/?lang=pt
» https://www.scielo.br/j/abem/a/VC8xMsnnShVJKZQ58tsTc5c/?lang=pt -
13. Krakauer NY, Krakauer JC. A New Body Shape Index Predicts Mortality Hazard Independently of Body Mass Index [Internet]. PLoS One. 2012 [cited 2026 Jan 06]; 7(7):e39504. Available from: Available from: https://journals.plos.org/plosone/article?id=10.1371/journal.pone.0039504
» https://journals.plos.org/plosone/article?id=10.1371/journal.pone.0039504 -
14. Zhao Q, Zhang K, Li Y, Zhen Q, Shi J, Yu Y et al. Capacity of a body shape index and body roundness index to identify diabetes mellitus in Han Chinese people in Northeast China: a cross-sectional study [Internet]. Diabet. Med. 2018[cited 2026 Jan 06]; 35(11):1580-7. Available from: Available from: https://onlinelibrary.wiley.com/doi/full/10.1111/dme.13787
» https://onlinelibrary.wiley.com/doi/full/10.1111/dme.13787 -
15. Gouveia LAG, Marucci M de FN, Lebrão ML, Duarte YAO. Association between waist circumference (WC) values and hypertension, heart disease (HD) and diabetes, reported by the elderly - SABE survey: Health, wellness and aging, 2000 and 2006 [Internet]. Arch Gerontol Geriatr. 2014 [cited 2026 Jan 06]; 59(1):62-8. Available from: Available from: https://www.sciencedirect.com/science/article/abs/pii/S0167494314000144?via%3Dihub
» https://www.sciencedirect.com/science/article/abs/pii/S0167494314000144?via%3Dihub -
16. Marcadenti A, Fuchs SC, Moreira LB, Wiehe M, Gus M, Fuchs FD. Accuracy of Anthropometric Indexes of Obesity to Predict Diabetes Mellitus Type 2 Among Men and Women With Hypertension [Internet]. Am J Hypertens. 2011 [cited 2026 Jan 06]; 24(2):175-80. Available from: Available from: https://dx.doi.org/10.1038/ajh.2010.212
» https://dx.doi.org/10.1038/ajh.2010.212 -
17. Souza-Júnior PRB de, Freitas MPS de, Antonaci G de A, Szwarcwald CL. Desenho da amostra da Pesquisa Nacional de Saúde 2013 [Internet]. Epidemiol. Serv. Saúde. 2015 [cited 2026 Jan 06]; 24(2):207-16. Available from: Available from: https://www.scielo.br/j/ress/a/3m4VDz9fcxM3pygHMFNR64S/abstract/?lang=pt
» https://www.scielo.br/j/ress/a/3m4VDz9fcxM3pygHMFNR64S/abstract/?lang=pt -
18. Association AD. 2. Classification and Diagnosis of Diabetes: Standards of Medical Care in Diabetes - 2020 [Internet]. Diabetes Car. 2020 [cited 2026 Jan 06] ; 43(Supplement_1):S14-31. Available from: Available from: https://dx.doi.org/10.2337/dc20-S002
» https://dx.doi.org/10.2337/dc20-S002 -
19. Instituto Brasileiro de Geografia e Estatística. Pesquisa nacional de saúde 2013. Acesso e utilização dos serviços de saúde, acidentes e violências: Brasil, grandes regiões e unidades da federação. Pesquisa de Orçamentos Familiares 2008-2209 [Internet]. 2013 [cited 2026 Jan 06]; 39(12):100. Available from: Available from: https://biblioteca.ibge.gov.br/index.php/biblioteca-catalogo?view=detalhes&id=294074
» https://biblioteca.ibge.gov.br/index.php/biblioteca-catalogo?view=detalhes&id=294074 -
20. Berridge V, Herring R, Thom B. Binge Drinking: A Confused Concept and its Contemporary History [Internet]. Social History of Medicine. 2009 [cited 2026 Jan 06]; 22(3):597-607. Available from: Available from: https://dx.doi.org/10.1093/shm/hkp053
» https://dx.doi.org/10.1093/shm/hkp053 -
21. Faludi AA, de Oliveira Izar MC, Saraiva JFK, Chacra APM, Bianco HT, Neto AA et al. Atualização da Diretriz Brasileira de Dislipidemias e Prevenção da Aterosclerose - 2017 [Internet]. Arq Bras Cardiol. 2017 [cited 2026 Jan 06]; 109(2 Supl 1):1-76. Available from: Available from: https://pubmed.ncbi.nlm.nih.gov/28813069/
» https://pubmed.ncbi.nlm.nih.gov/28813069/ -
22. Lean MEJ, Han TS, Morrison CE. Waist circumference as a measure for indicating need for weight management [Internet]. BMJ. 1995 [cited 2026 Jan 06]; 311(6998):158-61. Available from: Available from: https://www.bmj.com/content/311/6998/158
» https://www.bmj.com/content/311/6998/158 -
23. Siu AL. Screening for abnormal blood glucose and type 2 diabetes mellitus: U.S. preventive services task force recommendation statement [Internet]. Ann Intern Med.2015[cited 2026 Jan 06]; 163(11):861-8. Available from: Available from: https://www.acpjournals.org/doi/10.7326/M15-2345
» https://www.acpjournals.org/doi/10.7326/M15-2345 -
24. Shen C, Zhou Z, Lai S, Tao X, Zhao D, Dong W et al. Urban-rural-specific trend in prevalence of general and central obesity, and association with hypertension in Chinese adults, aged 18-65 years [Internet]. BMC Public Health.2019 [cited 2026 Jan 06]; 19(1):1-8. Available from: Available from: https://bmcpublichealth.biomedcentral.com/articles/10.1186/s12889-019-7018-4
» https://bmcpublichealth.biomedcentral.com/articles/10.1186/s12889-019-7018-4 -
25. Ross R, Neeland IJ, Yamashita S, Shai I, Seidell J, Magni P et al. Waist circumference as a vital sign in clinical practice: a Consensus Statement from the IAS and ICCR Working Group on Visceral Obesity [Internet]. Nat Rev Endocrinol.2020 [cited 2026 Jan 06]; 16(3):177-89. Available from: Available from: https://www.nature.com/articles/s41574-019-0310-7
» https://www.nature.com/articles/s41574-019-0310-7 -
26. Tchernof A, Després JP. Pathophysiology of human visceral obesity: An update [Internet]. Physiol Rev. 2013 [cited 2026 Jan 06]; 93(1):359-404. Available from: Available from: https://journals.physiology.org/doi/10.1152/physrev.00033.2011
» https://journals.physiology.org/doi/10.1152/physrev.00033.2011 -
27. Petermann-Rocha F, Ulloa N, Martínez-Sanguinetti MA, Leiva AM, Martorell M, Villagrán M et al. Is waist-to-height ratio a better predictor of hypertension and type 2 diabetes than body mass index and waist circumference in the Chilean population? [Internet]. Nutrition. 2020 [cited 2026 Jan 06]; 79-80:110932. Available from : Available from : https://www.sciencedirect.com/science/article/abs/pii/S089990072030215X?via%3Dihub
» https://www.sciencedirect.com/science/article/abs/pii/S089990072030215X?via%3Dihub -
28. Ashwell M, Gunn P, Gibson S. Waist-to-height ratio is a better screening tool than waist circumference and BMI for adult cardiometabolic risk factors: systematic review and meta-analysis [Internet]. Obes Rev. 2012 [cited 2026 Jan 06] ;13(3):275-86. Available from: Available from: https://onlinelibrary.wiley.com/doi/10.1111/j.1467-789X.2011.00952.x
» https://onlinelibrary.wiley.com/doi/10.1111/j.1467-789X.2011.00952.x -
29. Paajanen TA, Oksala NKJ, Kuukasjärvi P, Karhunen PJ. Short stature is associated with coronary heart disease: a systematic review of the literature and a meta-analysis [Internet]. Eur Heart J. 2010 [cited 2026 Jan 06]; 31(14):1802-9. Available from: Available from: https://academic.oup.com/eurheartj/article-abstract/31/14/1802/437970?redirectedFrom=fulltext
» https://academic.oup.com/eurheartj/article-abstract/31/14/1802/437970?redirectedFrom=fulltext