 Reliability in probabilistic key-block theory
Abstract
The key-block theory enables the identification of stable and unstable blocks along the perimeter of underground excavations in hard rock. Monte Carlo simulation can be used to develop a probabilistic extension of the key-block theory. This article aims to examine the suitability of the reliability index as an interpretive tool for assessing block stability in analyses where variability is explicitly represented. A Monte Carlo simulator was implemented using the vector formulation of the key-block theory. In the simulations, variability in joint orientations is modeled with a spherical distribution, while strength variability is represented by a normal distribution. A first study showed that a lognormal model more appropriately represents the probabilistic distribution of the safety factor for the wall blocks in the studied case. This is due to the highly truncated probability density function of the Fischer distribution adopted for the orientation of the planes. A second study found that significant changes in block failure modes occur only under a large dispersion of joint orientations. A third study indicated that, for a roof block failing under self-weight, the required reinforcement level can be determined by verifying the consistency of the reliability index with international code criteria. The implemented simulator was validated through comparison with a commercial simulator. The developed tool offers advantages over the commercial reference, such as the direct calculation of the reliability index and the identification of the change in the failure mechanism that occurs for wide orientation dispersion.
Keywords:
Key-block theory; Monte Carlo simulation; reliability index; excavation stability; failure modes.
1. Introduction
In underground excavations in competent rock, instabilities of individual blocks may occur. The classical assessment of block stability can be carried out using stereographic projections, as described by Hoek and Brown (1980) and Fiori (2015). This approach became significantly more systematic and elegant with the development of Key-block theory proposed by Goodman and Shi (1985). The original theory was proposed on deterministic grounds; however, Goodman and Shi (1985) indicated the use of Monte Carlo simulation to incorporate variability and uncertainty into the analysis. Given this context, the authors aimed to examine probabilistic approaches to Key-block theory.
Probabilistic analysis of structural stability enables the explicit incorporation of uncertainties associated with geotechnical parameters, including the orientations of discontinuities. A quantitative measure of system safety can be obtained via the reliability index β. According to Christian et al. (1994) and Duncan et al. (2014), for cases with no variability in actions and a normally distributed safety factor with mean E[FS] and standard deviation σ[FS], the reliability index is defined as follows (Equation 1):
As observed in Equation 1, the reliability index represents the number of standard deviations (σ[FS]) separating the mean safety factor (E[FS]) from the critical safety factor (FS = 1).
This study discusses two programs that employ Monte Carlo simulation for probabilistic analyses of Key-blocks. The first, developed specifically for this research, is the Block Theory Reliability Assistant - V1 (BTRAV1). The BTRAV1 software was developed in Visual Basic for Applications in Excel (VBA/Excel) on the Windows platform. The BTRAV1 code is available upon request to the corresponding author. In BTRAV1, variability in joint orientations is represented by the spherical Fisher distribution (Fisher, 1953) implemented through the algorithm of Zheng et al. (2014). Variability in the joint friction angle and in reinforcement is modeled with a normal distribution, generated via an automated sampling routine that draws each input variable according to its assigned probability distribution. The vector formulation of the Key-block theory is incorporated into BTRAV1 along with the Monte Carlo simulation process. The implemented model is flexible and allows for customization regarding problem-specific configurations. To validate BTRAV1, the second program used in this study was the commercial software UnWedge (Rocscience, 2025). UnWedge also relies on the Key-block theory and was initially developed by Li (1991). Recent versions of UnWedge enable probabilistic assessment via Monte Carlo simulation. In this program, joint orientations and friction angles are likewise modeled with the Fisher (1953) and normal distributions, respectively.
The results obtained using BTRAV1 and UnWedge were consistent in deterministic analyses, as well as in terms of the failure probability and the frequency distribution of safety factors for different isolated blocks. This consistency highlights the coherence between the methods and the reliability of the developed implementation. As an in-house code, BTRAV1 offers high flexibility, allowing for adaptation to case-specific features and further enhancements. This flexibility makes it possible to implement alternative methods for computing the reliability index, such as those based on lognormal distributions. A key differentiator of BTRAV1 is its capability to estimate the reliability index, a metric not provided by UnWedge. Additionally, BTRAV1 can identify how block failure mechanisms change with variations in joint orientations and strength parameters, thereby enabling a probabilistic assessment of transitions between failure modes under different scenarios.
2. Key-block theory and its probabilistic extensions
The Key-block theory posits that blocks are defined by the intersection of discontinuities, which include joint surfaces and free surfaces. This theory employs the concept of a block and a pyramid, defined as follows. A block refers to the volume bounded by the half-spaces of the joint planes and the half-spaces of the free surface. A pyramid denotes the intersection of half-spaces translated to the origin of the reference system (Goodman and Shi, 1985; Shi, 2015).
A joint pyramid (JP) is the subset of the joint plane half-spaces translated to the origin. An excavation pyramid is the subset of half-spaces of the excavation plane translated to the origin. A space pyramid is defined as the set of directions complementary to the excavation pyramid. A block pyramid is the intersection of a joint pyramid with an excavation pyramid (Goodman and Shi, 1985; Shi, 2015).
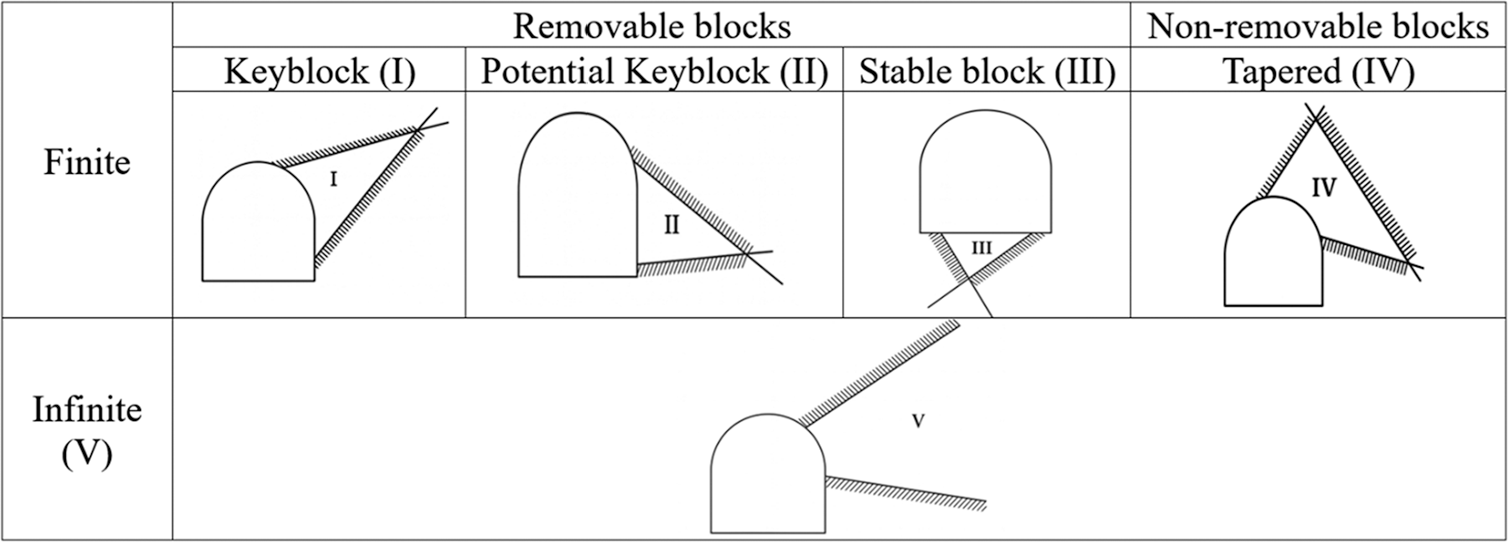
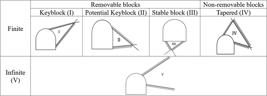
Blocks can be currently classified as infinite and finite (Figure 1). Infinite blocks (V) remain tapered within the rock mass and pose no threat to an excavation as long as they remain free of internal fracturing. Finite blocks, which are bound by joints and free surfaces, are subdivided into removable and non-removable blocks. Non-removable blocks (IV) are kinematically tapered and cannot be extracted from the rock mass. A removable block is a finite, nontapered block. A stable block (III) is a removable block that is stable even without friction, with respect to the resultant force. A potential Key-block (II) is a block that is stable with sufficient friction (i.e., potentially unstable). Finally, a Key-block (I) is a block that is not only removable but also unfavorably oriented, such that it will move unless it is supported (Goodman and Shi, 1985; Shi, 2015).
The Key-block theory proposed by Goodman and Shi (1985) consists of two main theorems. The first, called the Finite Block Theorem, establishes the criteria for determining whether a block is finite or infinite, and can be stated as follows: “A convex block is finite if its block pyramid is empty. Conversely, a convex block is infinite if its block pyramid is not empty”. The second, known as the Removability Theorem, defines the necessary and sufficient conditions for determining whether a finite block can be removed. If it cannot be removed, the block is considered to be tapered. This theorem can be stated as: “A convex block is removable if its block pyramid is empty and its joint pyramid is not empty. A convex block is not removable (or tapered) if its block pyramid and joint pyramid are both empty”.
Both theorems can be represented using upper-hemisphere stereographic projections. A convention is used to distinguish the half-spaces above and below a plane. Code 0 represents the half-space above the plane (inside the circle of its stereographic projection), and code 1 represents the half-space below the plane (outside the projection circle). For example, for three planes, the code 110 indicates the intersection of the following half-spaces: below plane 1, below plane 2, and above plane 3.
The Key-block theory can also be formulated using a vector representation. Let plane i be defined by its dip (αi) and dip direction (βi). The upward-pointing unit normal vector to the plane is given by:
Details of the vector formulation of the Key-block theory can be found in Goodman and Shi (1985); the formulation of block factors of safety is presented by Li (1991) and Rocscience (2025).
Some probabilistic extensions of the Key-block theory have been proposed in literature. For instance, Chan (1987) developed a Monte Carlo approach using a Poisson disk model to simulate joints and anticipate excavation support requirements. Hoerger and Young (1990) introduced a Monte Carlo framework in which joint density follows a Poisson distribution, disk diameter follows an exponential distribution, and orientation follows a bivariate normal distribution to predict the occurrence of Key-blocks. Stone et al. (1996) further advanced probabilistic modeling by generating discontinuities on a grid, adopting the Watson bipolar distribution for joint orientations and the Beta distribution for joint spacing and radius. Complementarily, Kuszmaul (1999) proposed a probabilistic method with an analytical solution for twoand three-dimensional Key-block analysis, limited to roof block falls in circular excavations, with results consistent with Monte Carlo simulations. Hwang et al. (2005) expanded comparative understanding by contrasting deterministic and Monte Carlo analyses, adopting a Poisson model for joint positioning and the Fisher (1953) distribution for joint orientation. Jakubowski (2011) presented the stochastic block stability simulation method, which combines Monte Carlo simulation with a stochastic joint network model that accounts for variations in joint orientation, spacing, and size. Chen (2012) later applied the First-Order Second-Moment (FOSM) method to probabilistic analysis of Key-blocks. Finally, UnWedge enables probabilistic analyses that consider variability in orientations, joint strength, persistence, and support load (Rocscience, 2025). However, none of the above approaches, explicitly considers changes in failure modes due to variability of joint orientation.
3. Materials and methods
Monte Carlo simulation is a statistical technique that can be used to estimate failure probability in structural systems subject to uncertainty. The procedure consists of generating a large set of independent realizations of the random variable vector X = {X1, X2, X3, ..., Xn}, each drawn from the specified probability distribution of the corresponding variable. Each realization xi is evaluated using the limit-state function g(xi), classifying the system as safe if g(xi) is positive and as unsafe if g(xi) is less than or equal to zero. The failure probability is then estimated by:
where N is the total number of simulations and I(∙) is the indicator function, which takes the value of 1 if the failure condition is satisfied and 0 otherwise. This approach is particularly robust for handling nonlinear models, multiple failure modes, and arbitrary probability distributions (Melchers and Beck, 2018). This approach was implemented in BTRAV1.
The principal input data for BTRAV1 are mean dip, mean dip direction and dispersion index of discontinuity sets, tunnel axis direction, rock unit weight, joint friction angle, and reinforcement level. In probabilistic analyses, it is necessary to specify which variables are treated as random and which probability distributions they follow. BTRAV1 also allows reinforcement to be modeled as a random variable. The tool provides separate tabs where appropriate probability distributions are generated for each variable. Consistent with the original premise of the Key-block theory, BTRAV1 assumes discontinuities of infinite persistence.
The values used in our analysis were based on a deterministic reference example presented by Fiori (2015), in which discontinuity orientations are specified as the mean dip and mean dip direction of each discontinuity set. In the present study, variability about these mean orientations was incorporated. The tunnel axis was oriented East-West, the cross section was a square with a 5 m side, and the rock unit weight was taken as 0.027 MN/m3. Table 1 lists the adopted input parameters.
Random variates for dip and dip direction are generated using the MCSDO_OPEN subroutine, developed by Zheng et al. (2014), which has been modified and integrated into BTRAV1. This algorithm is discussed in detail by Medinaceli-Torrez et al. (2024). For the friction angle, a normal distribution is employed, using standard deviation values compiled by Rusilo (2003).
Joint sets have a mean orientation and a dispersion that can be represented by the Fisher (1953) model. According to that distribution, if a set is considered to have N planes of discontinuities and the magnitude of the resultant vector from the sum of the unit normal vectors of the N planes is given by ⏐Rvector⏐ the dispersion index (kf) is given by:
It should be noted that some authors place (N-1) in the numerator of equation (4), e.g. Zheng et al. (2014).
Small values of kf indicate widely dispersed sets. Large values of kf indicate strongly clustered sets. In the limit, an infinite value for kf would indicate that there is no dispersion and all normal vectors have exactly the same orientation. An illustration of the role of the dispersion index can be seen in the initial part of the section on results and discussion.
The probability P that the normal of a plane will be located within an angle less than or equal to ψ, with the mean orientation implicitly described by:
Goodman (1989), Celestino and Diniz (1998), and Zheng et al. (2014) detail the process of calculating the dispersion index from orientation data collected in the field. More detailed theoretical considerations on Fisher (1953) distribution can be found in Fisher et al. (1987) and Klen (2015). The problem of calculating the dispersion index is associated with the problem of clustering in discontinuity orientation data, which is addressed, for example, in Shanley and Mahtab (1976), Jimenez-Rodriguez and Sitar (2006), and Klen and Lana (2014).
4. Results and discussion
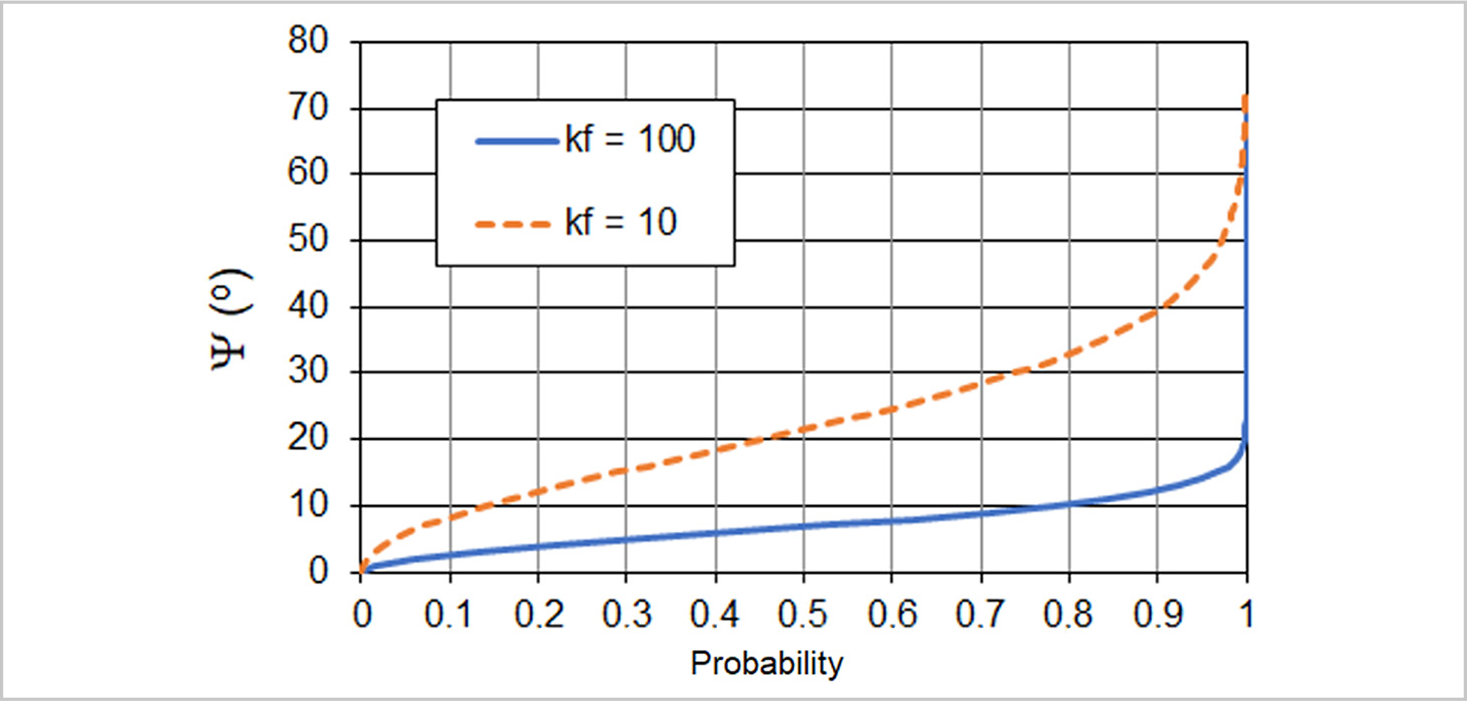
In this study, most analyses were performed with a dispersion index kf = 100 (which implies low dispersion). In one specific analysis, a dispersion index kf = 10 was adopted (which implies high dispersion). A scattering cone has an angle ψ between the generatrix and the axis, which has the mean orientation of the discontinuity set. Figure 2 shows the relationship between angle ψ and the probability of occurrence (given by Equation 5), for kf = 100 and kf = 10. For a kf = 100, the probability of 99% implies a theoretical angle ψ of approximately 18°. On the other hand, for a kf = 10, the probability of 99% implies a theoretical angle ψ of approximately 58°.
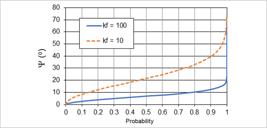
Probability of occurrence of a discontinuity with dispersion angle ψ around the mean orientation of discontinuity sets for different values of the dispersion index.
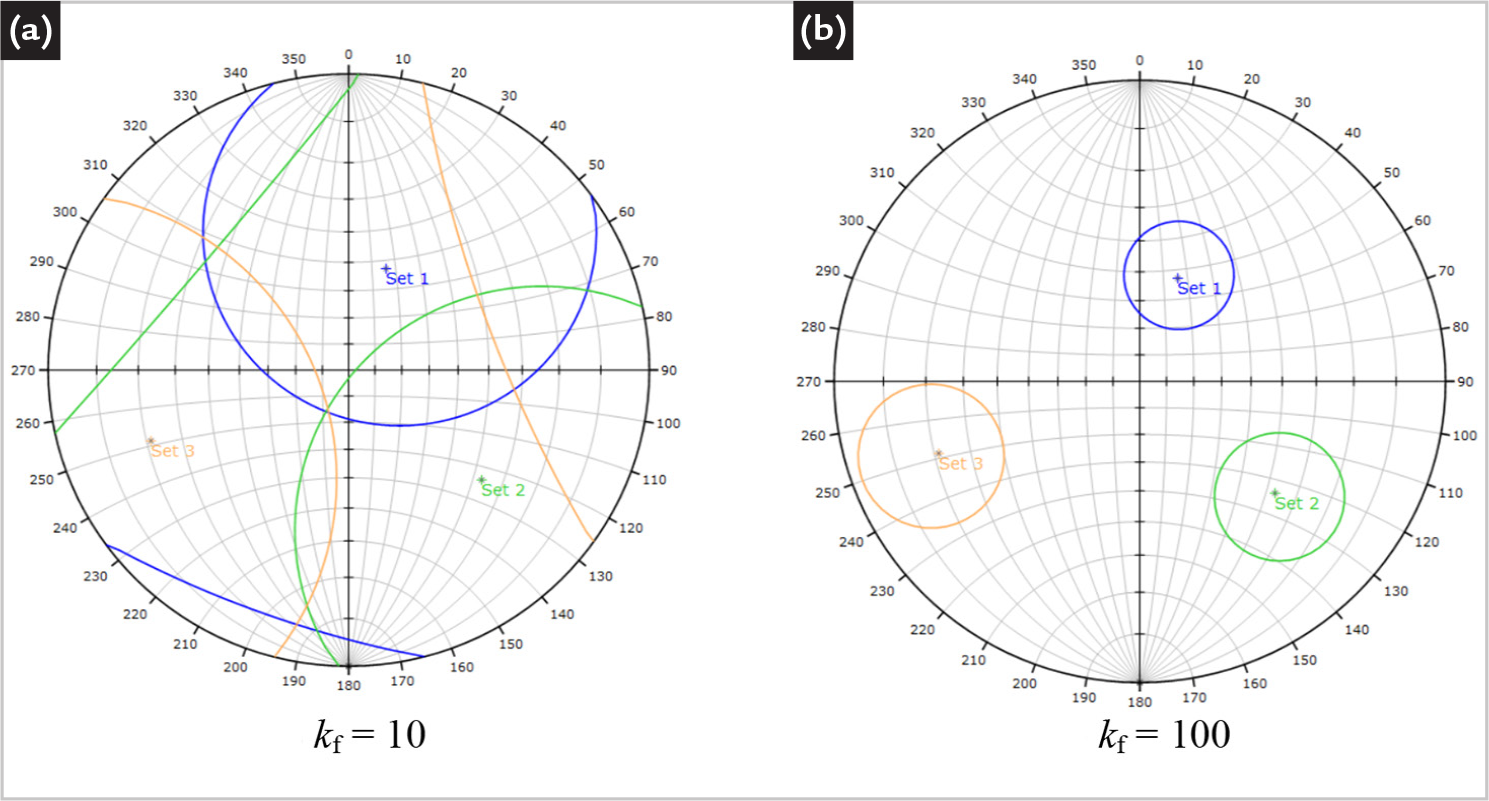
Figure 3a shows equal-angle stereographic projections of the scattering cones for the three discontinuities sets under the condition of kf = 10 for a probability of 99%, which implies a theoretical cone vertex half-angle ψ equal to 58°. For this first condition, the scattering is so large that the projections of the cones extend beyond the edge of the stereonet and are also represented on the opposite side of the projection edge.
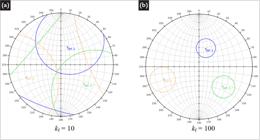
Scattering cones for 99% probability for the three discontinuity sets with different dispersion indices; discontinuity sets with the same mean orientations. (a) High dispersion, kf = 10. (b) Low dispersion, kf = 100.
Figure 3b shows the scattering cones for the condition kf = 100 for a probability of 99%, a condition for which the theoretical cone vertex half-angle ψ is equal to 18°. This second condition represents a small scattering, and the scattering cone projections are closer to the mean orientation of each discontinuity set.
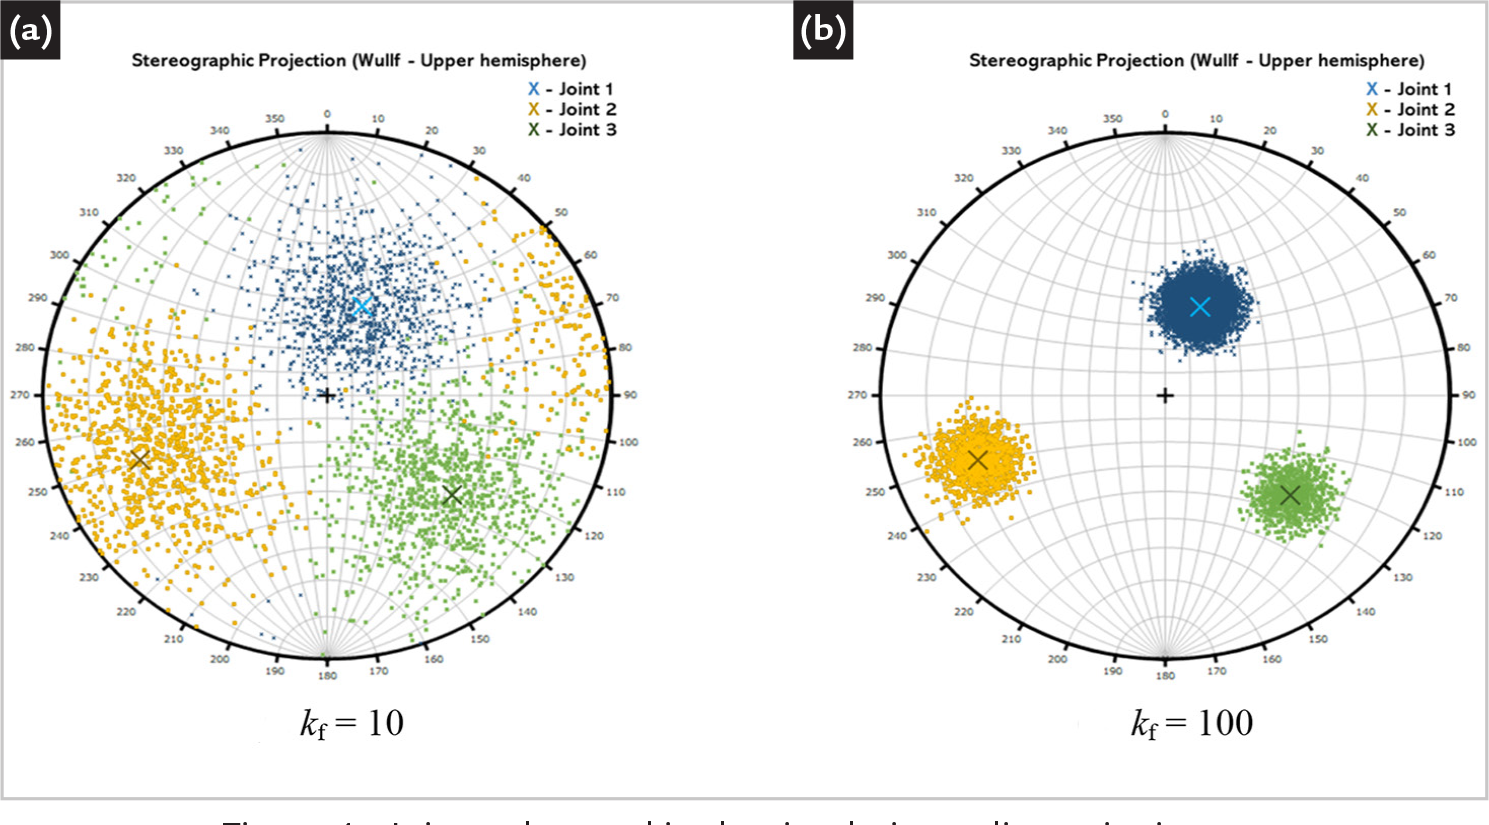
The poles of the planes used in the simulations, as well as their mean orientations, are shown on the upper-hemisphere stereonets generated by BTRAV1 presented in Figure 4. Figure 4a shows the dataset generated with kf = 10 (high dispersion), whereas Figure 4b shows the dataset generated with kf = 100 (low dispersion). In most of the simulations presented here, kf = 100 was adopted, except for the comparison in section 4.1, where a simulation with kf = 10 was also performed. In Figure 4, only 1000 planes per set were represented.
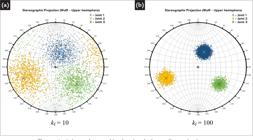
Joint poles used in the simulations, discontinuity sets with the same mean orientations. (a) High dispersion, kf = 10. (b) Low dispersion, kf = 100.
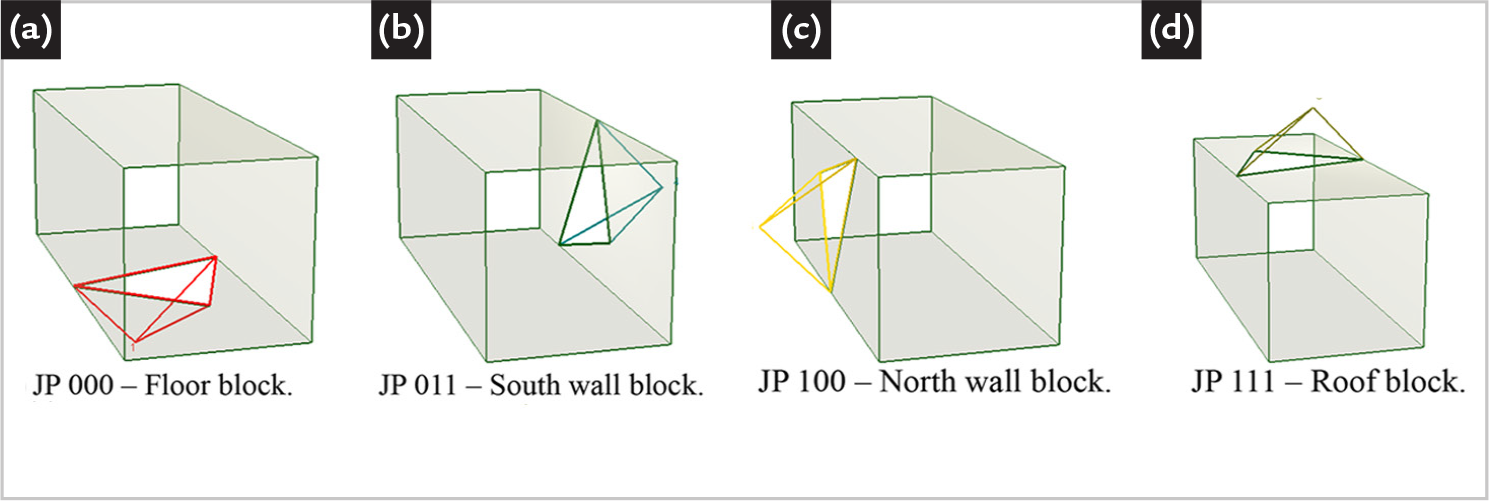
To validate BTRAV1, its results were compared with those produced by the commercial software UnWedge (Rocscience, 2025). The same input data used in BTRAV1 were inserted into UnWedge, ensuring geometric and parametric equivalence between the models. An initial step involved conducting a convergence study of the Monte Carlo simulations concerning the safety factors. For the data considered here, four principal Key-blocks were identified (corresponding to the joint pyramids JP 000, JP 011, JP 100, and JP 111) and are illustrated in Figure 5, generated using UnWedge.
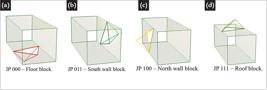
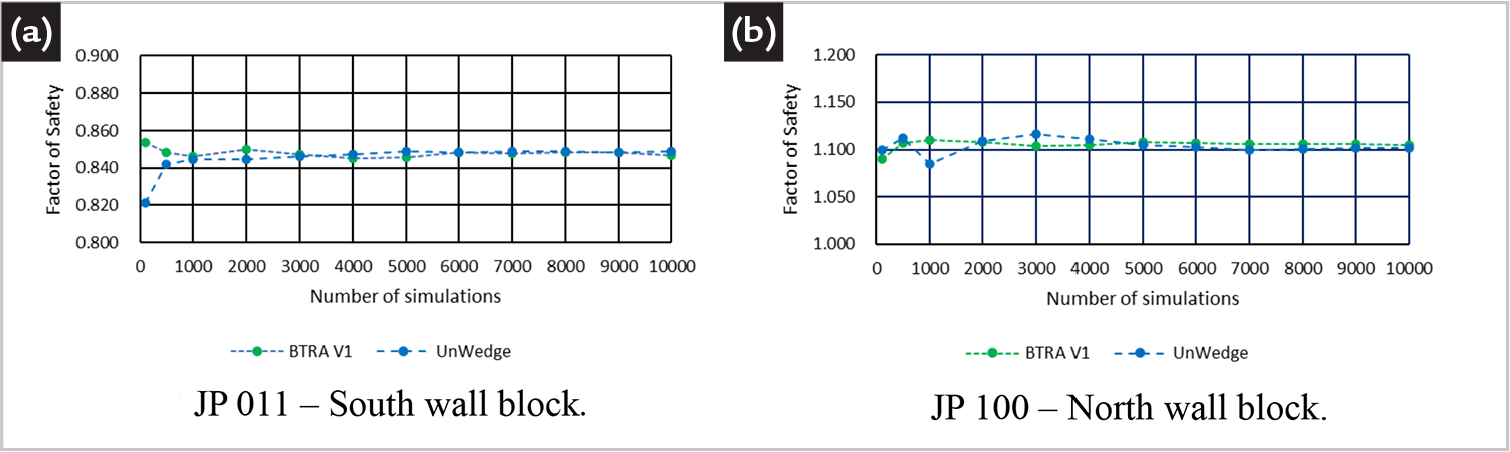
Figure 6 presents the convergence results. For the south wall block (JP 011), the mean safety factor reached its asymptotic value at approximately 6,000 simulations (Figure 6a). In contrast, for the north wall block (JP 100), stabilization occurred from about 5,000 simulations onward, with minor residual fluctuations observed (Figure 6b).
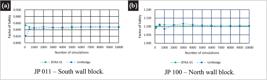
Medinaceli-Torrez et al. (2024) found that, using the Zheng et al. (2014) algorithm with a Fisher (1953) dispersion index of kf = 100, Monte Carlo simulation results converged to the theoretical value and stabilized at approximately 6,000 simulations. In this study, stabilization in UnWedge occurred at approximately 7,000 simulations. Based on this convergence assessment, 10,000 Monte Carlo runs were adopted, which is deemed sufficient to ensure robust statistical accuracy of the results. According to Beck (2024), in Monte Carlo simulations, the coefficient of variation of the failure probability will be below 10% if the number of simulations satisfies N = 10(p+2), where p is the order-of-magnitude exponent such that Pf = 10-p. Thus, a total of 104 simulations yield reliable estimates for failure probabilities on the order of 10-2 (≈ 1%), ensuring consistency in the computed results.
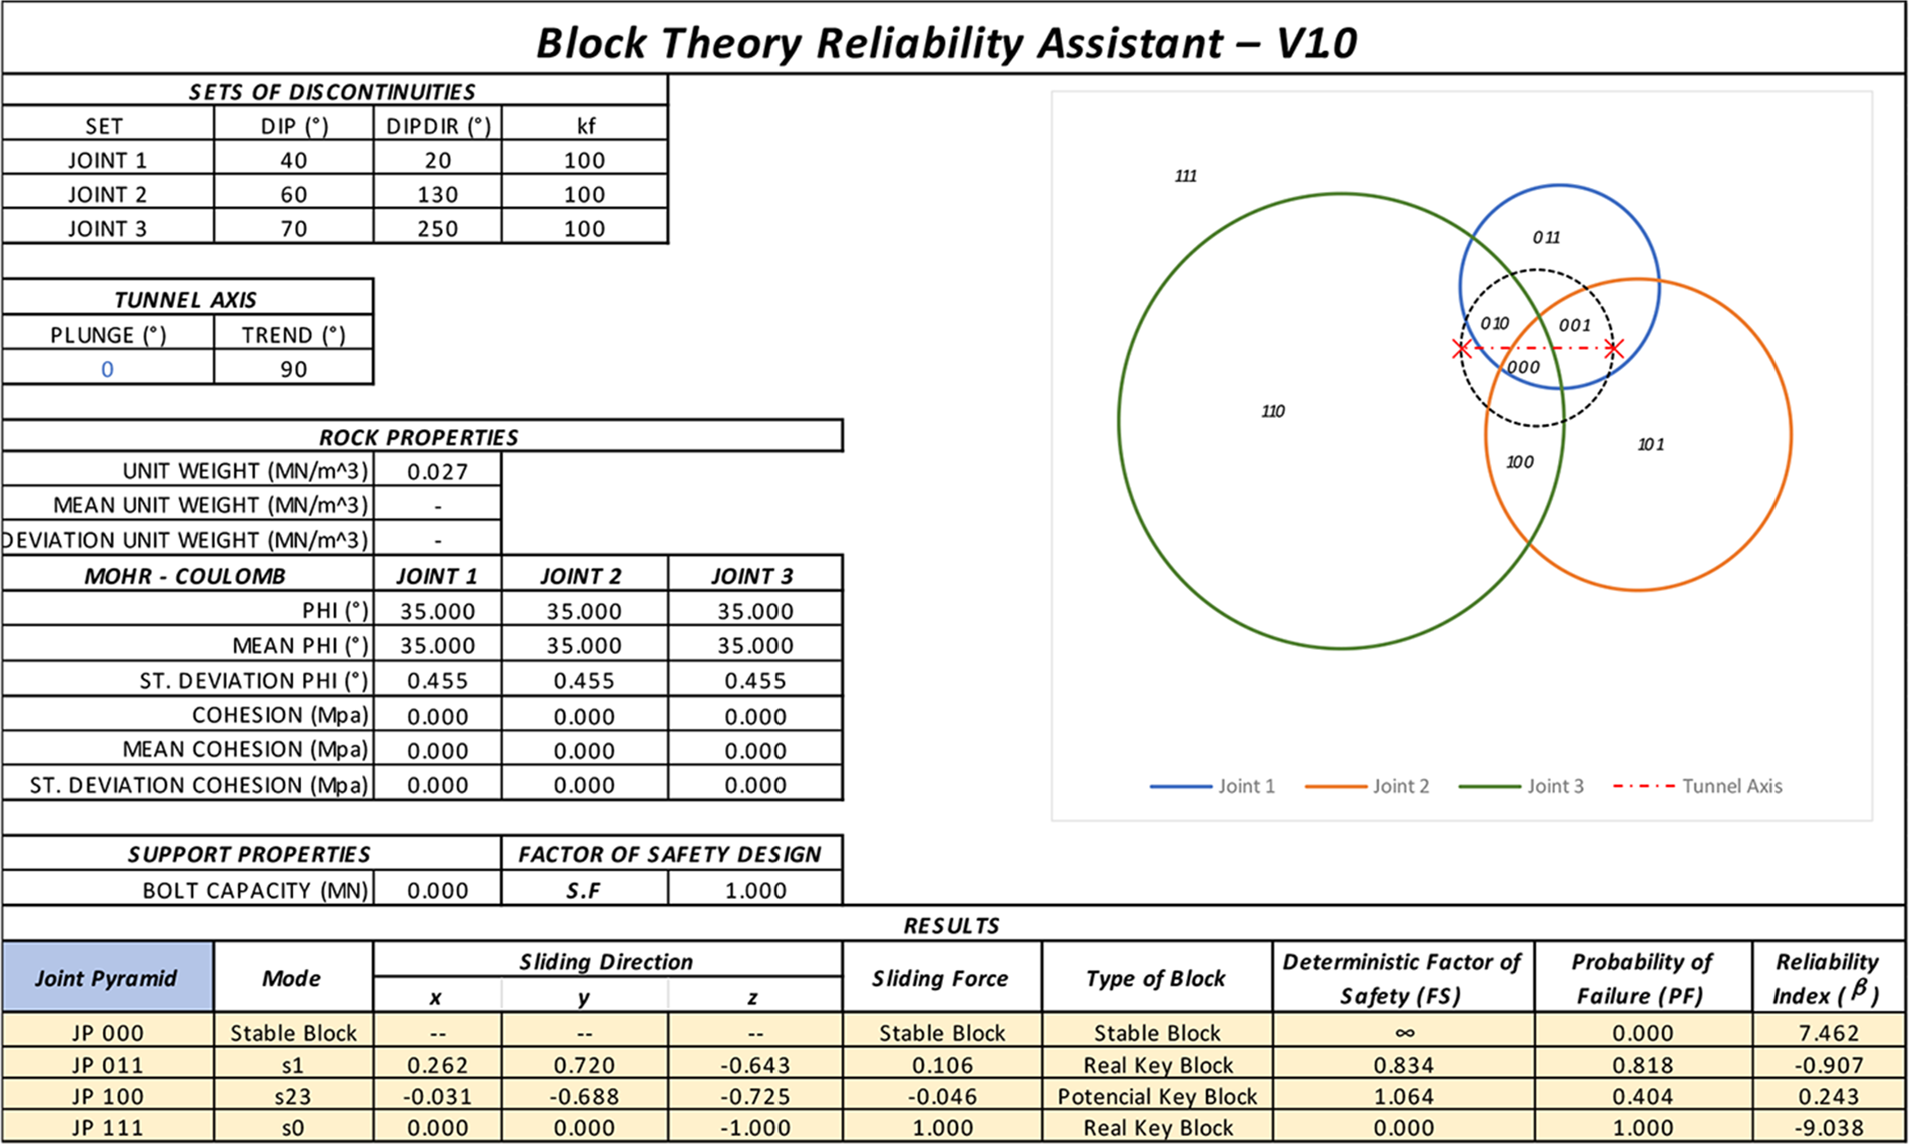
Figure 7 presents the results obtained from BTRAV1: the deterministic assessment of the safety factor, as well as probabilistic safety estimates expressed by the failure probability and the reliability index.
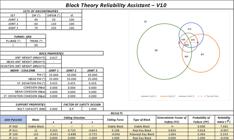
As a general reference, a reliability index of β ≥ 3 is adopted to ensure a safe design. Reference design values for the reliability index are provided by the U.S. Army Corps of Engineers (1997), Joint Committee on Structural Safety (2001), and Comité Européen de Normalisation (2004). A zero-reliability index (β = 0) indicates that the mean of the safety factor distribution equals unity, which, for a normal distribution, corresponds to a 50% failure probability. Conversely, a negative reliability index (β < 0) indicates that the mean of the safety factor distribution is less than unity, signifying a predominantly unstable condition in which system failure becomes the most likely outcome.
Table 2 summarizes the deterministic results for blocks formed by the intersections of the joint planes. The failure modes considered include: falling (s0), sliding on a single joint plane (s1 and s3), and sliding along the line of intersection of two joint planes (s12, s13, and s23). The components of the sliding direction vector are x, y, and z. The sliding force follows a sign convention where positive values indicate blocks with a tendency to move in the absence of support, while negative values indicate stable blocks. The sliding force is expressed as a fraction of the block weight (W). Lastly, the table also reports the type of block instability and the corresponding safety factor.
The floor block JP 000 is classified as stable, exhibiting a very high safety factor that tends to infinity (FS → ∞). The south wall block (JP 011) corresponds to a real Key-block, whose deterministic safety factor is less than 1 (FS = 0.834). This result indicates instability, with sliding occurring along joint plane 1, and therefore requires the implementation of support systems to ensure stability. The north wall block (JP 100) is identified as a potential Key-block that is currently stable (FS = 1.064). It should be noted that its instability mechanism is associated with sliding along the line of intersection of joint planes 2 and 3. Lastly, the roof block (JP 111) constitutes a real Key-block in a critical condition. The computed safety factor is zero, indicating total instability. It is a block prone to gravitational collapse, requiring the design of an adequate support system, essential for its stabilization.
Table 3 lists the results obtained using the UnWedge software. The values for the sliding direction, associated vectors, and deterministic factors of safety calculated in BTRAV1 were identical to those produced by UnWedge, as shown by comparing Tables 2 and 3. This equivalence validates BTRAV1 for deterministic analyses, demonstrating its reliability and coherence relative to a widely recognized industry tool. The results are consistent in both movement direction and safety factor.
For the probabilistic analysis, 10,000 Monte Carlo runs were performed, and the resulting failure probabilities (Pf) and reliability indices were computed. Table 4 provides a comparative summary of the results obtained with BTRAV1 and UnWedge under the same geometric and strength conditions.
The probabilistic analyses performed with BTRAV1 and UnWedge yielded very similar results, confirming the consistency between both methods (Table 4). The floor block (JP 000) exhibited a zero failure probability (Pf = 0%), indicating stability and aligning with the prior deterministic analysis. The south wall block (JP 011) showed a failure probability of approximately 82% (Pf ≈ 0.818), consistent with its deterministic safety factor being below unity, which demonstrates the need for support to stabilize it. The north wall block (JP 100) presented a failure probability of about 40% (Pf ≈ 0.404), suggesting that although it is currently stable (FS > 1), it may become unstable if the strength characteristics of the joint planes change slightly. Finally, the roof block (JP 111) exhibited a 100% failure probability (Pf = 1.0), confirming its total instability and reiterating the need for an adequate support system. Unlike UnWedge, BTRAV1 can compute the reliability index for each wedge. Table 5 provides the corresponding values for all generated blocks.
Blocks JP 011 and JP 111, due to their high probabilities of failure exceeding 50%, exhibit negative reliability indices. The floor block (JP 000) shows a reliability index approaching negative infinity (β = -∞), which is directly related to its safety factor approaching infinity (FS → ∞). Among the unstable blocks, the only one that can be assessed in terms of a positive reliability index is the north wall block (JP 100), which has a reliability index of β = 0.243.
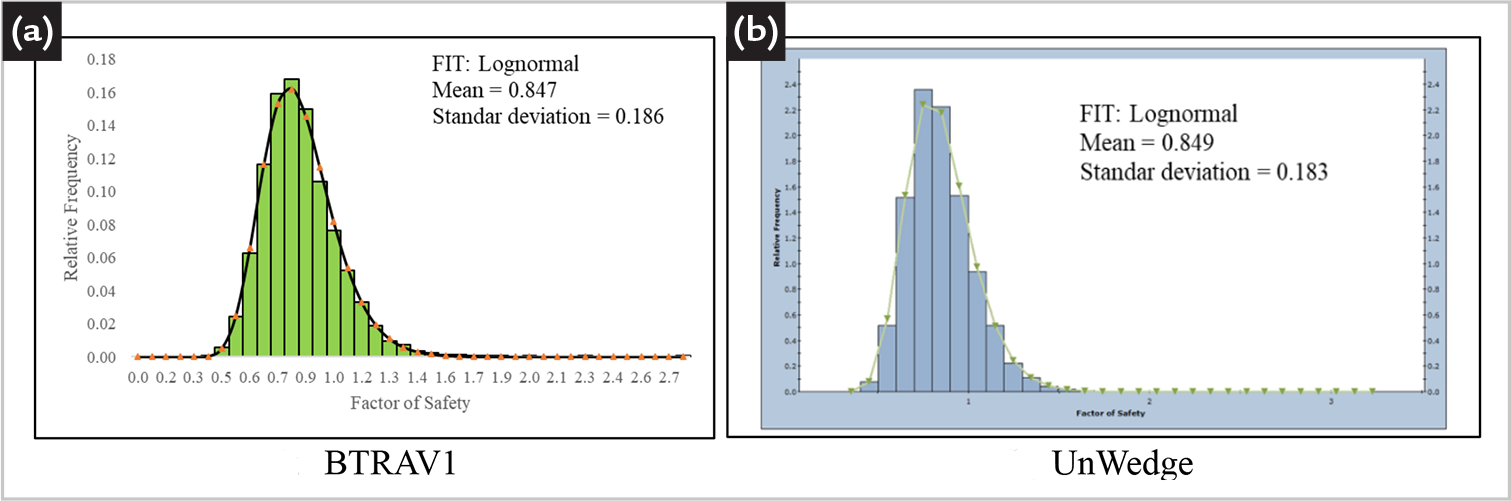
Figures 8 and 9 illustrate the histograms of the factors of safety resulting from the 10,000 Monte Carlo simulations for blocks JP011 and JP100. Figure 8 shows the histograms of the safety factor for block JP 011 fitted to a lognormal distribution. At a significance level of α = 0.05, the Kolmogorov-Smirnov test rejects normality because the statistic D = 0.057 exceeds the critical value Dcrit = 0.014 (Blank, 1980). In contrast, the lognormality hypothesis is not rejected because D = 0.013 is lower than Dcrit = 0.014. Therefore, under the adopted decision criterion and for this dataset, there is statistical evidence to rule out the normal distribution, whereas the lognormal distribution is consistent with the observed behavior. Initial studies indicate the function to be a lognormal; this is due to the highly truncated probability density function of the Fischer (1953) distribution adopted for the orientation of the planes. From BTRAV1, the mean and standard deviation are E[FS] = 0.847 and σ[FS] = 0.186, respectively; from UnWedge, the corresponding values are E[FS] = 0.849 and σ[FS] = 0.183. The numerical agreement and the consistent distribution model indicate that the probabilistic behavior obtained with BTRAV1 is equivalent to that of UnWedge, thereby reinforcing the validation of BTRAV1 as a reliable tool for probabilistic analyses of block stability.
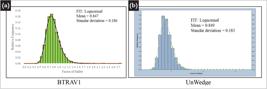
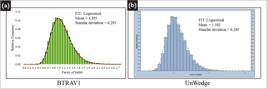
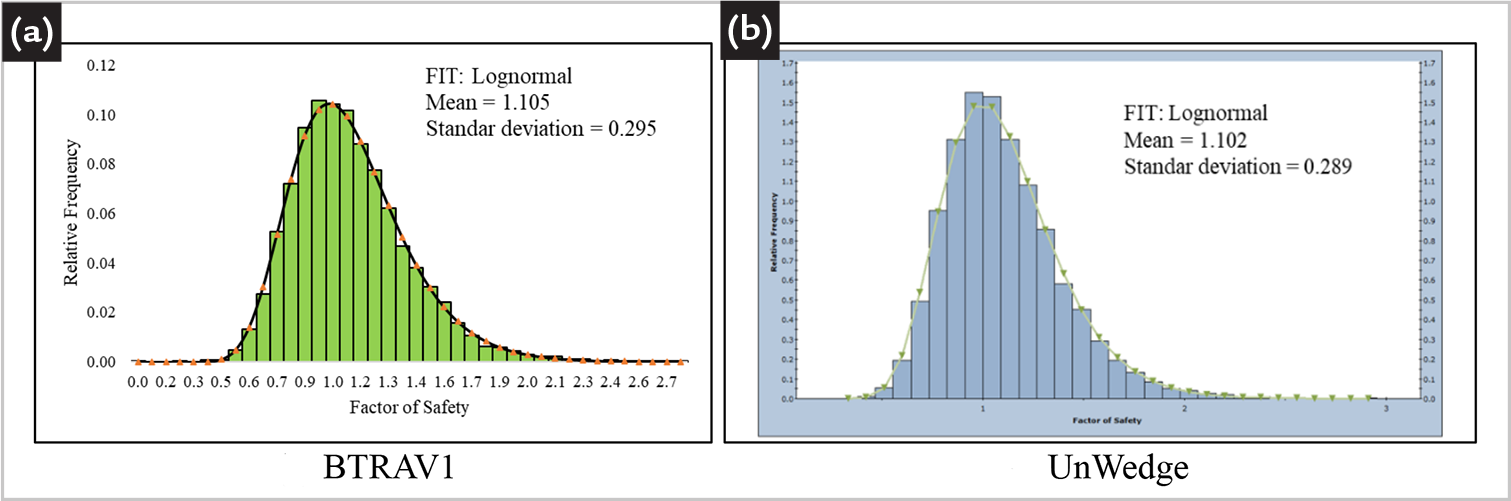
Figure 9 shows that the histograms of the factors of safety for block JP 100, obtained using BTRAV1 (Figure 7a) and UnWedge (Figure 7b), exhibit a lognormal distribution. At a significance level of α = 0.05, the Kolmogorov-Smirnov test rejects normality (D = 0.057 > Dcrit = 0.014) and does not reject lognormality (D = 0.0079 < Dcrit = 0.014). Therefore, the normal distribution is ruled out, whereas the lognormal distribution is consistent with the analyzed data. From BTRAV1, the mean and standard deviation are E[FS] = 1.105 and σ[FS] = 0.295, respectively; from UnWedge, the corresponding values are E[FS] = 1.102 and σ[FS] = 0.289. This behavior supports the classification of JP 100 as a potential Key-block that is stable under current conditions but susceptible to sliding along the line of intersection of joint planes 2 and 3. The similarity between the two histograms further validates BTRAV1 regarding the shape of the probability density function, as well as the mean values and standard deviations.
4.1 Variability of failure mode
In BTRAV1, it is possible to quantify the impact of variability in joint plane orientations on block failure modes. The dispersion index, kf , controls the variations in failure modes. It should be noted that a low kf value implies greater dispersion, whereas a high kf value indicates stronger concentration around the mean.
Table 6 presents the results of a parametric study on the influence of percentage changes in failure modes for both large dispersion (kf = 10) and small dispersion (kf = 100). The values highlighted in Table 6 indicate the predominant failure modes, as reported in Table 2.
In cases of high dispersion (kf = 10), there is substantial variability in failure modes. The floor block (JP 000) remained stable in 71.60% of realizations; in the remaining cases, the block originally located on the floor transitions to become a wall block, sliding along either a single joint plane or the line of intersection of two planes. A similar pattern was observed for block JP 011, which was stable in 4.77% of realizations; in these cases, this block transitioned to a floor block. This behavior was also noted for block JP 100. At higher concentrations (kf = 100), the failure modes exhibited little variation. For example, the floor block (JP 000) remained stable in 99.97% of simulations, while in 0.03% of simulations, the block failed along the intersection line of planes 1 and 2.
Notably, there was no variability in the failure mode of the roof block in both scenarios, i.e., it remained an unstable roof block across all simulations.
4.2 Reinforced roof wedge
The wedge located at the excavation roof, as shown in Tables 2 and 3, has a safety factor equal to zero and a 100% failure probability (Table 4). This condition indicates imminent instability since the system lacks sufficient resistance capacity to counterbalance the acting forces. For roof wedges under self-weight, Stillborg (1994) recommended safety factor values in the range of 2 ≤ FS < 5 in deterministic analyses, depending on the geomechanical conditions and the type of reinforcement applied.
The reinforcement analysis considered four distinct scenarios where the mean reinforcement capacity equals 1, 2, 3, and 4 times the wedge weight (W). In each scenario, the effect of progressive increase in support capacity on system stability was evaluated. Reinforcement was treated as a random variable following a normal distribution, thereby incorporating uncertainty associated with in-situ performance. A variation coefficient of 4% was adopted, consistent with data reported by Hoek et al. (1995). Table 7 presents the mean safety factor (E[FS]), failure probability (Pf), and reliability index computed by BTRAV1. For UnWedge, only the mean safety factor (E[FS]) and failure probability (Pf) are reported.
In BTRAV1, when the reinforcement equals the wedge weight (R = W), the system exhibits a mean safety factor E[FS] = 1.136, and a high failure probability Pf = 0.471, resulting in an extremely low reliability index β = 0.072. This characterizes unacceptable design condition. By increasing reinforcement to twice the weight (R = 2·W), the failure probability is reduced to Pf = 0.024 and the reliability index increases to β = 1.983, corresponding to a moderate safety level. For reinforcement equal to three times the wedge weight (R = 3·W), the reliability index increases to β = 3.156, while the mean safety factor reaches E[FS] = 3.411, indicating a safe state. Lastly, with reinforcement equal to four times the wedge weight (R = 4·W), the reliability index reaches β = 3.719 with Pf = 0.0001, characterizing a highly reliable condition.
Conversely, the results obtained with UnWedge exhibited a similar evolution of the mean safety factor (E[FS]) as the reinforcement level increases. The estimated failure probabilities (Pf ) are also coherent, since Pf consistently decreased with increasing reinforcement. Given this strong agreement, the BTRAV1 results for reinforced wedges can be considered validated.
Based on the probabilistic analysis and the computed reliability index, applying reinforcement equal to three times the wedge weight (R = 3·W) is sufficient to stabilize the block, departing from the purely deterministic recommendations of Stillborg (1994).
5. Conclusions
Deterministic results showed agreement between the factors of safety calculated by BTRAV1 and UnWedge, validating BTRAV1 as a reliable tool for this type of analysis. Within the probabilistic framework, the failure probabilities were also found to be equivalent, thereby reinforcing the robustness of the implemented method.
The analysis of the safety factor histograms confirmed the validity of the implementation, as the distributions produced by BTRAV1 exhibited shapes and statistics that were virtually identical to those generated by UnWedge. In some cases, the safety factor was well represented by a lognormal probability distribution. This agreement strengthens the reliability of BTRAV1 as a decision-support tool for block stability analyses in underground excavations.
For the design of block stabilization in underground excavations, the reliability index value for β ≥ 3 suggested in some international standards has been confirmed as an adequate reference for safety criterion.
Complementarily, the scenario analysis with varying reinforcement levels revealed a strong correlation between the intensity of support applied to a falling roof wedge and the reliability index. At low reinforcement levels (i.e., reinforcement equal to the wedge weight), the reliability index values remained near zero, indicating marginal stability conditions and a high failure probability. As reinforcement was increased to two, three, and four times the wedge weight, the reliability index progressively rose, reaching values consistent with safe design according to international criteria.
BTRAV1 offers a significant advantage over UnWedge: in addition to accurately reproducing deterministic and probabilistic results, it allows one to directly calculate the reliability index. Given its versatility, it is also possible to quantify variability in block failure modes as a function of dispersion in joint orientations. This functionality substantially expands the analytical potential tool, enabling a quantitative appraisal of safety levels and comparisons against international code-based criteria.
Acknowledgments
The authors thank Dr. Zheng Jun of Zhejiang University (China) for sharing a copy of the MCSDO_OPEN program.
-
Funding information
This study was financed in part by the Coordenação de Aperfeiçoamento de Pessoal de Nível Superior - Brasil (CAPES).
Data availability
Datasets related to this article and BTRAV1 code will be available upon request to the corresponding author.
References
- BECK, A. T. Confiabilidade e segurança das estruturas. Florianópolis: Orsa Maggiore, 2024. 492p.
- BLANK, L. T. Statistical procedures for engineering, management, and science. New York: McGraw-Hill Book Company, 1980. 680p.
- CELESTINO, T. B.; DINIZ, N. C. Informática. In: OLIVEIRA, A. M. S.; BRITO, S. N. A. (ed.) Geologia de engenharia. São Paulo: Associação Brasileira de Geologia de Engenharia, 1998. 587 p. cap. 14, p. 227-241.
- CHAN, L. -Y. Application of block theory and simulation techniques to optimum design of rock excavations. Tese (PhD) - University of California, Berkeley, 1987.
- CHEN, G. Probabilistic keyblock analysis of a mine ventilation shaft stability - a case study. Geomechanics and Geoengineering: an International Journal, v. 7, n. 4, p. 252-262, 2012.
- COMITÉ EUROPÉEN DE NORMALISATION. CEN. EN 1997-1:2004: Eurocode 7- Geotechnical design. Part 1: general rules. Brussels. 2004.
- CHRISTIAN, J. T.; LADD, C. C.; BAECHER, G. B. Reliability applied to slope stability analysis. Journal of Geotechnical Engineering, v. 120, n. 12, p. 2180-2207, 1994.
- DUNCAN, J. M.; WRIGHT, S. G.; BRANDON, T. L. Soil strength and slope stability. New Jersey: John Wiley & Sons, 2014, 317p.
- FIORI, A. P. Fundamentos de mecânica dos solos e das rochas: aplicações na estabilidade de taludes. São Paulo: Oficina de Textos, 2015. 576p.
- FISHER, N. I.; LEWIS, T.; EMBLETON, B. J. J. Statistical analysis of spherical data. New York: Cambridge University Press, 1987. 329 p.
- FISHER, R. Dispersion on a sphere. Proceedings of the Royal Society of London. Series A, Mathematical and Physical Sciences, v. 217, n. 1130, p. 295-305, 1953.
- GOODMAN, R. E. Introduction to rock mechanics. 2. ed.. New York: Willey, 1989. 562p.
- GOODMAN, R. E.; SHI, G. -H. Block theory and its applications to rock engineering. Englewood Cliffs: Prentice-Hall, 1985. 338p.
- HOEK, E.; BROWN, E. T. Underground excavations in rock. London: Institution of Mining and Metallurgy, 1980. 527p.
- HOEK, E.; KAISER, P. K.; BAWDEN, W. F. Support of underground excavations in hard rock.Rotterdam: Balkema. 1995. 215p.
- HOERGER, S. F.; YOUNG, D. S. Probabilistic prediction of keyblock occurrences. In: U.S. SYMPOSIUM ON ROCK MECHANICS, 31., Golden, 1990. Proceedings [...]. Rotterdam: Balkema, 1990, p. 229-236.
- HWANG, J. -Y.; SATO, M.; OHNISHI, Y. Coupling key block analysis using stochastic-deterministic method in discontinuous rock masses. Journal of Applied Mechanics, v. 8, p. 609-616, 2005.
- JAKUBOWSKI, J. The stochastic block stability simulation method and other probabilistic extensions of block theory. Archives of Mining Sciences, v. 56, n.2, p. 223-238, 2011.
- JIMENEZ-RODRIGUEZ, R.; SITAR N. A spectral method for clustering of rock discontinuity sets. International Journal of Rock Mechanics & Mining Sciences, n. 43, n. 7, p. 1052-1061, 2006.
- JOINT COMMITTEE ON STRUCTURAL SAFETY. Probabilistic model code - Part I - Basis of design, 12th draft. Zurich, Switzerland. 2001.
- KLEN, A. M. Algoritmo para agrupamento de descontinuidades em famílias baseado no método fuzzy k-means. Tese (Doutorado) - Universidade Federal de Ouro Preto, Ouro Preto, 2015.
- KLEN, A. M.; LANA, M. S. Fuzzy Algorithm of discontinuity sets. REM: Revista Escola de Minas, v. 67, n. 4, p. 439-445, 2014.
- KUSZMAUL, J. S. Estimating keyblock sizes in underground excavations: accounting for joint set spacing. International Journal of Rock Mechanics and Mining Sciences, v. 36, n. 2, p. 217-232, 1999.
- LI, B. The stability of wedges formed by three intersecting discontinuities in the rock surrounding underground excavations. Tese (PhD) - University of Toronto, Toronto, 1991.
- MEDINACELI-TORREZ, R.; LINS, P. G. C.; CELESTINO, T. B. Geração estocástica de orientação de descontinuidades conforme a distribuição de Fisher. In: SIMPÓSIO BRASILEIRO DE MECÂNICA DAS ROCHAS, 10., Balneário Camboriú, 2024. Anais[...]. Balneário Camboriú: ABMS, 2024.
- MELCHERS, R. E.; BECK, A. T. Structural reliability analysis and prediction. 3. ed. Chichester: John Wiley & Sons, 2018.
- ROCSCIENCE. UnWedge - underground wedge stability analysis. Version 5.0. Toronto, Ontario, Canada. 2025.
- RUSILO, L. C. Aplicação da lógica paraconsistente à análise da estabilidade de estruturas em rochas. Tese (Doutorado) - Universidade de São Paulo, São Paulo, 2003.
- SHANLEY, R. J.; MAHTAB, M. A. Delineation and analysis of cluster orientation data. Mathematical Geology, v. 8, n. 1, p. 9-16, 1976.
-
SHI, G. -H. Block theory, 2015. Disponível em: https://www.ddamm.org/wiki/Block_Theory Acesso em: 15 ago. 2025.
» https://www.ddamm.org/wiki/Block_Theory - STILLBORG, B. Professional users handbook for rock bolting. 2. ed. Clausthal-Zellerfeld: Trans Tech Publications, 1994. 164p.
- STONE, C. A.; KUSZMAUL, J. S.; BOONTUN, A.; YOUNG, D. Comparison of an analytical and numerical approach to probabilistic keyblock analysis. In: NORTH AMERICAN ROCK MECHANICS SYMPOSIUM, 2., Montreal, 1996. Proceedings [...]. Rotterdam: Balkema, 1996, p. 1769-1775.
- U.S. ARMY CORPS OF ENGINEERS. ETL 1110-2-547: introduction to probability and reliability methods for use in geotechnical engineering. Washington, DC. 1997.
- ZHENG, J.; DENG, J.; YANG, X.; WEI, J.; ZHENG, H.; CUI, Y. An improved Monte Carlo simulation method for discontinuity orientations based on Fisher distribution and its program implementation. Computers and Geotechnics, v. 61, p. 266-276, 2014.
Edited by
-
Associate Editor
Diogo Rodrigo Ferreira Ribeiro