
 Characterization and agronomic performance of Setaria italica lines as an alternative crop
ABSTRACT
This study aimed to evaluate the agronomic performance of Setaria italica lines to support the development and future release of productive and well-adapted cultivars. The experiments were conducted in 2023 and 2024 at the Regional University of the Northwest of Rio Grande do Sul, Brazil. Climatic variables were obtained from the NASA POWER system using the EnvRtype package. Agronomic traits related to plant architecture, development, and yield were measured. The results revealed wide genetic variability and good adaptability among the lines. Stem diameter, number of internodes, and panicle length were positively associated with grain yield, indicating their usefulness for indirect selection. Lines L7, L11, and L14 showed superior overall performance, while the control and the original population exhibited greater stability but lower trait expression. These findings confirm the agronomic potential of Setaria italica as an alternative crop, particularly due to its resilience, short growth cycle, and nutritional value.
Keywords
adaptability; variability; sustainability
INTRODUCTION
Setaria italica has gained prominence as a crop of wide edaphoclimatic amplitude and high socioeconomic relevance, particularly in semi-arid regions, owing to its short vegetative cycle and marked tolerance to water deficit. These traits allow cultivation in marginal and low-fertility areas, contributing to food security in production systems with limited resource availability.1,2 The species also combines satisfactory grain and forage yield with low environmental impact, which makes it a viable alternative for both human consumption and animal nutrition.2
This agronomic versatility has evolutionary and physiological foundations. Domesticated more than 11,000 years ago in northern China from Setaria viridis, Setaria italica combines high water use efficiency, C4 photosynthetic metabolism, and a compact genome, characteristics that consolidate it as a model species for genetic and physiological studies in grasses of agricultural importance.3 Its capacity to develop under contrasting conditions further supports its use in cropping systems exposed to increasing climatic variability.1
From a nutritional standpoint, the species differs from other cereals in its higher content of protein, dietary fiber, minerals, and bioactive compounds, attributes associated with elevated nutritional value and functional potential.4,5 Grain consumption has been linked to healthier diets with a lower environmental footprint, which reinforces the strategic role of the crop in human nutrition worldwide.6
Despite these agronomic and nutritional attributes, studies that jointly address the morpho-agronomic characterization and the adaptability of S. italica across different cultivation environments remain scarce, which limits the identification of superior genotypes adjusted to local conditions.7
In this context, the present study aims to evaluate the agronomic performance of Setaria italica lines, providing support for the development and future release of more productive and adapted cultivars, contributing to the diversification and sustainability of agricultural systems.
MATERIAL AND METHODS
The study was conducted in the experimental area of the Regional University of the Northwest of the State of Rio Grande do Sul in 2023 and 2024, located in the municipality of Ijuí (28º23’36”S, 53º56’39”W), at an altitude of 304 m, in the state of Rio Grande do Sul. The soil in the area is classified as a typical dystrophic Red Latosol.8 The climate is characterized as Cfa (humid subtropical), according to the Köppen classification.9
Satellite data on mean air temperature (Tmean, °C), minimum air temperature (Tmin, °C), maximum air temperature (Tmax, °C), and precipitation (Prec, mm) were obtained from the NASA POWER system10 using the EnvRtype package.11
The experimental design used was a randomized complete block design (RCBD), consisting of 14 treatments, two of which were controls (a commercial variety and an original population) and 12 lines selected from a large population originating from the municipalities of Porto Lucena, São Luiz Gonzaga, and São Borja, in the state of Rio Grande do Sul. The plots were broadcast sown in areas of 5 × 6 meters, totaling 30 m² per plot.
The experiment was conducted in three periods, starting in the first half of August 2023, with harvesting on October 7, 2023, totaling a 91-day cycle; the second period, sown on October 30, 2023, with harvesting on January 20, 2024, resulting in a total cycle of 83 days; and the last period, sown on February 18, 2024, with subsequent harvesting on May 4, 2024, totaling a cycle of 75 days. This strategy made it possible to compare the performance of the populations under different growing conditions, evaluating their adaptability, productivity, phenotypic stability, and productive potential (seeds, biomass, and protein content) in the different environments.
During the experiment, preventive measures were adopted to minimize abiotic and biotic stresses. Considering the high sensitivity of the plants and the strong tendency towards shattering, the first panicles to flower were previously protected. The harvest of each genotype was carried out at the beginning of physiological maturity, the phase in which the grains reach maximum dry matter accumulation and present the lowest risk of losses. The panicles corresponding to each genetic material were collected manually, placed in individual bags and properly identified, ensuring the separation and traceability of the samples. Subsequently, the material was sent to the oven for drying, ensuring the reduction of moisture and the preservation of seed quality for the subsequent stages of the experiment.
The quantitative variables measured were: Number of initial tillers (NIT, unit), stem length (SL, cm), stem diameter (SD, mm), number of elongated internodes (NEI, unit), flag leaf length (FLL, cm), flag leaf width (FLW, cm), peduncle length (PED, cm), panicle length (PAN, cm), cycle to emergence (CTE, days), and thousand-grain weight (TGW, grams). The qualitative variables evaluated are presented in Table 1.
Qualitative variables evaluated in Setaria italica genotypes, with abbreviations and scoring classes
The data obtained were subjected to analysis and outlier removal. Subsequently, a descriptive analysis of the means of each quantitative variable was performed. In the next step, multivariate statistical techniques were applied for the joint analysis of quantitative and qualitative variables. For this, Spearman's correlation was used, with the significance of the coefficients tested by the t-test at a 5% probability level, based on the Student's t-distribution. The genetic dissimilarity dendrogram was obtained using the UPGMA (Unweighted Pair Group Method with Arithmetic Mean), with the group cutoff point defined manually. Principal component analysis (PCA) was employed to reduce the dimensionality of the data and identify associations between the variables and the evaluated genotypes. Subsequently, the k-means clustering method was used to group the genotypes into k clusters. Finally, the Kohonen Self-Organizing Map (SOM) was applied, which performs the unsupervised clustering of genotypes. These analyses aimed to identify patterns of variability, similarity relationships between genotypes, and potential clusters of interest for crop breeding. All analyses were performed using R software.12
RESULTS AND DISCUSSION
Comparing the years of the trial (2023 and 2024), it was found that the mean air temperature in January 2023 was higher, reaching approximately 30 °C, while in 2024 there was a reduction, with the maximum mean temperature recorded in February, around 28 °C (Figure 1a). The absolute maximum temperatures were also higher in 2023, reaching 39 °C in January, representing a difference of approximately 5 °C compared to 2024 (Figure 1b). The minimum air temperature (Figure 1c) was −0.6 °C in June 2024, while in 2023 the minimum recorded was 0 °C. Both years therefore remained close to the thermal range considered ideal for Setaria italica, between 24 °C and 29 °C.13 Regarding rainfall (Figure 1d), the highest accumulation in 2024 was observed in the month of May, with approximately 400 mm, a value higher than that recorded in 2023, whose peak occurred in October, with about 380 mm.

Meteorological conditions observed during the cycle, composed of: a) Mean air temperature (°C); b) Maximum air temperature (°C); c) Minimum air temperature (°C) and d) Precipitation (mm) for the months of January, February, March, April, May, June, July, August, September, October, November, December of 2023 and 2024.
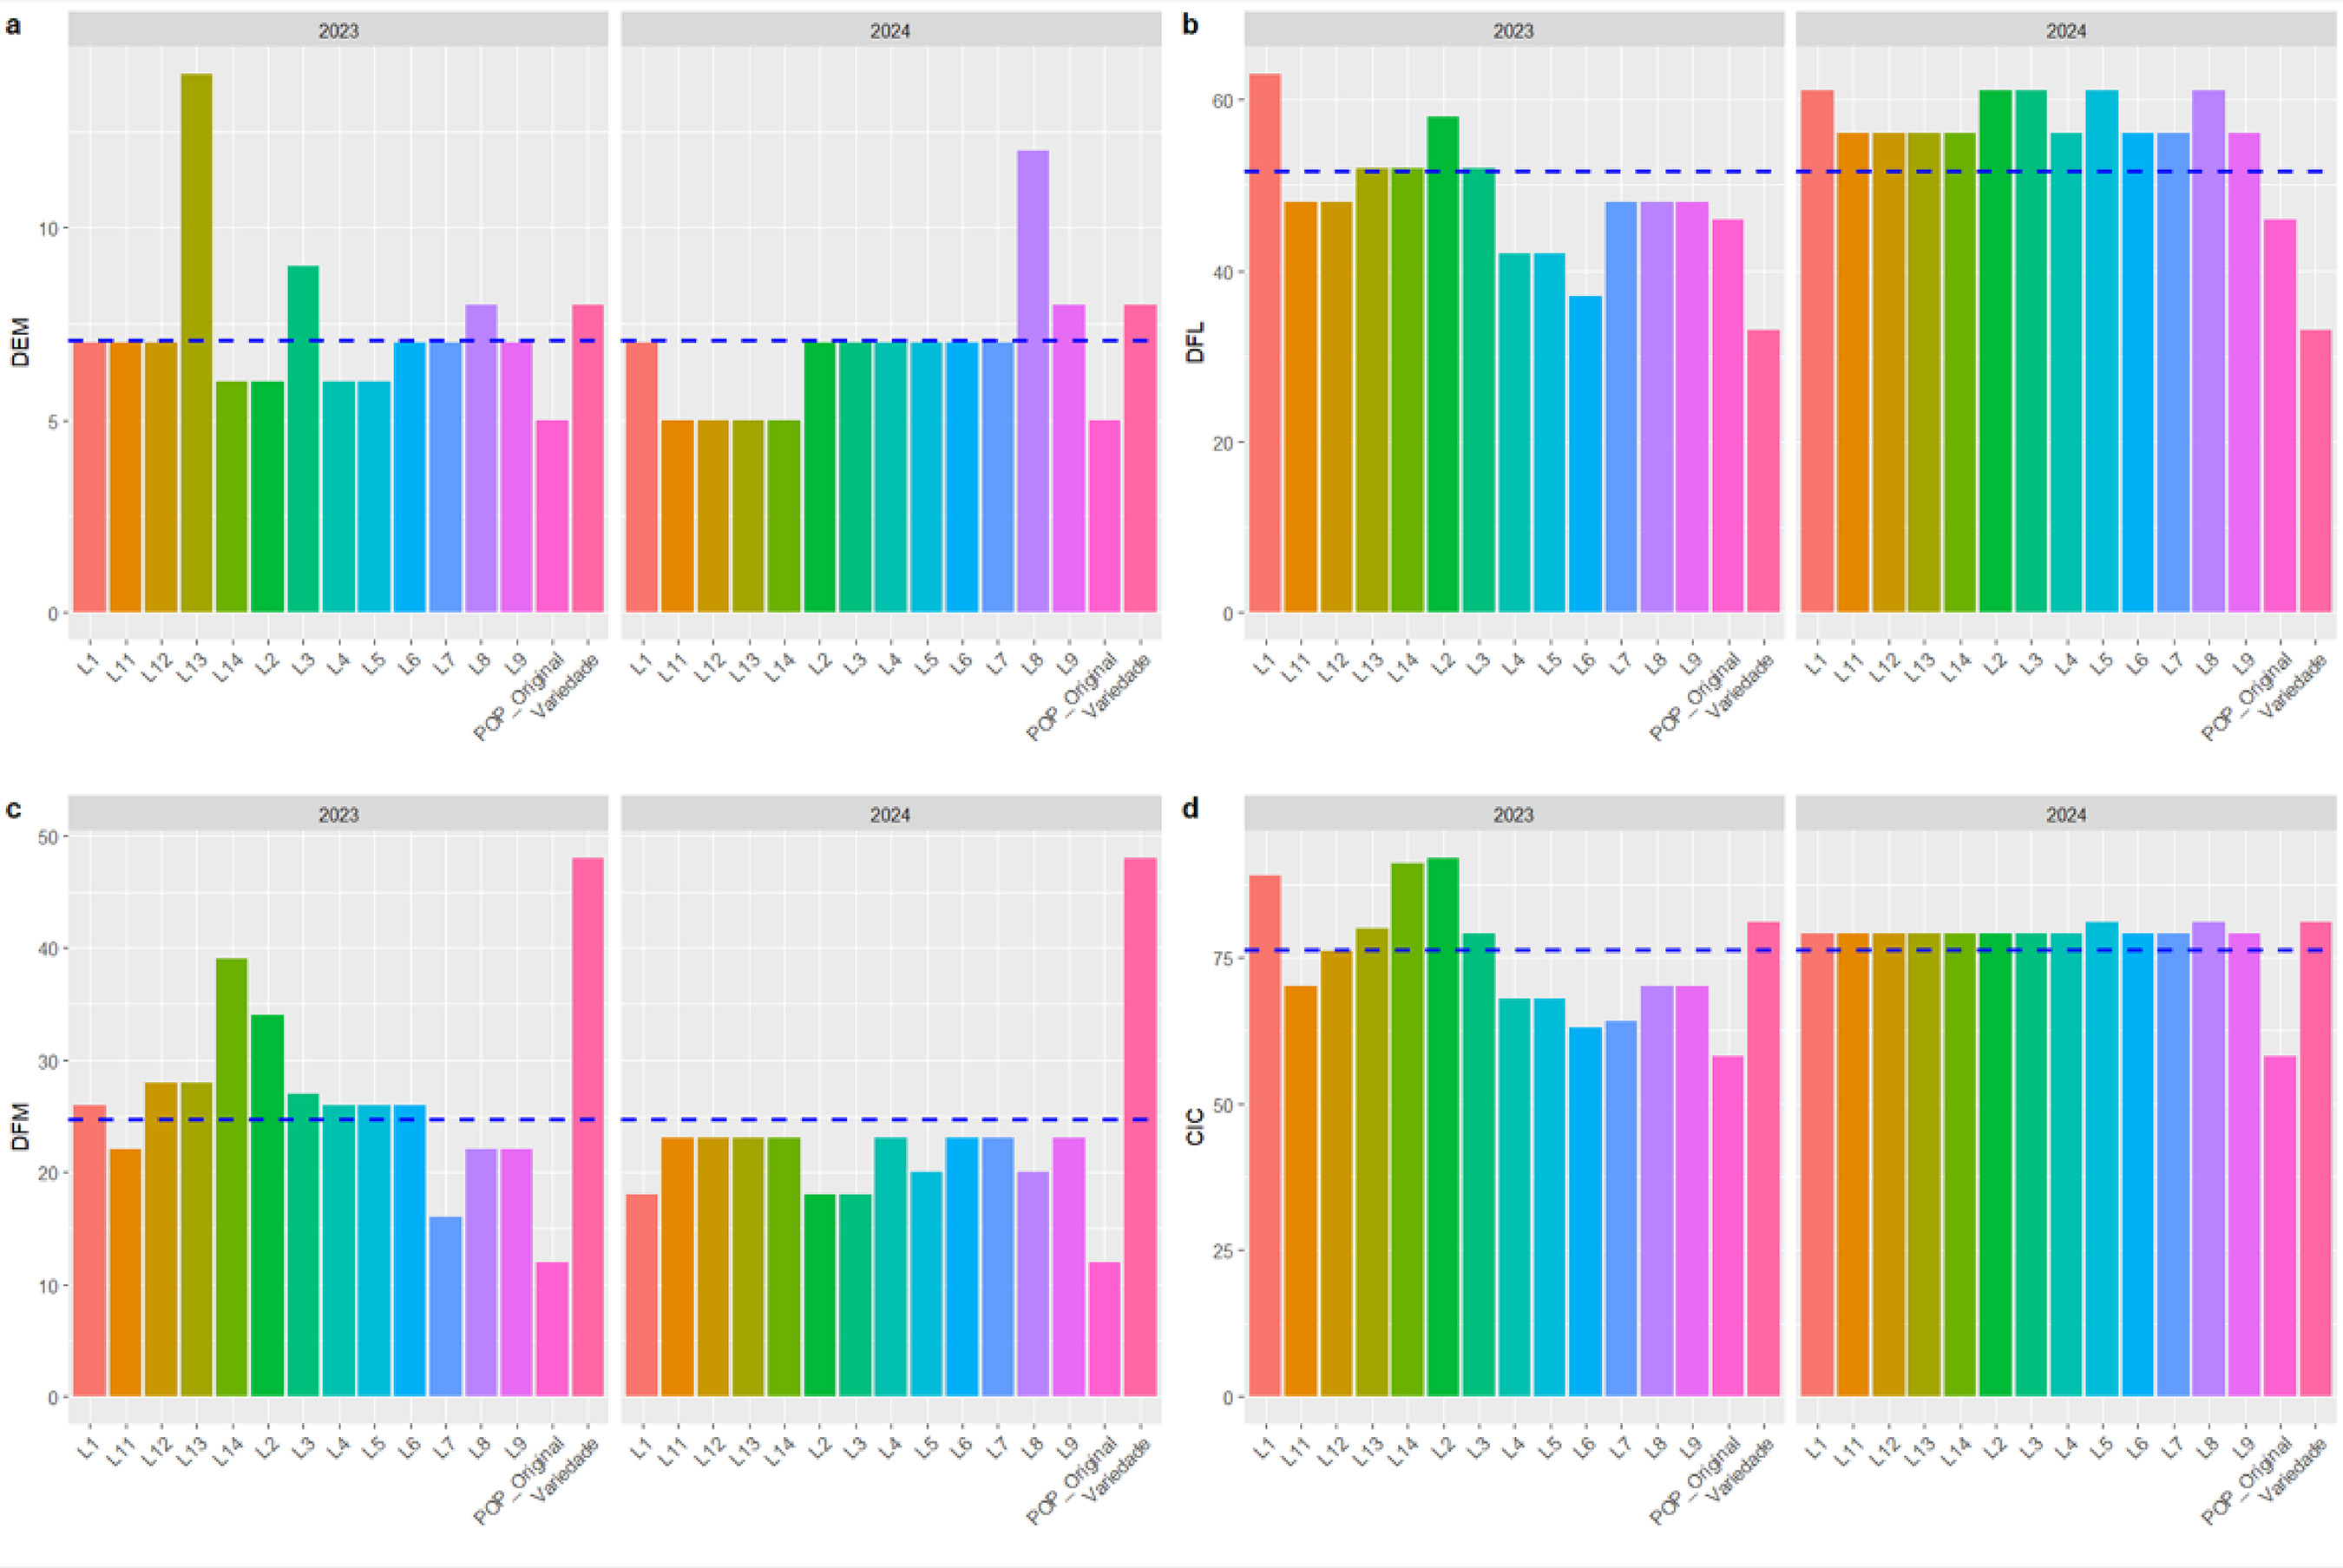
For the variable days to emergence (DEM), most lines, in the years 2023 and 2024, showed emergence approximately one week after sowing (Figure 2a). However, in 2023, punctual variations were observed, highlighting the L13 line, which required about two weeks to emerge. In 2024, the L8 line showed a delay of approximately five days compared to the others. These variations may be related to the differential response of the genotypes to environmental conditions, considering that the crop has high resilience to abiotic stresses, such as low water availability and high temperatures.14
Regarding days to flowering (DFL), in 2023 the L1 line showed the latest flowering, exceeding 60 days after emergence (Figure 2b), while the control exhibited early flowering, around 35 days. In 2024, lines L1, L2, L3, L5, and L8 again stood out for their late flowering, with values exceeding 60 days, while the control maintained a reduced cycle, with flowering close to 35 days. These results corroborate the literature, which indicates that flowering of Setaria italica generally occurs between 35 and 60 days after emergence.15 As for days between flowering and maturity (DFM), in both years evaluated (2023 and 2024), the control presented the longest periods, close to 50 days (Figure 2c). In contrast, the original population was characterized by greater precocity, with an approximate interval of 10 days between flowering and maturation.
For the complete cycle (CYC), measured from sowing to maturity, in the 2023 crop season, lines L2 and L14 showed the longest periods, exceeding 90 days (Figure 2d), while the original population completed the cycle prematurely, with a duration of less than 60 days. In 2024, lines L5 and L8 showed the longest cycles, exceeding 80 days, and, again, the original population stood out as the earliest among the materials evaluated.

Quantitative descriptive analysis of the data: a) days until emergence (DEM, days), b) days to flowering (DFL, days), c) days between flowering and maturity (DFM, days), and d) complete cycle (CYC, days) for the variables lines L1, L2, L3, L5, L8, L14, original population, and the control in the years 2023 and 2024.
Regarding stem length (SL), in the 2023 crop season, line L14 stood out compared to the others (Figure 3a), indicating greater potential for vegetative growth, a characteristic commonly associated with initial vigor and biomass accumulation.15 Additionally, lines L4, L5, L6, L7, and L11 showed values above the mean, demonstrating promising performance for this trait. The other lines, as well as the control, remained below mean, reflecting lower stem length expression. In 2024, lines L1, L4, L6, L7, L8, L9, L11, and L14 exceeded the mean, while the others showed inferior performance. This pattern indicates a strong influence of environmental conditions on trait expression. The control and the original population, in contrast, showed greater stability, without significant variations between the years evaluated.16
Stem diameter (SD) was highest in line L8 in 2023, with values greater than 2 cm (Figure 3b), demonstrating greater structural robustness compared to the others. In 2024, a general improvement in performance was observed, with most lines exceeding the mean of the control, with L7 and L14 standing out, presenting diameters greater than 3 cm. High stem diameter values are associated with greater mechanical resistance of the plants, contributing to the reduction of lodging and, consequently, to the increase in yield.17
In 2023, lines L1, L2, L3, L7, L9, L11, L12, and L13, as well as the original population, showed the highest number of internodes (NI) (Figure 3c), all greater than four internodes, characterizing greater stem elongation. In 2024, only the original population maintained above-mean performance, standing out in relation to the lines and the control, which showed similar behavior between the years. The stability of the control at reduced levels reinforces its limitation for this trait, considering that internode development is strongly influenced by environmental and genotypic factors.16
In 2023, leaf blade length (LBL) was greater in lines L1, L2, L3, L5, L11, L12, and L13, along with the original population and the control, which showed values above the mean (Figure 3d), indicating greater leaf development. In 2024, the original population and the control maintained stable performance, accompanied by lines L1, L2, L5, L7, L11, L13, and L14, which also reached or exceeded the mean. This behavior suggests greater stability of this trait among the evaluated genotypes, although some variations persist.
In general, the results indicate that lines L7, L11, and L14 showed superior and consistent performance in different morphological traits, such as stem length and diameter and leaf blade length, suggesting greater productive potential and adaptability. In contrast, the control and the original population exhibited more stable behavior, but with inferior performance in certain attributes, which limits their competitiveness compared to the improved lines. These results reinforce the importance of the integrated evaluation of morphological traits in the selection of genotypes with greater agronomic potential, as widely discussed in the literature on breeding species of the genus Setaria.15

Quantitative descriptive analysis of the data: a) stem length (SL, cm), b) stem diameter (SD, mm), c) number of internodes (NI, unit) and d) blade length (LBL, cm) for the variables lines L1, L2, L3, L4, L5, L6, L7, L8, L11, L12, L13, L14, original population and the control, during the years 2023 and 2024.
In 2023, most lines showed leaf blade width (LBW) values above the mean, close to 2 cm (Figure 4a), with the exception of lines L14 and L6 and the original population, which showed lower values. In 2024, the control maintained superior performance, along with most lines, while only L11, L6, L8 and the original population remained below the mean. No significant variations were observed between the years for the control and the original population, indicating greater stability of this trait. These results corroborate the combined influence of genotypic and environmental effects on the expression of leaf width.17
Peduncle length (PED) was superior in most lines in 2023 (Figure 4b), with the exception of lines L14 and L4, as well as the original population and the control, which presented values below the mean. In 2024, a generalized reduction in this trait was observed, with the original population approaching the mean and an absence of genotypes with superior performance, highlighting the strong influence of environmental conditions on this characteristic, as described in the literature.15
Panicle length (PAN) followed the same trend in 2023, with most lines showing values above the mean (Figure 4c), while the original population, the control, and lines L6, L4, and L14 remained below the mean. However, in 2024 no genotype stood out for this trait, indicating high environmental sensitivity, possibly related to nutrient availability and photoperiod.16
For the number of grains per plant (NGP), no significant differences were observed between genotypes in 2023 (Figure 4d). In contrast, in 2024 several lines exceeded the overall mean, while the original population, the control, and the L5 and L3 lines showed lower values. This behavior reinforces the importance of the genotype × environment interaction in determining this trait, especially under thermal variations during the flowering period.15
Thousand-grain weight (TGW) in 2023 was lower in lines L14 and L6 and in the control than in the other genotypes (Figure 4e). In 2024 the trait improved overall, with several lines reaching or exceeding the mean, with only line L4 and the original population remaining below mean. Taken together, panicle and peduncle traits declined in 2024, whereas grain traits (NGP and TGW) improved, indicating that reproductive traits were more responsive to the growing season than vegetative ones.

Quantitative descriptive analysis of the data: a) blade width (LBW, cm), b) peduncle length (PED, cm), c) panicle length (PAN, cm), d) number of grains per plant (NGP, unit) and e) thousand-grain weight (TGW, grams) for the variables lines L1, L2, L3, L4, L5, L6, L7, L8, L11, L12, L13, L14, original population and the control during the years 2023 and 2024.
Spearman's correlation analysis (Figure 5) revealed significant associations between morphological and productive traits. A strong correlation was found between stem diameter (SD), number of grains per plant (NGP), and grain color (GCO), indicating that plants with thicker stems tend to have higher productive capacity and greater physiological vigor. The thousand-grain weight (TGW) also showed a significant correlation with grain shape (GSH) and grain color (GCO), suggesting that easily evaluated morphological and visual traits can be used as indirect indicators of productive potential. Associations between visual attributes and yield have been widely described in cultivated grasses, reinforcing their applicability in the initial stages of genotype selection.15
Additionally, panicle length showed a positive correlation with vegetative traits such as the number of internodes, peduncle length, and stem length, indicating that plants with greater vegetative vigor tend to develop more robust reproductive structures. The number of elongated internodes was also positively associated with thousand-grain weight and panicle length, highlighting the close relationship between plant architecture and reproductive performance, an aspect widely discussed for Setaria italica.17 In general, the observed correlations indicate that vegetative traits that are easily measured in the field, such as stem diameter and length and the number of internodes, can be used as indirect criteria in the selection of genotypes with greater productive potential. This approach is widely recommended in genetic improvement programs, as it reduces costs and experimental time while increasing the efficiency of the selection process.18

Spearman correlation for the measured variables: unpolished grain color (UGC, score), stem diameter (SD, mm), number of grains per plant (NGP, unit), grain color (GCO, score), thousand-grain weight (TGW, grams), grain shape (GSH, score), panicle length (PAN, cm), number of internodes (NI, unit), peduncle length (PED, cm), foliage green color intensity (FGI, score), number of elongated internodes (NEI, unit) and stem length (SL, cm).
The genetic dissimilarity dendrogram (Figure 6) showed the formation of three main clusters among the evaluated genotypes. The first cluster included the original population, the L6 line, and the control, characterized by greater similarity in stem length, indicating less variability for this trait and, consequently, less potential for differentiation. The second cluster was composed of the L1, L2, L13, and L14 lines, which presented a low number of elongated internodes, characterizing a more compact plant architecture. This group may be of interest in situations that demand smaller plants or greater precocity, especially under risk of lodging.19
The third grouping included lines L3, L4, L5, L7, L8, L9, L11, and L12, showing greater internal variability and intermediate values for stem length. This diversity indicates potential for selecting genotypes adapted to both biomass and grain production, as well as favoring genetic recombination strategies.20 In general, the divergence observed between the groups represents a relevant opportunity for breeding, since the choice of parents belonging to different groups tends to maximize genetic recombination and increase variability in subsequent generations.21

Dendrogram of genetic dissimilarity of long stem length (SL), number of elongated internodes (NEI), mean stem length (SL), with the variables line L1, L2, L3, L4, L5, L6, L7, L8, L9, L11, L12, L13, L14, original population and control.
The interpretation of the biplot from the principal component analysis (Figure 7) was based on the proximity between the variable vectors and the genotypes, indicating greater affinity between them. The analysis revealed specific associations between some populations and morpho-agronomic traits, such as the proximity between grain shape and the original population, the cycle with the L1 line, the blade width with the L2 line, and the days to emergence with the L11 line. Furthermore, plant architecture characteristics, such as stem diameter, panicle length, and stem length, showed greater affinity with lines like L8, L12, and L4, indicating intermediate performance for these traits.
In general, the biplot allowed the identification of genotypes with a greater association to certain attributes, assisting in the targeted selection of materials according to specific breeding objectives. The use of principal component analysis has proven to be an efficient tool in the joint evaluation of genotypes and morpho-agronomic traits, supporting more assertive decisions in breeding programs.22

Biplot principal component analysis of the grain shape (GSH, grade), cycle (CYC), blade width (LBW, cm), emergence days (DEM, days), stem diameter (SD, mm), panicle length (PAN, cm) and stem length (SL, cm) data for the lineage variables L1, L2, L4, L8, L11, L12 and the original population.
In the K-Means cluster analysis (Figure 8), lines L3, L4, L5, L7, L8, L9, L11, and L12 were grouped due to their similarity, mainly in relation to the mean stem length (SL). This grouping shows partial convergence with the dendrogram, since both identified the proximity between genotypes with stems of intermediate length. However, K-Means evidenced the separation of the groups more clearly, since it considers not only hierarchical similarity but also the distribution of the data in multivariate space. This behavior is characteristic of the method in analyses with continuous variables.23
Lines L1, L2, L13, and L14 remained grouped, confirming the pattern observed in the dendrogram, associated with low values of number of elongated internode (NEI) and thousand-grain weight (TGW). In turn, the original population and the control formed a distinct grouping, characterized mainly by the association with greater foliage green color intensity (FGI).

K-means cluster analysis of the components mean stem length (SL), number of elongated internodes (NEI), thousand-grain weight (TGW), and foliage green color dark intensity (FGI) for the variables Lineage L1, L2, L3, L4, L5, L7, L8, L9, L11, L12, L13, L14, Original Population, and Control.
Analysis of Kohonen's self-organizing map reveals distinct clustering patterns among the genotypes. In Figure 9a, the most striking differences are associated with leaf blade size (LBS) and foliage green intensity (FGI), highlighting the control and the original population in relation to the other genotypes. In contrast, Figure 9b shows greater balance and mixing among the groups, with a greater influence from thousand-grain weight (TGW), emergence days (DEM), and panicle length (PAN).
Consistently, genotypes L1, L2, L13, and L14 tend to remain grouped in the different representations, while lineage L6, isolated in Figure 9a, begins to group with other genotypes in Figures 9b and 9c. In Figure 9c, the formation of a more concentrated main group is also observed, highlighting the blade length (LBL), further reinforcing the proximity between the control and the original population. These patterns confirm the efficiency of Kohonen maps in organizing and visualizing complex relationships between phenotypic characteristics of distinct genotypes, as described by Kohonen.24

Analysis of the Kohonen map of the components: a) blade size (LBS), leaf color interaction (FGI); b) thousand grains (TGW), days of emergence (DEM), panicle length (PAN) and c) blade length (LBL) for the variables Lineage L1, L2, L6, L13, L14, control and the original population.
Overall, the study demonstrated that Setaria italica exhibits wide genetic variability and good adaptability, highlighting its agronomic potential for different cropping systems. Traits such as stem diameter, number of internodes, and panicle length showed a direct correlation with grain yield, proving to be efficient indicators for indirect selection in genetic improvement programs. Lines L7, L11, and L14 stood out for their better overall performance, while the control and the original population showed more stable behavior, but with lower expression for some traits. Thus, the results reinforce the potential of Setaria italica as an alternative crop, especially due to its hardiness, relatively short cycle, and nutritional value, desirable characteristics in sustainable agricultural systems.
CONCLUSION
The Setaria italica crop has agronomic potential and wide genetic variability among the evaluated lines, an essential aspect for the genetic improvement of the species. Stem diameter, number of internodes, and panicle length correlated with the number and weight of grains, which makes them efficient criteria for indirect selection.
Lines L7, L11, and L14 stand out for their superior performance across several morphological traits and will therefore be considered for the development of the first Brazilian cultivar of this species.
ACKNOWLEDGMENTS, FINANCIAL SUPPORT, AND FULL DISCLOSURE
The authors would like to thank the Coordenação de Aperfeiçoamento de Pessoal de Nível Superior, Brasil (CAPES), for partially financing this study (Finance Code 001).
DATA AVAILABILITY STATEMENT
All datasets supporting the findings of this study are included in this article.
REFERENCES
-
1 Santos R, Neves AL, Pereira LG, Verneque R, Costa CT, Tabosa J, et al. Divergence in agronomic traits and performance of pearl millet cultivars in Brazilian semiarid region. Grassl Sci. 2017;63(2):118-27. https://doi.org/10.1111/grs.12154
» https://doi.org/10.1111/grs.12154 -
2 Muthamilarasan M, Prasad M. Advances in Setaria genomics for genetic improvement of cereals and bioenergy grasses. Theor Appl Genet. 2015;128(1):1-14. https://doi.org/10.1007/s00122-014-2399-3
» https://doi.org/10.1007/s00122-014-2399-3 -
3 Li X, Hou S, Feng M, Xia R, Li J, Tang S, et al. MDSi: multi-omics database for Setaria italica. BMC Plant Biol. 2023;23(1):223. https://doi.org/10.1186/s12870-023-04238-3
» https://doi.org/10.1186/s12870-023-04238-3 -
4 Kalsi R, Bhasin JK. Nutritional exploration of foxtail millet (Setaria italica) in addressing food security and its utilization trends in food system. eFood. 2023;4(5):e111. https://doi.org/10.1002/efd2.111
» https://doi.org/10.1002/efd2.111 -
5 Kheya SA, Talukder SK, Datta P, Yeasmin S, Rashid MH, Hasan AK, et al. Millets: the future crops for the tropics - status, challenges and future prospects. Heliyon. 2023;9(11):e22123. https://doi.org/10.1016/j.heliyon.2023.e22123
» https://doi.org/10.1016/j.heliyon.2023.e22123 -
6 Ardie SW, Nugroho RB, Dirpan A, Anshori MF. Foxtail millet research in supporting climate change resilience efforts: bibliometric analysis and focused literature review. Heliyon. 2025;11(3):e42348. https://doi.org/10.1016/j.heliyon.2025.e42348
» https://doi.org/10.1016/j.heliyon.2025.e42348 -
7 Anand G, Vanniarajan C. Morphological diversity and high-yielding potential of foxtail millet (Setaria italica): Insights from germplasm characterization. Plant Sci Today. 2025;12(3):1-8. https://doi.org/10.14719/pst.6239
» https://doi.org/10.14719/pst.6239 - 8 Santos HG dos, Jacomine PKT, Anjos LHC dos, Oliveira VA de, Lumbreras JF, Coelho MR, et al. Sistema brasileiro de classificação de solos. 6th ed. Brasília, DF: Embrapa; 2025.
-
9 Alvares CA, Stape JL, Sentelhas PC, Gonçalves JLM, Sparovek G. Köppen’s climate classification map for Brazil. Meteorol Z. 2013;22(6):711-28. https://doi.org/10.1127/0941-2948/2013/0507
» https://doi.org/10.1127/0941-2948/2013/0507 -
10 NASA Langley Research Center. Prediction of Worldwide Energy Resources (POWER) Project [Internet]. Hampton: NASA; 2023 [cited 2025 Dec 22]. Available from: https://power.larc.nasa.gov/docs
» https://power.larc.nasa.gov/docs -
11 Costa-Neto G, Galli G, Carvalho HF, Crossa J, Fritsche-Neto R. EnvRtype: a software to interplay enviromics and quantitative genomics in agriculture. G3 (Bethesda). 2021;11(4):jkab040. https://doi.org/10.1093/g3journal/jkab040
» https://doi.org/10.1093/g3journal/jkab040 -
12 R Core Team. R: a language and environment for statistical computing [Internet]. Vienna: R Foundation for Statistical Computing; 2025 [cited 2025 Dec 22]. Available from: https://www.R-project.org/
» https://www.R-project.org/ -
13 Food and Agriculture Organization of the United Nations. Ecocrop database: Setaria italica [Internet]. Rome: FAO; 2020 [cited 2025 Dec 16]. Available from: https://gaez.fao.org/pages/ecocrop
» https://gaez.fao.org/pages/ecocrop -
14 Muthamilarasan M, Dhaka A, Yadav RS, Prasad M. Exploration of millet models for developing nutrient rich graminaceous crops. Plant Sci. 2016;242:89-97. https://doi.org/10.1016/j.plantsci.2015.08.023
» https://doi.org/10.1016/j.plantsci.2015.08.023 -
15 Vetriventhan M, Upadhyaya HD, Dwivedi SL, Pattanashetti SK, Singh SK. Finger and foxtail millets. In: Singh M, Upadhyaya HD, editors. Genetic and genomic resources for grain cereals improvement. London: Academic Press; 2016. p. 291-319. https://doi.org/10.1016/B978-0-12-802000-5.00007-1
» https://doi.org/10.1016/B978-0-12-802000-5.00007-1 -
16 Yang X, Wan Z, Perry L, Lu H, Wang Q, Zhao C, et al. Early millet use in northern China. Proc Natl Acad Sci U S A. 2012;109(10):3726-30. https://doi.org/10.1073/pnas.1115430109
» https://doi.org/10.1073/pnas.1115430109 - 17 Baltensperger DD. Foxtail and proso millet. In: Janick J, editor. Progress in new crops. Alexandria: ASHS Press; 1996. p. 182-90.
-
18 Divya K, Senthil A, Sritharan N, Ravikesavan R, Ashok S, Prabha VV. Morpho-physiological traits influencing the grain yield potential in small millets. Madras Agric J. 2018;105(7-9):476-9. https://doi.org/10.29321/MAJ.2018.000188
» https://doi.org/10.29321/MAJ.2018.000188 - 19 Borém A, Miranda GV, Fritsche-Neto R. Melhoramento de plantas. 8th ed. São Paulo: Oficina de Textos; 2021.
- 20 Hallauer AR, Carena MJ, Miranda Filho JB. Quantitative genetics in maize breeding. New York: Springer; 2010.
- 21 Borém A. Melhoramento de plantas. 7th ed. Viçosa: UFV; 2017.
- 22 Johnson RA, Wichern DW. Applied multivariate statistical analysis. 6th ed. Upper Saddle River: Pearson Prentice Hall; 2007.
-
23 Jain AK. Data clustering: 50 years beyond K-means. Pattern Recognit Lett. 2010;31(8):651-66. https://doi.org/10.1016/j.patrec.2009.09.011
» https://doi.org/10.1016/j.patrec.2009.09.011 - 24 Kohonen T. Self-organizing maps. 3rd ed. Berlin: Springer; 2001.


 Source: Author's own work.
 Source: Author's own work.

 Source: Author's own work.


