Physical properties of wood from Pinus oocarpa and Pinus caribaea var. hondurensis in Bahia
ABSTRACT
The genus Pinus represents one of the main wood groups cultivated in Brazil, used mainly by the lumber, wood panel and pulp and paper sectors. Therefore, knowledge about the quality of wood is the first step for studies on the indication of the best use. The objective of this study was to understand the behavior of the physical properties of wood from Pinus oocarpa and Pinus caribaea var. hondurensis cultivated in the Southwest region of Bahia State, Brazil. Sampling and methodologies for determining moisture content, basic density, contraction and swelling (linear and volumetric) of wood were in accordance with the NBR 7190/97 standards. Anisotropy coefficient was calculated based on the relationship between tangential and radial directions. The data were subjected to descriptive analysis, analyses of variance, t-test and Tukey test at 95% probability level, Model Identity Test at 5% significance level and Principal Component Analysis. The results showed that the maximum moisture content and basic density of wood differ statistically between species and between positions along the trunk, and pointed to a high correlation between these physical properties. Wood swelling and contraction showed statistical differences only between species, while the anisotropy coefficient showed no statistical differences between species or relative positions along the trunk. Multivariate cluster analysis indicated greater homogeneity of wood in terms of physical properties between different positions along the trunk and greater heterogeneity between species.
Keywords:
Technological properties; Basic density; Moisture content; Wood quality.
RESUMO
O gênero Pinus representa um dos principais grupos madeireiros cultivados no Brasil e é utilizado principalmente pelo setor de madeira serrada, painéis de madeira e celulose e papel. Por isso, o conhecimento sobre a qualidade da madeira é o primeiro passo para os estudos sobre a indicação do melhor uso. O objetivo deste trabalho foi conhecer o comportamento das propriedades físicas da madeira de Pinus oocarpa e Pinus caribaea var. hondurensis cultivadas no Sudoeste da Bahia. A amostragem e as metodologias para determinação da umidade, densidade básica, contração e inchamento (lineares e volumétricos) da madeira seguiram as normas NBR 11941. O coeficiente de anisotropia foi calculado com base na relação entre as direções tangencial e radial. Os dados foram submetidos à análise descritiva, ANOVA, teste t e teste Tukey a 95% de probabilidade, teste de identidade de modelos à 5% de significância e análise de componentes principais. Os resultados apontaram que a umidade máxima e a densidade básica da madeira diferem estatisticamente entre espécies e entre posições ao longo do fuste, e uma alta correlação entre essas propriedades físicas. O inchamento e a contração da madeira apresentaram diferenças estatísticas apenas entre espécies, enquanto o coeficiente de anisotropia não mostrou diferenças estatísticas entre espécies ou posições relativas do fuste. A análise multivariada de agrupamento indicou uma maior homogeneidade das madeiras em termos de propriedades físicas entre as diferentes posições do fuste e uma maior heterogeneidade entre as espécies.
Palavras-chave:
Propriedades tecnológicas; Densidade básica; Umidade; Qualidade da madeira.
INTRODUCTION
According to the Brazilian Tree Industry (IBÁ, 2023), Brazil is a world reference in forest productivity, especially with Pine cultivation, reaching approximately 30.9 m3/ha.year-1. The most significant commercial plantations include the genera Eucalyptus and Pinus, the latter of which ranks second among the most cultivated trees in the country, covering about 1.9 million hectares. The Southern Region of Brazil remains the main supplier of Pine wood, representing 89% of the national total, and the state of Paraná occupies the first position in planted area, with 713 thousand hectares.
The Northeast region, especially Bahia, does not have commercial production areas with tropical pine cultivation. Therefore, studies and/or plantations aimed at testing genotypes with adaptations could increase the interest in the cultivation of this species for wood production in the Northeast region and in Brazil, shortening transport distances.
Among the Pinus species cultivated in Brazil, two stand out: Pinus caribaea var. hondurensis, from Belize, Guatemala, Honduras and Nicaragua, characterized by white or yellowish wood, used for resin coating, civil construction and landscaping in general, classified with moderate to low density (LORENZI; BACHER; TORRES, 2018); and Pinus oocarpa, from Central America and Mexico, important for producing wood and resin for commercial purposes, as well as seeds that facilitate its expansion (CALIL NETO et al., 2016).
Wood is a heterogeneous material and has significant et al. (2020), and with a solar day duration of 12 hours, characteristic of the northeast (SILVA et al., 2009), an differences in its technological properties (physical, chemical, anatomical and mechanical) between species, within the same species and even in the same tree (HSING, 2013). Its hygroscopicity is related to this variation and to the chemical composition of the cell wall, which contains substances such as cellulose, hemicelluloses and lignin, responsible for the dimensional instability of the wood. In addition, wood is anisotropic, which means that its technological properties vary according to the three directions of observation (ALBUQUERQUE, 2020; PAULA, 2021), hence requiring accuracy in the evaluation of its quality.
Among the multiple properties of wood, basic density is the most used criterion in the evaluation of its quality, because in addition to requiring simpler instrumentation for its determination, it stands out for its high association with various characteristics of wood and for its association with variables of processes and final products (RAMOS et al., 2024). Basic density and moisture content are important factors in the characterization and use of wood and are highly correlated because wood mass and volume are dependent on moisture, which in turn interacts with the other physical properties of wood (SILVA et al, 2023), in addition to the importance for the most efficient use of wood, as well as the acceptable level of quality for the manufactured product. In addition, knowledge on the behavior of dimensional variations in wood offers technical information on the behavior of the raw material in its industrial use (LOIOLA, 2019).
Based on this scenario, an experimental planting was carried out with the cultivation of two species of Pinus in Southwestern Bahia state, on the campus of the State University of Southwestern Bahia, under a mild climate (average annual temperature of 21 °C), according to Oliveira opportunity for the region, since the existence of a production area close to the places that use wood means a reduction in the cost of acquisition of raw material, in addition to a reduction in transportation time.
Thus, for a species to be used, regardless of its destination, it is extremely important to know its technological characteristics. Therefore, the main objective of this study was to know the behavior of the physical properties of wood from P. oocarpa and P. caribaea cultivated for commercial purposes in Southwestern Bahia, Brazil.
MATERIAL AND METHODS
Experiment location and wood sampling
The experiment was conducted at the Forest Products Technology Laboratory (Woodtech) of the State University of Southwestern Bahia (UESB), on the campus of Vitória da Conquista, Bahia, Brazil. Three P. caribaea trees and three P. oocarpa trees were collected in a 13-year-old experimental forest plantation, with 100 individuals of each species, at a spacing of 3 m x 3 m, located at UESB, in Vitória da Conquista, at geographic coordinates of 14º53’S and 40º48’W.
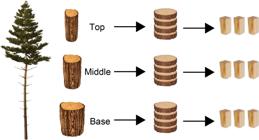
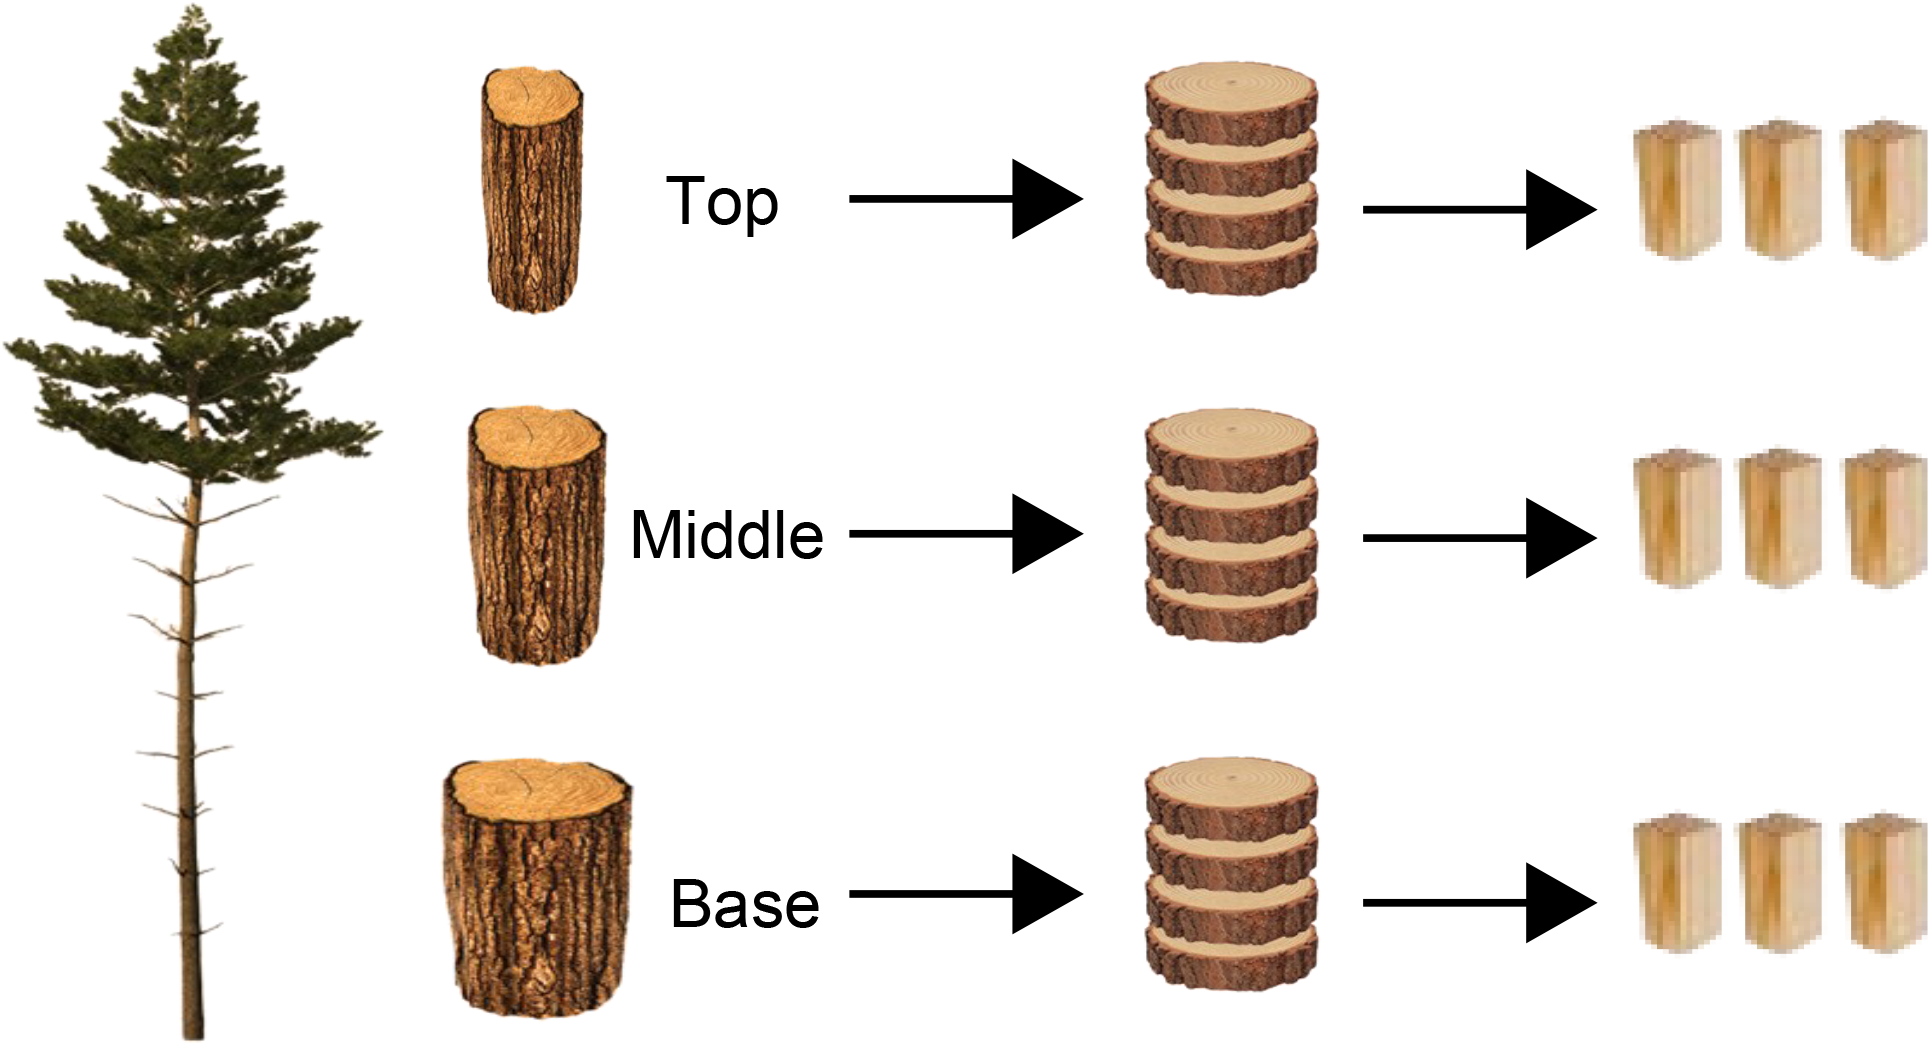
Four discs of 5 to 7 cm thickness were collected from three different positions of the tree trunk: base (0%), middle (50%) and top (100%), taking as reference the commercial trunk of approximately 9 m (minimum diameter of 8 cm). Parallelepiped-shaped specimens, with approximate dimensions of 2.0 (radial) x 3.0 (tangential) x 5.0 (axial) cm, were produced using a table saw, as shown in Figure 1.
The specimens were visually identified in the anatomical planes of the wood in each sample (transverse - T, longitudinal tangential - Tg and longitudinal radial - R), and were marked with water-resistant paint. Reference points were marked to measure the dimensions of the pieces on the three faces, always in the same place, using a caliper, to minimize greater experimental errors, and each piece received a numerical identification referring to its position on the trunk.
Determination of mass and saturated/dry dimensions of wood
The samples were hydrated in a tank with water until they reached the maximum moisture content of the wood, a point at which the weight of the hydrated pieces remained constant after three consecutive weighings. After saturation, excess water was removed with the aid of absorbent paper, and the mass of saturated wood (Msat), or wood at maximum moisture content, and the saturated volume by the hydrostatic balance method (Vsat HB) were determined using a precision scale.
The linear dimensions of the saturated wood specimens (Dsat) were measured with a caliper at preestablished marks, allowing the calculation of the saturated volume (Vsat) by multiplying these dimensions.
After obtaining all the information (saturated wood dimensions and volumes), the samples were taken to the oven at 105 ± 3 °C, and after complete drying, their dry mass (Mdry) and dry linear dimensions (Ddry) were measured using a caliper, and the dry volume was obtained by multiplying the dry dimensions (Vdry).
Determination of physical properties of wood
Maximum moisture of the wood was determined according to NBR 11941 using Equation 1.
Where: MCmax = Maximum moisture content of wood, %; MSS = mass of saturated sample up to constant weight, g; MODS = mass of oven-dried sample, g.
Volumetric and linear swelling coefficients were calculated according to NBR 7190/97 using Equations 2 and 3, respectively, as well as the linear and volumetric contraction coefficients, according to Equations 4 and 5, respectively.
Where: αVmax = maximum volumetric swelling coefficient, %; Vsat = sample volume in saturated condition, cm3; Vod = volume of oven-dried sample, cm3.
Where: αLmax = maximum linear swelling coefficient in a specific wood direction, %; Lsat = linear dimension at determined wood direction in a saturated condition, cm3; Lod = linear dimension at determined wood direction in an ovendried condition, cm3.
Where: βVmax = maximum volumetric contraction coefficient in a specific wood direction, %; Vsat = sample volume in a saturated condition, cm3; Vod = volume of oven-dried sample, cm3.
Where: βLmax = maximum linear contraction coefficient in a specific wood direction, %; Lsat = linear dimension at determined wood direction in a saturated condition, cm3; Lod = linear dimension at determined wood direction in an ovendried condition, cm3.
The basic density of the wood samples was determined according to Equation 6 (caliper method) and Equation 7 (hydrostatic balance method), based on the NBR 7190/97 standard.
Where: BDcal = basic density by the caliper method, g/cm3; Mod = mass of oven-dried sample, g; Vsat = volume of saturated sample measured by the caliper method, cm3.
Where: BD(hb) = basic density by the hydrostatic balance method, g/cm3; Mod = mass of oven-dried sample, g; Vu = volume of saturated sample measured by the hydrostatic balance method, cm3.
The anisotropy coefficient of the wood was determined according to Equation 8.
Where: AC = anisotropy coefficient; βt = contraction coefficient in the longitudinal tangential direction, βr = contraction coefficient in the longitudinal radial direction of wood.
Statistical analysis
The experiment followed a 2 x 3 factorial design, with two forest species (P. oocarpa and P. caribaea) and three positions of the wood (0, 50 and 100%). Three trees of each species were harvested and four discs were collected from each position of the wood, totaling 72 sampling units of wood (2 species x 3 trees x 4 discs x 3 positions along the trunk).
Statistical analyses were performed using Past 4.02 software. The data of maximum moisture, basic density, and volumetric and linear swelling and contraction coefficients were subjected to normality analysis using the Shapiro-Wilk test and homoscedasticity analysis using the Levene’s test. Interactions were analyzed and, in cases of non-significant interaction at 5% significance level, the factors were studied separately.
Tests of means at 5% significance level, using the t-test (“species” factor) and Tukey test (“trunk position” factor), and the Model Identity Test at 5% significance level were performed to evaluate the regression analyses constructed with the data of trunk positions for each species (statistically equal regressions were represented by single regressions). Finally, a multivariate analysis was performed using Principal Component Analysis (PCA) to verify the similarity between wood species and the causes of variation.
RESULTS AND DISCUSSION
Maximum moisture content of wood
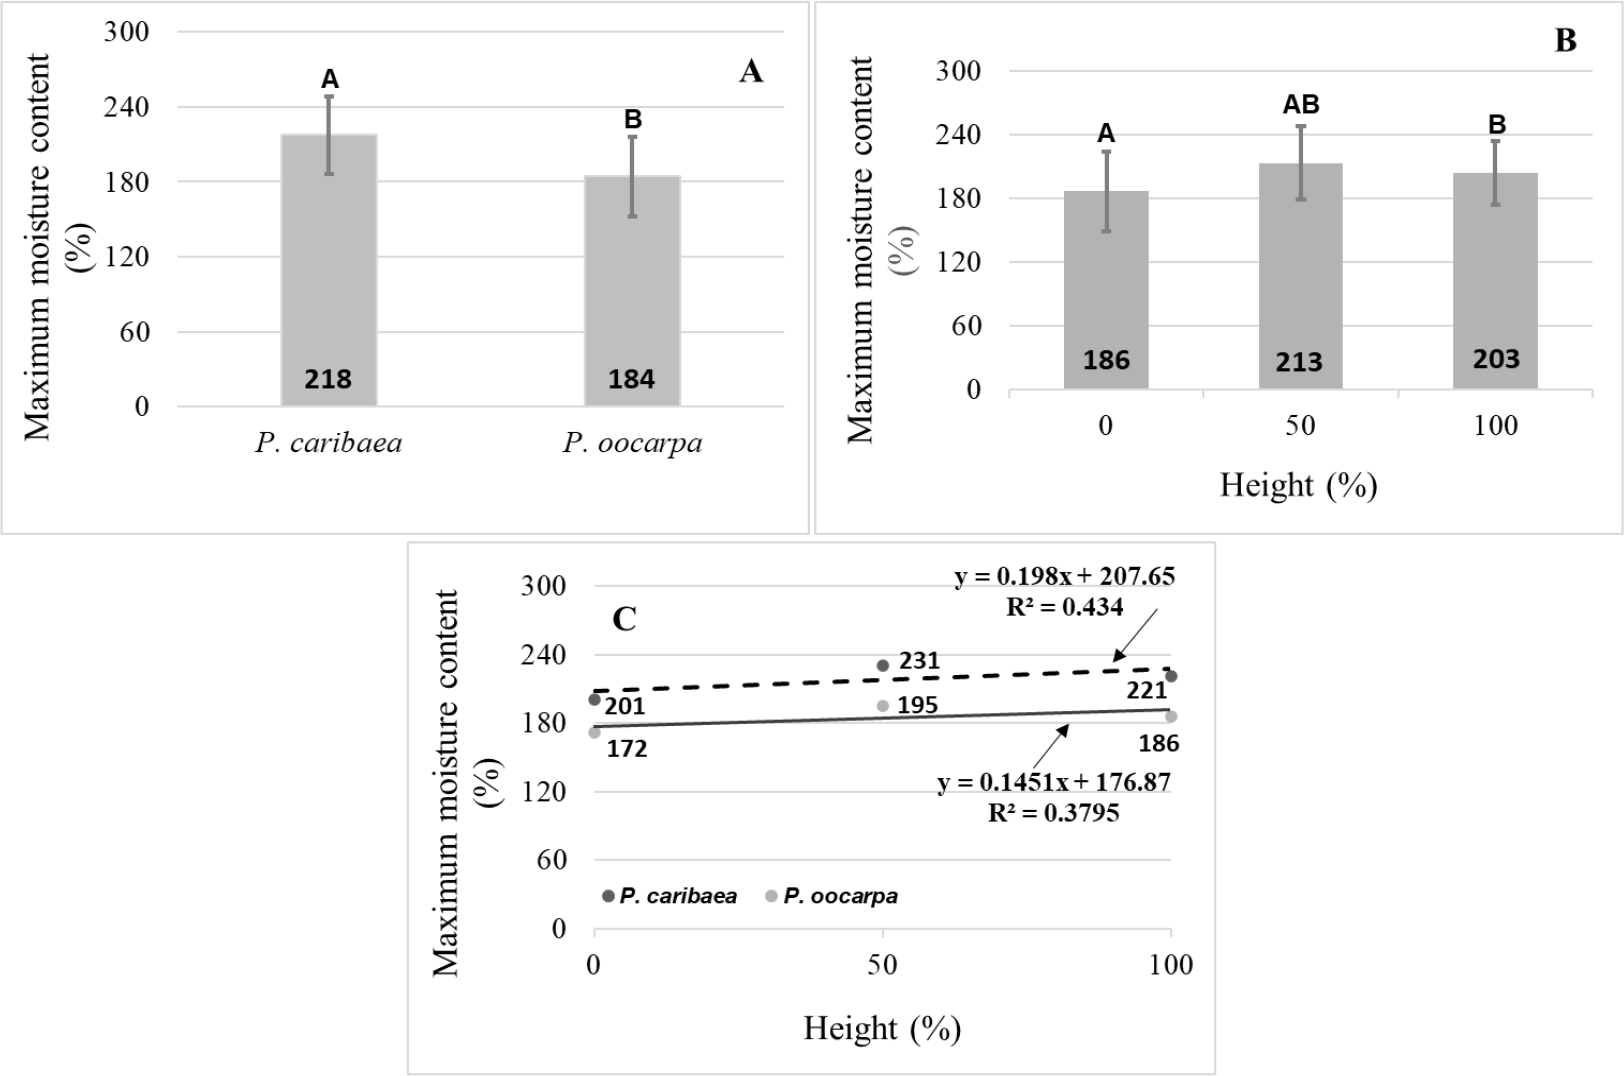
The maximum moisture content of wood refers to the maximum amount of water that can be absorbed by the wood relative to its dry weight, an important parameter to understand the physical and mechanical behavior of wood (GLASS; ZELINKA, 2010). In this study, the analysis of variance indicated a non-significant interaction between the factors “species” and “wood position” (p = 0.083), at 5% significance level. Thus, it was possible to observe that the “species” factor showed a significant difference (p = 0.005) in maximum moisture content between the two woods studied. P. caribaea wood showed a higher water retention capacity, with a mean maximum moisture content of 218% (CV = 14.4%), while P. oocarpa wood had a mean value of 184% (CV 17.4%), as shown in Figure 2A. Similar results were found by Loiola et al. (2021), who estimated maximum moisture content through the basic density of the wood, and P. caribaea and P. oocarpa woods had maximum moisture contents of 212% and 117%, respectively. This result may indicate that the two species have different structural behaviors, due to the composition and anatomical organization, which interferes with the maximum water storage capacity.
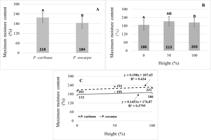
Maximum moisture content of wood. A: mean values of the species Pinus caribaea var. hondurensis and Pinus oocarpa; B: mean values of trunk position (0, 50 and 100%); C: linear regression expressing maximum moisture content variation between “species” and “trunk position” factors.
Regarding the maximum moisture content as a function of the base x top position of the trunk, that is, as a function of tree height, there were significant differences (p= 0.002); the 0% position was statistically different from the 100% position, an indication of the heterogeneity between base woods and top woods. However, the woods at the 50% position were statistically equal to the woods at both the 0% position (base) and the top position (100%), showing a transition region between the extremes of the tree, as shown in Figure 2B. The results found in this study corroborate those reported by Modes et al. (2021), who observed a lower maximum moisture content in the base region of the wood (176%) and a trend of increase toward the top region (215%).
Finally, for a more detailed evaluation of the study of the maximum moisture content of the woods, a regression was performed to show the behavior of the maximum moisture of each species as a function of trunk position. The woods showed an increase in maximum moisture of 0.20% for each 1% increase in position on the tree trunk from its base to the top for the species P. caribaea, and a lower rate of increase, 0.14% for each 1% increase in trunk position, for the species P. oocarpa.
In addition, the model identity test was carried out and pointed to significant differences in the maximum moisture curves for P. caribaea and P. oocarpa woods. The coefficients of determination of the regressions explain how much of the variation in maximum moisture can be explained by trunk position. P. caribaea had a coefficient of determination (R2) of 43.4% and P. oocarpa had a coefficient of determination (R2) of 38.0%.
For both species, there was a trend of increase in maximum moisture in the base-to-top direction, as the cell walls of the top tracheids are thinner and the space occupied by free water (lumen and intercellular spaces) is more abundant. Conversely, base tracheids are thicker, favoring greater absorption of bound water, which is limited to microscopic spaces (ZOBEL; VAN BUIJTENEN, 1989).
Wood basic density
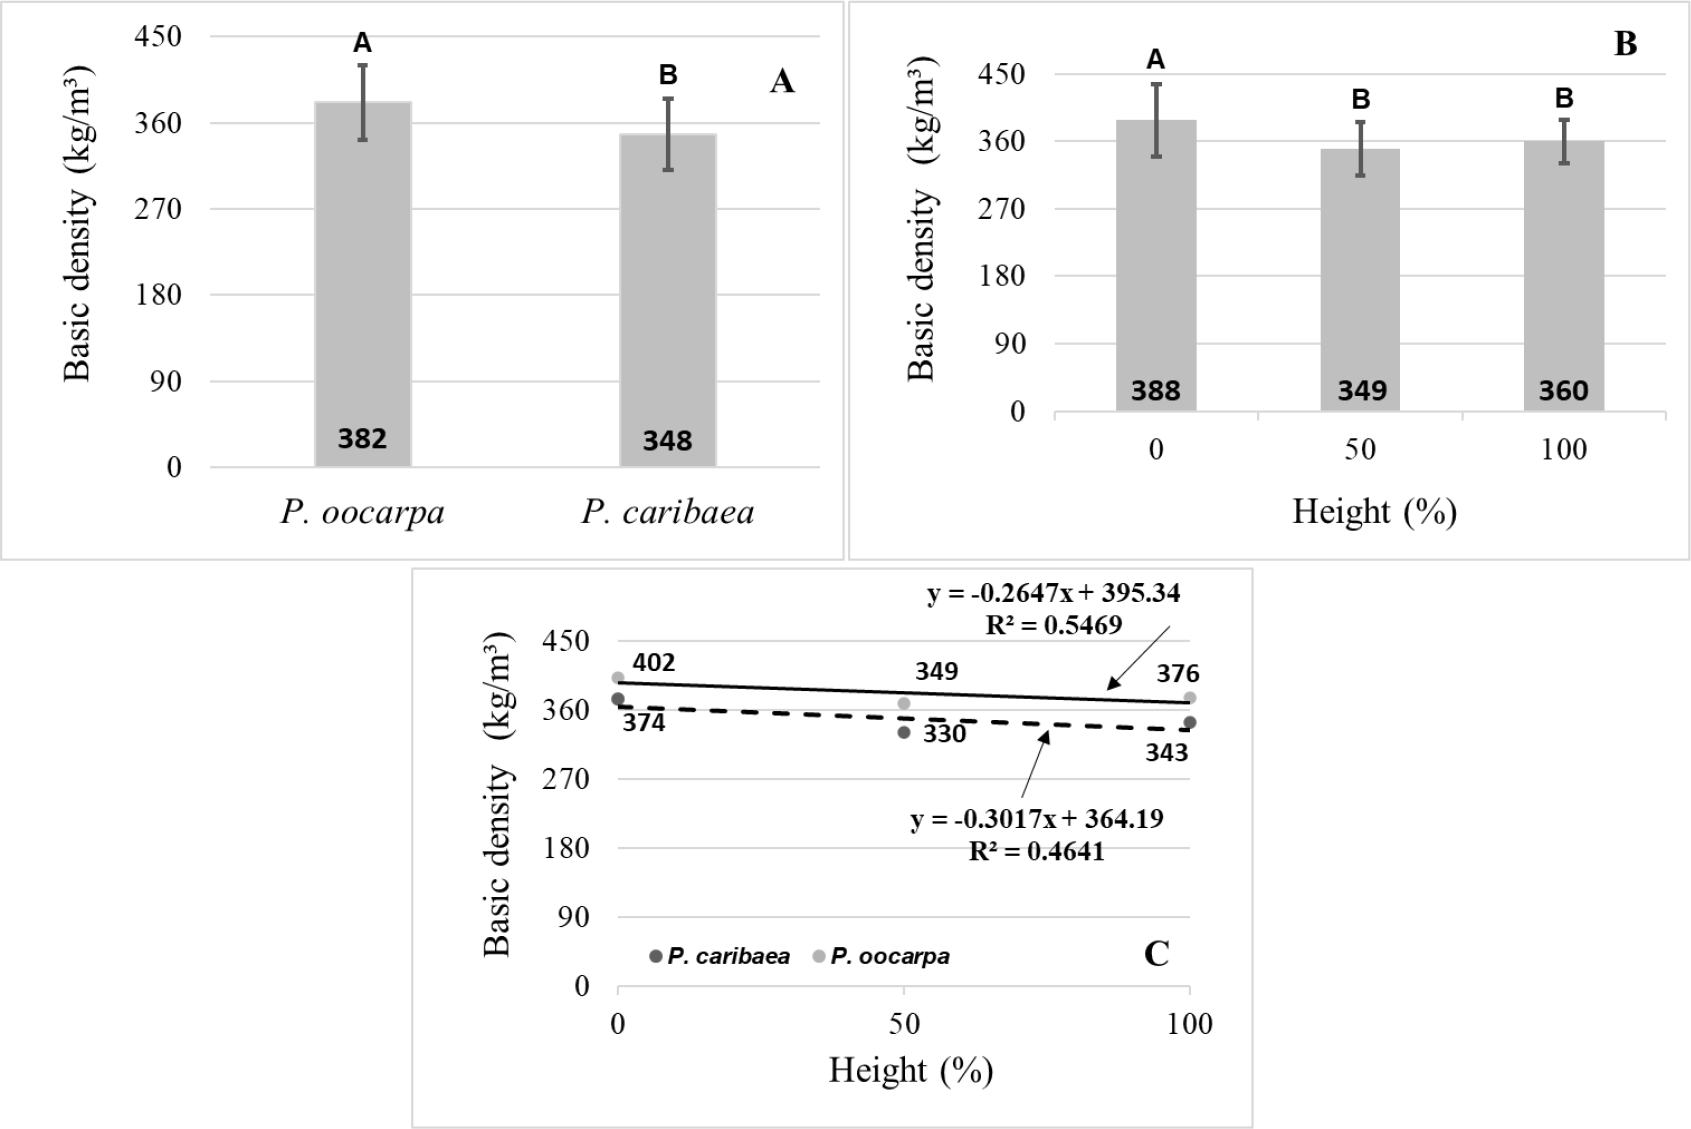
Basic density is the main character to express the quality of the wood (DEMUNER, 2011; LOPES et al., 2023), because in addition to requiring simpler instrumentation for its determination, it influences the quality of the product and is related to almost all other technological properties (RAMOS et al., 2024). In this study, the analysis of variance indicated a non-significant interaction between the factors “species” and “wood position” (p = 0.829), at 5% significance level. When analyzing the “species” factor, it was possible to observe a significant difference for basic density between the two woods studied (p= 0.0001), with a higher mean value for P. oocarpa wood, 382 kg/m3, compared to P. caribaea wood, 348 kg/m3, as shown in Figure 3A. Regarding the variation of basic density within each species, it ranged from 302 kg/m3 to 362 kg/m3 (19.9%) for P. oocarpa and from 317 kg/m3 to 458 kg/m3 (44.5%) for P. caribaea.

Basic density of the woods studied. A: mean values of the species Pinus oocarpa and Pinus caribaea var. hondurensis; B: mean values by trunk position (0, 50 and 100%); C: linear regression expressing basic density between “species” and “trunk position” factors.
In his study, Loiola (2019) found a higher value of basic density for P. oocarpa wood (463 kg/m3) and a lower value for P. caribaea wood (398 kg/m3). Vivian et al. (2023) also studied conifer (Cryptomeria japonica) wood and found basic density of 314 kg/m3, which is lower than that found in this study. This variation in wood basic density may be related to the characteristics of the species, moisture content of the wood, presence of earlywood or latewood, in addition to silvicultural practices (VIDAURRE et al., 2023).
Regarding wood basic density (BD) as a function of trunk position, it was possible to observe significant differences for the two species. BD at the 0% position was statistically different from BD at the 50% (p=0.0002) and 100% (p=0.0134) positions, while BD at the 50% and 100% positions did not differ statistically, as shown in Figure 3B.
As for Figure 3C, both species show a trend of decrease in wood basic density as the trunk height position (base-top) increased, from 402 kg/m3 to 376 kg/m3 for P. oocarpa (decrease of 0.26 kg/m3 for each 1% variation in trunk position), and from 374 kg/m3 to 343 kg/m3 for P. caribaea (decrease of 0.31 kg/m3 for each 1% variation in trunk position).
The coefficients of determination were considered moderate, with R2 = 56.5% for Pinus oocarpa wood and R2 = 46.4% for Pinus caribaea wood. In addition, the model identity test showed significant differences in the basic density curves for P. caribaea and P. oocarpa woods.
Modes et al. (2021) studied the physical-mechanical characterization of Pinus glabra Walt wood and found behavior partially similar to that observed here. They found a trend of decrease in basic density along the trunk length, with the value corresponding to the position 0% (464 kg/m3) being statistically different and higher than those of the positions 50% (412 kg/m3) and 100% (394 kg/m3).
This variability in basic density may suggest structural and compositional differences along the trunk. In addition, it has implications for the final destination of the wood, since denser wood, such as the base wood, may be desirable for products that require greater strength and durability, while less dense wood, such as the top wood, may be preferable for less density-demanding products.
Regarding the correlation between the maximum moisture and the basic density of the wood, both species showed a decreasing trend, that is, as the basic density of the wood increased, the maximum moisture tended to decrease, as shown in Figures 4A and 4B. P. caribaea wood showed R2 of 83.51% and P. oocarpa wood showed R2 of 80.55%; both coefficients are high and express how much of the variation in maximum moisture can be explained by the variation in basic density. The values obtained corroborate those reported by Jesus et al. (2016), who found that maximum moisture is inversely proportional to wood density.

Correlation between basic density and maximum moisture content of the species Pinus caribaea var. hondurensis (A) and Pinus oocarpa (B).
Denser woods have fewer voids in their structure, greater mass by volume, and lower water storage capacity (COELHO, 2021), with a direct effect on transportation costs, susceptibility to fungal attack, and the occurrence of defects such as warping and cracks.
Wood swelling and contraction
The swelling and contraction of wood is one of the main characteristics to be considered in its use as a raw material for the production of sawn wood (solid wood products), as changes in the dimensions of a piece can make its use unfeasible. In the present study, it was possible to observe a statistically significant difference between the species. The swelling values obtained for P. oocarpa wood were higher than those obtained for P. caribaea wood, both for volumetric swelling (12.5% for P. oocarpa and 10.9% for P. caribaea, Figure 5A) and for swelling observed in the longitudinal radial plane (4.5% for P. oocarpa and 4.0% for P. caribaea, Figure 5C) and in the longitudinal tangential plane (6.3% for P. oocarpa and 5.7% for P. caribaea, Figure 5E).
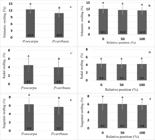
Volumetric, longitudinal radial and longitudinal tangential swelling of wood. A, C and E: mean values of the species Pinus oocarpa and Pinus caribaea var. hondurensis; B, D and F: mean values of trunk position (0, 50 and 100%).
Regarding the swelling as a function of trunk position, there were no significant differences for the two species, i.e., the values obtained for the 0% position (base) were similar to those obtained for the 50% and 100% (middle and top) positions, both for the volumetric values (Figure 5B) and for the longitudinal radial (Figure 5D) and longitudinal tangential values (Figure 5F). Poubel et al. (2013), when studying the physical properties of P. caribaea wood, found similar values, 12.1% for volumetric swelling, 5.3% for longitudinal radial swelling, and 5.4% for longitudinal tangential swelling. On the other hand, Santos and Silva (2021) found a lower value (8.98%) for the volumetric swelling of P. caribaea wood at 14 years of age.
In relation to the dimensional variations, the highest swelling values were observed in the longitudinal tangential direction, compared to the longitudinal radial direction. These variations are considered normal, due to the transverse orientation of the rays and the presence of bordered pits, predominant in the radial walls of the tracheids, causing a deviation of the cellulose microfibrils in the S2 layer (POUBEL et al., 2013).
For wood contraction, a statistical and significant difference was observed between the species, as occurred with swelling. The contraction values obtained for Pinus oocarpa wood were higher than those found for P. caribaea wood, both for the volumetric values of 11.1% for P. oocarpa and 9.9% for P. caribaea (Figure 6A) and for the longitudinal radial values of 4.3% for P. oocarpa and 3.9% for P. caribaea (Figure 6C) and longitudinal tangential values of 5.9% for P. oocarpa and 5.3% for P. caribaea (Figure 6E).

Volumetric, longitudinal radial and longitudinal tangential contraction of wood. A, C and E: mean values of the species Pinus oocarpa and Pinus caribaea var. hondurensis; B, D and F: mean values of trunk position (0, 50 and 100%).
For the contraction as a function of trunk position for the two species, there were no significant differences. The contraction values obtained for the 0% position (base) were significantly similar to those obtained for the 50% and 100% positions (middle and top), both for the volumetric values (Figure 6B) and for the longitudinal radial values (Figure 6D) and longitudinal tangential values (5.7%, 5.7% and 5.4%, Figure 6F).
Loiola et al. (2021), when studying the physical properties of Pinus caribaea var. caribaea, Pinus caribaea var. hondurensis and Pinus oocarpa for pencil production, found similar behavior, confirming the statistical difference in the contraction values between the species. Regarding dimensional variations, Vivian et al. (2023) studied Cryptomeria japonica wood and also observed higher contraction values in the longitudinal tangential direction (5.48%), compared to the radial direction (2.09%).
In relation to the anisotropy coefficient, there was no statistically significant difference between the species, i.e., both have similar physical properties in terms of dimensional variation. P. oocarpa had an anisotropy coefficient of 1.40%, while P. caribaea had a value of 1.42%, as shown in Figure 7A. Loiola et al. (2021), when analyzing the basic density and retractability of the woods of Pinus caribaea var. caribaea,14 years old, and Pinus oocarpa, 35 years old, also observed the same behavior, finding anisotropy coefficients of 1.60% for Pinus oocarpa and 1.54% for Pinus caribaea.

Anisotropy coefficient of the woods studied. A: mean values of the species Pinus caribaea var. hondurensis and Pinus oocarpa; B: mean values of trunk position (0, 50 and 100%).
Regarding the anisotropy coefficient as a function of trunk position for both species, there was no statistically significant difference, indicating a greater uniformity of physical properties along the trunk (Figure 7B). Modes et al. (2021), when evaluating the physical properties of Pinus glabra wood, also found an anisotropy coefficient (1.46%) similar to that found in the present study.
Principal component analysis
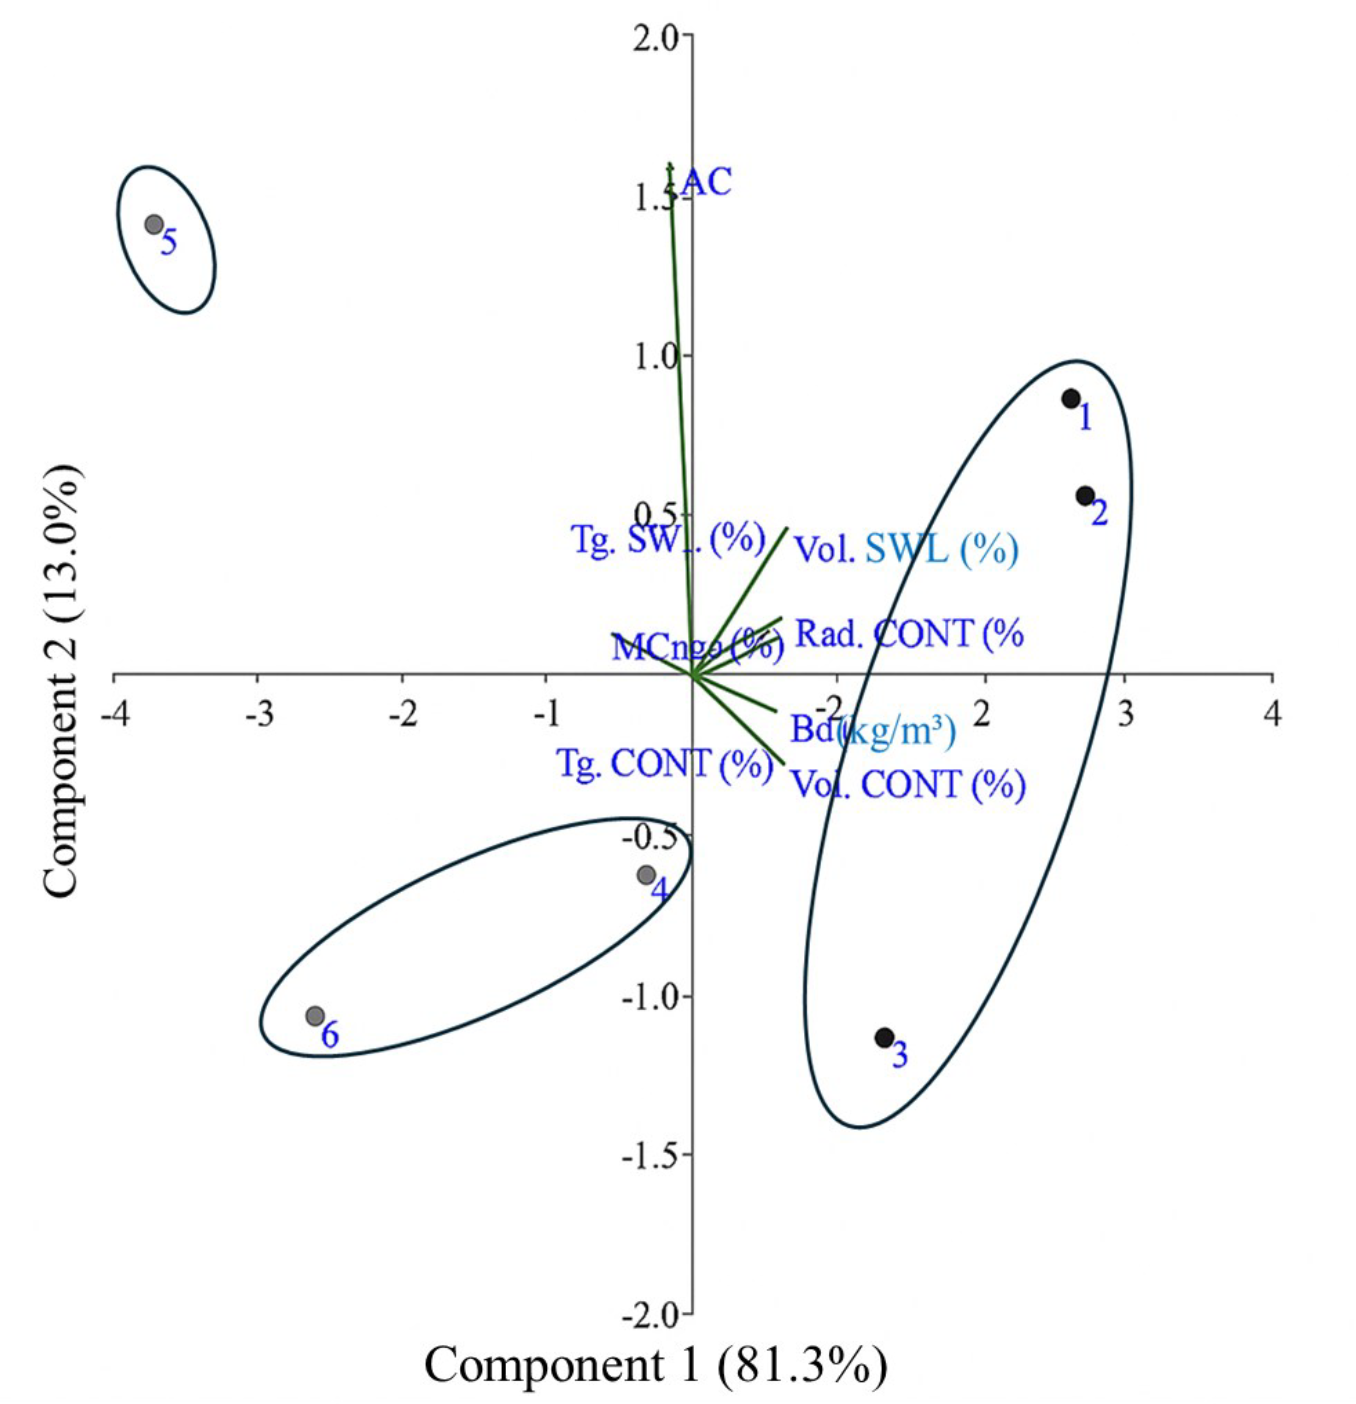
In the present study, five principal components were identified. Among them, two were selected because they explain 94.3% of the variability of the physical properties analyzed in the woods, with 81.3% corresponding to principal component 1 and 13.0% to principal component 2, as shown in Table 1.
Scores, explained variance and cumulative variance for each principal component for the physical properties of wood from the species
Figure 8 shows the relationship between the treatments and the variables (eigenvectors) in the two principal components (PC1 and PC2). Considering the first two principal components, three distinct groups were formed based on the wood species as a function of the position along the trunk: group 1 formed by P. oocarpa wood (1, 2 and 3), group 2 formed by the base of P. caribaea wood and top of P. caribaea wood (4 and 6) and group 3 formed by the middle of P. caribaea wood. The eigenvectors and the contribution of each variable to the principal components can be seen in Table 2.
Coefficients (ê) and contributions of variables to each principal component (Contr %) for all physical properties of wood from the species Pinus oocarpa and Pinus caribaea var. hondurensis.
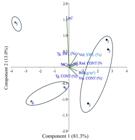
Principal component analysis of the physical variables of wood from Pinus caribaea var. hondurensis and Pinus oocarpa at different trunk positions (0, 50 and 100%). Where 1 = P. oocarpa - Base; 2 = P. oocarpa - Middle, 3 = P. oocarpa - Top; 4 = P. caribaea - Base; 5 = P. caribaea - Middle and 6 = P. caribaea - Top.
The first principal component did not present any property with an outstanding contribution, and swelling and contraction parameters had contributions between 12.5 and 13.6%, with basic density contributing 10.5%. On the other hand, the second principal component stood out for the anisotropy coefficient, which accounted for 80.6% of the contribution.
The clustering indicated a homogeneity of the woods in terms of physical properties within each group and a heterogeneity between the species, i.e., P. caribaea and P. oocarpa had different physical properties. Thus, the behavior found reinforces the trends detected and discussed previously: differences between the species for the variables analyzed.
CONCLUSION
Greater influence between the species and lesser influence of the relative positions on the trunk were observed on the physical properties of the studied woods.
Wood maximum moisture and basic density differed statistically both between species and between different relative positions on the trunk. In addition, a high correlation was observed between basic density and maximum moisture.
Wood swelling and contraction showed statistical differences only between species, while the anisotropy coefficient did not show statistical difference between species or relative positions on the trunk.
This study indicated that the behavior of the species should be better monitored in Pinus plantations in the Southwest region of Bahia, with less impact of wood variation as a function of height. However, basic density should be well evaluated as a function of height.
Data Availability:
The data that support the findings of this study can be made available, upon reasonable request, from the corresponding author.
REFERENCES
- ALBUQUERQUE, C. E. C. Influência das características anatômicas da madeira na penetração e adesão de adesivos. Floresta e Ambiente, 7: 158-166, 2020.
- CALIL NETO, C. et al. Specie - Treatment - Adhesive combinations for glulam purpose. Revista de Engenharia Civil IMED, 3: 16-23, 2016.
- COELHO, M. U. Impacto da densidade básica da madeira de Eucalyptus na eficiência dos processos de polpação kraft estendidos 2021. 136 f. Tese (Doutorado em Recursos Florestais: Área de Tecnologia de Produtos Florestais) - Universidade de São Paulo, Piracicaba, 2021.
- DEMUNER, W. P. Predição do impacto da madeira em fábrica Kraft de eucalipto 2011. 33 f. Monografia (Graduação em Engenharia Industrial Madeireira) - Universidade Federal do Espírito Santo, Jerônimo Monteiro, 2011.
- GLASS, S. V.; ZELINKA, S. L. Moisture relations and physical properties of wood. In: WOOD HANDBOOK: wood as an engineering material, 2010. [S.l.: s.n.], p. 1-19.
- HSING, T. Y. Crescimento e qualidade da madeira de plantas jovens de híbridos de Eucalyptus grandis x E. urophylla 2013. 42 f. Dissertação (Mestrado em Agronomia: Área de Genética e Melhoramento de Plantas) - Faculdade de Ciências Agrárias e Veterinárias, Jaboticabal, 2013.
- IBÁ - Indústria Brasileira de produtores de Árvores. Relatório IBÁ 2023: ano base 2022 Brasília, DF: IBÁ, 2023. 46 p.
- JESUS, A. G. et al. Comportamento das madeiras de três espécies amazônicas submetidas à secagem ao ar. Nativa, 4: 31-35, 2016.
- LOIOLA, P. L. et al. Physical Properties of the wood Pinus caribaea var. caribaea, Pinus caribaea var. hondurensis and Pinus oocarpa for pencil production. Floresta, 51: 354-362, 2021.
- LOIOLA, P. L. Qualidade da madeira de espécies de pinus tropicais para a produção de lápis 2019. 179 f. Tese (Doutorado em Engenharia Florestal: Área de Concentração em Tecnologia e Utilização de Produtos Florestais) - Universidade Federal do Paraná, Curitiba, 2019.
- LOPES, E. D. et al. Physical and chemical properties of wood from Eucalyptusand Corymbia clones in different planting densities. Ciência Florestal, 33: 2, 2023.
- LORENZI, H.; BACHER, L. B.; TORRES, M. A. V. Árvores e arvoretas exóticas no Brasil: madeireiras, ornamentais e aromáticas Nova Odessa: Instituto Plantarum, 2018. 464 p.
- MODES, R. S. et al. Caracterização físico-mecânica da madeira de Pinus glabra Walt. In: VANGELISTA W. V. (Ed.). Madeiras Nativas plantadas no Brasil: qualidade, pesquisas e atualidades Guarujá, SP: Editora Científica, 2021. v. 1, cap. 9, p. 177-191.
- OLIVEIRA, A. M. et al. Efeito de rotações sucessivas de eucalipto na mineralização de nitrogênio e carbono do solo e suprimento de nitrogênio, no Sudoeste da Bahia, Brasil. Scientia Forestalis, 48: 01-12, 2020.
- PAULA, M. H. Propriedades tecnológicas de madeiras submetidas a tratamentos térmicos para estabilização dimensional 2021. 229 f. Tese (Doutorado em Ciências Florestais: Área de Ciência e Tecnologia da Madeira) - Universidade de Brasília, Brasília, 2021.
- POUBEL, D. S. et al. Efeito da termorretificação nas propriedades físicas e químicas da madeira de Pinus caribaea. Cerne, 19: 391-398, 2013.
- RAMOS, R. D. et al. Influência da densidade básica e da composição química da madeira para a indústria de polpa celulósica: um estudo de caso. Ciência Florestal, 34: 3, 2024.
- SANTOS, B. V.; SILVA, G. C. Efeito da modificação térmica nas propriedades físicas da madeira de Pinus Caribaea var. Hondurensis Barrett & Golfari. Caderno de Ciências Agrárias, 13: 1-7, 2021.
- SILVA, L. S. Z. R. S. et al. Physical-mechanical properties of Cajueiro wood estimated by non-destructive methods based on apparent density and natural vibration Frequency. Ciência Florestal, 33: 3, 2023.
- SILVA, R. A. et al. Estudo da variabilidade da radiação solar no Nordeste do Brasil. Revista Brasileira de Engenharia Agrícola e Ambiental, 14: 501-509, 2009.
- VIDAURRE, G. B. et al. Qualidade da madeira de eucalipto Vitória, ES: Editora Universitária, 2023. 160 p.
- VIVIAN, M. A. et al. Propriedades físicas, químicas e anatômicas da madeira de Cryptomeria japonica. Pesquisa Florestal Brasileira, 43: 1-10, 2023.
- ZOBEL, B. J.; VAN BUIJTENEN, J. P. Wood Variation and Wood Properties. In: ZOBEL, B. J.; VAN BUIJTENEN, J. P. (Eds.). Wood Variation: Its Causes and Control Berlin Heidelberg: Springer, 1989. v.1, cap. 1, p.1-32.
Edited by
-
Editor in Chief:
Aurélio Paes Barros Júnior
-
Section Editor:
Poliana Coqueiro Dias

 Means with the same capital letter do not differ from each other by t-test and Tukey test at 5% significance level. Bars indicate the coefficient of variation.
 Means with the same capital letter do not differ from each other by t-test and Tukey test at 5% significance level. Bars indicate the coefficient of variation.

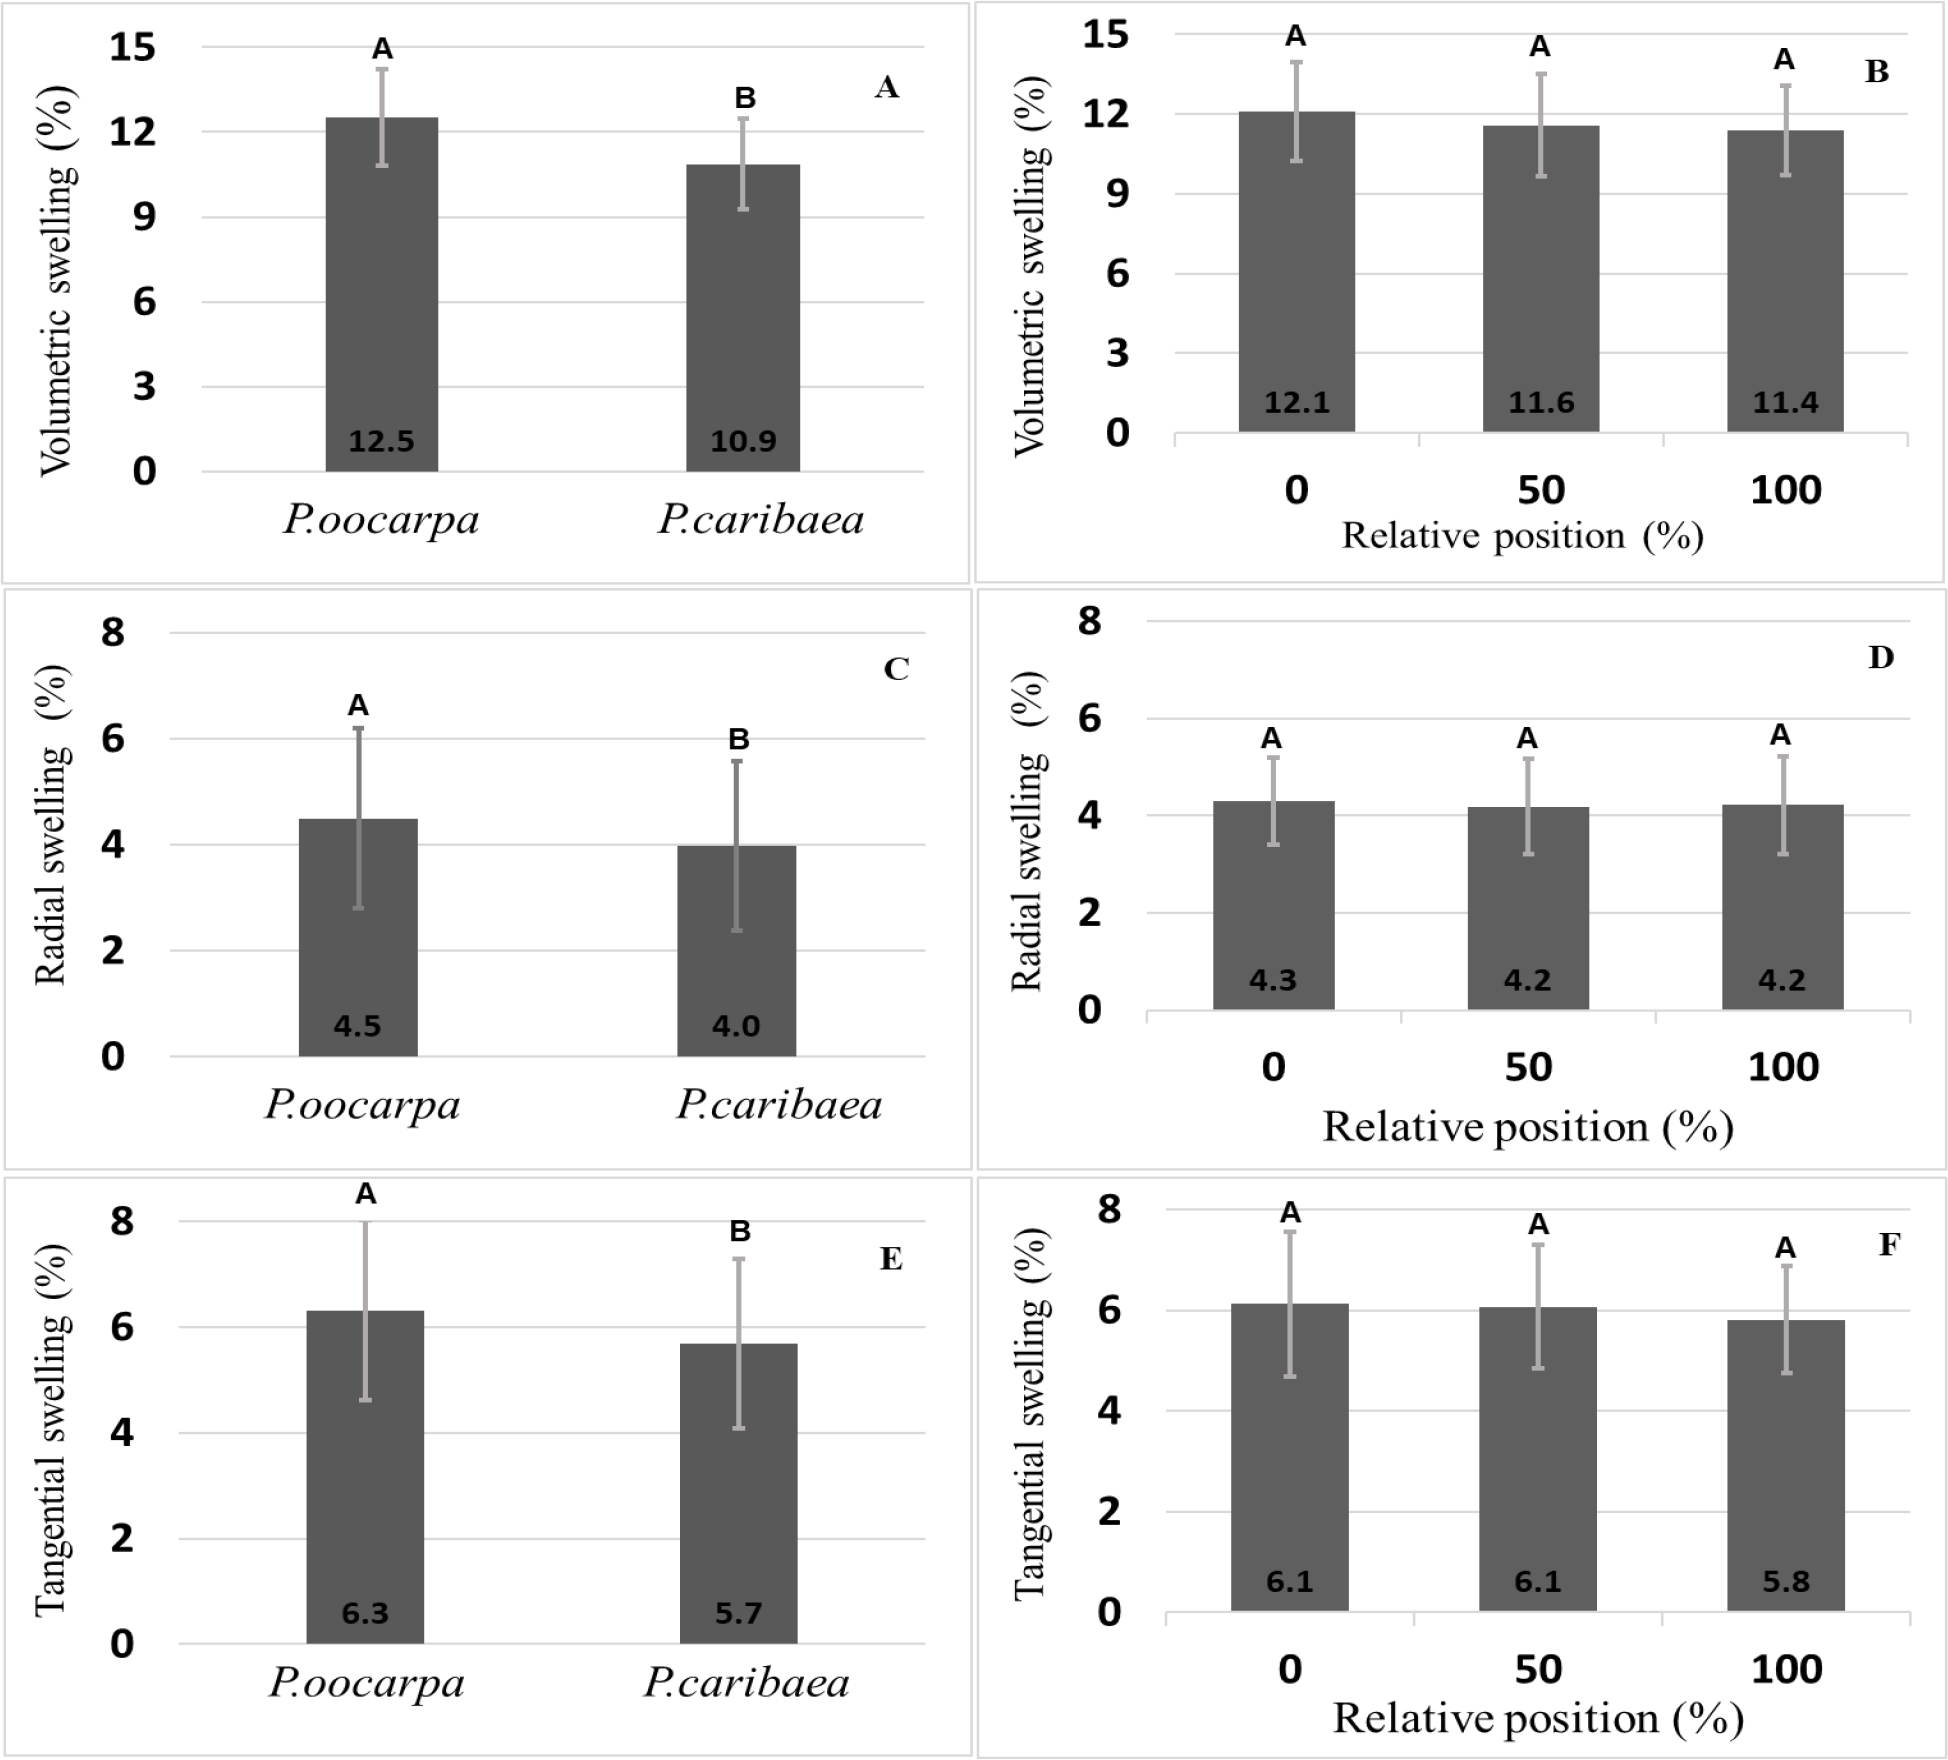 Means with the same capital letter do not differ from each other by t-test and Tukey test at 5% significance level. Bars indicate the coefficient of variation.
 Means with the same capital letter do not differ from each other by t-test and Tukey test at 5% significance level. Bars indicate the coefficient of variation.
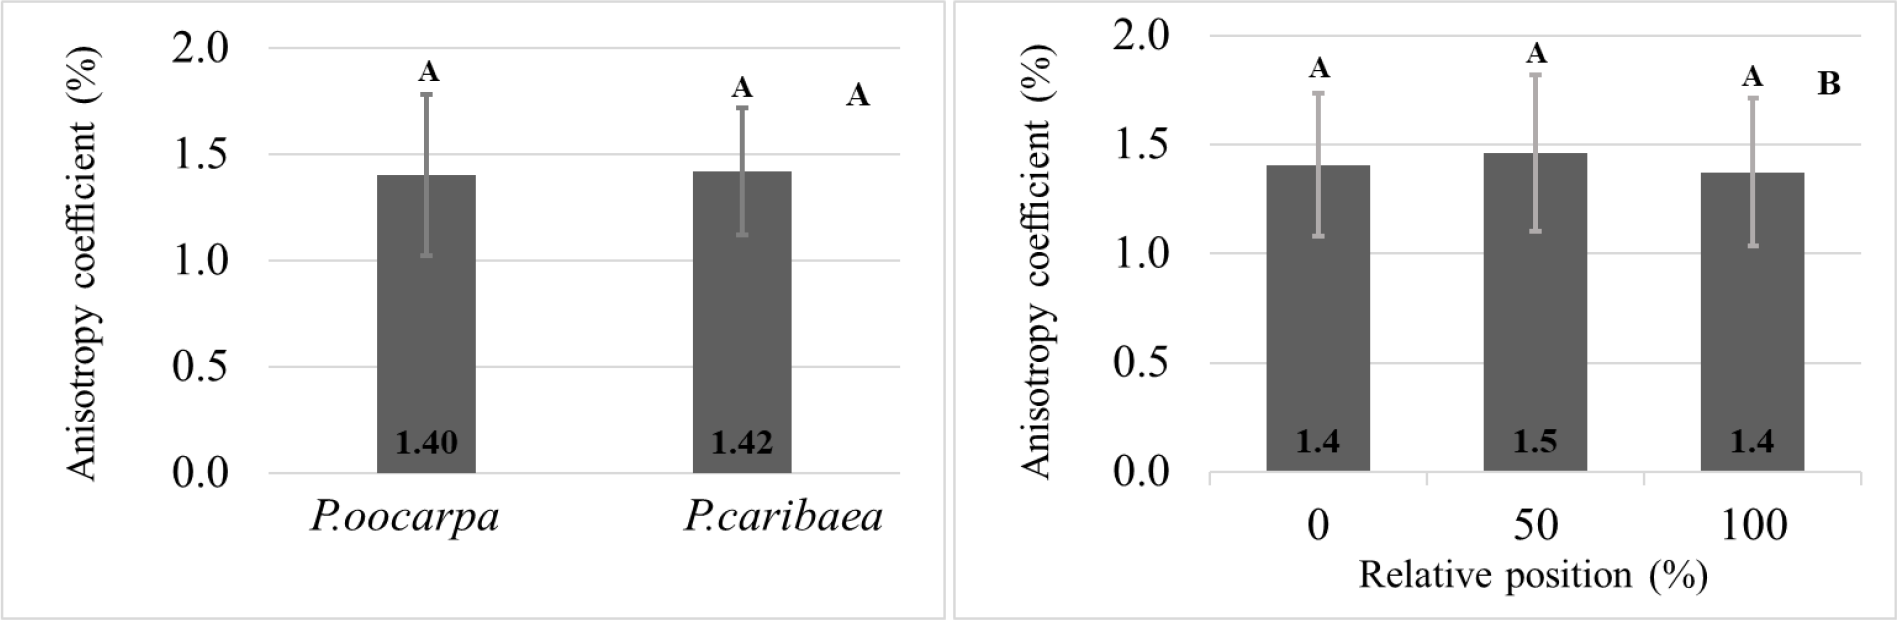 Means with the same capital letter do not differ from each other by t-test and Tukey test at 5% significance level. Bars indicate the coefficient of variation.