 Assessing temporal variability in water security across Brazil
ABSTRACT
Water security is commonly analyzed by combining indicators representing human, economic, ecosystemic, and resilience dimensions. However, a comprehensive understanding of water security requires evaluating how these indicators evolve over time. Here, we combine three decades of Brazilian data to develop the Temporal Water Security Index (TWSI) which includes time variability and hydrological extremes. We compare TWSI with Brazil’s established index and analyze changes across the country. Our results show a 28% decrease in the proportion of ottobasins classified as the highest water security levels over time. The greatest decline in water security was observed in Southeast Brazil, likely associated with population growth and increasing water demand. These findings underscore the importance of incorporating temporal assessment and hydrological extremes into water security analyses to better support water resources management.
Keywords:
Water security; Hydrological extremes; Water resources management
RESUMO
Segurança hídrica é comumente analisada por meio da combinação de indicadores que representam as dimensões humana, econômica, ecossistêmica e de resiliência. No entanto, uma compreensão abrangente da segurança hídrica requer a avaliação de como esses indicadores evoluem ao longo do tempo. Neste estudo, combinamos três décadas de dados brasileiros para desenvolver o Temporal Water Security Index (TWSI), que incorpora a variabilidade temporal e os extremos hidrológicos. Comparamos o TWSI com o índice já estabelecido no Brasil e analisamos as mudanças em todo o território nacional. Nossos resultados indicam uma redução de 28% na proporção de ottobacias classificadas nos níveis mais elevados de segurança hídrica ao longo do tempo. O Sudeste do Brasil apresentou o maior declínio na segurança hídrica, provavelmente associado ao crescimento populacional e ao aumento da demanda por água. Esses resultados reforçam a importância de incorporar avaliações temporais e extremos hidrológicos nas análises de segurança hídrica, de modo a oferecer melhor suporte à gestão de recursos hídricos.
Palavras-chave:
Segurança hídrica; Extremos hidrológicos; Planejamento de recursos hídricos
INTRODUCTION
Approximately 80% of the global population is exposed to high levels of water security threats (Vörösmarty et al., 2010). Over recent decades, freshwater consumption has grown significantly due to population growth and socioeconomic development (United Nations, 2025), while pressures related to water scarcity (Blöschl & Chaffe, 2023; Mekonnen & Hoekstra, 2016) and water pollution (Hannah et al., 2022) have intensified. Thus, water security emerges as a central concept in water resource management (Arheimer et al., 2024; Grey & Sadoff, 2007). According to the United Nations Water (2013), water security is defined by a population’s capacity to safeguard sustainable access to adequate quantities and quality of water to maintain human well-being, socioeconomic development, protection against water pollution and water-related disasters, and preservation of ecosystems in a climate of peace and political stability. The challenges associated with achieving water security are unprecedented in scale and complexity (Bakker, 2012; Madani, 2026; Wheater & Gober, 2015).
In order to assess water security, several indices have been proposed over the last decades. One of the early assessments by Falkenmark et al. (1989), classifies nations into water stress categories based on per capita water availability. Subsequently, Sullivan et al. (2003) developed the Water Poverty Index, integrating resource, access, capacity, use, and environmental components to assess water stress at both household and community levels. More recently, Babel et al. (2020) proposed the Water Security Index, designed for applications at the municipal scale, the framework is structured into five dimensions and twelve indicators, without prescribing a fixed set of variables. Instead, it recommends that indicators comply with the SMART criteria (specific, measurable, attainable, relevant, and time-bound), ensuring flexibility and adaptability to different regional contexts. At the institutional level, the European Environmental Agency developed the Water Exploitation Index (European Environment Agency, 2011), with the goal of identifying European countries under the most water pressure, by balancing the demand and availability of water. At the global level, the World Resources Institute created the Overall Water Risk Indicator as part of the Aqueduct Water Risk Atlas (World Resources Institute, 2023), with the objective of mapping the regions of the planet with the highest risks related to water security. In Brazil, the National Water Security Plan (Agência Nacional de Águas e Saneamento Básico, 2019), created by the National Water and Basic Sanitation Agency (ANA), established the creation of the Water Security Index (ISH, Índice de Segurança Hídrica). From a methodological point of view, the index is composed of four dimensions: human, economic, ecosystem and resilience. Each dimension has its own related indicators and weights, comprising a total of eleven indicators.
Despite the importance of these indices for assessing water security, most of them offer only a portrait of reality constant over time, limiting their applicability in formulating dynamic water resource management strategies (Srinivasan et al., 2017). These frameworks often rely on long-term average values that mask the temporal and spatial variations for a true characterization of water security (Savenije, 2000).
For the Brazilian context, the limitations of time-invariant analyses are particularly critical given the documented acceleration of the hydrological cycle, with an increasing occurrence of floods and droughts across large portions of the territory (Chagas et al., 2022). Further investigation into the relative contribution and spatial expression of the ANA’s indicators could enhance the understanding of water insecurity drivers within the national framework. Research on the temporal dynamics of water security in Brazil has predominantly focused on future projections, which depend on climate models (Ballarin et al., 2023). Consequently, data-driven analysis of how water security has evolved in the recent past under observed hydrological, climatic and socioeconomic changes remains a research gap (Gesualdo et al., 2021).
Here, we address these research gaps through a twofold approach. First, we evaluate Brazil's official Water Security Index (ISH) by analyzing the spatial patterns and the relative importance of its indicators, thereby revealing strengths and limitations of the index. Second, we propose the new Temporal Water Security Index (TWSI) to investigate water security over time, allowing for a deeper examination of spatial and temporal variabilities of water security and extreme hydrological events. Using this new index, we conduct a retrospective analysis of Brazil's water security over the past three decades, identifying critical trends and vulnerable regions to support adaptive and evidence-based water management policies.
MATERIALS AND METHODS
Revisiting the Brazil’s Water Security Index (ISH)
The Water Security Index (ISH) is a tool of the National Water Security Plan (Agência Nacional de Águas e Saneamento Básico, 2020), developed by the Brazilian National Water and Basic Sanitation Agency (ANA) in partnership with the Ministry of Regional Development (MDR). The ISH is composed of four dimensions: human, economic, ecosystemic, and resilience. Each dimension is represented by specific indicators, totaling eleven across the four dimensions. These dimensions and their respective indicators are presented in Table 1. The indicators are classified into five levels, with level 5 corresponding to the highest degree of water security and level 1 to the lowest. The only exception is the indicator “Mining tailings dam safety,” which has only three levels.
Water Security Index indicators, according to the nomenclatures in the ISH Methodological Manual (Agência Nacional de Águas e Saneamento Básico, 2019).
For the ISH calculation, the pre-classified values of each of the eleven indicators are used, as available in ANA’s Metadata Portal (Agência Nacional de Águas e Saneamento Básico, 2020). The reproduction of the ISH, as well as the classification of indicators, dimensions, and the overall index, followed the guidelines of the ISH Methodological Manual (Agência Nacional de Águas e Saneamento Básico, 2019). The first dimension calculated was the human, whose initial area of application was the urban census mesh. Thus, the initial step was assigning the pre-classified variables to the polygons of the respective municipalities. Subsequently, the indicators were classified according to the classification matrix provided in the Methodological Manual (Agência Nacional de Águas e Saneamento Básico, 2019). The next step was to transfer the information to the ottobasins, proportionally to the urban population of each municipality. The final calculation of the human dimension was carried out in a weighted manner: when the supply indicator exceeded the supply network indicator, it received a weight of 70%; otherwise, only the value of supply was used.
Similarly to the human dimension, the economic dimension also has its variables at the municipal scale. However, in this case, the area of application refers to the entire municipal territory. Thus, the initial step was assigning the variables to the municipal polygons and subsequently classifying them according to the classification matrices. The irrigation and livestock indicator presents two classification levels: one related to irrigated agriculture and the other to livestock. Therefore, the indicator’s score is obtained through a weighted average, with 70% associated with irrigated agriculture and 30% with livestock. In cases where only one of the values is available, the absent one is assigned a score of 5. The following step was to transfer the information to the ottobasins, proportionally to the area of each municipality. Finally, the economic dimension was classified based on the minimum value between the water security levels of the indicators.
The ecosystemic and resilience dimensions were calculated using variables available at the ottobasins scale. In both cases, the variables were linked to the ottobasins polygons and the indicators classified according to the classification matrices. For the ecosystemic dimension, the water security level was defined by the simple average of the non-null indicators. For the resilience dimension, before defining the final score, two sub-dimensions were created: natural condition – obtained through the simple average of indicators natural storage, groundwater and rainfall variability – and artificial condition – corresponding directly to indicator artificial storage. Finally, the resilience water security level was defined in a weighted manner: when the artificial condition was lower than the natural condition, the score corresponded entirely to the natural condition; when the artificial condition was equal to or greater than the natural one, the score was defined as a weighted average, with 50% from the natural condition and 50% from the artificial condition.
In the final stage, with all the water security levels of the dimensions defined, the final ISH was calculated by the simple average of the non-null dimensions.
A large proportion of ottobasins have null values in the human dimension indicators, particularly for water supply (91.5%) and supply network (94.1%), as these variables are derived from urban census data and only represent urbanized areas when transferred to the ottobasin scale. Similarly, the mining dams indicator shows a high frequency of null values (97.7%), since it applies only to catchments containing tailings dams and their downstream reaches
Development of the Temporal Water Security Index (TWSI)
For the Temporal Water Security Index (TWSI), the same four dimensions established in the ANA’s original index and consistent with the United Nations Water (2013) definition of water security were maintained: human, economic, ecosystemic, and resilience. However, the indicators were created or adapted to ensure the development of an index that is applicable and replicable over time (Rafaai & Lee, 2024). Six indicators were selected and distributed among these dimensions. The human dimension includes two indicators: (i) water availability for the population and (ii) water supply network. The economic dimension is represented by the indicator of water availability for agriculture. The ecosystemic dimension is characterized by water quality, while the resilience dimension includes an indicator for floods and another for droughts. These resilience indicators were specifically selected to capture the effects of hydrological extremes, which are closely linked to climate change and play a critical role in shaping water security.
Among these six indicators, four were adapted from the original Water Security Index developed by ANA: water availability for the population, water supply network, water availability for agriculture, and water quality. Two additional indicators, floods and droughts, were incorporated to represent hydrological extremes that have increasingly affected Brazil in recent years (Anzolin et al., 2023; Chagas et al., 2024; Collischonn et al., 2025). These indicators were selected to directly represent impacts of hydrological extremes, which improves temporal comparability and supports the applicability of the index at the national scale. Together, these indicators enhance the link between the resilience dimension of water security and disaster risk reduction, as highlighted by Ward et al. (2020). Nevertheless, variables related to water storage capacity may provide important complementary information for resilience assessments in regions highly dependent on reservoirs, such as the Brazilian semi-arid region.
Unlike ANA’s index, the TWSI was designed to allow for a temporal assessment, enabling the evaluation of changes in water security over time. To achieve this, we prioritized data containing historical time series. The analysis was conducted over three reference decades: 1991–2000, 2001–2010, and 2011–2020.
For streamflow data, we adopt the CAMELS-BR database (Chagas et al., 2020) as the main source. The first step consisted of identifying valid catchments with consistent and continuous streamflow records across the three selected decades. To ensure temporal representativeness, only catchments with at least three consecutive years of valid daily discharge data within each decade were retained. This selection resulted in a dataset comprising 857 fluviometric stations, ensuring the robustness of the hydrological indicators derived in this study by excluding basins with incomplete or fragmented time series.
The indicators “water availability for the population” and “water availability for agriculture” required the computation of the water balance as an intermediate variable. The water balance was calculated as the ratio between water demand and water availability, representing the level of water use balance within each catchment.
For water demand, data was obtained from the Manual of Consumptive Water Use of the National Water and Basic Sanitation Agency (Agência Nacional de Águas e Saneamento Básico, 2021b). The data, originally available at the municipal scale for the years 2000, 2010, and 2020, was spatially adjusted to match the catchment boundaries. Demand values were then converted into equivalent discharge units (m3/s) to ensure comparability with the availability data. For water availability, the low-flow indicator Q5 (the discharge exceeded 95% of the time) was calculated for each decade. Flow duration curves were constructed for each year using daily streamflow data, and the median Q5 across all years within a decade was used as the representative value. This approach provided a robust characterization of minimum flow conditions and reduced the influence of extreme or atypical years (Vogel & Fennessey, 1994).
The ratio between water demand and water availability was computed for each catchment, producing the water balance. Since the index requires the water balance to be spatially continuous across the national territory, an ordinary kriging interpolation was applied. Before interpolating, the balance values were normalized using the Box–Cox transformation to approximate a normal distribution, and outliers were removed using z-score thresholds greater than 2 or lower than −2. Ordinary kriging was then performed independently for each decade using an exponential variogram model implemented through the autoKrige function from the automap package in R. The kappa parameter was automatically adjusted during variogram fitting. Considering the national scale of the analysis, a fixed block size of 500 km was adopted for interpolation, and the resulting raster was exported with a spatial resolution of 5 km. The kriging results are presented in the Supplementary Material. The resulting interpolated surfaces were overlaid with the Ottobasins Hydrographic System and municipal boundaries, assigning average balance values to each polygon centroid. This process enabled the consistent inclusion of the hydrological balance in multiple indicators of the TWSI and provided a unified spatial representation of water stress across Brazil.
The water availability for the population indicator was obtained by combining demographic data from the Brazilian Institute of Geography and Statistics (IBGE) with the water balance. Population data for the census years 2000, 2010, and 2022 were multiplied by the corresponding water balance values to estimate total and per capita water availability under local demand.
The water availability for agriculture and livestock indicator followed a similar procedure. Agricultural production values from the Municipal Agricultural Production database of IBGE were used to represent irrigation demand instead of population data. The crops considered were rice, sugarcane, and coffee, which together account for most of the irrigation water use in Brazil (Agência Nacional de Águas e Saneamento Básico, 2021a). Production values for 2000, 2010, and 2022 were summed for each municipality and combined with the hydrological balance to estimate the effective water balance for the agricultural sector.
The water supply network indicator represents the proportion of the population served by public water distribution systems. Data were obtained from the National Sanitation Information System (Sistema Nacional de Informações sobre Saneamento Básico, 2022), specifically the variable “total water supply coverage index”, which expresses the percentage of the population with access to piped water in each municipality. Data was extracted for 2001, 2010, and 2022, since the dataset for 2000 presented insufficient spatial coverage.
For all three indicators, municipal results were spatially integrated with the Ottobasins Hydrographic System. The intersection between municipal and hydrological boundaries generated proportional area weights, and weighted averages were computed to aggregate values at the ottobasin level.
The floods and droughts indicators were developed to represent hydrological extremes across Brazilian catchments using streamflow data from the CAMELS-BR database (Chagas et al., 2020). For each catchment, the 10th percentile flow (Q10) and the 90th percentile flow (Q90) were calculated from the entire historical record to establish stable long-term reference thresholds. Flood events were defined as daily discharges exceeding the Q90, while droughts corresponded to periods in which the 7-day moving average of discharge remained below the Q10 for at least seven consecutive days. These definitions ensured temporal consistency and comparability across decades (1991–2000, 2001–2010, and 2011–2020).
For floods, the events were selected using a peaks-over-threshold approach allowing a minimum time lag between consecutive peaks, ensuring that each event represents a distinct hydrological response, following the recommendations of Lang et al. (1999). The time lag (in days) was estimated as 5 + ln (catchment area). For droughts, the mean duration of low-flow events was computed for each decade, representing the persistence of dry periods. Both metrics were spatialized through ordinary kriging interpolation to generate continuous national-scale surfaces of flood and drought occurrence, following the same preprocessing and interpolation procedures adopted for the water balance interpolation. The kriging results are presented in the Supplementary Material. The interpolated results were integrated with the Ottobasins Hydrographic System, where average values were assigned to each ottobasin to ensure spatial consistency with the other indicators of the TWSI.
The water quality indicator was maintained in the TWSI due to its essential role in assessing the overall state of water security (Jones et al., 2024), despite the absence of temporal variation for this component. As a result, changes in the TWSI over time are driven by the remaining dynamic indicators. The availability of large-scale water quality data in Brazil did not allow for the construction of a consistent historical series comparable across the selected decades (Thomaz et al., 2024). Therefore, the indicator was adopted directly from the original index developed by the National Water and Basic Sanitation Agency (Agência Nacional de Águas e Saneamento Básico, 2020), which uses biochemical oxygen demand (BOD) as the proxy for water quality, a methodological choice supported in the literature (Almeida et al., 2023). This simplification may not fully capture the ecosystem dimension of water security, which remains an important limitation of the proposed framework.
All indicators were classified into five water security levels, ranging from 1 (lowest water security) to 5 (highest water security). For most indicators, classification thresholds were defined based on quintile distributions (20% intervals) calculated from the aggregated values across the three decades. In the case of the indicators “water availability for the population” and “water availability for agriculture and livestock,” a decision matrix combining total and per capita (or production-based) availability was applied to determine the final security class. For the water supply network, predefined percentage ranges were adopted to represent coverage levels, while the floods and droughts indicators were classified using the same quantile-based approach. After standardizing all indicators, the four dimensions of water security (human, economic, ecosystemic, and resilience) were first calculated as the arithmetic means of their respective indicators. Subsequently, the overall Temporal Water Security Index was obtained as the arithmetic mean of the non-null dimension values for each ottobasin and decade, providing an integrated measure of water security across the Brazilian territory.
Spatial unity of analysis
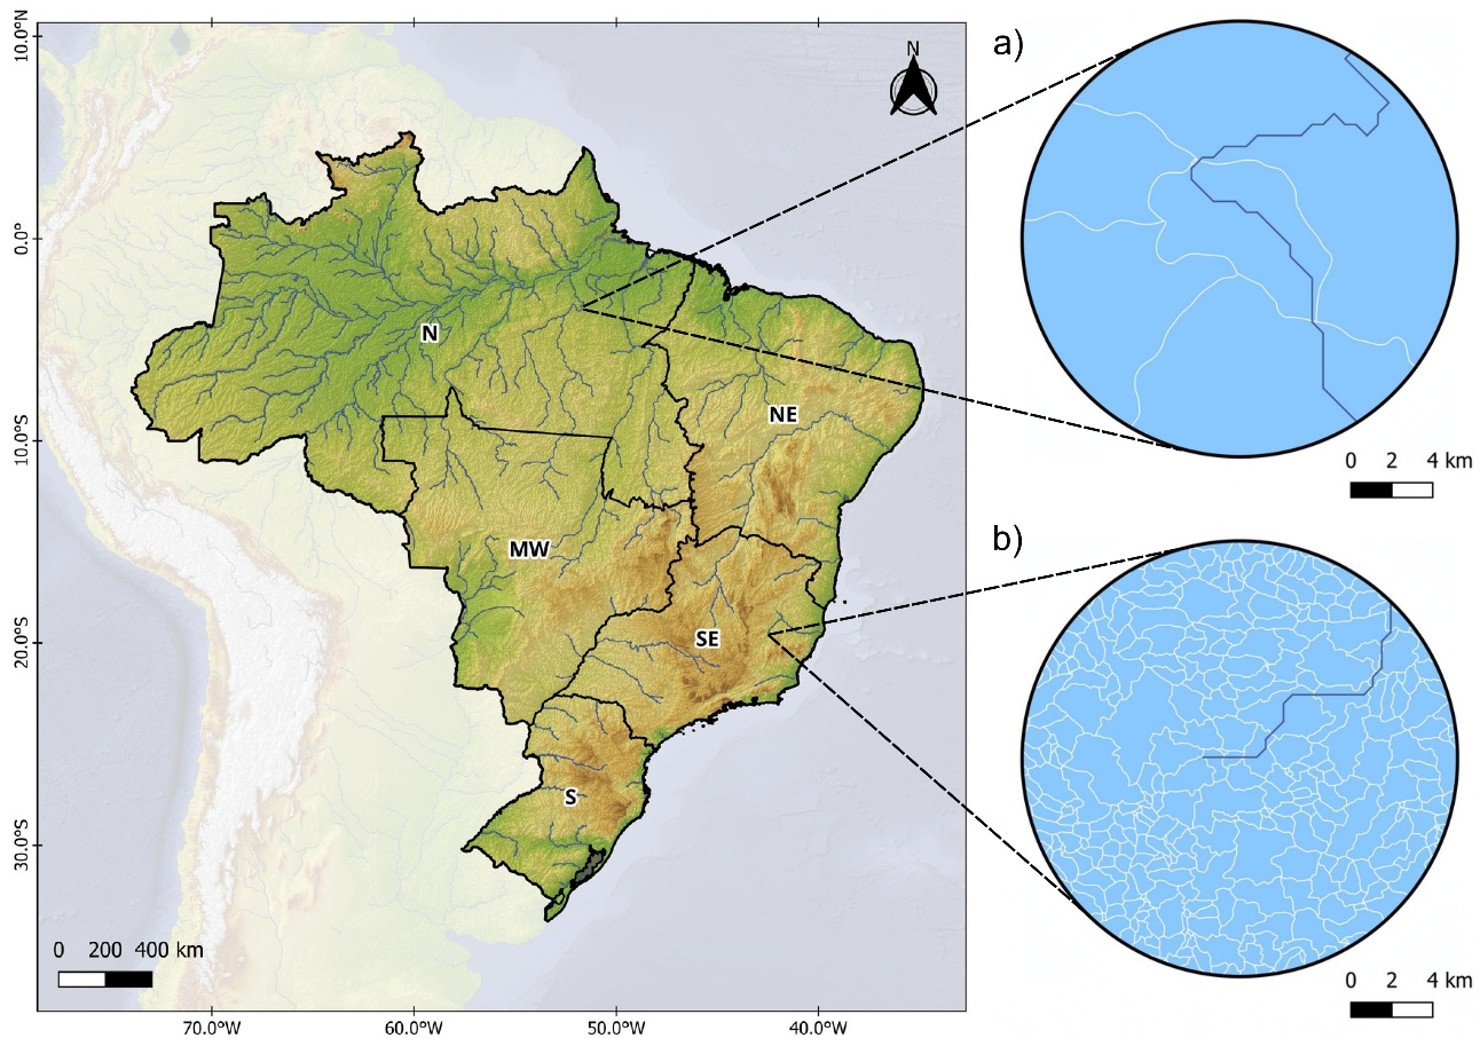
We use ottobasins as the basic spatial unit (Figure 1). It is derived from the Pfafstetter Coding Method (Pfafstetter, 1989) to establish a hierarchical and topologically consistent classification of river basins. The drainage network is encoded using a hierarchical decimal system, in which each additional digit represents a nested sub-basin within the main system, allowing upstream–downstream relationships to be directly inferred from the basin code (Pfafstetter, 1989).
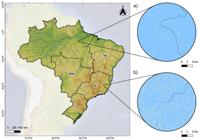
Spatial distribution of ottobasins across Brazil at different map scales. Panels (a) and (b) show different regions at the same scale, highlighting regional differences in ottobasins density. Blue lines represent the main hydrographic network, while white lines indicate ottobasins boundaries. Regional abbreviations: N – North, NE – Northeast, MW – Midwest, SE – Southeast, S – South.
This method was adapted by the National Water and Basic Sanitation Agency (ANA) to organize Brazil’s hydrographic network into the Ottobasins Hydrographic System, a standardized multi-scale framework for hydrological analysis. The system subdivides drainage basins hierarchically, enabling consistent spatial analyses and the integration of hydrological, environmental, and socioeconomic data. In this study, fifth-level ottobasins were adopted as the analytical unit, consistent with the level used by ANA in the Water Security Index (ISH), totaling 562,279 ottobasins across Brazil.
Correlation analysis of index indicator
To better understand the dynamics and interrelationships among the indicators that compose the Water Security Index (ISH), and to identify potential redundancies among indicators representing similar information, two complementary analyses were performed. First, the relative frequencies of non-null values were calculated for each indicator, where null ottobasins represent areas without available data or where the indicator is not applicable. The relative frequency analysis helped identify indicators with potential data sparsity issues and ensure comparability across the index components.
Subsequently, we compute the correlation among indicators including all ottobasins. For this purpose, we use the Kendall rank correlation coefficient, as it provides a more representative measure for discrete samples and frequently tied ranks (Kendall, 1945). Kendall’s rank correlation coefficients were computed between all pairs of indicators, considering only complete pairs of observations.
RESULTS AND DISCUSSION
Comparison of two water security indices
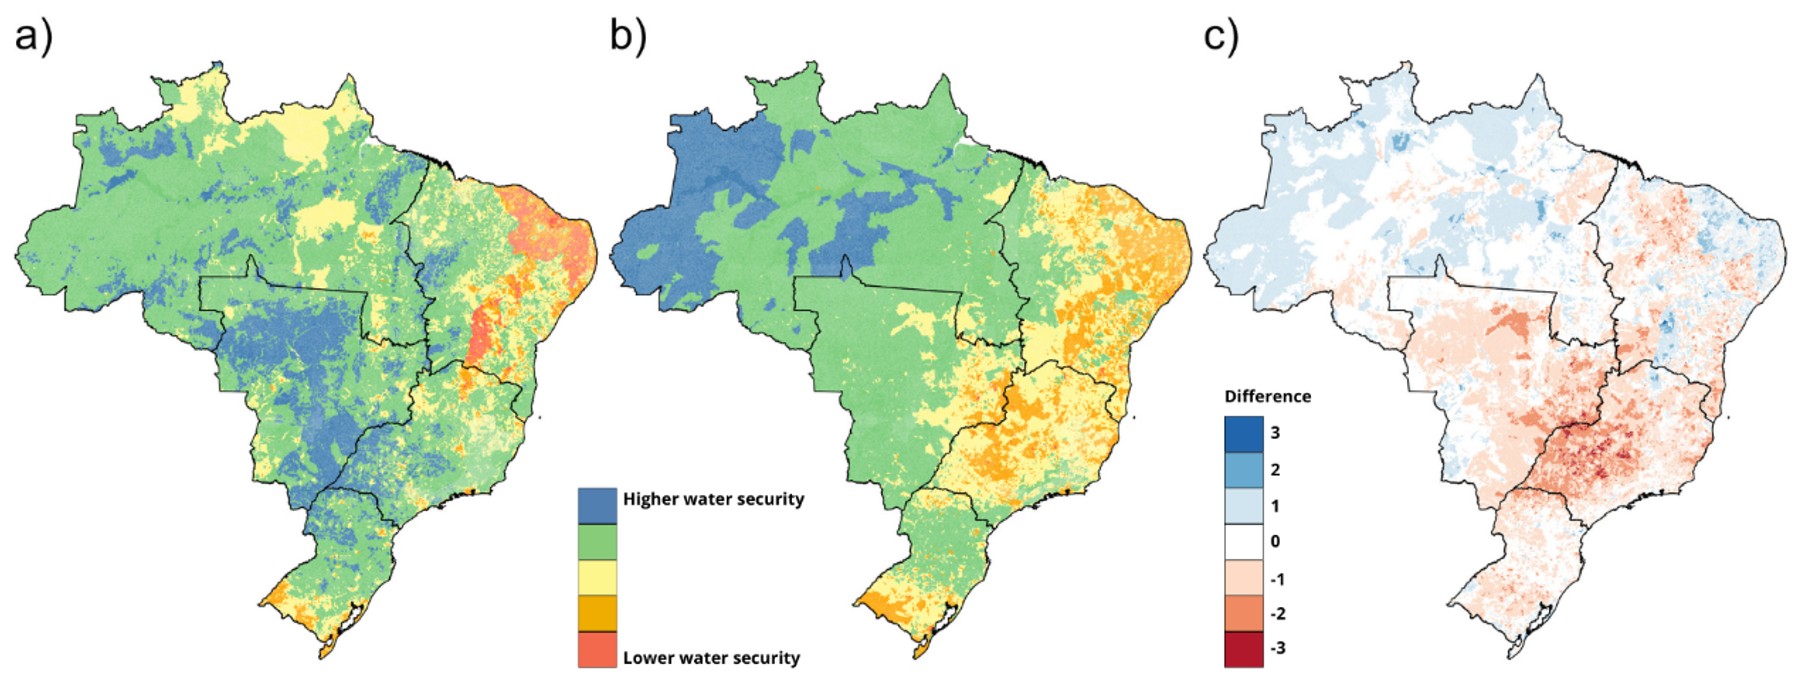
A total of 41.4% of the ottobasins had the same water security level between the ANA’s Index and the Temporal Water Security Index (TWSI) (Figure 2). In contrast, 32.1% of the ottobasins had a one-level lower water security in the TWSI, mostly concentrated in the Southeast (SE) region. The SE had a lower water security, with 55.8% of the ottobasins. This decline may be related to the adopted methodology, in which the population and agriculture indicators likely contributed to lowering the overall index values. Conversely, 19.5% of the ottobasins showed an improvement of one level in water security in the TWSI, particularly in the Northeast (NE) region, where 45.9% of the ottobasins presented an increase. This change can be associated mainly with the flood indicator, which showed more favorable values during the last decade in the NE. However, it is important to note that the Northeast region, particularly the semi-arid area, is characterized by strong interannual climate variability (Giannini et al., 2004; Rodrigues & McPhaden, 2014), which may lead to pronounced temporal fluctuations in the TWSI.
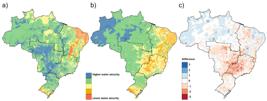
Comparison of water security indices across Brazil. (a) ANA’s water security index; (b) Temporal Water Security Index for the period of 2011-2020; (c) Difference between the two indices, where positive values (blue) indicate higher water security in the new assessment and negative values (red) represent a decline.
Compared to ANA’s index, the TWSI exhibits smoother spatial transitions in water security levels, reflecting a more consistent regional pattern. This behavior is partly explained by the careful evaluation of individual indicators and the adoption of a reduced and non-redundant set of variables, excluding highly correlated or low-contribution indicators. As a result, the TWSI represents a more parsimonious index, capable of capturing key aspects of water security using fewer inputs, which contributes to reduced uncertainty and improved interpretability. One notable outcome of this approach is the near absence of ottobasins classified in the lowest security class in the TWSI, alongside a smaller proportion of ottobasins in the highest class. Despite these differences, both indices display similar large-scale spatial patterns, while the TWSI provides a more up-to-date and methodologically consistent representation of Brazil’s hydrological and socioeconomic conditions.
Overall, the main purpose of the TWSI is to provide a complementary perspective on water security by incorporating temporal assessment and hydrological extremes. Although several global water security indices have been proposed in the literature, the comparison with the ANA’ index was prioritized due to its national-scale applicability and widespread use in Brazil. Nevertheless, further evaluations comparing the TWSI with alternative approaches, as well as applications at local scales, would be valuable to further refine and strengthen the proposed framework.
Temporal patterns of water security in Brazil
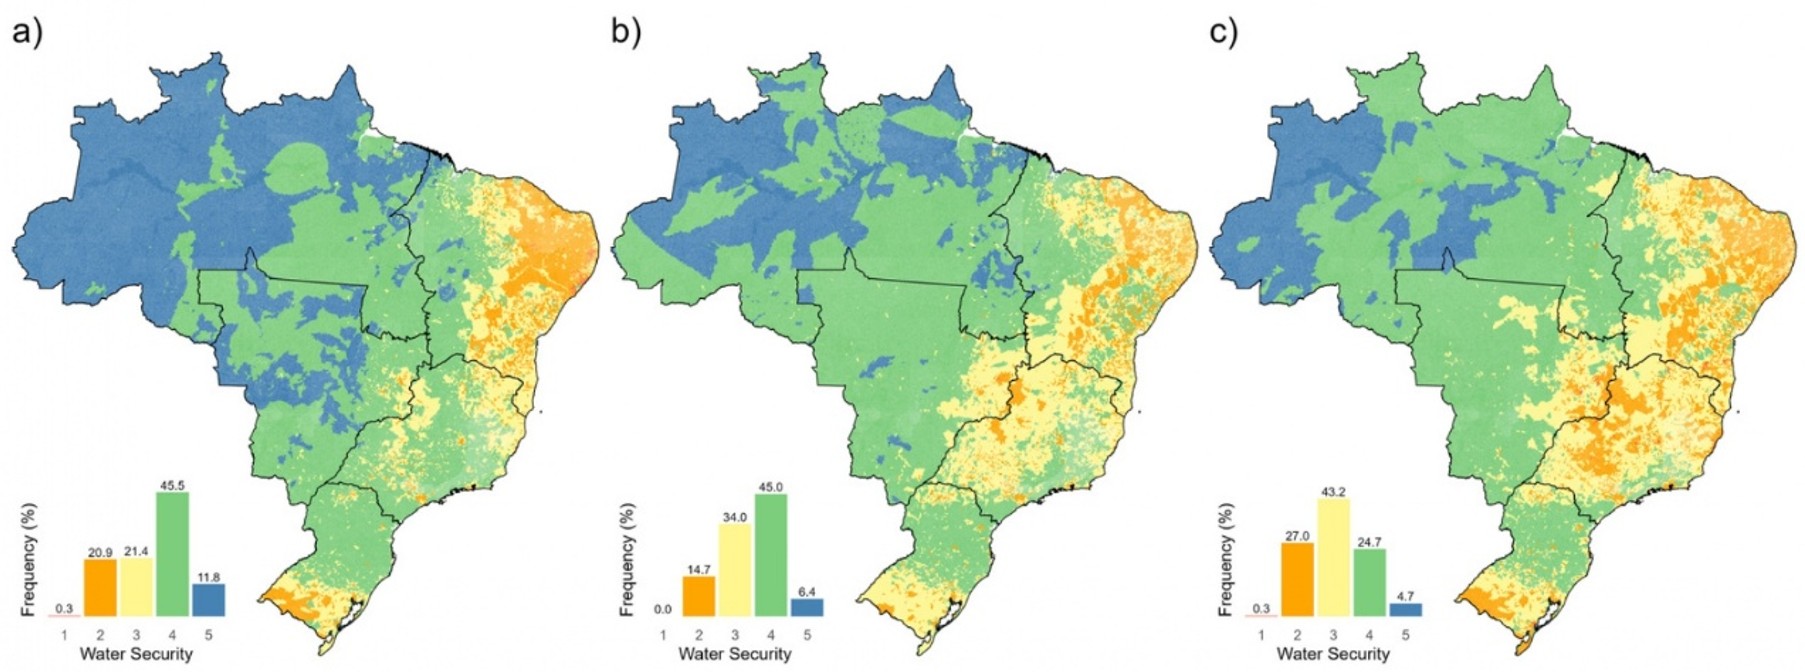
The proposed TWSI reveals that the proportion of ottobasins classified in the highest water security levels, i.e. levels 4 and 5, decreased by 27.9 percentage points from the first to the last decade (Figure 3). During 1991-2000, these classes represented 57.3% of the ottobasins, but by the last decade (2011-2020), this share had dropped to 29.4%. In contrast, the classes representing the lowest water security levels (1 and 2) increased from 21.2% in the first decade to 27.3% in the last. Similar results were reported by Ballarin et al. (2023), who also identified a declining trend in water security.
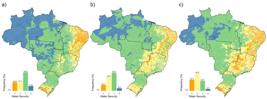
Spatial and frequency distributions of the overall Temporal Water Security Index (TWSI) for the three-reference period, illustrating the temporal evolution of water security levels across Brazilian ottobasins. (a) 1991-2000; (b) 2001-2010; (c) 2011-2020.
Regionally, Southeast Brazil exhibited the highest concentration of ottobasins with reduced water security, with 65.8% of the ottobasins experiencing a decrease from the first to the last decade. This region also showed the largest overall decline among all five regions, with a reduction of 0.68 points in the mean TWSI (Table 2). The Midwest followed, with 43.0% of ottobasins showing a decrease and a mean reduction of 0.48 points, while the North recorded a decrease in 41.3% of ottobasins and a reduction of 0.40 points. These three regions have recently experienced documented water-use conflicts, reflecting increasing pressure on water resources (Peixoto et al., 2021).
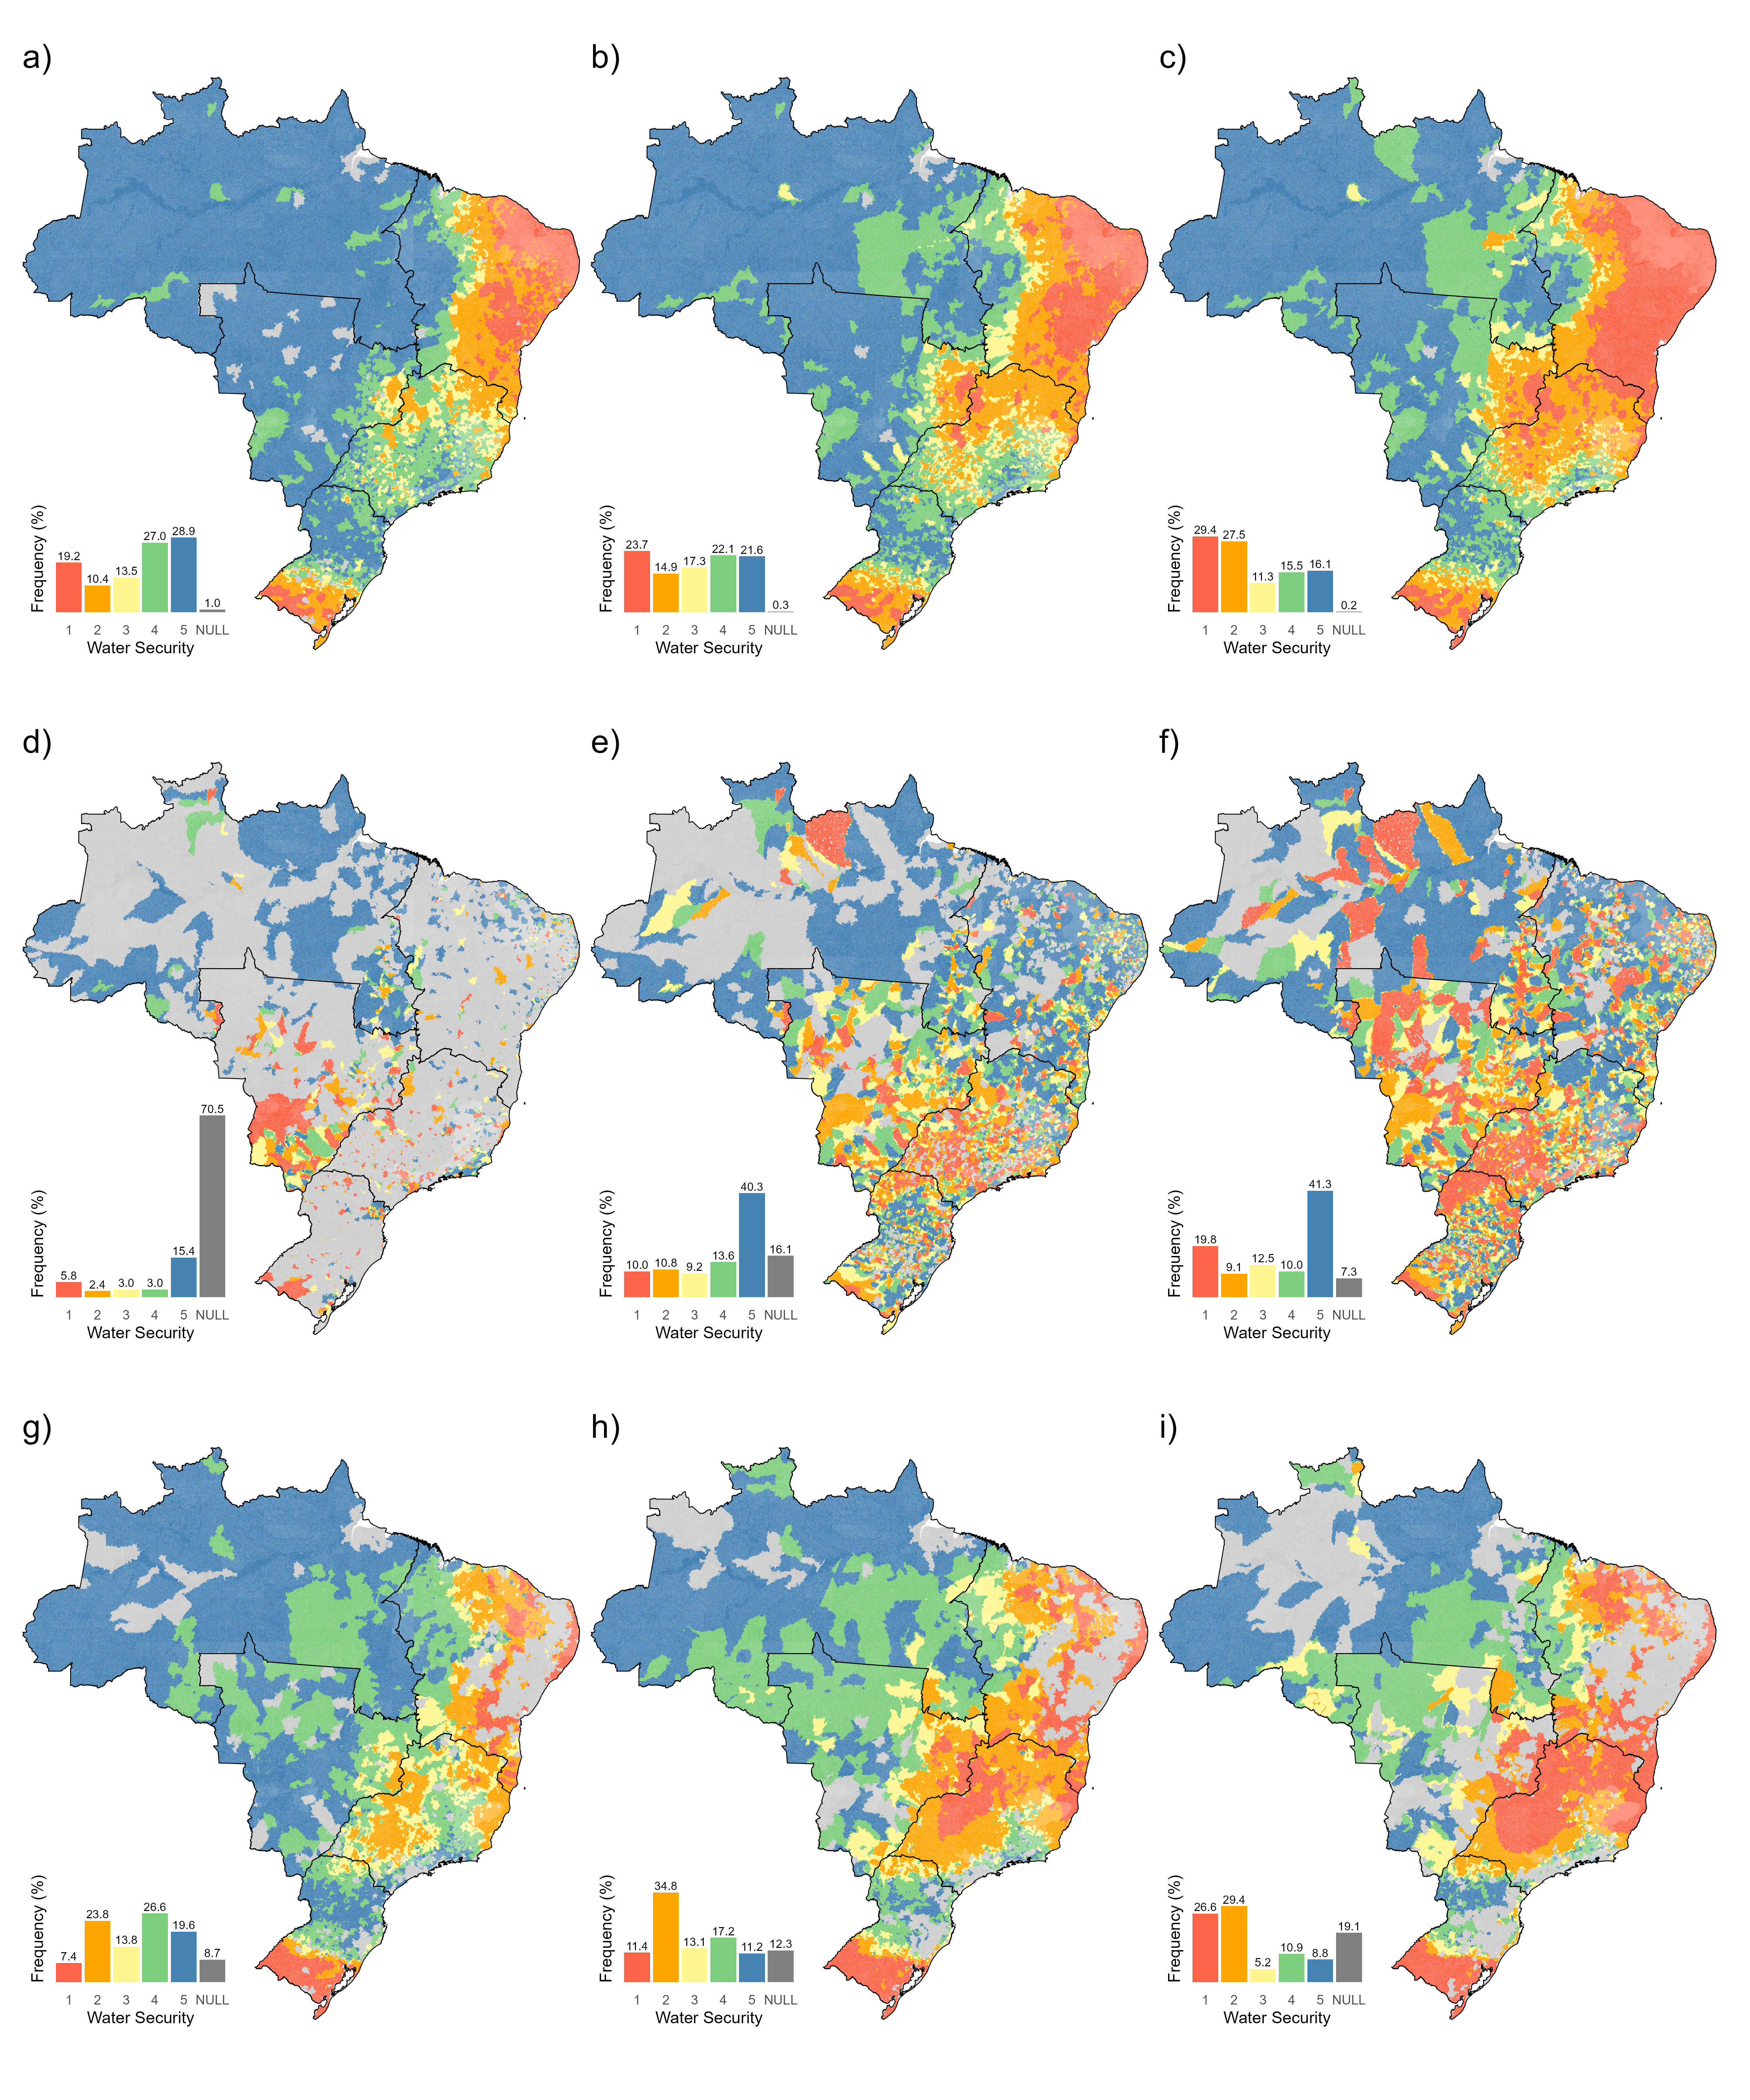
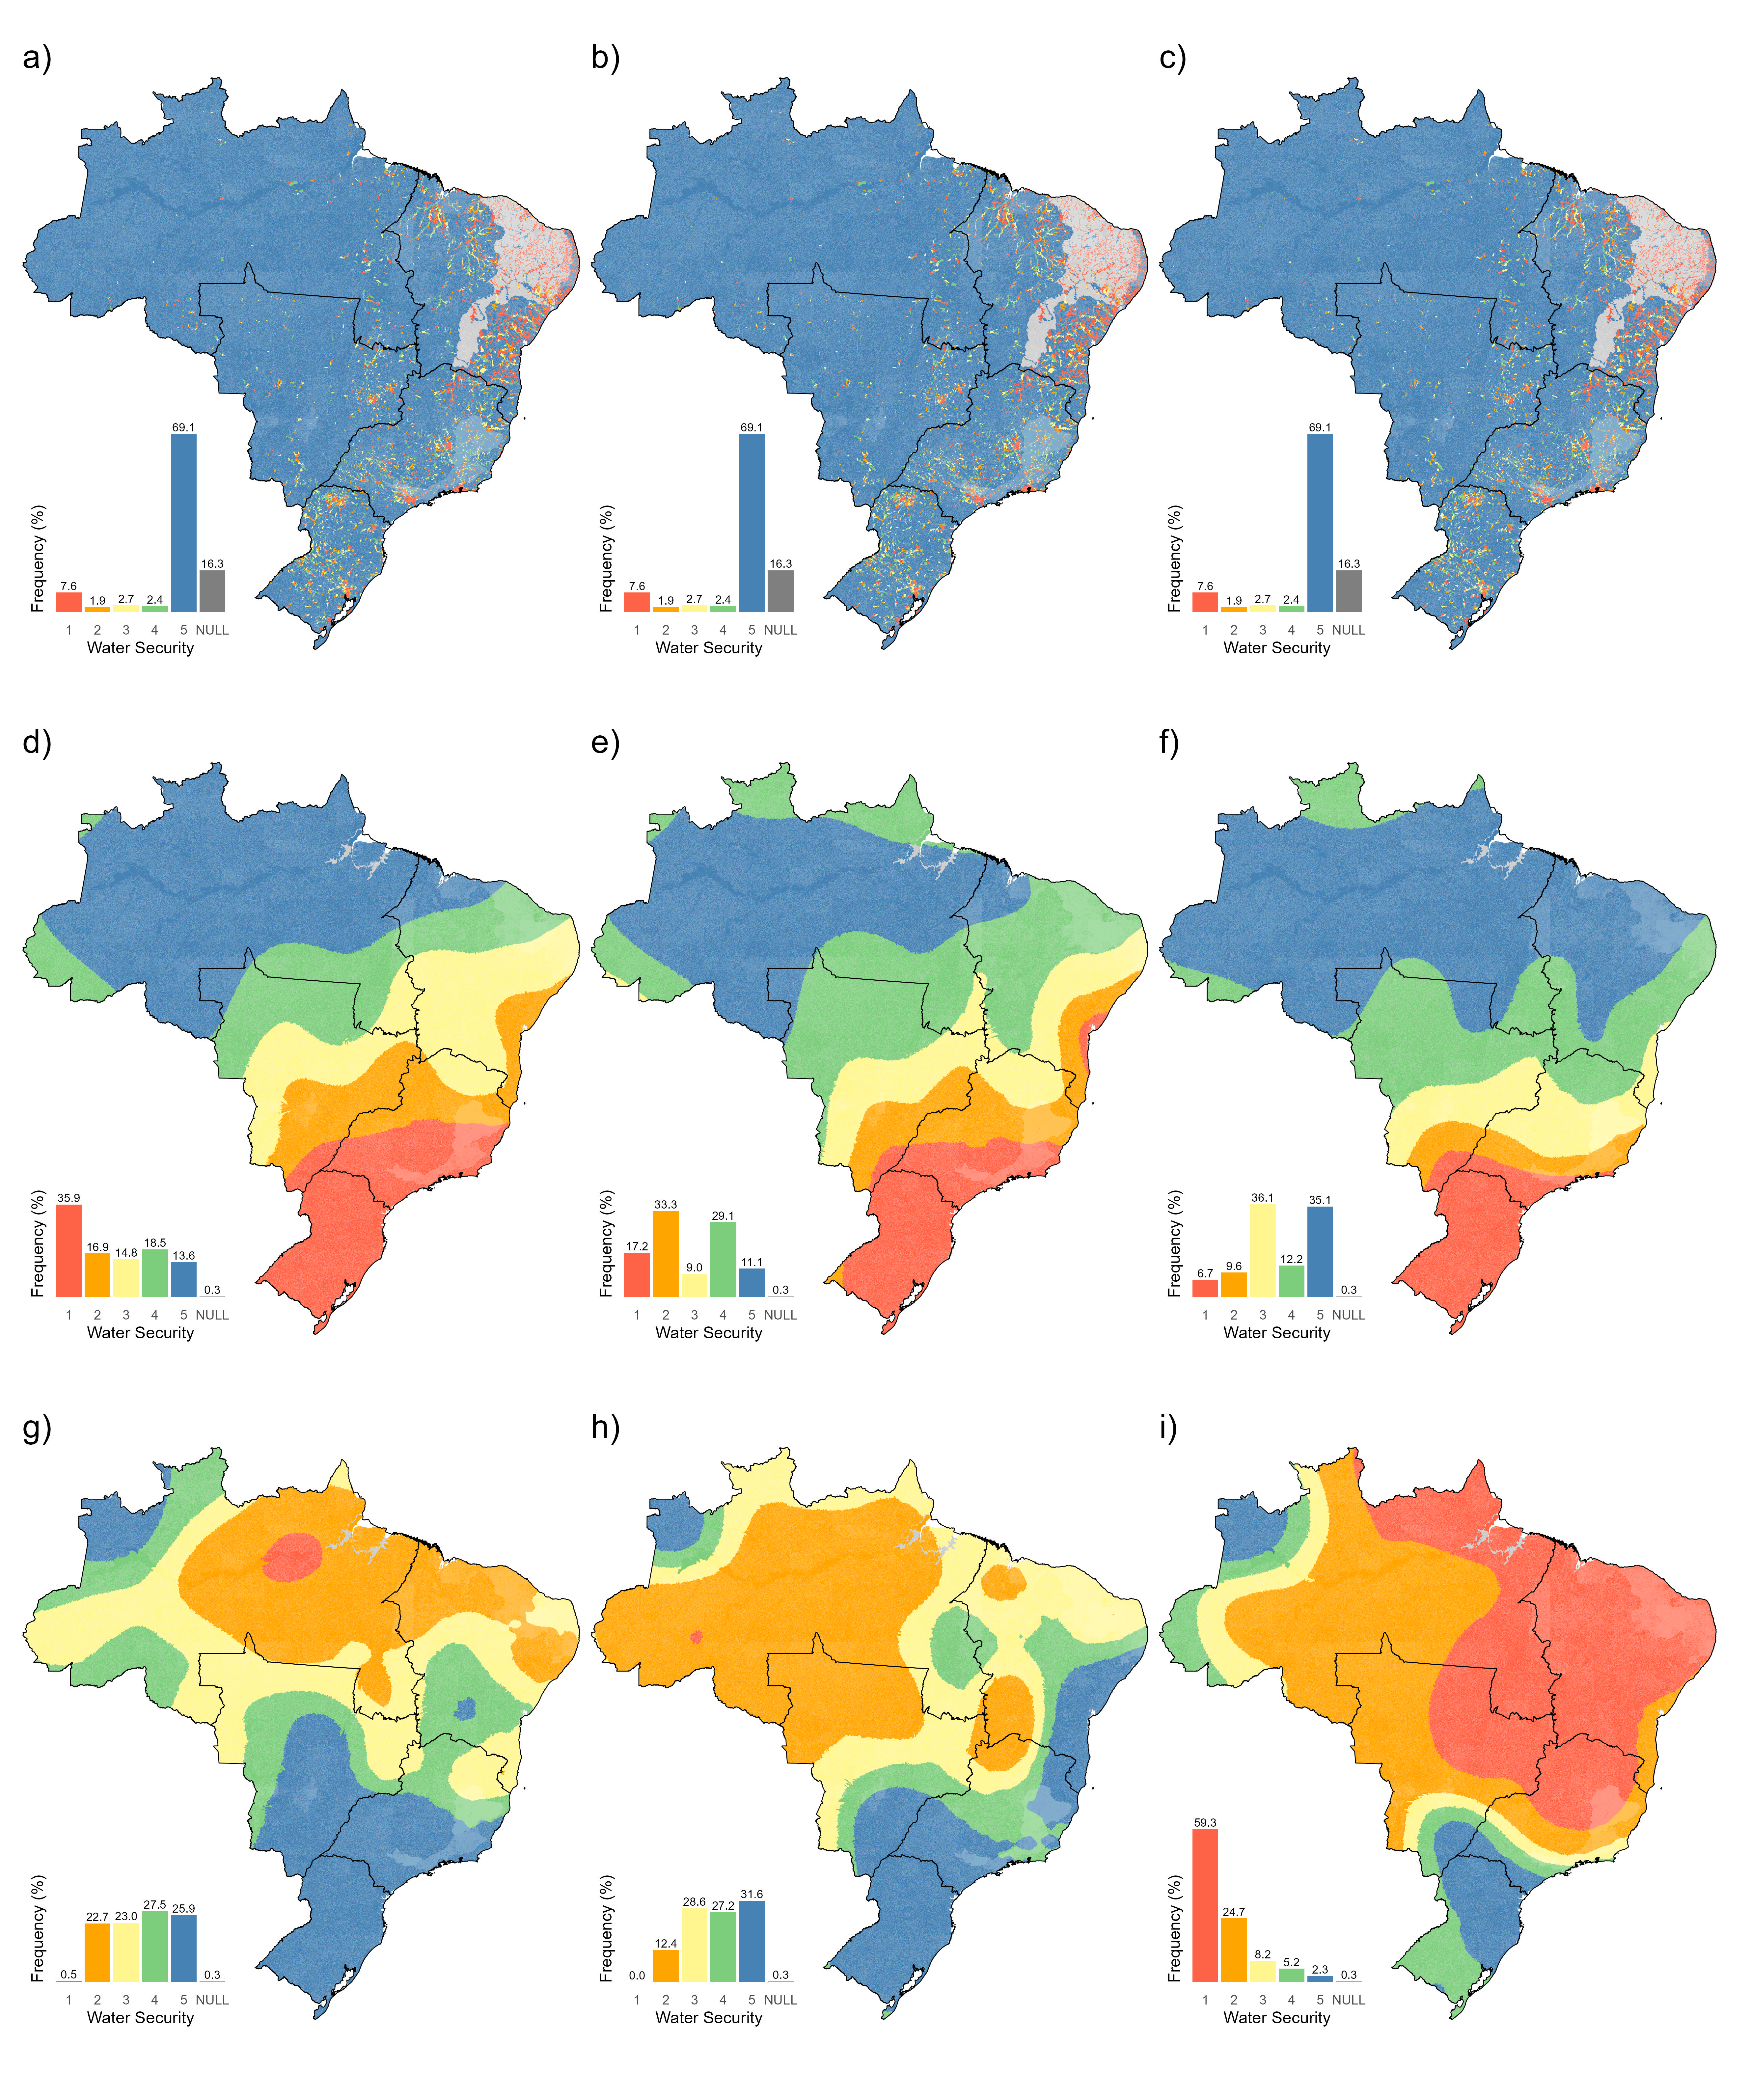
To better understand these patterns, we examine the indicators of the TWSI individually. The indicators displayed distinct behaviors over time, reflecting the different drivers of water security within each dimension. For instance, the population indicator (Figure 4) showed a pronounced decline in water security levels. In the first decade (1991–2000), 28.9% of the ottobasins were classified in the highest security category, whereas in the last period (2011–2020), this proportion decreased to 16.1%. In contrast, the combined share of ottobasins in the lowest security levels (1 and 2) increased substantially, rising from 29.6% in the first period to 56.9% in the last.
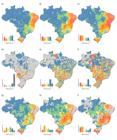
Spatial patterns and frequency distributions of the population (a–c), water supply (d–f), and agriculture (g–i) indicators across the three reference periods. Panels (a), (d), (g) corresponds to 1991–2000; (b), (e), (h) to 2001–2010; and (c), (f), (i) to 2011–2020.
This reduction in water security suggests growing pressure on water availability for the population, likely driven by demographic expansion and the increasing demand associated with urbanization. The population indicator is therefore a key component of water security assessments, as it captures the interaction between human demand and available water resources, a relationship widely recognized as a critical driver of water security (Veettil & Mishra, 2018).
The Southeast region had the largest share of ottobasins with declining water security. Approximately 86% of the ottobasins in this region experienced a reduction from the first to the last decade, with an average decrease of 1.38 security level. This pattern is linked to the high demographic pressure in states such as São Paulo, where intense urbanization and growing water demand have contributed to recurrent water crises (de Paula & Formiga-Johnsson, 2023; Soriano et al., 2016).
The water supply indicator (Figure 4) showed a substantial decrease in the proportion of ottobasins with null values. In the first decade, 70.5% of the ottobasins had no available data, whereas in the last decade this proportion dropped to 7.3%. This reduction reflects an increasing capacity of municipalities, over recent decades, to monitor and report water supply coverage. However, although this improvement in data availability is relevant, it represents only an initial step. Ideally, an increase in the proportion of ottobasins classified in the highest water supply class would also be observed, which shows little change from the second to the third decade.
The agriculture indicator (Figure 4) shows a 24.8% increase in the proportion of ottobasins classified in the lower security levels (1 and 2) from the first to the third decade. Once again, the Southeast region exhibited the largest share of ottobasins with declining conditions, with 91.5% showing some level of decrease. The Midwest ranked second, with 59.5% of the ottobasins presenting a reduction in the agriculture indicator, a pattern consistent with the expansion of agricultural activities observed in the region over recent decades (Oliveira et al., 2022).
In the floods indicator (Figure 5), almost all ottobasins in the South region remained in the lowest water security level throughout the three decades, reflecting persistent vulnerability to flood-related impacts in the region (Anzolin et al., 2023). In contrast, the Northeast exhibited improvements in flood-related water security, with 91.8% of its ottobasins showing an average increase of 1.24 security levels over time. This pattern is consistent with observed changes in high-flow extremes reported for northeastern Brazil (Souza & Reis Junior, 2022).
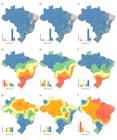
Spatial patterns and frequency distributions of the quality (a–c), floods (d–f), and droughts (g–i) indicators across the three reference periods. Panels (a), (d), (g) corresponds to 1991–2000; (b), (e), (h) to 2001–2010; and (c), (f), (i) to 2011–2020.
The proportion of ottobasins classified in the lowest water security level of the droughts indicator increased by 58.8 percentage points from the first to the last decade (Figure 5), indicating a marked decline in drought-related water security across Brazil. The Southeast region experienced the most pronounced reduction, with 99.3% of its ottobasins showing a decrease and an average drop of 2.56 levels. In the Northeast, 99.9% of the ottobasins also exhibited a decline, although the average reduction was smaller, at 1.46 levels. The Midwest region presented a similar pattern, with 95.6% of the ottobasins showing a decrease, with an average reduction of 2.05 levels. In the North, 60.2% of the ottobasins recorded a decline, with an average reduction of 1.25 levels. The South region showed the smallest variation, where 44.2% of the ottobasins experienced a reduction of approximately one level, while 55.8% remained unchanged.
These results for the Southeast and Northeast regions are consistent with findings from Chagas et al. (2024), which report an intensification of extreme drought events in recent decades. This pattern is also coherent with the historical susceptibility of the Northeast to drought events (Pereira et al., 2025; Silva et al., 2025). Although droughts are a major concern in the region, they are not the only factor affecting water security, as other studies have pointed to additional challenges such as water management and distribution issues (Silva & Ribeiro, 2025).
Taken together, the contrasting behavior of the floods and droughts indicators in the South and Northeast regions reveals an asymmetric water security challenge. In the South, the floods indicator consistently placed most ottobasins in the lowest water security level, indicating persistent vulnerability to flood events, while drought-related conditions showed comparatively limited deterioration over time. In contrast, the Northeast exhibited a more favorable pattern for flood-related water security but experienced a pronounced decline in the drought indicator. This contrast suggests that, from a water resources planning perspective, these regions have historically been required to allocate substantial resources to cope with the impacts of their dominant hydrological extremes, with flood-related damages prevailing in the South and drought-related impacts more prominent in the Northeast.
Indicators’ influence on the Temporal Water Security Index
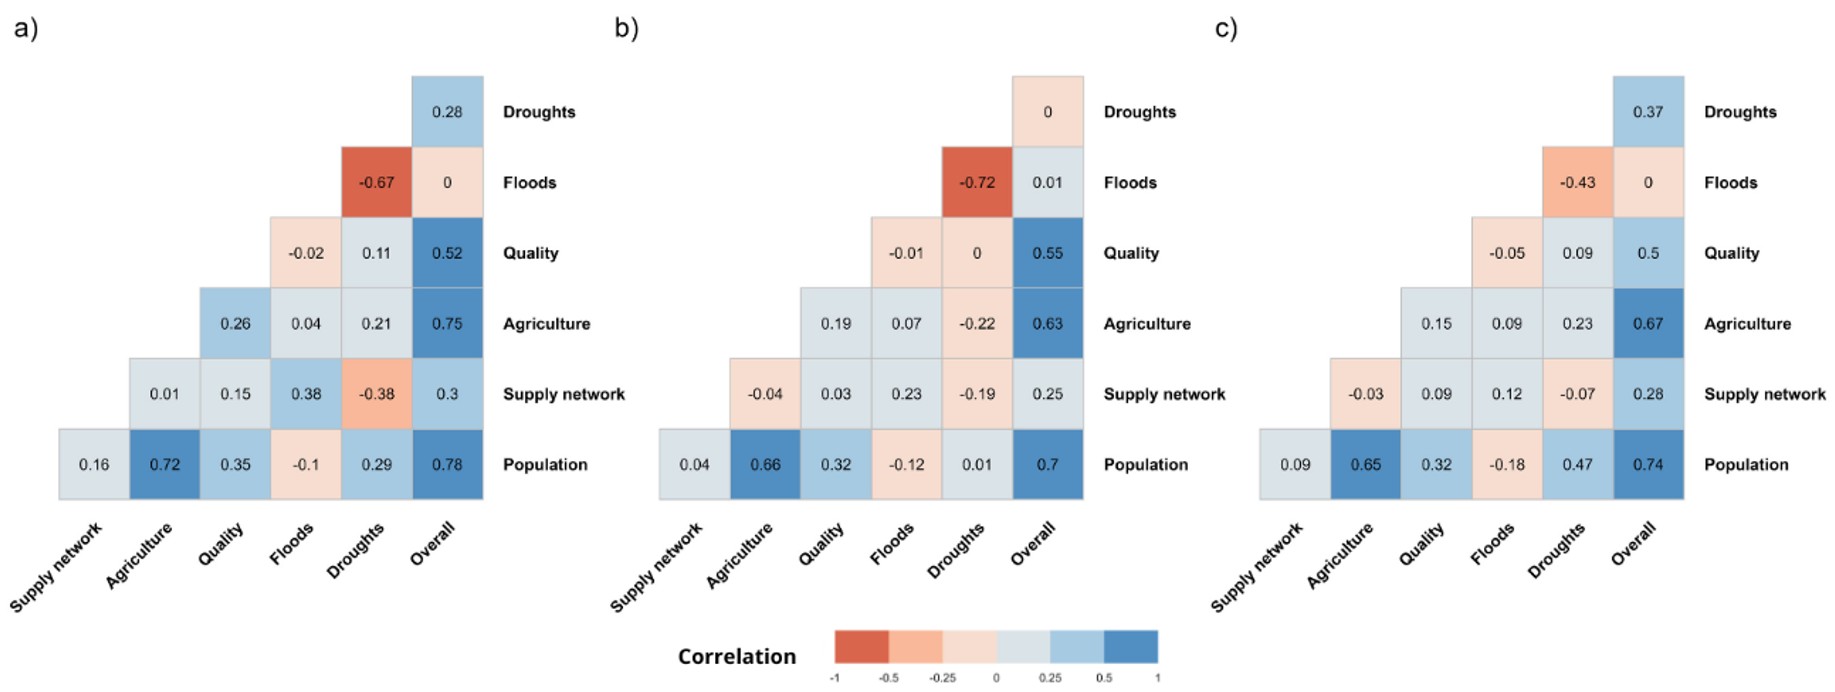
The flood and drought indicators exhibit negative correlations, although this relationship weakens over time, decreasing from –0.67 in the first period to –0.43 in the last period (Figure 6). This gradual reduction suggests that regions previously dominated by a single type of hydrological extremes (either floods or droughts) are increasingly experiencing the coexistence or alternation of both phenomena in short periods of time. This pattern aligns with the findings of Chagas et al. (2022), which identified that approximately 29% of Brazil’s territory shows signs of an accelerating water cycle, characterized by the simultaneous intensification of floods and droughts.
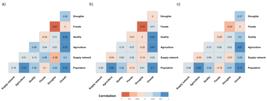
Correlation matrices among the indicators of the Temporal Water Security Index (TWSI) for the three reference decades: (a) 1991-2000; (b) 2001-2010; (c) 2011-2020. The “Overall” column represents the correlation between each indicator and the final TWSI score. All correlations are statistically significant at the 1% level. Positive correlations are shown in blue and negative correlations in red. The color intensity indicates the strength of the relationship, with darker tones representing stronger correlations.
The agriculture and population indicators show the highest correlations with the overall index (i.e. the final TWSI value), with correlation coefficients of 0.75, 0.63, and 0.67 for the three decades respectively for the agriculture indicator, and 0.78, 0.70, and 0.74 for the population indicator. These indicators are also positively correlated with each other (r = 0.72, 0.66, and 0.65 for each decade), a pattern likely influenced by the adopted methodology, which uses the water balance as a preliminary variable, thereby linking demographic pressure and agricultural demand to hydrological availability.
Despite belonging to the same human dimension, the supply network and population indicators showed low correlation values (0.16, 0.04, and 0.09). This suggests that even when water availability for the population evolves in a given direction, infrastructure development does not necessarily follow the same trend. Such divergence reinforces the importance of both indicators within the human dimension, as they capture distinct yet critical aspects of water security.
In general, although some indicators exhibit strong correlations with the overall TWSI across the three decades, they do not necessarily present high correlations among themselves. This indicates that TWSI is able to capture complementary and distinct characteristics of the four dimensions of water security, rather than redundantly representing the same processes. Consequently, even with a reduced number of indicators compared to the ANA’s index, the TWSI preserves a multidimensional representation of water security, enhancing parsimony while maintaining interpretative robustness.
Indicators influence on the ANA’s Index
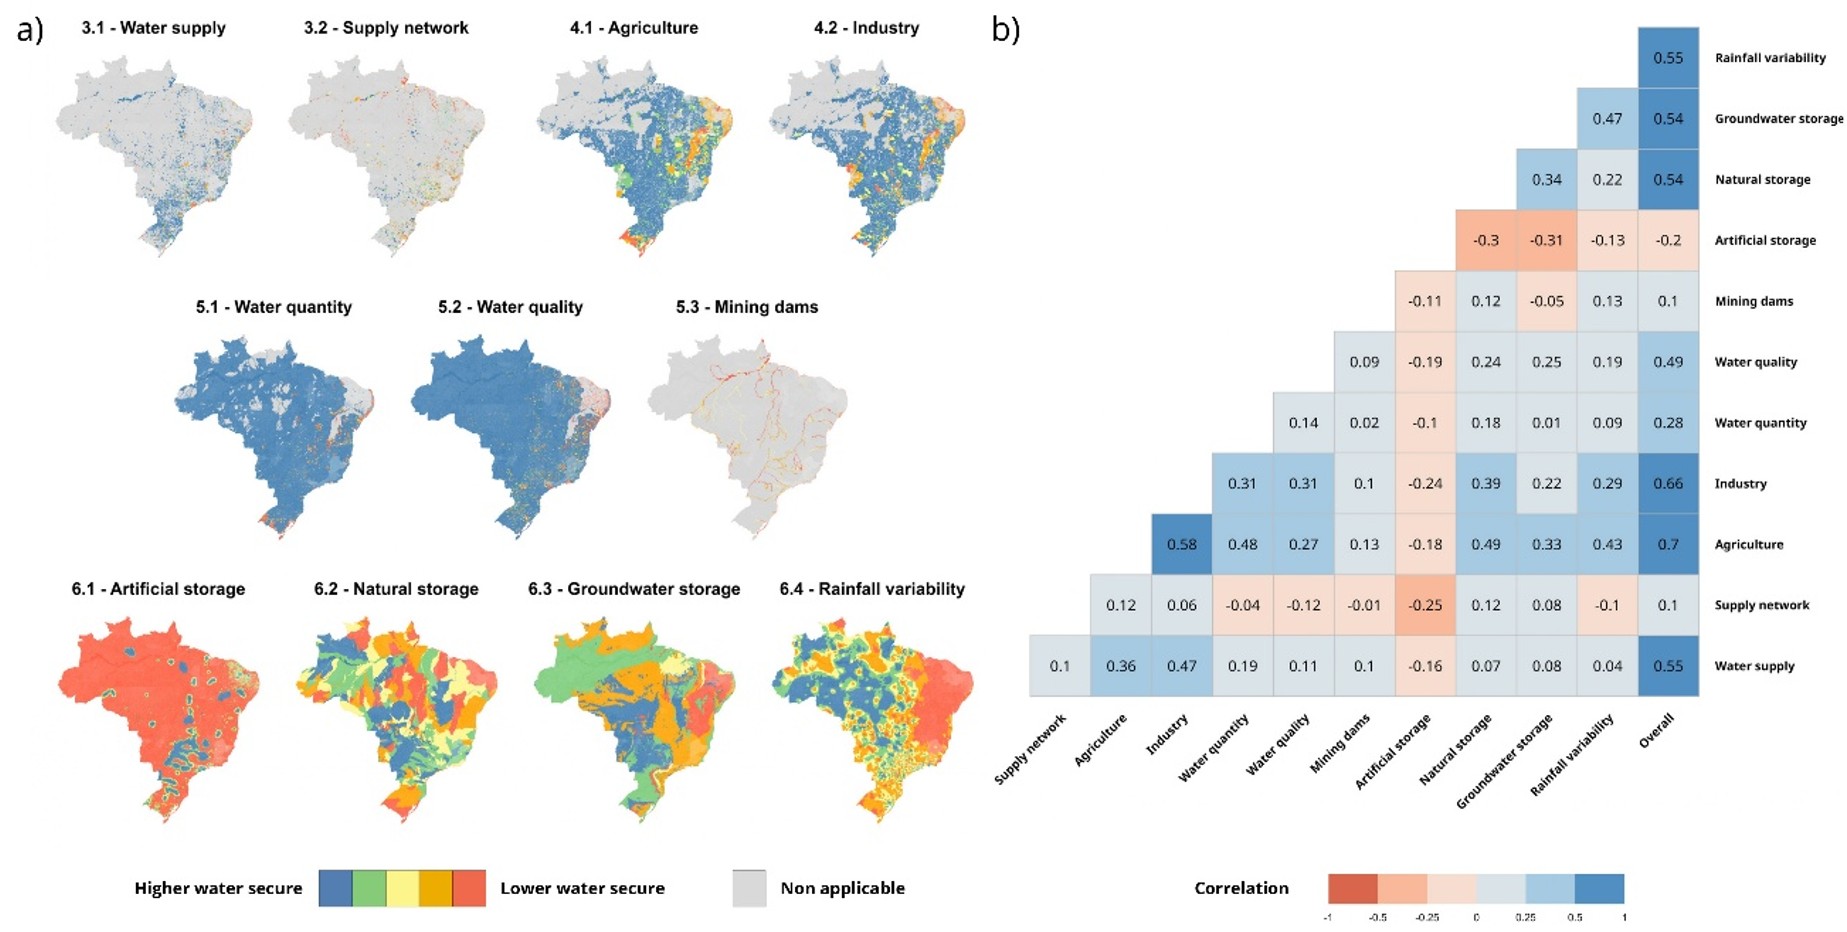
The highest water security class was observed in the indicators water supply (56.8% of the ottobasins), agriculture (60.8%), industry (62.7%), water quality (82.6%) and water quantity (95.5%). The dominance of the maximum class in the water quantity indicator suggests limited discriminatory capacity at the national scale, as an indicator with nearly all ottobasins classified at the highest level may contribute little to differentiating water security conditions across regions. Conversely, indicators within the resilience dimension exhibit greater dispersion among classes, indicating greater variability in the conditions related to the capacity of the ottobasins to resist and recover from hydrological disturbances.
The artificial storage indicator presents a fragmented and spatially inconsistent distribution, with 70.4% of the ottobasins classified in the lowest security level. This pattern is largely driven by the adopted methodology, which estimates reservoir influence using fixed 50 km buffer zones around each structure (Agência Nacional de Águas e Saneamento Básico, 2019). Such an approach may introduce biases, as reservoir impacts are more strongly governed by upstream–downstream hydrological connectivity than by a uniform radial distance. The indicator also showed negative correlations with all other variables and was the only one to correlate negatively with the overall index (r = -0.20, p < 0.01), suggesting that the artificial storage variable does not effectively represent water security conditions at the ottobasins scale.
The economic indicators, agriculture and industry, presented the strongest correlations with the overall index (Kendall’s correlation r = 0.70 and r = 0.66, respectively, both p < 0.01) and were also positively correlated with each other (r = 0.58). This suggests that water-dependent economic activities play a central role in shaping national water security conditions, consistent with the findings of Naspolini et al. (2020), who identified agriculture as the most water-intensive economic sector in Brazil, a pattern that is also reflected in the Manual of Consumptive Water Use (Agência Nacional de Águas e Saneamento Básico, 2019). Additionally, the water quantity and natural storage indicators both showed moderate correlations with the agricultural indicator (r = 0.48 and r = 0.49, p < 0.01), while their mutual correlation was low (r = 0.18, p < 0.01). This indicates that although both variables support agricultural water use, they represent distinct hydrological dimensions influencing water security in Brazil (Figure 7).
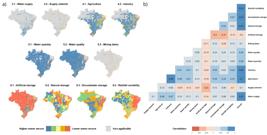
(a) Spatial distribution of the indicators composing ANA’s Water Security Index (ISH). Null ottobasins represent areas with no available data or where the indicator is not applicable. (b) Kendall’s rank correlation matrix among the indicators. Blue shades indicate positive correlations, while red shades indicate negative correlations. All correlations are statistically significant at the 1% level, except for the relationship between the mining tailings dams and water supply network indicators.
CONCLUSIONS
In this paper, we developed the Temporal Water Security Index, allowing for an examination of Brazil’s water security over time and capturing the spatiotemporal variability of extreme hydrological events. Incorporating local-scale data and explicitly accounting for temporal dynamics proved essential for diagnosing water security.
Our analysis shows that the highest water security levels decreased by 27.9 percent points in three decades. Regionally, the Southeast exhibited the highest concentration of ottobasins with reduced water security (65.8%), followed by the Midwest (43.0%). The reduction in these regions may be associated with population growth and agriculture expansion, which has intensified pressures on water resources in recent decades. The drought indicator showed the worsening decline highlighting a nationwide deterioration in drought-related water security. In arid regions, such as the Northeast, the decrease in the drought indicator was the main driver of the decline in the overall water security.
Our findings underscore the importance of evaluating water security from a temporal perspective and adopting tools such as the TWSI to enable continuous monitoring and support adaptive water resource management.
DATA AVAILABILITY STATEMENT
Research data is available in the body of the article.
ACKNOWLEDGEMENTS
The authors acknowledge the support off the Santa Catarina State Foundation for Research and Innovation (FAPESC) through the project Integrated System for the Regionalization of Streamflows and Hydrological Extremes in Santa Catarina (SIREx-SC, Call No. 32/2024, Grant Nos. 2024TR002697 and 2024TR2698). We also thank the financial support from the Coordination for the Improvement of Higher Education Personnel (CAPES) and the National Council for Scientific and Technological Development (CNPq).
REFERENCES
-
Agência Nacional de Águas e Saneamento Básico – ANA. (2019). Manual metodológico para a construção do Índice de Segurança Hídrica (ISH) Retrieved in 2026, February 05, from https://metadados.snirh.gov.br/geonetwork/srv/api/records/c349dc5a-0c01-4f14-9519-e3340fef2c66/attachments/Metodologia_ISH.pdf
» https://metadados.snirh.gov.br/geonetwork/srv/api/records/c349dc5a-0c01-4f14-9519-e3340fef2c66/attachments/Metodologia_ISH.pdf -
Agência Nacional de Águas e Saneamento Básico – ANA. (2020). Plano Nacional de Segurança Hídrica Retrieved in 2026, February 05, from https://pnsh.ana.gov.br/home
» https://pnsh.ana.gov.br/home -
Agência Nacional de Águas e Saneamento Básico – ANA. (2021a). Atlas Irrigação: Uso da água na agricultura irrigada (2. ed.). Retrieved in 2026, February 05, from https://biblioteca.ana.gov.br/asp/download.asp?codigo=148256&tipo_midia=2&iIndexSrv=1&iUsuario=0&obra=88090&tipo=1&iBanner=0&iIdioma=0
» https://biblioteca.ana.gov.br/asp/download.asp?codigo=148256&tipo_midia=2&iIndexSrv=1&iUsuario=0&obra=88090&tipo=1&iBanner=0&iIdioma=0 -
Agência Nacional de Águas e Saneamento Básico – ANA. (2021b). Usos consuntivos da água no Brasil (1931–2040) Retrieved in 2026, February 05, from https://metadados.snirh.gov.br/geonetwork/srv/por/catalog.search#/metadata/5146c9ec-5589-4af1-bd64-d34848f484fd
» https://metadados.snirh.gov.br/geonetwork/srv/por/catalog.search#/metadata/5146c9ec-5589-4af1-bd64-d34848f484fd -
Almeida, C. D. C., Peixoto, L. O. M., Sieciechowicz, M. S. F., Fernandes, C. V. S., Azevedo, J. C. R. D., & Centeno, J. A. S. (2023). Representative water quality parameters in a critical water basin: elements for planning and management. RBRH, 28, e36. https://doi.org/10.1590/2318-0331.282320230035
» https://doi.org/10.1590/2318-0331.282320230035 -
Anzolin, G., Chaffe, P. L. B., Vrugt, J. A., & AghaKouchak, A. (2023). Using climate information as covariates to improve nonstationary flood frequency analysis in Brazil. Hydrological Sciences Journal, 68(5), 645-654. https://doi.org/10.1080/02626667.2023.2182212
» https://doi.org/10.1080/02626667.2023.2182212 -
Arheimer, B., Cudennec, C., Castellarin, A., Grimaldi, S., Heal, K. V., Lupton, C., Sarkar, A., Tian, F., Kileshye Onema, J. M., Archfield, S., Blöschl, G., Chaffe, P. L. B., Croke, B. F. W., Dembélé, M., Leong, C., Mijic, A., Mosquera, G. M., Nlend, B., Olusola, A. O., Polo, M. J., Sandells, M., Sheffield, J., van Hateren, T. C., Shafiei, M., Adla, S., Agarwal, A., Aguilar, C., Andersson, J. C. M., Andraos, C., Andreu, A., Avanzi, F., Bart, R. R., Bartosova, A., Batelaan, O., Bennett, J. C., Bertola, M., Bezak, N., Boekee, J., Bogaard, T., Booij, M. J., Brigode, P., Buytaert, W., Bziava, K., Castelli, G., Castro, C. V., Ceperley, N. C., Chidepudi, S. K. R., Chiew, F. H. S., Chun, K. P., Dagnew, A. G., Dekongmen, B. W., Del Jesus, M., Dezetter, A., Do Nascimento Batista, J. A., Doble, R. C., Dogulu, N., Eekhout, J. P. C., Elçi, A., Elenius, M., Finger, D. C., Fiori, A., Fischer, S., Förster, K., Ganora, D., Gargouri Ellouze, E., Ghoreishi, M., Harvey, N., Hrachowitz, M., Jampani, M., Jaramillo, F., Jongen, H. J., Kareem, K. Y., Khan, U. T., Khatami, S., Kingston, D. G., Koren, G., Krause, S., Kreibich, H., Lerat, J., Liu, J., Liu, S., Madruga de Brito, M., Mahé, G., Makurira, H., Mazzoglio, P., Merheb, M., Mishra, A., Mohammad, H., Montanari, A., Mujere, N., Nabavi, E., Nkwasa, A., Orduna Alegria, M. E., Orieschnig, C., Ovcharuk, V., Palmate, S. S., Pande, S., Pandey, S., Papacharalampous, G., Pechlivanidis, I., Penny, G., Pimentel, R., Post, D. A., Prieto, C., Razavi, S., Salazar-Galán, S., Sankaran Namboothiri, A., Santos, P. P., Savenije, H., Shanono, N. J., Sharma, A., Sivapalan, M., Smagulov, Z., Szolgay, J., Teng, J., Teuling, A. J., Teutschbein, C., Tyralis, H., Griensven, A., van Schalkwyk, A. J., van Tiel, M., Viglione, A., Volpi, E., Wagener, T., Wang, X., Wang-Erlandsson, L., Wens, M., & Xia, J. (2024). The IAHS science for solutions decade, with hydrology engaging local people in one global world (HELPING). Hydrological Sciences Journal, 69(11), 1417-1435. https://doi.org/10.1080/02626667.2024.2355202
» https://doi.org/10.1080/02626667.2024.2355202 -
Babel, M. S., Shinde, V. R., Sharma, D., & Dang, N. M. (2020). Measuring water security: A vital step for climate change adaptation. Environmental Research, 185, 109400. https://doi.org/10.1016/j.envres.2020.109400
» https://doi.org/10.1016/j.envres.2020.109400 -
Bakker, K. (2012). Water security: research challenges and opportunities. Science, 337(6097), 914-915. https://doi.org/10.1126/science.1226337
» https://doi.org/10.1126/science.1226337 -
Ballarin, A. S., Sousa Mota Uchôa, J. G., dos Santos, M. S., Almagro, A., Miranda, I. P., da Silva, P. G. C., da Silva, G. J., Gomes Júnior, M. N., Wendland, E., & Oliveira, P. T. S. (2023). Brazilian water security threatened by climate change and human behavior. Water Resources Research, 59(7), e2023WR034914. https://doi.org/10.1029/2023WR034914
» https://doi.org/10.1029/2023WR034914 -
Blöschl, G., & Chaffe, P. L. B. (2023). Water scarcity is exacerbated in the south. Science, 382(6670), 512-513. https://doi.org/10.1126/science.adk8164
» https://doi.org/10.1126/science.adk8164 -
Chagas, V. B. P., Chaffe, P. L. B., & Blöschl, G. (2022). Climate and land management accelerate the Brazilian water cycle. Nature Communications, 13(1), 5136. https://doi.org/10.1038/s41467-022-32580-x
» https://doi.org/10.1038/s41467-022-32580-x -
Chagas, V. B. P., Chaffe, P. L. B., & Blöschl, G. (2024). Drought-rich periods are more likely than flood-rich periods in Brazil. Water Resources Research, 60(10), e2023WR035851. https://doi.org/10.1029/2023WR035851
» https://doi.org/10.1029/2023WR035851 -
Chagas, V. B. P., Chaffe, P. L. B., Addor, N., Fan, F. M., Fleischmann, A. S., Paiva, R. C. D., & Siqueira, V. A. (2020). CAMELS-BR: hydrometeorological time series and landscape attributes for 897 catchments in Brazil. Earth System Science Data, 12(3), 2075-2096. https://doi.org/10.5194/essd-12-2075-2020
» https://doi.org/10.5194/essd-12-2075-2020 -
Collischonn, W., Fan, F. M., Possantti, I., Dornelles, F., Paiva, R., Medeiros, M. S., Michel, G. P., Magalhães Filho, F. J. C., Moraes, S. R., Marcuzzo, F. F. N., Michel, R. D. L., Beskow, T. L. C., Beskow, S., Fernandes, E. H. L., Santos, L. L., Ruhoff, A., Kobiyama, M., Collares, G. L., Buffon, F., Duarte, E., Lima, S., Meirelles, F. S. C., & Piccilli, D. G. A. (2025). The exceptional hydrological disaster of April-May 2024 in southern Brazil. RBRH, 30, e1. https://doi.org/10.1590/2318-0331.302520240119
» https://doi.org/10.1590/2318-0331.302520240119 -
de Paula, I. X., & Formiga-Johnsson, R. M. (2023). Water security for urban water supply in the face of environmental conditions and source water quality: the case of Guandu Water Treatment Plant, Metropolitan Region of Rio de Janeiro. Engenharia Sanitária e Ambiental, 28, e20220275. https://doi.org/10.1590/s1413-415220220275
» https://doi.org/10.1590/s1413-415220220275 -
European Environment Agency. (2011). Conceptual model of the WEI+ computation Retrieved in 2026, February 05, from https://www.eea.europa.eu/data-and-maps/indicators/use-of-freshwater-resources3/resolveuid/b820b42dc3e8406a9bc9372ae3eee08b
» https://www.eea.europa.eu/data-and-maps/indicators/use-of-freshwater-resources3/resolveuid/b820b42dc3e8406a9bc9372ae3eee08b -
Falkenmark, M., Lundqvist, J., & Widstrand, C. (1989). Macro-scale water scarcity requires micro-scale approaches. Natural Resources Forum, 13(4), 258-267. https://doi.org/10.1111/j.1477-8947.1989.tb00348.x
» https://doi.org/10.1111/j.1477-8947.1989.tb00348.x -
Gesualdo, G. C., Sone, J. S., Galvão, C. O., Martins, E. S., Montenegro, S. M. G. L., Tomasella, J., & Mendiondo, E. M. (2021). Unveiling water security in Brazil: current challenges and future perspectives. Hydrological Sciences Journal, 66(5), 759-768. https://doi.org/10.1080/02626667.2021.1899182
» https://doi.org/10.1080/02626667.2021.1899182 -
Giannini, A., Saravanan, R., & Chang, P. (2004). The preconditioning role of Tropical Atlantic Variability in the development of the ENSO teleconnection: implications for the prediction of Nordeste rainfall. Climate Dynamics, 22(8), 839-855. https://doi.org/10.1007/s00382-004-0420-2
» https://doi.org/10.1007/s00382-004-0420-2 -
Grey, D., & Sadoff, C. W. (2007). Sink or swim? Water security for growth and development. Water Policy, 9(6), 545-571. https://doi.org/10.2166/wp.2007.021
» https://doi.org/10.2166/wp.2007.021 -
Hannah, D. M., Abbott, B. W., Khamis, K., Kelleher, C., Lynch, I., Krause, S., & Ward, A. S. (2022). Illuminating the ‘invisible water crisis’ to address global water pollution challenges. Hydrological Processes, 36(3), e14525. https://doi.org/10.1002/hyp.14525
» https://doi.org/10.1002/hyp.14525 -
Jones, E. R., Bierkens, M. F. P., & van Vliet, M. T. H. (2024). Current and future global water scarcity intensifies when accounting for surface water quality. Nature Climate Change, 14(6), 629-635. https://doi.org/10.1038/s41558-024-02007-0
» https://doi.org/10.1038/s41558-024-02007-0 -
Kendall, M. G. (1945). The treatment of ties in ranking problems. Biometrika, 33(3), 239-251. https://doi.org/10.1093/biomet/33.3.239
» https://doi.org/10.1093/biomet/33.3.239 -
Lang, M., Ouarda, T. B. M. J., & Bobée, B. (1999). Towards operational guidelines for over-threshold modeling. Journal of Hydrology, 225(3-4), 103-117. https://doi.org/10.1016/S0022-1694(99)00167-5
» https://doi.org/10.1016/S0022-1694(99)00167-5 -
Madani, K. (2026). Water bankruptcy: the formal definition. Water Resources Management, 40(2), 78. https://doi.org/10.1007/s11269-025-04484-0
» https://doi.org/10.1007/s11269-025-04484-0 -
Mekonnen, M. M., & Hoekstra, A. Y. (2016). Sustainability: four billion people facing severe water scarcity. Science Advances, 2(2), e1500323. https://doi.org/10.1126/sciadv.1500323
» https://doi.org/10.1126/sciadv.1500323 -
Naspolini, G. F., Ciasca, B. S., La Rovere, E. L., & Pereira Junior, A. O. (2020). Brazilian environmental–economic accounting for water: A structural decomposition analysis. Journal of Environmental Management, 265, 110508. https://doi.org/10.1016/j.jenvman.2020.110508
» https://doi.org/10.1016/j.jenvman.2020.110508 -
Oliveira, M. R., Pasqualetto, A., Vieira, J. C., & Castro, S. D. (2022). The agribusiness of sugarcane and its expansion in the state of Goiás. International Journal of Business Administration, 13(5), 61-72. https://doi.org/10.5430/ijba.v13n5p61
» https://doi.org/10.5430/ijba.v13n5p61 -
Peixoto, F. S., Soares, J. A., & Ribeiro, V. S. (2021). Conflitos pela água no Brasil. Sociedade & Natureza, 34(1), https://doi.org/10.14393/SN-v34-2022-59410
» https://doi.org/10.14393/SN-v34-2022-59410 -
Pereira, B. S., Uchôa, J. G. S. M., Freitas, G. S., Meira Neto, A. A., Anache, J. A. A., Wendland, E. C., Mendiondo, E. M., & Medeiros, P. H. A. (2025). Hydrological heritage: A historical exploration of human–water dynamics in northeast Brazil. Hydrological Sciences Journal, 70(4), 546-558. https://doi.org/10.1080/02626667.2024.2446272
» https://doi.org/10.1080/02626667.2024.2446272 - Pfafstetter, O. (1989). Classificação de bacias hidrográficas: Metodologia de codificação (pp. 19). Rio de Janeiro, RJ: Departamento Nacional de Obras de Saneamento.
-
Rafaai, N. H., & Lee, K. E. (2024). Reconciling and contextualising multi-dimensional aspects for consolidated water security index: A synthesis. Journal of Environmental Management, 359, 121067. https://doi.org/10.1016/j.jenvman.2024.121067
» https://doi.org/10.1016/j.jenvman.2024.121067 -
Rodrigues, R. R., & McPhaden, M. J. (2014). Why did the 2011–2012 La Niña cause a severe drought in the Brazilian Northeast? Geophysical Research Letters, 41(3), 1012-1018. https://doi.org/10.1002/2013GL058703
» https://doi.org/10.1002/2013GL058703 -
Savenije, H. H. (2000). Water scarcity indicators; the deception of the numbers. Physics and Chemistry of the Earth. Part B: Hydrology, Oceans and Atmosphere, 25(3), 199-204. https://doi.org/10.1016/S1464-1909(00)00004-6
» https://doi.org/10.1016/S1464-1909(00)00004-6 -
Silva, G. D. A., Freire, É. M. D. S., Silva, F. G. D., Silva, J. R. I., Nascimento, A. H. C. D., Alba, E., Silva, A. F., & Bezerra, A. C. (2025). Spatio-temporal evolution of surface water resources in the Brazilian semi-arid: a case study in the Sertão of Pernambuco. RBRH, 30, e42. https://doi.org/10.1590/2318-0331.302520250030
» https://doi.org/10.1590/2318-0331.302520250030 -
Silva, B. M., & Ribeiro, M. R. (2025). Identifying socio-ecological dynamics in water systems through adaptive cycles. Hydrological Sciences Journal, 70(5), 805-817. https://doi.org/10.1080/02626667.2025.2461094
» https://doi.org/10.1080/02626667.2025.2461094 -
Sistema Nacional de Informações sobre Saneamento Básico – SINISA. (2022). Índice de Atendimento Total de Água Retrieved in 2026, February 05, from https://basedosdados.org/dataset/2a543ad8-3cdb-4047-9498-efe7fb8ed697?table=df7cf198-4889-4baf-bb77-4e0e28eb90ca
» https://basedosdados.org/dataset/2a543ad8-3cdb-4047-9498-efe7fb8ed697?table=df7cf198-4889-4baf-bb77-4e0e28eb90ca -
Soriano, É., Londe, L. D. R., Di Gregorio, L. T., Coutinho, M. P., & Santos, L. B. L. (2016). Crise hídrica em São Paulo sob o ponto de vista dos desastres. Ambiente & Sociedade, 19, 21-42. https://doi.org/10.1590/1809-4422asoc150120r1v1912016
» https://doi.org/10.1590/1809-4422asoc150120r1v1912016 -
Souza, S. A., & Reis Junior, D. S. (2022). Trend detection in annual streamflow extremes in Brazil. Water, 14(11), 1805. https://doi.org/10.3390/w14111805
» https://doi.org/10.3390/w14111805 -
Srinivasan, V., Konar, M., & Sivapalan, M. (2017). A dynamic framework for water security. Water Security, 1, 12-20. https://doi.org/10.1016/j.wasec.2017.03.001
» https://doi.org/10.1016/j.wasec.2017.03.001 -
Sullivan, C. A., Meigh, J. R., & Giacomello, A. M. (2003). The water poverty index: development and application at the community scale. Natural Resources Forum, 27(3), 189-199. https://doi.org/10.1111/1477-8947.00054
» https://doi.org/10.1111/1477-8947.00054 -
Thomaz, S. M., Benassi, S. F., & Benassi, R. F. (2024). The importance of long-term research for water security: a perspective for Brazilian waterbodies. Acta Limnologica Brasiliensia, 36, e42. https://doi.org/10.1590/s2179-975x1024
» https://doi.org/10.1590/s2179-975x1024 -
United Nations Water. (2013). Water Security and the Global Water Agenda: An UN-Water Analytical Brief Retrieved in 2026, February 05, from https://www.unwater.org/publications/water-security-and-global-water-agenda
» https://www.unwater.org/publications/water-security-and-global-water-agenda - United Nations. (2025). The United Nations World Water Development Report 2025: Mountains and glaciers – Water towers Geneva: UNESCO.
-
Veettil, A. V., & Mishra, A. K. (2018). Potential influence of climate and anthropogenic variables on water security using blue and green water scarcity, Falkenmark index, and freshwater provision indicator. Journal of Environmental Management, 228, 346-362. https://doi.org/10.1016/j.jenvman.2018.09.012
» https://doi.org/10.1016/j.jenvman.2018.09.012 -
Vörösmarty, C. J., McIntyre, P. B., Gessner, M. O., Dudgeon, D., Prusevich, A., Green, P., Glidden, S., Bunn, S. E., Sullivan, C. A., Liermann, C. R., & Davies, P. M. (2010). Global threats to human water security and river biodiversity. Nature, 467(7315), 555-561. https://doi.org/10.1038/nature09440
» https://doi.org/10.1038/nature09440 -
Vogel, R. M., & Fennessey, N. M. (1994). Flow-duration curves. I: new interpretation and confidence intervals. Journal of Water Resources Planning and Management, 120(4), 485-504. https://doi.org/10.1061/(ASCE)0733-9496(1994)120:4(485)
» https://doi.org/10.1061/(ASCE)0733-9496(1994)120:4(485) -
Ward, P. J., de Ruiter, M. C., Mård, J., Schröter, K., Van Loon, A., Veldkamp, T., von Uexkull, N., Wanders, N., AghaKouchak, A., Arnbjerg-Nielsen, K., Capewell, L., Carmen Llasat, M., Day, R., Dewals, B., Di Baldassarre, G., Huning, L. S., Kreibich, H., Mazzoleni, M., Savelli, E., Teutschbein, C., van den Berg, H., van der Heijden, A., Vincken, J. M. R., Waterloo, M. J., & Wens, M. (2020). The need to integrate flood and drought disaster risk reduction strategies. Water Security, 11, 100070. https://doi.org/10.1016/j.wasec.2020.100070
» https://doi.org/10.1016/j.wasec.2020.100070 -
Wheater, H. S., & Gober, P. (2015). Water security and the science agenda. Water Resources Research, 51(7), 5406-5424. https://doi.org/10.1002/2015WR016892
» https://doi.org/10.1002/2015WR016892 -
World Resources Institute. (2023). Aqueduct 4.0: Updated decision-relevant water risk indicators Retrieved in 2026, February 05, from https://www.wri.org/research/aqueduct-40-updated-decision-relevant-global-water-risk-indicators
» https://www.wri.org/research/aqueduct-40-updated-decision-relevant-global-water-risk-indicators
Edited by
-
Editor-in-Chief:
Iran E. Lima Neto
-
Associated Editor:
Rosa Formiga