
 Hydrological-hydrodynamic modeling of climate-induced urban flooding of design storms using HydroPol2D: a case study in São Carlos, Brazil
ABSTRACT
Under scenarios of climate change, the frequency and intensity of urban flood events are expected to increase, leading to more severe impacts in cities. Thus, coupling spatially distributed hydrological and hydrodynamic models is essential to simulate flood propagation and identify flood-prone areas in urban basins. This study aims to evaluate the influence of extreme rainfall events on flood dynamics in the urban basin of São Carlos, under both current climatic conditions and future projections derived from climate change scenarios (ETA-MIROC5 for RCP 4.5 and 8.5, 4.5 W/m2 and 8.5 W/m2). To examine how rainfall influences flood propagation and the extent of inundation, the two-dimensional, fully distributed hydrological-hydrodynamic model HydroPol2D is applied. This model solves the conservation equations for momentum, mass, and pollutant transport over a Cartesian grid. This methodology is used in selected urban catchments of São Carlos (SP) - Brazil, a city recognized as a technological hub in Brazil that suffers from episodes of intense rainfall and subsequent flooding. These events continue to cause recurring crises, resulting in both material and immaterial losses. The results revealed that, on average, flooded areas increased by 65% compared to current conditions. Moreover, for 100-year return period events, maximum flood depths increased by up to 2.5 meters in certain locations within the basin.
Keywords:
HydroPol2D; Floods; Climate change; Non-stationarity
RESUMO
Em cenários de mudança climática, espera-se que a frequência e a intensidade dos eventos de inundação urbana aumentem, levando a impactos mais severos nas cidades. Assim, o acoplamento de modelos hidrológicos e hidrodinâmicos espacialmente distribuídos é essencial para simular a propagação das inundações e identificar áreas suscetíveis em bacias urbanas. Este estudo tem como objetivo avaliar a influência de eventos extremos de precipitação na dinâmica das inundações na bacia urbana de São Carlos, tanto nas condições climáticas atuais quanto em projeções futuras derivadas de cenários de mudança climática (ETA-MIROC5 para os cenários RCP 4.5 e 8.5, 4.5 W/m2 e 8.5 W/m2). Para analisar como a precipitação influencia a propagação da inundação e a extensão das áreas alagadas, foi aplicado o modelo hidrológico-hidrodinâmico bidimensional totalmente distribuído HydroPol2D. Esse modelo resolve as equações de conservação de quantidade de movimento, massa e transporte de poluentes em uma grade cartesiana. Essa metodologia foi aplicada em bacias urbanas selecionadas de São Carlos (SP) – Brasil, uma cidade reconhecida como polo tecnológico que sofre com episódios de chuvas intensas e, consequentemente, inundações. Esses eventos continuam a causar crises recorrentes, resultando em perdas materiais e imateriais. Os resultados revelaram que, em média, as áreas inundadas aumentaram em 65% em comparação com as condições atuais. Além disso, para eventos com período de retorno de 100 anos, as profundidades máximas de inundação aumentaram em até 2,5 metros em determinados locais da bacia hidrográfica.
Palavras-chave:
HydroPol2D; Inundações; Mudanças climáticas; Não-estacionariedade
INTRODUCTION
Urban flooding has been part of human history since people began concentrating in cities. However, the lack of organization and proper planning of subdivisions during urban development, a common challenge in South American cities, increases the population's vulnerability to flood-related risks (Siqueira et al., 2020). In Brazil, 5,462 flood events were recorded between 1991 and 2020, resulting in material damages estimated at R$ 20.1 billion and directly affecting 3,776,171 people (Santa Catarina, 2022). Currently, São Carlos, located in the state of São Paulo, is recognized as an important technological hub in Brazil, hosting two of the country’s most prominent universities: the Federal University of São Carlos (UFSCar) and one of the campuses of the University of São Paulo (USP). Despite its highly skilled workforce and substantial research output in the environmental field, the city faces significant challenges, particularly regarding floods, which have caused both material and intangible damage to local residents (Dozena, 2008; Pires, 2021; Abreu, 2019).
Given the already problematic situation in the city, climate change poses a likely worsening of intense rainfall events and floods, as it has been increasing the frequency and intensity of extreme rainfall and flooding events in various regions worldwide, primarily due to the rise in greenhouse gases such as CO2 and methane (Schardong et al., 2014; Chou et al., 2014). The intensification of rainfall, combined with the reduction in the return period of extreme events, makes severe flooding more frequent, thereby increasing the risk of damage to local populations (Paiva et al., 2024). Thus, it becomes essential to employ tools, such as hydrological and hydrodynamic models, that account for new climate change projections to ensure that both infrastructure and urban planning are resilient and prepared for future risks (Paiva et al., 2024).
Several mathematical models have already been applied in the São Carlos region with the objective of understanding the dynamic of floods, including SWMM (Rossman, 2010) (Storm Water Management Model) (Fava et al., 2015) and WCA2D (Weighted Cellular Automata 2D) (Buarque et al., 2021). However, there are still aspects that can be improved in the analyses conducted by these studies. In Fava et al. (2015), a combination of two models was used: SWMM, applied to estimate flow rates through rainfall-runoff modeling of sub-basins, and HEC-RAS 2D (Hydrologic Engineering Center - River Analysis System) (Brunner, 2016), employed to simulate flood wave propagation in the inundated areas of urban channels. Consequently, the delineation of flooded areas was limited to the vicinity of the main channels. This limitation can be problematic, especially when critical areas are located outside the margins of macro-drainage systems. Furthermore, interoperability between different software, particularly in real-time forecasting solutions, can be a limitation. In the study by Buarque et al. (2021), the temporal and spatial evaluation of floods was conducted using a model that neglected infiltration processes. The model adopted a single roughness coefficient and restricted flow velocities to the critical velocity, without considering the transition from subcritical to supercritical flow regimes in scenarios of high discharge and velocity (Guidolin et al., 2016).
However, most of these studies rely on historical rainfall records, assuming stationary climatic conditions. Due to the uncertainties that climate change introduces to hydrological processes, it is crucial to integrate future climate projections into hydrological-hydrodynamic modeling to enhance the reliability of risk assessments and mitigation strategies (Mishra et al., 2018; Zhang et al., 2019). When analyzing pessimistic future scenarios, it is essential to consider the increase in adverse conditions, such as intensified rainfall, reduced return periods for extreme events, and rising sea levels in coastal regions (Miranda et al., 2017). One way to incorporate future climate projections into flood risk assessment is through the adaptation of Intensity-Duration-Frequency (IDF) curves, which provide a basis for estimating rainfall intensity under different return periods.
Several studies have examined the impacts of climate change on Intensity-Duration-Frequency (IDF) curves, highlighting the need to adapt traditional methodologies to account for future projections. Schardong & Simonovic (2013) demonstrated that future greenhouse gas emission scenarios could lead to significant increases in extreme precipitation, ranging from 4% to 26% compared to IDF curves adjusted to historical data. Similarly, Weschenfelder et al. (2019) developed projected IDF curves for Porto Alegre (Brazil) based on global climate models and a stochastic model, concluding that the use of adjusted IDF curves is essential for hydraulic infrastructure planning under increasing climate uncertainty.
Under these circumstances, the need for a methodological approach that enables the assessment of rainfall to anticipate the potential impacts of these events, particularly in terms of volume, water depth, flow direction, and affected areas, in real-time becomes evident. Furthermore, it is crucial to consider flood risk analysis in regions with limited observational data, a reality that extends throughout Brazil, largely due to the lack of investment in monitoring, forecasting, and flood mitigation actions (Mota et al., 2016).
In this context, this study utilizes the HydroPol2D (Hydrodynamic and Pollution 2-D Model) model (Gomes Junior, 2023b), a two-dimensional hydrodynamic and water quality model that consists of three main components: a surface hydrological balance (hydrological model) that simulates rainfall, infiltration, evapotranspiration, and surface runoff; a hydrodynamic model that solves momentum equations using a local inertial approximation; and a water quality model (Gomes Junior et al., 2024a). The integration of hydrological and hydraulic features allows the model to function without requiring integration with other software. Additionally, to simulate the rainfall-runoff process, the model requires numerical input data for boundary conditions through precipitation data and/or inflow hydrographs or stage levels. As part of these inputs, it also allows the incorporation of IDF curve parameters to generate design storms directly within the model (Gomes Junior et al., 2024a).
The main objective of this study is to apply the model HydroPol2D to simulate extreme events in the urban basin of São Carlos, with the intent of generating flood extent maps that identify the water levels, main affected areas and analyze the potential impacts of the climate changes on these events, using adapted IDF curves. To achieve the main objective of the study, the specific goals of this paper are (i) calibrate and validate the HydroPol2D model using observed rainfall and flow data from a sub-basin within the study area, (ii) apply current IDF curves to simulate extreme events and generate water level and flood extent maps for the present scenario, (iii) use projected IDF curves for future scenarios to simulate extreme events under climate change conditions and assess potential changes in water levels and flood extents, (iv) compare the results of current and future simulations to identify how climate change may impact flood patterns in the urban basin of São Carlos. Through these objectives, this study contributes to the development of a methodology to assess the potential impacts of climate change on flood extents caused by extreme events. The approach is suitable for application in data-scarce regions and benefits from the use of HydroPol2D, which integrates both hydrological and hydrodynamic modeling within a single framework.
MATERIAL AND METHODS
The methodology of the study was divided into four main steps: characterization of the basins of interest, acquisition of observed precipitation and flow data, calibration and validation of the model using the observed data, and finally, the development of representative design events for current and future contexts (considering climate change) (Figure 1).

Characterization and monitoring of the target basins
The urban region of São Carlos was selected as the study area due to the historical relationship between the community and flooding events. The area is referred to as the “Urban Basin of São Carlos” because it contains nearly 90% of the city’s urban extent, while also including peri-urban and rural zones where croplands, pastures, and preservation areas remain. However, the absence of high-temporal-resolution rainfall-runoff data measured at multiple points in the São Carlos urban basin limited the possibility of direct model calibration. To address this limitation, the model was calibrated using high-resolution from a monitored sub-basin within the same drainage system that shares the same soil and land-use classes as the urban basin of interest.
The chosen sub-basin was the Mineirinho stream basin, as rainfall and flow data measured from 2014 to 2016 were available and could be used for model calibration. The model calibration of the Mineirinho basin was based on data previously used by Martins (2017). The monitoring network established in the Mineirinho basin consisted of three rainfall monitoring stations (P1, P2, and P3) and one streamflow monitoring station (F1) (Figure 2). Precipitation and streamflow values were collected at 1 and 2 minute intervals, respectively, and the average precipitation recorded by the three rain gauges was calculated to generate hyetographs for the 12 (twelve) main events analyzed during the study period (2015). Based on the collected rainfall data, various variables associated with rainfall events were quantified, such as total precipitation, rainfall duration, intensity and the antecedent moisture condition (AMC) (Martins, 2017).

Location map of the monitoring network in the Mineirinho basin with three rainfall monitoring stations (P2, P3, and P7) and one streamflow monitoring station (F1).
For the characterization of the two modeled basins, elevation, slope, soil type, and land use and land cover maps were created (Figure 3).

Characterization maps of the Mineirinho basin and Urban basin of São Carlos (soil type, digital terrain model, land use and land cover and slope).
The Mineirinho stream microbasin is located in the western region of São Carlos. The basin covers approximately 5.3 km2, with elevation ranging from 795 to 873 meters. The Mineirinho basin is predominantly composed of Latossolo Vermelho Distroférrico (Red Latosol) (LVd) and Latossolo Vermelho-Amarelo Distrófico (Red-Yellow Latosol) (LVAd) (Instituto Brasileiro de Geografia e Estatística, 2006; Santos et al., 2018). In the World Reference Base for Soil Resources (WRB), these soils are included in the Ferralsols group, commonly classified as Rhodic Ferralsols when dominated by red horizons (Dalmolin et al., 2004; Santos et al., 2018; International Society of Soil Science Working Group RB, 1998). Currently, the basin's land use is predominantly “built-up areas” (60.3%), followed by “crops” (18.1%) and “trees” (15.9%) (Figure 3). The urban basin of São Carlos is located in the southern part of the municipality, covering approximately 11% of its territory. The main watercourse in this basin is the Monjolinho River, and the microbasins in this region include Santa Maria do Leme, Tijuco Preto, Mineirinho, Gregório, Água Quente, and Água Fria (Figure 4). The basin spans approximately 129 km2, with elevations ranging from 680 to 950 meters. Like the Mineirinho basin, the region of interest is composed of LVd and LVAd soils (Instituto Brasileiro de Geografia e Estatística, 2006; Santos et al., 2018). The region's primary land use includes “built-up areas” (38.12%), “trees” (28.28%), “crops” (18.18%), and “grass” (8.59%) (Figure 3). Table 1 presents key hydrological and geomorphological characteristics of the basins of interest and their main rivers. The concentration time (Tc) selected for the urban basin of São Carlos was determined as an approximate average between values reported in the literature for a sub-basin of similar characteristics (80 km2) (Romero, 2016; Zaffani, 2012) and the results obtained using the Kirpich equation for the entire basin (129 km2). Considering these results, an average value of 160 min was adopted as representative of the basin’s concentration time.

Urban basin of São Carlos with its water bodies and points of interest. Images a) to c) represent real flood events that occurred at the study’s points of interest: Praça do Kartódromo, Rotatória do Cristo and Mercado Municipal, respectively.
Input data
For the model to operate, input data for boundary conditions are required, as well as raster (.TIFF) georeferenced data in planar coordinate systems representing topography (Digital Elevation Model, DEM), soil type, and land use and land cover (LULC) of the region of interest (Gomes Junior, 2023a). These are the same datasets used in the basin characterization maps, with the addition of boundary conditions for the rainfall–runoff analysis. The input data, together with their description, resolution/scale or periodicity, source, and corresponding module in the model, are presented in Table 2.
The original DEM was processed to generate a DTM by removing slopes greater than 30°, which may represent buildings, trees, or other noise. After identifying these points, a bilinear interpolation filter (r.fillnulls) was applied to fill the raster gaps and smooth terrain lines (Gomes Junior et al., 2023c).
HydroPol2D
The model used in this study is HydroPol2D (Gomes Junior, 2023b), applied in the calibration and validation stages, as well as in the simulation of the basin of interest, as shown in Figure 1. HydroPol2D is a two-dimensional hydrodynamic and water quality model that incorporates hydrological (water balance) and hydraulic characteristics to simulate surface runoff dynamics basins, particularly urban basins, by modeling these processes with a spatially distributed approach (Gomes Junior et al., 2023c).
The input data is used to determine the necessary parameters for the model’s various components. Infiltration within the basin is calculated using the Green-Ampt Infiltration Model (Collischonn & Dornelles, 2013; Mays, 2010; Chow et al., 1988). The parameters required for infiltration calculation are: saturated hydraulic conductivity (Ksat) (mm.h−1), suction head (Ψf ) (mm), moisture deficit (∆θ) (cm3.cm−3), and initial soil moisture (I0) (mm), and must be selected based on the soil type. Additionally, the hydrodynamic model parameters, Manning’s roughness coefficient (n) (s.m−1/3) and initial abstraction (h0) (mm) must be determined based on the land use and land cover map. The initial water depth (d0) can be assigned according to warmup maps, ensuring proper initial conditions for each simulation (Gomes Junior, 2023a).
The HydroPol2D hydrodynamic model solves the simplified Saint-Venant equations using the Local Inertial Approximation (Bates et al., 2010) method in a fully distributed two-dimensional (2D) framework (Equation 1) (Gomes Junior et al., 2024a). This means that the basin is discretized into finite cells, allowing hydrological and hydraulic variables to be spatially varied, taking into account the specific characteristics of each cell (Equation 1). To simulate water flow between cells, the equation is solved based on state variables such as water depth and soil moisture. The flux at the boundaries between adjacent cells is then computed for each cartesian direction, and state variables are updated for each cell, ensuring mass and momentum conservation (Equation 2) (Gomes Junior et al., 2024a; Sousa et al., 2023c). This process is repeated at each time step, enabling the simulation of flow evolution and hydrological scenarios (Gomes Junior et al., 2024a, 2025). The flow rate at cell interfaces can be estimated as:
where is the discharge at time(m2.s-1), represented as a vector containing the fluxes to all adjacent surface neighbors at 𝑖+1/2; controls numerical diffusion, which varies depending on the numerical scheme adopted, in this study the s-centered scheme was adopted (Gomes Junior et al., 2024a); is a parameter computed to adjust numerical diffusion; g is the gravitational acceleration (m.s-2); is the effective water depth between adjacent cells (m) (Bates et al., 2010); is the time step used for the temporal discretization (s); represents the slope or gradient of the water surface in space (m.m−1); n is the Manning roughness coefficient (s·m-1/3); and is the absolute value of the discharge per unit width at timet(m2.s-1) as used in Equation 1.
Although the momentum conservation is solved per each cartesian grid at cell interfaces, the mass balance is solved for each cell and is given by:
where d is the surface runoff depth (m), I is the inflow rate (m3.s-1), O is the outflow rate (m3.s-1), i is the rainfall intensity (mm.h-1), f is the infiltration rate (m3.s-1) and et is the evapotranspiration rate (m3.s-1).
The infiltration capacity (dF /dt) is estimated via an implicit solution of the Green-Ampt (Mays, 2010; Chow et al., 1988) model using the Newton-Rapshon algorithm and is given by (Equation 3):
where Ks is the saturated hydraulic conductivity (m.s−1), is the infiltrated depth (m), 𝜃d is the saturation deficit (m3.m-3) defined as the difference between saturated porosity (𝜃s) and the initial soil moisture content (𝜃i), 𝜓f is the wetting front suction head (m), and fout is the groundwater replenishing rate, following Huber et al. (2005).
Model calibration and validation
Given the fully distributed nature of the HydroPol2D model, soil parameters are assigned through categorical raster classes rather than continuous spatial variation. Thus, the calibrated hydraulic properties from this monitored sub-basin provide empirical support for the parametrization of the larger urban basin, since both areas are composed of the same two dominant soil types. Although soil hydraulic conductivity can vary by orders of magnitude, resolving such heterogeneity would require extensive field measurements that are unavailable. Therefore, this approach offers at least a partially data-informed basis for model parametrization in a data-scarce environment, instead of relying solely on literature-based or arbitrary parameter values, as is often the case in hydrologic–hydraulic modeling.
For the calibration and validation of the model, two events with the highest total precipitation from the 12 events proposed by Martins (2017) were selected: 25/02/2015 and 23/11/2015 (Table 3). These were the only events with precipitation >10 mm, complete flow records, and reported urban flooding in São Carlos (Eiras, 2017), making them consistent with the study’s objectives. Rainfall was discretized at 5-minute intervals and spatially distribute the rainfall across the Mineirinho basin using the Inverse Distance Weighting (IDW) method (Shepard, 1968) (Figure 5). The duration of the selected events was from the start of the rainfall to approximately 2 hours after the observed peak flow.

Isoietal maps for the rainfall events of 23/11/2015 (a) and 25/02/2015 (b) in the Mineirinho Basin.
The antecedent moisture condition (AMC) for the analyzed events was set as AMC III (wet soil, near saturation) according to the SCS-CN methodology, which considers rainfall accumulated over the five days preceding the event (Mishra & Singh, 2003). According to data provided by Martins (2017), for the event on 25/02/2015, rainfall from 20/02 to 24/02 totaled 28.22 mm, and for the event on 23/11/2015, rainfall from 17/11 to 22/11 totaled 30.17 mm, both corresponding to AMC III conditions.
As shown in Figure 5 (and presented in Appendix A), for the event of 23/11/2015, rain gauge P3 did not record any precipitation, despite the relative proximity of the gauges. It is likely that the rainfall did not reach the upper part of the basin or that the gauge experienced malfunctions during the event. The inclusion of P3 data with a recorded rainfall intensity of 0 mm·h−1 resulted in significantly lower discharge values compared to the observed hydrograph. Therefore, for this event, only the observed rainfall data from P2 and P7 were used.
After inputting the model data (maps and boundary conditions), to make the model more realistic, given the soil conditions during the two events with “AMC III - Wet soil, low infiltration capacity”, initial soil moisture maps were developed using CN values for type B soils, adapted to the land use and land cover classes (Tucci, 2007).
The calibration stage with the event of 25/02/2015 was carried out through manual calibration, involving adjustments to the Green-Ampt model parameters, including Ɵs (cm3.cm−3), Ɵi (cm3.cm−3), Ksat (mm.h−1), and Ψf (mm), as well as the Manning’s coefficient n (s.m−1/3), so that the flow values generated by Hydropol2D closely matched the flow measured at F1. The initial parameter values were based on those previously used in the same study area (Sousa et al., 2023).
To assess the similarity between the modeled and observed flow values, the Nash-Sutcliffe Efficiency (NSE) and the modified Kling–Gupta Efficiency (KGE’) (Kling et al., 2012) index were used (Lin et al., 2017). Moriasi et al. (2007) summarized NSE results by classifying the values into four categories, based on the performance of the simulation models: unsatisfactory (NSE < 0.5), satisfactory (0.5 < NSE < 0.65), good (0.65 < NSE < 0.75), and very good (0.75 < NSE < 1). The KGE′ (Kling et al., 2012) was calculated in order to evaluate the linear correlation between observed and simulated discharges (r), the bias ratio (β), and the variability ratio (γ) it also prevents cross-correlation between bias and variability. These components allow the assessment of: (i) temporal dynamics (the ability of the model to reproduce the observed hydrograph); (ii) systematic bias (over- or underestimation of flows); and (iii) relative variability (the preservation of flow amplitude).
The soils present in both basins are the Latossolo Vermelho-Amarelo with medium texture and the Latossolo Vermelho with clayey texture. Due to the antecedent moisture conditions observed in the calibration and validation events, the parameters Ɵsat (cm3.cm−3), Ɵi (cm3.cm−3), and Ψf (mm) were not significantly relevant in the basin of interest, as changes in their values resulted in minimal variations in the model’s responses (Gomes Junior et al., 2024b). Therefore, the selected values for LVd and LVAd soils were 0.475 and 0.463 for Ɵsat (cm3.cm−3), 0.09 and 0.029 for Ɵi (cm3.cm−3), and 316.3 and 88.9 for Ψf (mm), respectively (Brakensiek & Rawls, 1983; Cecílio et al., 2007; Sousa et al., 2023). For Ksat, the most sensitive parameter, a range of values from 1 to 100 mm.h−1 was chosen based on values used by Justino (2019) and Sobieraj et al. (2002), which were then manually adjusted through over 30 calibration tests. The selected Ksat values were 25 mm.h−1 for LVd and 28 mm.h−1 for LVAd.
The process of estimating land use parameters followed the same logic as the Green-Ampt parameter process. A literature review was conducted to identify possible values, which were then manually tested and adjusted (Sith & Nadaoka, 2017; Fathi-Moghadam et al., 2011; Liu et al., 2003; Furl et al., 2018; Sharif et al., 2010). For the land use classes of “Water,” “Trees,” “Grass,” “Crops,” “Shrubland,” “Built-up Areas,” and “Bare Soil,” the chosen values were 0.028, 0.03, 0.023, 0.02, 0.03, 0.045, and 0.044, respectively.
For the calibration event, with these selected values, the obtained NSE was 0.83 and KGE′ = 0.698; r = 0.959; β = 0.974; γ = 1.298 (Figure 6). For the validation of the selected parameters, the event of 23/11/2015 was simulated. The NSE index was calculated, yielding a value of 0.66 and KGE′ = 0.570; r = 0.846; β = 0.680; γ = 1.242 (Figure 6). The NSE calculated during the calibration stage was classified as “very good”, while the validation index was classified as “good”, according to Moriasi et al. (2007). For the KGE index, according to the performance categories proposed by Towner et al. (2019): Good (KGE ≥ 0.75); Intermediate (0.75 > KGE ≥ 0.5); Poor (0.5 > KGE > 0); Very poor (KGE ≤ 0), both events were classified as “Intermediate”. These results demonstrate satisfactory outcomes for completing the model's calibration and validation stages.

Hyetograph and Observed and Modeled Hydrograph of 25/02/2015 (starting at 6:00 PM) and 23/11/2015 (starting at 1:00 PM).
To support the manual calibration of the most influential parameters, a one-at-a-time sensitivity analysis was performed in the simulation of the urban basin to identify which model parameters exerted the greatest influence on flood extent. This analysis focused on the parameters most relevant to the conditions of the study area (AMC III and impervious surfaces). Following the approach proposed by Gomes Junior et al. (2024b), the parameters evaluated included the saturated hydraulic conductivity (Ksat) for the two soil types (LVAd and LVd) and the Manning’s roughness coefficient (n) for the two dominant land-use classes (built-up and trees) in 10-year and 100-year RP. Each parameter varied by 75% from its calibrated value, while the others remained constant.
Critical and designed events simulations
After calibrating the model and validating the chosen parameters, the next step was structuring design events, that is, idealized rainfall events used to evaluate extreme event scenarios in the basin. The selected rainfall duration was 2 hours, which is similar to the basin's concentration time and to other events analyzed during the calibration period. The method chosen for the temporal distribution of rainfall was the Alternating Block Method (Keifer & Chu, 1957), as it is a methodology consistent with the study's objective of understanding scenarios that maximize impact (Bemfica et al, 2000; Gomes Junior et al., 2025), in addition to being one of the design storm temporal distribution methods included within the functionalities of the HydroPol2D model (Gomes Junior et al., 2024a, 2023c). Finally, rainfall intensity was calculated using a current IDF, to represent intense events that have occurred and still occur in the basin, and future IDFs, adjusted to incorporate the effects of climate change on precipitation, each applied to return periods (RPs) of 100, 50, 25, and 10 years. The 100-yr return period is widely adopted worldwide as a common reference for defining flood-risk areas, particularly when assessing large-scale flood protection structures, such as dikes (Gomes Junior et al, 2025; Huang & Wang, 2020). Shorter return periods, such as 25 and 10 years, were also considered, as they are commonly used in the analysis of urban drainage systems (Decina & Brandão, 2016; Dottori et al., 2022). Although this study does not directly evaluate such systems, its focus on an urban basin may provide valuable insights for future drainage-related assessments.
For the analysis of current extreme events, the IDF generated by Gomes Junior et al. (2021) was chosen, with the following parameter values: a of 819.67; b of 0.1388; c of 10.88; d of 0.75. The study by Jochelavicius et al. (2022) uses the ETA-MIROC5 models for RCP 4.5 and 8.5 scenarios and HadGEM for the RCP 4.5 scenario, with DM and PT bias correction procedures, to generate IDFs adapted for the city of São Carlos (SP) for the analysis periods of 2015 to 2050 and 2051 to 2099. As highlighted by Kundzewicz et al. (2018), there are two main approaches to address climate change uncertainties: (i) the multi-model probabilistic approach, which combines different models to obtain a distribution of possible outcomes; and (ii) the precautionary approach, which prioritizes the consideration of worst-case scenarios for risk management and adaptation planning. In this study, given the limitations in data availability, we followed the precautionary approach and selected the IDFs that represented the most critical precipitation scenarios among those evaluated by Jochelavicius et al. (2022).
Therefore, the IDFs proposed for MIROC5 RCP 4.5 and RCP 8.5 (PT) for the 2051 to 2099 period were used, with the following parameter values: a of 1007.77 and 1036.49; b of 0.26 and 0.24; c of 12.0 and 12.0; d of 0.76 and 0.76, respectively. In Figure 7, it is possible to see the comparison of IDFs conducted by Jochelavicius et al. (2022) between the selected current IDF and the future IDFs for the scenarios with the highest rainfall intensities (for the period 2051 to 2099 PT) for return periods of 5 and 50 years, respectively.

Comparison of IDFs for the current period and the 2051–2099 period with climate change PT, for 5-year and 50-year return periods. Adapted from Jochelavicius et al., 2022.
RESULTS AND DISCUSSION
After completing the steps outlined in the methodology section, the main results extracted by the model outputs were the maximum depth maps for each evaluated scenario (Current, MIROC5 RCP 4.5 PT, and MIROC5 RCP 8.5 PT). These maps were then used for further analyses, such as differences in maximum depths between future and current events and the total flooded areas for each scenario. The variations in flooded areas and water levels reflect the changes in rainfall intensity generated for each IDF and return period (RP).
Calibration and validation
After the manual calibration and validation procedures, the following model parameters were obtained (Tables 4 and 5).
Given the initial AMC conditions applied in the events, some hydrological processes, such as percolation and evapotranspiration, had a minimal influence on the results. Under these near-saturation scenarios and considering that most of the basin area is impervious, infiltration and its associated parameters became less relevant. In such conditions, runoff generation is mainly controlled by land cover and topography. However, under non-extreme events or drier soil conditions, soil properties would play a more significant role, making soil parameters more sensitive.
The sensitivity analysis results (Figure 8) indicate that the parameters exerting the strongest influence on the model output were the Ksat values for both soil types, particularly LVAd, for which a 75% reduction increased the flooded area by up to 52%. Variations in Manning’s n had a smaller impact compared to Ksat, although changes in the urban roughness coefficient were more relevant for the lower RP (10-year) event. This can be attributed to the fact that, in highly urbanized catchments, flooding can occur even during moderate rainfall events. The roughness of tree-covered areas showed limited influence, with flood area variations within ±3%.
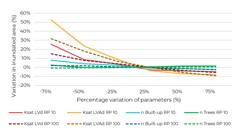
Sensitivity of the simulated inundated area to variations in key hydrological–hydraulic parameters.
In addition, NSE and KGE′ performance indices were calculated (Table 6).
Regarding the NSE index, the results were classified as “very good” for calibration and “good” for validation (Moriasi et al., 2007). In relation to the KGE′ index, calibration results indicated that the model adequately reproduced the temporal dynamics of peaks and recessions and produced a simulated mean discharge close to the observed mean, although with higher variability. For the validation event, the model performance decreased, as also reflected in the NSE, mainly due to the underestimation of total discharge volume. Nevertheless, the correlation remained strong, and variability was similar to calibration. According to the classification proposed by Towner et al. (2019), both calibration and validation events fall into the “Intermediate” category for KGE. Therefore, the model can be considered reliable in capturing the temporal dynamics of floods (given the high r values), but improvements are needed, especially in the validation event, to better represent the total flow volume.
It is also necessary to explicitly acknowledge the uncertainties associated with the calibration and validation procedures. Regarding observed data, potential uncertainties may arise from measurement devices, field operations, and data management (since the dataset dates back to 2015). For example, in the 23/11/2015 event, no additional precipitation peak was recorded that could justify the second discharge peak. Another aspect is the steep slope of the recession limb in the validation hydrograph, which may indicate measurement uncertainty or the influence of micro-drainage structures in the Mineirinho basin that were not considered in this study. Additional uncertainties are inherent to the use of hydrological-hydrodynamic models, which simplify real-world conditions, as well as to the input data of the land use and land cover map, since the current LULC map was used instead of the one from 2015 (the year of the monitored events).
Maximum depths
The obtained maximum depth ranged from 0 (for non-flooded areas) to 6.72 m, with the highest value recorded in the downstream reach of the basin, near the Monjolinho Hydroelectric Power Plant, for the MIROC5 RCP 4.5 scenario. Maximum depths ranged from approximately 5.3–5.6 m for the current IDF, 5.8-6.7 m for the future MIROC5 RCP 4.5 and 5.7-6.6 for the future MIROC5 RCP 8.5, increasing with the return period.
A critical depth threshold of 3 m was adopted to highlight areas with potentially severe impacts, corresponding to typical houses heights and is also approximately half the average of the highest depths observed in each scenario (Figure 9).
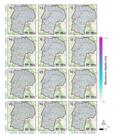
Maximum depth maps generated for each scenario. Maps (a) to (d) correspond to current events, maps (e) to (h) represent the future scenario MIROC5 RCP 4.5 PT, and maps (i) to (l) correspond to the future scenario MIROC5 RCP 8.5 PT, with return periods (RP) of 100, 50, 25, and 10 years, respectively.
As expected, the regions with the greatest depths across all scenarios were the areas of rivers and streams within the basin, as well as their surroundings. The locations with critical depths (above 3 m) were primarily junction points between streams or between streams and the Monjolinho River, as well as areas with steeper slopes in the basin (undulating terrain). This is because, at river junctions, the volume of water in the channel increases, consequently raising the depth. Areas with steeper slopes tend to drain water more rapidly to lower, generally flatter areas, also contributing to greater depths at flow junctions. Additionally, when analyzing the critical depth regions based on land use and land cover, it is evident that the most affected land use category for depths above 3 m is “trees” (accounting for 58-68% of the total area with critical maximum depths), followed by "built-up areas" (22-40%) and "crops" (2-6%), varying slightly between scenarios. The areas with critical depths range from 0.1 km2 (for the current IDF scenario with a 10-year return period) to 1.31 km2 (for the MIROC5 RCP 4.5 IDF scenario with a 100-year return period).
The "trees" category is the most affected because, as mentioned in Section 2.2 on basin characterization, trees are mainly located near water bodies, which are the deepest areas and there are some plantation areas near rivers, which also makes this land use type vulnerable. The proportion of the "built-up areas" category is related to the fact that the study area is an urbanized region with impervious surfaces, contributing to rapid surface runoff that accumulates in urban channels, streams, and rivers. For this same reason, the “Current IDF and 10-year return period” scenario had the highest percentage of affected construction areas in relation to the total critical area, as built-up areas tend to experience flooding even during low return periods, an issue that is common in the city of São Carlos.
Moreover, it is of interest to the study to analyze recurrent flooding points to understand how the depths behave according to each scenario. Eiras (2017) conducted a mapping study on susceptibility to hazardous geological and hydrological events for the city of São Carlos. The study analyzed the frequency of historical events (482 records between 1965 and 2016) in relation to the area. As a result, floods were the most frequent hazardous events, and the main locations with the highest incidence were the Mercado Municipal (Municipal Market) region, the Rotatória do Cristo (Christ Rotunda), and the Praça do Kartódromo (Karting Square) (Eiras, 2017). Therefore, the maximum depth results for these three regions were analyzed across the different scenarios (with all figures presented in Appendix B). For the 100-year return period, the results were compiled and presented in Figure 10.

Maps of maximum depths generated for each scenario with 100-year RP. The maps from a) to c) are for current events, the maps from d) to f) are for the future MIROC5 RCP 4.5 PT scenario, and the maps from g) to i) are for the future MIROC5 RCP 8.5 PT scenario, for the Mercado Municipal, Rotatória do Cristo and Kartódromo regions, respectively.
For the Mercado Municipal lowlands region, the scenarios that show more locations with depths ≥ 3 m are those of climate change, especially for high return periods (50 and 100 years). For the current IDF, the maximum depths only reach critical values at specific points along the channels. This result suggests that, even with lower depths, current events already cause considerable damage. Therefore, future events with climate change are likely to result in even more severe impacts.
At the Rotatória do Cristo, it can be observed that for all scenarios, critical depths (above 3 m) occur. In the more extreme scenarios (IDF MIROC5 RCP 4.5 RP 100 and IDF MIROC5 RCP 8.5 RP 100), almost the entire region of the water bodies presents critical depths. This result makes sense given the location of the Rotunda, as this area is the confluence of the Monjolinho River with the outlets of the Mineirinho and Gregório basins, two highly urbanized basins. Furthermore, as seen in the model results and in Eiras (2017), this area has been problematic even in the current scenario, even with low return period rainfall.
In the vicinity of the Praça do Kartódromo, the difference in areas with critical depth between the current IDF scenarios and future scenarios is noticeable, especially for return periods (RPs) of 100 years. Currently, this area already faces flooding as it serves as the junction point of the Santa Maria do Leme basin outlet with the Monjolinho River, in addition to receiving, further downstream, the waters of the Tijuco Preto basin. However, according to the model, the depths in most of the area do not reach 3 m. Thus, the change predicted for future scenarios can be explained by the saturation of the soil's infiltration capacity in the basin. Since the Santa Maria do Leme and the Area of Protection and Recovery of Public Water Supply Springs (APREM) of Monjolinho basins are sparsely urbanized, much of the water from less intense rainfall infiltrates. This ceases to occur for more intense rainfall, such as those with higher return periods (100 and 50 years) in future IDFs, leading to increased surface runoff and a potential for more severe flooding.
Maximum depths differences
The next analysis was the difference in maximum depths between future and current scenarios. Figure 11 was generated to identify which areas are prone to an increase in flood depth or, in some cases, to experiencing flooding for the first time. Such assessments are important because areas that rarely face flooding or experience it with lower intensity often lack adequate infrastructure or action plans for these events (Kyne & Kyei, 2024). With climate change, these regions may become even more vulnerable, as the lack of preparedness increases the risk of damage during future extreme events.

Maximum depth differences between future and current events. The maps from a) to d) show the difference between the MIROC5 RCP 4.5 PT scenarios and current events, while the maps from e) to h) show the difference between the MIROC5 RCP 8.5 PT scenarios and current events, with return periods (RP) of 100, 50, 25, and 10, respectively.
For the 100-year return period (RP), the main points with a significant depth increase (>2 m) include the junction of the Santa Maria do Leme basin outlet and the Tijuco Preto basin with the Monjolinho River (near Praça do Kartódromo), the SP-318 highway interchange, UFSCar (near the Monjolinho Reservoir), and the outlet of the Água Fria basin. For the 50-year RP, the same regions from the 100-year RP experienced an increase in maximum depth, but to a lesser extent. The most noticeable depth increase occurs at the SP-318 interchange. For the 25- and 10-year RPs, the largest depth differences, exceeding 2.5 m, were recorded only near the SP-318 interchange and the Monjolinho Reservoir. These differences are likely due to the saturation of the soil's infiltration capacity, as explained in the previous section, especially in sparsely urbanized basins, such as Santa Maria do Leme, APREM of Monjolinho, and Água Fria.
The same analysis was conducted with a focus on frequently flooded points: Mercado Municipal, Rotatória do Cristo, and Praça do Kartódromo, for the RP of 100-year (Figure 12) confirming the results outlined in the previous paragraph. For the other RP all the figures are presented in Appendix C. For the Mercado Municipal lowlands region, there are no significant depth differences between future scenarios and the current one for all RPs, with values below 1.5 m. For the Rotatória do Cristo, there is also no significant depth change for the 50-, 25-, and 10-year RPs (difference < 1.5 m). However, for the 100-year RP, both future scenarios show differences of up to 2 m for some points in the region. Finally, for the vicinity of Praça do Kartódromo, the scenarios for the lower RPs (25 and 10 years) show no significant changes, but for the 50- and 100-year RPs, depth differences may vary by up to 2.5 m.

Differences in maximum depths between future and current events with 100-year RP. Maps a) to c) show the difference between the MIROC5 RCP 4.5 PT scenarios and current events, while maps d) to f) show the difference between the MIROC5 RCP 8.5 PT scenarios and current events, for the Mercado Municipal, Rotatória do Cristo and Kartódromo regions, respectively.
Total flooded areas
In order to understand whether there was an increase in total flooded areas between the current IDF scenario and the future IDF scenarios, the areas where the model indicated flood depths greater than 0.3 m were calculated. The threshold of 0.3 m was chosen to account for model inaccuracies and uncertainties, such as the low spatial resolution of the DEM, and because it is a value commonly used in flood studies (Gomes Junior et al., 2024a). The total flooded areas for the different scenarios can be seen in Figure 13.

Total flooded areas for all scenarios with depths greater than 0.3 m, calculated for the entire urban basin of São Carlos.
Flooded areas (≥0.3 m) ranged from approximately 4.6–6.7 km2 under the current IDF and 7–11 km2 under future MIROC5 scenarios, increasing with the return period (Figure 13). This trend indicates a consistent expansion of flood-prone zones under future rainfall intensities. The average increase in flooded area across return periods is 1.3 km2 for future scenarios and 0.7 km2 for the current scenario. To facilitate comparison between the total flooded areas for the current and future scenarios, the percentage increase in flooded areas (≥0.3 m) was also estimated.
The results show that this increase is most significant for the 100-year return period (RP), reaching up to 72.36% in the MIROC5 RCP 4.5 scenario. This increase progressively decreases as the RP shortens, dropping to 57.64% for the 10-year RP in the MIROC5 RCP 8.5 scenario. These results indicate that the longer the return period, the greater the expansion of flood-prone areas under future climate conditions, with the MIROC5 RCP 4.5 scenario consistently showing the highest increases.
Finally, a study was carried out to assess the increase in flooded areas according to land use and land cover types. For this, only the classes "trees," "built-up areas" and "crops", the most prevalent throughout the basin, were considered as "flooded areas." After calculating the total flooded area values for these three land use types across different scenarios, the percentage increases between the current scenario and the two future scenarios were computed, the resulting figures are presented in Appendix D.
The land use category that experienced the highest percentage increase in inundated areas across different return periods (RPs) was "crops". Inundated areas for this class nearly doubled for the 100-year RP in both future scenarios (MIROC5 RCP 4.5 and 8.5), as well as for MIROC5 RCP 4.5 under the 25-year RP. This behavior is explained by the location of croplands in less urbanized sub-basins of the study area. Under current conditions, these areas experience minimal flooding because infiltration reduces surface runoff. However, in future climate scenarios, with more intense rainfall and longer return periods, soils in these sub-basins tend to saturate, generating localized flooding near channels, where the crops are located. It is important to emphasize that this increase is expressed in percentage terms, relative to the inundated cropland area under the current IDF scenario, as the absolute inundated areas for cropland remained small, not exceeding 0.7 km2 in any of the scenarios analyzed.
For the "trees" land use class, the percentage increase in inundated areas across the four RPs remains relatively consistent, ranging from 64.23% (100-year RP) to 69.63% (25-year RP) for the MIROC5 RCP 8.5 scenario, and from 70.32% (100-year RP) to 73.93% (25-year RP) for MIROC5 RCP 4.5. In this case, as forested areas are the most affected by flooding due to their proximity to rivers and streams, the percentage increase translates into an absolute gain of 1.79 km2 (MIROC5 RCP 8.5, 10-year RP) to 2.9 km2 (MIROC5 RCP 4.5, 100-year RP).
For the “built-up” land use class, a logarithmic trend in the increase of inundated area percentages can be observed for both future scenarios, starting at approximately 35% (10-year RP) and reaching around 60% for the 100-year RP. Built-up areas are the second most affected land use type, and this percentage increase corresponds to an absolute increase in inundated area ranging from 0.5 to 1.2 km2.
Model uncertainties
The use of a medium‐resolution DEM (30 m) in an urban catchment introduces uncertainties into flood simulations. For small and highly urbanized basins, such as the one analyzed in this study, DEMs with 30 m resolution do not adequately capture the fine‐scale features of narrow rivers and urban drainage structures, which in our case range between 15 and 25 m in channel width. The lack of detailed representation of urban infrastructure can alter the local flood pathway, underestimating both the inundation extent and the inundation depth in low‐lying areas (Jiang et al., 2022). Moreover, using a coarser resolution alters the definition of the river and its conveyance capacity in such a way that flooding may be overestimated, i.e., the extent and depth of inundated areas appear larger than they would (Jiang et al., 2022). Additionally, utilizing global digital elevation models (GDEMs), such as the 30 m DEM used in this study, in flood simulations generally leads to underestimation of flood depth, resulting in a more uniform spatial depth distribution (Zandsalimi et al., 2024).
Despite these limitations, several studies have demonstrated that 30 m DEMs can still provide robust and meaningful results for flood hazard modeling when compared to DEMs of slightly higher resolution (e.g., 12.5 m) (Zandsalimi et al., 2024), and that model accuracy decreases more substantially at coarser resolutions, such as 60 or 90 m (Aristizabal et al., 2024). For example, Zandsalimi et al. (2024) observed that two GDEMs (NASADEM‐30 and SRTM‐30) were consistent in identifying potential flood areas and their spatial distribution. The use of globally available DEMs also ensures methodological consistency and allows comparability of results across regions, in addition to requiring less computational resources, enabling large‐scale or data‐scarce applications (Bates et al., 2021; Wing et al., 2024). In the specific context of this study, where high return period events are analyzed, small‐scale urban drainage elements become less relevant for the overall flood dynamics, and the 30 m DEM proves sufficient to capture the broader inundation patterns, with the results remaining valuable as a first‐order assessment of flood hazard.
Additional uncertainties are inherent to the use of hydrological-hydrodynamic models, which simplify real-world conditions. For instance, in this study, we used a 2D model. Such models represent water flow in two horizontal dimensions (x and y), allowing for a more detailed simulation of lateral expansion and flood propagation compared to 1D models, including variations in depth, velocity, and spatial extent. However, they do not simulate vertical flow, which is a simplification typical of this type of study, since 3D modeling requires high computational cost and is generally more useful in specific situations (e.g., flows in estuaries or around complex structures), which was not the case in this study (Teng et al., 2017).
Uncertainty is also associated with input data, such as climate model outputs and land use/land cover maps. In this study, current maps were used, but land use and climate conditions are expected to change in the future, which may affect flood distribution. Additionally, micro- and macro-drainage structures were not considered due to the lack of detailed network data. Although these structures can influence flow routing in urban areas, their effect is expected to be minor for high-return-period flood events.
CONCLUSIONS
In this study, the developed methodology framework for flood modeling under climate change follows a structure that includes the characterization of the basins of interest, collection and validation of observed data, manual calibration and validation of the model, and the simulation of extreme design events under current and future rainfall conditions using the two-dimensional, fully distributed hydrodynamic model HydroPol2D.
Based on the results generated by the model under different scenarios, several conclusions can be drawn. Among all the modeled scenarios the MIROC5 RCP 4.5 scenario with a 100-year return period is the most critical for Sao Carlos, showing more areas with critical water depths and larger total inundated areas. In contrast, the current scenario with a 10-year return period is the least critical, displaying fewer critical depth areas and smaller flooded extents. The city’s most flood-prone locations, such as the Mercado Municipal, the Rotatória do Cristo, and the Praça do Kartódromo region, tend to worsen under future scenarios, especially for higher return periods such as 50- and 100-year events, becoming areas with depths exceeding 3 meters in most areas close to channels. In most cases, the regions with the greatest depths were confluence points between tributaries and the Monjolinho River, particularly those from urban sub-basins such as Gregório, Mineirinho, and Tijuco Preto, and areas with steeper slopes.
The analysis of the differences in maximum depths, identified areas with increased flood vulnerability in future scenarios. These include locations that, under the current IDF, were either not flooded or experienced only shallow flooding, but are projected to have significantly greater flood depths under future climate conditions. Examples include the outlets of the Santa Maria do Leme and Tijuco Preto basins into the Monjolinho River (near the Praça do Kartódromo), the SP-318 highway interchange, areas near the Monjolinho reservoir, and the mouth of the Água Fria basin. Lastly, the analysis of inundated areas and flood depths by land use and cover types revealed consistent patterns across all scenarios tested. Tree-covered areas were the most affected, followed by built-up areas and croplands.
These outcomes underscore the advantages of two-dimensional hydrodynamic modeling for urban flood studies. Unlike 1D approaches, 2D models capture the spatial variability of flood extent, depth, and flow velocity, particularly in complex or urbanized terrains where flow is multidirectional, providing more realistic flood propagation and supporting detailed risk mapping. The findings highlight the importance of assessing flood hazards under climate change, especially in Brazilian cities that developed with limited urban planning and lack monitoring and alert infrastructure. Identifying areas likely to experience increased flood depth or new inundations is crucial for guiding land-use planning, adaptation strategies, and mitigation policies.
Despite some limitations, such as the use of a single climate model (MIROC5), the absence of high-resolution DEM and sub-daily rainfall data for the catchment of interest, and uncertainties in land-use and channel representation, this study provides valuable insights for data-scarce regions. The proposed framework demonstrates that meaningful flood modeling, including the identification of potential flood areas and their spatial distribution, can be achieved even when sufficient observed data are not available to support the calibration and validation of more complex models, and may serve as a reference for other Brazilian basins facing similar data constraints. Future research should focus on reducing these uncertainties by employing higher-resolution datasets, incorporating detailed drainage infrastructure, and calibrating with multiple rainfall–runoff events. Strengthening such analyses at a national scale could support the design of more effective flood-risk management and climate-adaptation policies for Brazilian cities.
ACKNOWLEDGEMENTS
We would like to acknowledge Renata Genova Martins for sharing precipitation and streamflow data for the calibration of the model in the São Carlos city, Brazil. This research received institutional support from the São Paulo Research Foundation (FAPESP) through the projects CLIMARES (Climate Crisis and Disasters Resilience Research Center) (FAPESP 24/00949-5) and DREAMS (Flash drought event evolution characteristics and the response mechanism to climate change considering spatial correlation) (FAPESP 22/08468-0).
-
DATA AVAILABILITY STATEMENT
Research data is only available upon request. The public datasets used as model inputs (soil, land use/land cover, and digital elevation models) are described in the manuscript. The rainfall and discharge datasets used for calibration are available from the authors upon request.
Appendix A Rainfall intensity data by rain gauge.
Figures A1 and A2 present the rainfall intensity data observed by rain gauge for the events of 25/02/2015 and 23/11/2015.
Figure A1 - Rainfall intensity measured by rain gauges during the 25/02/2015 event
Figure 2 - Rainfall intensity measured by rain gauges during the 23/11/2015 event

Appendix B Maximum depths at the study’s regions of interest.
Figures B1 to B3 present the maps of maximum depths generated for each scenario in the Mercado Municipal, Rotatória do Cristo and Praça do Kartódromo regions, respectively.
Figure B1 - Maps of maximum depths generated for each scenario in the Mercado Municipal region. The maps from a) to d) are for current events, the maps from e) to h) are for the future MIROC5 RCP 4.5 PT scenario, and the maps from i) to l) are for the future MIROC5 RCP 8.5 PT scenario, with return periods (RP) of 100, 50, 25, and 10, respectively
Figure B2 - Maps of maximum depths generated for each scenario in the Rotatória do Cristo region. Maps a) to d) represent current events, maps e) to h) represent the future MIROC5 RCP 4.5 PT scenario, and maps i) to l) represent the future MIROC5 RCP 8.5 PT scenario, with return periods (RP) of 100, 50, 25, and 10, respectively
Figure B3 - Maps of maximum depths generated for each scenario in the Praça do Kartódromo region. Maps a) to d) represent current events, maps e) to h) represent the future MIROC5 RCP 4.5 PT scenario, and maps i) to l) represent the future MIROC5 RCP 8.5 PT scenario, with return periods (RP) of 100, 50, 25, and 10, respectively

Appendix C - Maximum depths differences at the study’s regions of interest.
Figures C1 to C3 present maps with the differences in maximum depths between future and current events for the in the Mercado Municipal, Rotatória do Cristo and Praça do Kartódromo regions, respectively.

Figure C1 - Differences in maximum depths between future and current events for the Mercado Municipal lowlands. Maps a) to d) show the difference between the MIROC5 RCP 4.5 PT scenarios and current events, while maps e) to h) show the difference between the MIROC5 RCP 8.5 PT scenarios and current events, with return periods (RP) of 100, 50, 25, and 10, respectively
Figure C2 - Differences in maximum depths between future and current events for the Rotatória do Cristo. Maps a) to d) show the difference between the MIROC5 RCP 4.5 PT scenarios and current events, while maps e) to h) show the difference between the MIROC5 RCP 8.5 PT scenarios and current events, with return periods (RP) of 100, 50, 25, and 10, respectively
Figure C3 - Differences in maximum depths between future and current events for the Praça do Kartódromo. Maps a) to d) show the difference between the MIROC5 RCP 4.5 PT scenarios and current events, while maps e) to h) show the difference between the MIROC5 RCP 8.5 PT scenarios and current events, with return periods (RP) of 100, 50, 25, and 10, respectively
Appendix D - Maximum depths differences at the study’s regions of interest.
Figures D1 to D3 present the percentage increases between the current scenario and the two future scenarios according to land use and land cover types. For this, only the classes "trees," "built-up areas" and "crops" were considered.

Figure D1 - Percentage difference between the current and future scenarios for the land use class "trees"
Figure D2 - Percentage difference between the current and future scenarios for the land use class "built-up areas"
Figure D3 - Percentage difference between the current and future scenarios for the land use class "crops"
REFERENCES
-
Abreu, F. G. (2019). Quantificação dos prejuízos econômicos à atividade comercial derivados de inundações urbanas (Tese de doutorado). Escola de Engenharia de São Carlos, Universidade de São Paulo, São Carlos. https://doi.org/10.11606/T.18.2019.tde-23102020-105726
» https://doi.org/10.11606/T.18.2019.tde-23102020-105726 -
Aristizabal, F., Chegini, T., Petrochenkov, G., Salas, F., & Judge, J. (2024). Effects of high-quality elevation data and explanatory variables on the accuracy of flood inundation mapping via Height Above Nearest Drainage. Hydrology and Earth System Sciences, 28(6), 1287-1315. https://doi.org/10.5194/hess-28-1287-2024
» https://doi.org/10.5194/hess-28-1287-2024 -
Bates, P. D., Horritt, M. S., & Fewtrell, T. J. (2010). A simple inertial formulation of the shallow water equations for efficient two-dimensional flood inundation modelling. Journal of Hydrology, 387(1–2), 33-45. https://doi.org/10.1016/j.jhydrol.2010.03.027
» https://doi.org/10.1016/j.jhydrol.2010.03.027 -
Bates, P. D., Quinn, N., Sampson, C., Smith, A., Wing, O., Sosa, J., Savage, J., Olcese, G., Neal, J., Schumann, G., Giustarini, L., Coxon, G., Porter, J. R., Amodeo, M. F., Chu, Z., Lewis-Gruss, S., Freeman, N. B., Houser, T., Delgado, M., Hamidi, A., Bolliger, I., McCusker, K. E., Emanuel, K., Ferreira, C. M., Khalid, A., Haigh, I. D., Couasnon, A., Kopp, R. E., Hsiang, S., & Krajewski, W. F. (2021). Combined modeling of US fluvial, pluvial, and coastal flood hazard under current and future climates. Water Resources Research, 57, e2020WR028673. https://doi.org/10.1029/2020WR028673
» https://doi.org/10.1029/2020WR028673 -
Bemfica, D., Silveira, A., & Goldenfum, J. (2000). Análise da aplicabilidade de padrões de chuva de projeto a Porto Alegre. RBRH, 5(4), 5-16. https://doi.org/10.21168/rbrh.v5n4.p5-16
» https://doi.org/10.21168/rbrh.v5n4.p5-16 -
Brakensiek, D. L., & Rawls, W. J. (1983). Agricultural management effects on soil water processes part II: green and ampt parameters for crusting soils. Transactions of the ASAE. American Society of Agricultural Engineers, 26(6), 1753-1757. https://doi.org/10.13031/2013.33838
» https://doi.org/10.13031/2013.33838 -
Brown, C. F., Brumby, S. P., Guzder-Williams, B., Birch, T., Hyde, S. B., Mazzariello, J., Czerwinski, W., Pasquarella, V. J., Haertel, R., Ilyushchenko, S., Schwehr, K., Weisse, M., Stolle, F., Hanson, C., Guinan, O., Moore, R., & Tait, A. M. (2022). Dynamic World, Near real-time global 10 m land use land cover mapping. Scientific Data, 9(1), 251. https://doi.org/10.1038/s41597-022-01307-4
» https://doi.org/10.1038/s41597-022-01307-4 -
Brunner, G. W. (2016). HEC-RAS River Analysis System Modeling User’s Manual US Army Corps of Engineers Hydrologic Engineering Center. Retrieved in 2025, April 1, from http://www.hec.usace.army.mil
» http://www.hec.usace.army.mil -
Buarque, A. C. S., Souza, C. F., Souza, F. A. A., & Mendiondo, E. M. (2021). Urban flood risk under global changes: a socio-hydrological and cellular automata approach in a Brazilian catchment. Hydrological Sciences Journal, 66(14), 2011-2021. https://doi.org/10.1080/02626667.2021.1977813
» https://doi.org/10.1080/02626667.2021.1977813 -
Cecílio, R. A., Martinez, M. A., Pruski, F. F., Silva, D. D. D., & Ataíde, W. F. (2007). Substituição dos parâmetros do modelo de Green-Ampt-Mein-Larson para estimativa da infiltração em alguns solos do Brasil. Revista Brasileira de Ciência do Solo, 31(5), 1141-1151. https://doi.org/10.1590/S0100-06832007000500029
» https://doi.org/10.1590/S0100-06832007000500029 -
Chou, S. C., Lyra, A., Mourão, C., Dereczynski, C., Pilotto, I., Gomes, J., Bustamante, J., Tavares, P., Silva, A., Rodrigues, D., Campos, D., Chagas, D., Sueiro, G., Siqueira, G., & Marengo, J. (2014). Assessment of climate change over south America under RCP 4.5 and 8.5 downscaling scenarios. American Journal of Climate Change, 03(05), 512-527. https://doi.org/10.4236/ajcc.2014.35043
» https://doi.org/10.4236/ajcc.2014.35043 - Chow, V. T., Maidment, D. R., & Mays, L. W. (1988).Applied hydrology(572 p). New York: McGraw-Hill.
- Collischonn, W., & Dornelles, F. (2013). Hidrologia para engenharia e ciências ambientais Porto Alegre: Associação Brasileira de Recursos Hídricos.
- Dalmolin, R. S. D., Pedron, F. A., Azevedo, A. C., Miguel, P., & Sana, R. S. (2004). Correspondência entre o Sistema Brasileiro de Classificação de Solos (EMBRAPA, 1999), WRB (ISSSWG RB, 1998) e o Soil Taxonomy (USDA, 1999) para algumas unidades de solos do Rio Grande do Sul (Informe Técnico, No. 10, 4 p.). Santa Maria: Centro de Ciências Rurais UFSM.
-
Decina, T. G. T., & Brandão, J. L. B. (2016). Análise de desempenho de medidas estruturais e não estruturais de controle de inundações em uma bacia urbana. Engenharia Sanitária e Ambiental, 21(1), 207-217. https://doi.org/10.1590/S1413-41520201600100116134
» https://doi.org/10.1590/S1413-41520201600100116134 -
Dottori, F., Alfieri, L., Bianchi, A., Skoien, J., & Salamon, P. (2022). A new dataset of river flood hazard maps for europe and the mediterranean basin. Earth System Science Data, 14(4), 1549-1569. https://doi.org/10.5194/essd-14-1549-2022
» https://doi.org/10.5194/essd-14-1549-2022 - Dozena, A. (2008). São Carlos e seu desenvolvimento: contradições urbanas de um pólo tecnológico São Paulo: Annablume.
-
Eiras, C. G. S. (2017). Mapeamento da suscetibilidade a eventos perigosos de natureza geológica e hidrológica em São Carlos - SP (Dissertação de mestrado). Escola de Engenharia de São Carlos, Universidade de São Paulo, São Carlos. https://doi.org/10.11606/D.18.2018.tde-01032018-095311
» https://doi.org/10.11606/D.18.2018.tde-01032018-095311 -
European Space Agency – ESA. (2023). Copernicus Space Component Data Access PANDA Catalogue Retrieved in 2024, August 10, from https://panda.copernicus.eu/web/cds-catalogue/panda
» https://panda.copernicus.eu/web/cds-catalogue/panda -
Fathi-Moghadam, M., Kashefipour, M., Ebrahimi, N., & Emamgholizadeh, S. (2011). Physical and numerical modeling of submerged vegetation roughness in rivers and flood plains. Journal of Hydrologic Engineering, 16(11), 858-864. https://doi.org/10.1061/(ASCE)HE.1943-5584.0000381
» https://doi.org/10.1061/(ASCE)HE.1943-5584.0000381 -
Fava, M. C., Abe, N., Restrepo, C. E., Mendiondo, E. M., & Souza, V. C. B. (2015, November). Redução de incertezas na previsão de enchentes com uso de dados colaborativos. In Proceedings of the XXI Simpósio Brasileiro de Recursos Hídricos, Brasilia, Brasil. Retrieved in 2024, August 10, from https://www.researchgate.net/publication/286927156_Reducao_de_incertezas_na_previsao_de_enchentes_com_uso_de_dados_colaborativos
» https://www.researchgate.net/publication/286927156_Reducao_de_incertezas_na_previsao_de_enchentes_com_uso_de_dados_colaborativos -
Furl, C., Ghebreyesus, D., & Sharif, H. O. (2018). Assessment of the performance of satellite-based precipitation products for flood events across diverse spatial scales using GSSHA modeling system. Geosciences, 8(6), 191. https://doi.org/10.3390/geosciences8060191
» https://doi.org/10.3390/geosciences8060191 -
Gomes Junior, M. N. (2023a).Advances in open source hydroinformatics for flood modeling and disaster education (Tese de doutorado). Escola de Engenharia de São Carlos, Universidade de São Paulo, São Carlos. https://doi.org/10.11606/T.18.2023.tde-18042024-142515
» https://doi.org/10.11606/T.18.2023.tde-18042024-142515 -
Gomes Junior, M. N. (2023b, October 8). HydroPol2D. Versão v.0.0.1 Retrieved in 2025, January 26, from https://github.com/marcusnobrega-eng/HydroPol2D
» https://github.com/marcusnobrega-eng/HydroPol2D -
Gomes Junior, M. N., Braga, P. H. A., Mendiondo, E. M., & Reis, L. F. R. (2021). Análises estatísticas, visuais e não paramétricas para a otimização do ajuste de curvas IDF e construção de ábacos de projeto de obras hidráulicas: estudo de caso em São Carlos–SP. Revista DAE, São Paulo, 69(228), 171-189. Retrieved in 2024, October 25, from https://revistadae.com.br/artigos/artigo_edicao_228_n_1928.pdf
» https://revistadae.com.br/artigos/artigo_edicao_228_n_1928.pdf -
Gomes Junior, M. N., Castro, M. A. R. A., Sanchez, M. H., Rápalo, L. M. C., Giacomoni, M. H., Paiva, R. C. D., & Bates, P. (2024a).Spatio-temporal performance of 2d local inertial hydrodynamic models for urban drainage and dam-break applications arXiv preprint https://doi.org/10.2139/ssrn.4984679
» https://doi.org/10.2139/ssrn.4984679 -
Gomes Junior, M. N., Giacomoni, M. H., Navarro, F. A. R., & Mendiondo, E. M. (2024b). Global optimization-based calibration algorithm for a 2D distributed hydrologic-hydrodynamic and water quality model. Environmental Modelling & Software, 179, 106128. https://doi.org/10.1016/j.envsoft.2024.106128
» https://doi.org/10.1016/j.envsoft.2024.106128 -
Gomes Junior, M. N., Jalihal, V., Castro, M., & Mendiondo, E. M. (2025). Exploring the impact of rainfall temporal distribution and critical durations on flood hazard modeling. Natural Hazards, 121(9), 1-24. https://doi.org/10.1007/s11069-025-07186-3
» https://doi.org/10.1007/s11069-025-07186-3 -
Gomes Junior, M. N., Lago, C. A. F., Rápalo, L. M. C., Oliveira, P. T. S., Giacomoni, M. H., & Mendiondo, E. M. (2023c). HydroPol2D—Distributed hydrodynamic and water quality model: challenges and opportunities in poorly-gauged catchments. Journal of Hydrology, 625, 129982. https://doi.org/10.1016/j.jhydrol.2023.129982
» https://doi.org/10.1016/j.jhydrol.2023.129982 -
Guidolin, M., Chen, A. S., Ghimire, B., Keedwell, E. C., Djordjević, S., & Savić, D. A. (2016). A weighted cellular automata 2D inundation model for rapid flood analysis. Environmental Modelling & Software, 84, 378-394. https://doi.org/10.1016/j.envsoft.2016.07.008
» https://doi.org/10.1016/j.envsoft.2016.07.008 -
Huang, X., & Wang, C. (2020). Estimates of exposure to the 100-year floods in the conterminous United States using national building footprints. International Journal of Disaster Risk Reduction, 50, 101731. https://doi.org/10.1016/j.ijdrr.2020.101731
» https://doi.org/10.1016/j.ijdrr.2020.101731 -
Huber, W. C., Rossman, L. A., & Dickinson, R. E. (2005). EPA storm water management model, SWMM5. Watershed Models, 338, 359. https://doi.org/10.1201/9781420037432.ch14
» https://doi.org/10.1201/9781420037432.ch14 -
Instituto Brasileiro de Geografia e Estatística – IBGE. (2006). Solos 1:5000000 Retrieved in 2024, October 8, from https://www.ibge.gov.br/geociencias/informacoes-ambientais/pedologia/15829-solos.html
» https://www.ibge.gov.br/geociencias/informacoes-ambientais/pedologia/15829-solos.html - International Society of Soil Science Working Group RB – ISSSWG RB. (1998) World reference base for soil resources: introduction (79 p.). Wageningen: ISRIC.
-
Jiang, W., Yu, J., Wang, Q., & Yue, Q. (2022). Understanding the effects of digital elevation model resolution and building treatment for urban flood modelling. Journal of Hydrology. Regional Studies, 42, 101122. https://doi.org/10.1016/j.ejrh.2022.101122
» https://doi.org/10.1016/j.ejrh.2022.101122 -
Jochelavicius, V., Mendiondo, E. M., Gomes Junior, M. N., & Macedo, M. B. (2022). Construção de curvas Intensidade-Duração-Frequência com cenários futuros de mudanças climáticas para a cidade de São Carlos - SP visando ao dimensionamento de técnicas compensatórias. Revista DAE, 70(238), 19-32. https://doi.org/10.36659/dae.2022.065
» https://doi.org/10.36659/dae.2022.065 -
Justino, E. A. (2019). Comportamento hidrodinâmico do solo e da recarga potencial do aquífero a partir de poços de infiltração de águas pluviais (Tese de doutorado). Centro de Ciências Exatas e de Tecnologia, Universidade Federal de São Carlos, São Carlos. Retrieved in 2024, October 26, from https://repositorio.ufscar.br/handle/ufscar/12036
» https://repositorio.ufscar.br/handle/ufscar/12036 -
Keifer, C. J., & Chu, H. H. (1957). Synthetic storm pattern for drainage design. Journal of the Hydraulics Division, 83(4). https://doi.org/10.1061/JYCEAJ.0000104
» https://doi.org/10.1061/JYCEAJ.0000104 -
Kim, V. J. H., Galbetti, M. V., Brandão, J. L. B., & Schalch, V. (2019). Análise de fórmulas de Tempo de Concentração (TC) de uma bacia em urbanização: um estudo da Bacia do Mineirinho (São Carlos-SP). Brazilian Journal of Development, 5(8), 11202-11219. https://doi.org/10.34117/bjdv5n8-005
» https://doi.org/10.34117/bjdv5n8-005 -
Kling, H., Fuchs, M., & Paulin, M. (2012). Runoff conditions in the upper Danube basin under an ensemble of climate change scenarios. Journal of Hydrology, 424-425, 264-277. https://doi.org/10.1016/j.jhydrol.2012.01.011
» https://doi.org/10.1016/j.jhydrol.2012.01.011 -
Kundzewicz, Z. W., Krysanova, V., Benestad, R. E., Hov, Ø., Piniewski, M., & Otto, I. M. (2018). Uncertainty in climate change impacts on water resources. Environmental Science & Policy, 79, 1-8. https://doi.org/10.1016/j.envsci.2017.10.008
» https://doi.org/10.1016/j.envsci.2017.10.008 -
Kyne, D., & Kyei, D. (2024). Understanding associations between disasters and sustainability, resilience, and poverty: an empirical study of the last two decades. Sustainability, 16(17), 7416. https://doi.org/10.3390/su16177416
» https://doi.org/10.3390/su16177416 -
Lin, F., Chen, X., & Yao, H. (2017). Evaluating the use of Nash-Sutcliffe efficiency coefficient in goodness-of-fit measures for daily runoff simulation with SWAT. Journal of Hydrologic Engineering, 22(11), 05017023. https://doi.org/10.1061/(ASCE)HE.1943-5584.0001580
» https://doi.org/10.1061/(ASCE)HE.1943-5584.0001580 -
Liu, W. C., Hsu, M. H., & Wang, C. F. (2003). Modeling of flow resistance in mangrove swamp at mouth of tidal keelung river, Taiwan. Journal of Waterway, Port, Coastal, and Ocean Engineering, 129(2), 86-92. https://doi.org/10.1061/(ASCE)0733-950X(2003)129:2(86)
» https://doi.org/10.1061/(ASCE)0733-950X(2003)129:2(86) -
Martins, R. G. (2017).Modelagem da carga de poluição difusa em escala de bacia com valores de concentração média por evento a partir de dados de uma rede de monitoramento local (Tese de doutorado). Escola de Engenharia de São Carlos, Universidade de São Paulo, São Carlos. https://doi.org/10.11606/T.18.2017.tde-18052017-100316
» https://doi.org/10.11606/T.18.2017.tde-18052017-100316 - Mays, L. W. (2010). Water resources engineering (2nd ed.). Hoboken: John Wiley & Sons.
-
Miranda, F. M., Da Cruz Franco, A. B. R., Rezende, O. M., & Miguez, M. G. (2017). Modelagem de cheias urbanas sob cenários de mudanças climáticas. In Anais of Simpósio Brasileiro de Recursos Hídricos, Florianópolis, Brasil. Retrieved in 2025, January 16, from https://files.abrhidro.org.br/Eventos/Trabalhos/60/PAP022009.pdf
» https://files.abrhidro.org.br/Eventos/Trabalhos/60/PAP022009.pdf -
Mishra, B. K., Rafiei Emam, A., Masago, Y., Kumar, P., Regmi, R. K., & Fukushi, K. (2018). Assessment of future flood inundations under climate and land use change scenarios in the Ciliwung River Basin, Jakarta: assessment of future flood inundations under climate and land use change scenarios in the Ciliwung River Basin, Jakarta. Journal of Flood Risk Management, 11(S2), S1105-S1115. https://doi.org/10.1111/jfr3.12311
» https://doi.org/10.1111/jfr3.12311 -
Mishra, S. K., & Singh, V. P. (2003). SCS-CN Method. In S. K. Mishra & V. P. Singh (Eds.), Soil conservation service curve number (SCS-CN) methodology (pp. 84-146). Dordrecht: Springer Netherlands. https://doi.org/10.1007/978-94-017-0147-1_2
» https://doi.org/10.1007/978-94-017-0147-1_2 -
Moriasi, D. N., Arnold, J. G., Van Liew, M. W., Bingner, R. L., Harmel, R. D., & Veith, T. L. (2007). Model evaluation guidelines for systematic quantification of accuracy in watershed simulations. Transactions of the ASABE, 50(3), 885-900. https://doi.org/10.13031/2013.23153
» https://doi.org/10.13031/2013.23153 -
Mota, A. A., Grison, F., Giglio, J. N., & Kobiyama, M. (2016). Instalação de uma pequena bacia experimental florestal: estudo de caso da bacia do Rio Araponga. Engenharia Sanitária e Ambiental, 22(1), 73-80. https://doi.org/10.1590/s1413-41522016154610
» https://doi.org/10.1590/s1413-41522016154610 -
Paiva, R., Collischonn, W., Miranda, P., Petry, I., Dornelles, F., Goldenfum, J., Fan, F., Ruhoff, A., & Fagundes, H. (2024). Critérios hidrológicos para adaptação à mudança climática: Chuvas e cheias extremas na Região Sul do Brasil Porto Alegre: Instituto de Pesquisas Hidráulicas-UFRGS. Retrieved in 2024, November 17, from https://www.ufrgs.br/iph/wp-content/uploads/2024/05/CriteriosAdaptacaoMudancaClimaticaChuvasCheiasExtremasSul.pdf
» https://www.ufrgs.br/iph/wp-content/uploads/2024/05/CriteriosAdaptacaoMudancaClimaticaChuvasCheiasExtremasSul.pdf -
Pires, A. S. (2021). As novas configurações espaciais do empreendedorismo tecnológico e as experiências de trabalho no polo de tecnologia de São Carlos-SP. Revista Brasileira de Ciências Sociais, 36(106), e3610605. https://doi.org/10.1590/3610605/2021
» https://doi.org/10.1590/3610605/2021 -
Romero, G. B. (2016). Dinâmica ecohidrológica de rios urbanos no contexto de gestão de riscos de desastres (Dissertação de Mestrado). Escola de Engenharia de São Carlos, Universidade de São Paulo, São Carlos. https://doi.org/10.11606/D.18.2017.tde-13042017-160250
» https://doi.org/10.11606/D.18.2017.tde-13042017-160250 - Rossman, L. A. (2010).Storm water management model user’s manual, version 5.0(Vol. 276). Cincinnati: US Environmental Protection Agency.
-
Santa Catarina. Ministério do Desenvolvimento Regional. Secretaria Nacional de Proteção e Defesa Civil. (2022). A P&DC e os 30 anos de desastres no Brasil: (1991 - 2020) (64 p.). Florianópolis: Fepese. Retrieved in 2025, April 1, from https://www.gov.br/mdr/pt-br/centrais-de-conteudo/publicacoes/protecao-e-defesa-civil-sedec/A_p_amp_dc_e_os_30_anos_de_desastres_no_Brasil_20221_compressed.pdf
» https://www.gov.br/mdr/pt-br/centrais-de-conteudo/publicacoes/protecao-e-defesa-civil-sedec/A_p_amp_dc_e_os_30_anos_de_desastres_no_Brasil_20221_compressed.pdf - Santos, H. G., Jacomine, P. K. T., Anjos, L. H. C., Oliveira, V. A., Lumbreras, J. F., Coelho, M. R., Almeida, J. A., Araújo Filho, J. C., Oliveira, J. B., & Cunha, T. J. F. (2018). Sistema brasileiro de classificação de solos (590 p.). Brasília: Embrapa Informação Tecnológica.
-
Schardong, A., & Simonovic, S. P. (2013). Possíveis impactos de mudanças climáticas em curvas intensidade duração e frequência. In Anais of Simpósio Brasileiro de Recursos Hídricos, Bento Gonçalves, Brasil. Retrieved in 2024, December 8, from https://abrh.s3.sa-east-1.amazonaws.com/Sumarios/155/e144ef4f7023133cd2d19e1bf1cb4a77_b2f633a1163752b2c14623993ef8074a.pdf
» https://abrh.s3.sa-east-1.amazonaws.com/Sumarios/155/e144ef4f7023133cd2d19e1bf1cb4a77_b2f633a1163752b2c14623993ef8074a.pdf -
Schardong, A., Srivastav, R., & Simonovic, S. (2014). Atualização da equação intensidade-duração-frequência para a cidade de São Paulo sob efeito de mudanças climáticas. RBRH, 19(4), 176-185. https://doi.org/10.21168/rbrh.v19n4.p176-185
» https://doi.org/10.21168/rbrh.v19n4.p176-185 -
Sharif, H. O., Sparks, L., Hassan, A. A., Zeitler, J., & Xie, H. (2010). Application of a distributed hydrologic model to the November 17, 2004, flood of Bull Creek watershed, Austin, Texas. Journal of Hydrologic Engineering, 15(8), 651-657. https://doi.org/10.1061/(ASCE)HE.1943-5584.0000228
» https://doi.org/10.1061/(ASCE)HE.1943-5584.0000228 -
Shepard, D. (1968). A two-dimensional interpolation function for irregularly-spaced data. In 23rd ACM National Conference, New York, United States. Retrieved in 2024, December 19, from https://dl.acm.org/doi/abs/10.1145/800186.810616
» https://dl.acm.org/doi/abs/10.1145/800186.810616 -
Siqueira, V. A., Fan, F. M., Paiva, R. C. D., Ramos, M.-H., & Collischonn, W. (2020). Potential skill of continental-scale, medium-range ensemble streamflow forecasts for flood prediction in South America. Journal of Hydrology, 590, 125430. https://doi.org/10.1016/j.jhydrol.2020.125430
» https://doi.org/10.1016/j.jhydrol.2020.125430 -
Sith, R., & Nadaoka, K. (2017). Comparison of SWAT and GSSHA for high time resolution prediction of stream flow and sediment concentration in a small agricultural watershed. Hydrology, 4(2), 27. https://doi.org/10.3390/hydrology4020027
» https://doi.org/10.3390/hydrology4020027 -
Sobieraj, J. A., Elsenbeer, H., Coelho, R. M., & Newton, B. (2002). Spatial variability of soil hydraulic conductivity along a tropical rainforest catena. Geoderma, 108(1-2), 79-90. https://doi.org/10.1016/S0016-7061(02)00122-2
» https://doi.org/10.1016/S0016-7061(02)00122-2 -
Sousa, M. R., Gomes Junior, M. N., Oliveira, E. P., Rapalo, L. M. C., Navarro, F. A. R., & Mendiondo, E. M. (2023). Modelagem Distribuída Fisicamente baseada em Bacias Urbanas: Modelo HydroPol2D aplicado à São Carlos (SP). In Anais of Simpósio Brasileiro de Recursos Hídricos, Aracaju, Brasil. Retrieved in 2024, December 8, from https://anais.abrhidro.org.br/job.php?Job=15748
» https://anais.abrhidro.org.br/job.php?Job=15748 -
Teng, J., Jakeman, A. J., Vaze, J., Croke, B. F., Dutta, D., & Kim, S. J. E. M. (2017). Flood inundation modelling: A review of methods, recent advances and uncertainty analysis. Environmental Modelling & Software, 90, 201-216. https://doi.org/10.1016/j.envsoft.2017.01.006
» https://doi.org/10.1016/j.envsoft.2017.01.006 -
Towner, J., Cloke, H. L., Zsoter, E., Flamig, Z., Hoch, J. M., Bazo, J., Perez, E. C., & Stephens, E. M. (2019). Assessing the performance of global hydrological models for capturing peak river flows in the Amazon basin. Hydrology and Earth System Sciences, 23(7), 3057-3080. https://doi.org/10.5194/hess-23-3057-2019
» https://doi.org/10.5194/hess-23-3057-2019 - Tucci, C. E. M. (2007). Hidrologia: ciência e aplicação (4. ed., 943 p.). Porto Alegre: Editora UFRGS.
-
Weschenfelder, A. B., Klering, E. V., Alves, R. C. M., & Pinto, É. J. A. (2019). Geração de curvas IDFs para cenários projetados na cidade de Porto Alegre/RS. Revista Brasileira de Meteorologia, 34(2), 201-216. https://doi.org/10.1590/0102-77863340026
» https://doi.org/10.1590/0102-77863340026 -
Wing, O. E., Bates, P. D., Quinn, N. D., Savage, J. T., Uhe, P. F., Cooper, A., Collings, T. P., Addor, N., Lord, N. S., Hatchard, S., Hoch, J. M., Bates, J., Probyn, I., Himsworth, S., González, J. R., Brine, M. P., Wilkinson, H., Sampson, C. C., Smith, A. M., Neal, J. C., & Haigh, I. D. (2024). A 30 m Global Flood Inundation Model for Any Climate Scenario. Water Resources Research, 60(8), e2023WR036460. https://doi.org/10.1029/2023WR036460
» https://doi.org/10.1029/2023WR036460 -
Zaffani, A. G. (2012). Poluição difusa da drenagem urbana ecohidrológica: diagnóstico atual e cenários de longo prazo em bacias urbanas de São Carlos, SP (Dissertação de Mestrado). Escola de Engenharia de São Carlos, Universidade de São Paulo, São Carlos. https://doi.org/10.11606/D.18.2012.tde-09012013-085216
» https://doi.org/10.11606/D.18.2012.tde-09012013-085216 -
Zandsalimi, Z., Feizabadi, S., Yazdi, J., & Salehi Neyshabouri, S. A. A. (2024). Evaluating the Impact of Digital Elevation Models on Urban Flood Modeling: A comprehensive analysis of flood inundation, hazard mapping, and damage estimation. Water Resources Management, 38(11), 4243-4268. https://doi.org/10.1007/s11269-024-03862-4
» https://doi.org/10.1007/s11269-024-03862-4 -
Zhang, Y., Wang, Y., Chen, Y., Liang, F., & Liu, H. (2019). Assessment of future flash flood inundations in coastal regions under climate change scenarios-A case study of Hadahe River basin in northeastern China. The Science of the Total Environment, 693, 133550. https://doi.org/10.1016/j.scitotenv.2019.07.356
» https://doi.org/10.1016/j.scitotenv.2019.07.356
Edited by
-
Editor-in-Chief:
Adilson Pinheiro
-
Associated Editor:
Priscilla Macedo Moura
Research data is only available upon request. The public datasets used as model inputs (soil, land use/land cover, and digital elevation models) are described in the manuscript. The rainfall and discharge datasets used for calibration are available from the authors upon request.


