 Assessing the socioeconomic benefits of the Agreste Adduction System in Pernambuco, Brazil
ABSTRACT
Government intervention in water infrastructure is justified where markets cannot ensure equitable, efficient provision of essential services. Water systems exhibit public goods and natural monopolies characteristics, limiting private incentives. High fixed costs and diffuse social benefits constrain efficiency, while short planning horizons and failure to internalize positive externalities drive chronic underinvestment. In Pernambuco’s semi-arid Agreste—marked by irregular rainfall and no perennial rivers—these failures are acute, and chronic scarcity justifies public leadership in supply expansion. The Agreste Adduction System, integrated with the São Francisco River Integration Project, was designed to provide treated water to 64 municipalities. This study applies a social cost–benefit analysis under two scenarios: (i) baseline—continuation of current water risk, without induced demand/irrigation; and (ii) alternative—adduction system implementation, generating cost-avoidance and induced-demand benefits. Results confirm economic viability: NPSV of R$ 838.28 million, ERR of 22.62%, and B/C ratio of 2.21, indicating substantial net gains through reduced water insecurity. To address the most uncertain item, we test electricity shares of 40%, 60%, and 80% of total O&M; NPSV falls to R$ 748.21–663.91 million, ERR to 21.51–20.49%, and B/C to 1.95–1.76. Beyond energy, complementary risk analyses would further strengthen robustness and policy confidence.
Keywords:
Human water supply; PISF; Cost-benefit analysis; Water resources
RESUMO
A intervenção governamental em infraestrutura hídrica é justificada quando os mercados não conseguem garantir a provisão equitativa e eficiente de serviços essenciais. Os sistemas de abastecimento de água apresentam características de bens públicos e monopólios naturais, o que limita os incentivos privados. Os altos custos fixos e os benefícios sociais difusos restringem a eficiência, enquanto os horizontes de planejamento curtos e a incapacidade de internalizar externalidades positivas resultam em subinvestimento crônico. No Agreste semiárido de Pernambuco — marcado por chuvas irregulares e ausência de rios perenes — essas falhas são particularmente agudas, e a escassez crônica justifica a liderança pública na expansão da oferta. O Sistema Adutor do Agreste, integrado ao Projeto de Integração do Rio São Francisco (PISF), foi concebido para fornecer água tratada a 64 municípios. Este estudo aplica uma análise custo-benefício social sob dois cenários: (i) cenário de referência — continuidade do risco hídrico atual, sem demanda induzida ou irrigação autônoma; e (ii) cenário alternativo — implementação do sistema adutor, gerando benefícios de economia de custos e demanda induzida. Os resultados confirmam a viabilidade econômica: VPL social de R$ 838,28 milhões, TIR econômica de 22,62% e razão B/C de 2,21, indicando ganhos líquidos substanciais pela redução da insegurança hídrica. Para tratar o item operacional mais incerto, testaram-se participações de eletricidade de 40%, 60% e 80% do total de O&M; o VPL caiu para R$ 748,21–663,91 milhões, a TIR para 21,51–20,49% e a razão B/C para 1,95–1,76. Além dos custos energéticos, análises de risco complementares reforçariam a robustez e a confiança das políticas.
Palavras-chave:
Abastecimento humano; PISF; Análise de custo-benefício; Recursos hídricos
Introduction
Water is a finite yet renewable resource, and its universal access through sustainable withdrawal practices is essential to address water scarcity (Lima & Granziera, 2018). Access to water has been internationally recognized as a fundamental human right (UN, 2010) and is a key determinant of regional development. Sachs (2001) and the Stockholm International Water Institute (2005) have shown a positive correlation between water supply and economic growth—and, conversely, its absence is strongly associated with underdevelopment. Consequently, Kolahi et al. (2024) argues that water management should occupy a central role in regional development strategies, given its role as an integrative resource across multiple uses and sectors, essential to both ecological balance and economic vitality.
Rising water demand, driven by population growth—particularly in urban areas—and economic expansion (Sanchez et al., 2020), is compounded by climate change impacts on hydrological cycles, which increase the frequency of extreme events and threaten the balance required for sustainable water availability (Duchenne-Moutien & Neetoo, 2021; Marchioni et al., 2023). Coupled with weak planning, fragmented institutions, and chronic underinvestment, these pressures produce persistent insecurity and episodic crises in Brazil over the past decade (Millington, 2018).
These structural factors indicate that water insecurity in Brazil is not merely climatic but institutional. Addressing these structural drivers requires a transition from crisis response to risk prevention through improved planning, demand regulation, monitoring, and maintenance of hydraulic systems, alongside strategic investments in water infrastructure (Tortajada, 2016; Agência Nacional de Águas e Saneamento Básico, 2019).
Recent federal assessments — namely the National Water Security Plan (Plano Nacional de Segurança Hídrica) and Atlas Águas: Water Security for Urban Supply (Agência Nacional de Águas e Saneamento Básico, 2019, 2021) — document persistent regional disparities in water access and emphasize the urgency of integrated water infrastructure in Brazil’s North-east. Building on the PNSH framework, Atlas Águas (2021) updates the mapping of critical supply deficits and identifies interconnection priorities across the semi-arid region, underscoring the importance of large-scale, multi-purpose systems to enhance resilience and regional equity. At the national scale, Gesualdo et al. (2021) further demonstrate that water security challenges in Brazil stem not only from hydrological scarcity but also from governance fragmentation and social inequality, which limit the effectiveness of infrastructure-based interventions.
From an economic perspective, such investments are often hindered by persistent market failures (Dosi & Easter, 2003; Zetland, 2021). Water infrastructure displays public good characteristics, natural monopoly conditions (high fixed costs and low marginal costs), and significant externalities—both positive (improved health, education, productivity) and negative (resource depletion, pollution). Markets also fail to ensure equitable access, as private provision tends to favor profitable, high-income areas, leaving poor and rural communities underserved (Nicoletti et al., 2023). Finally, the long-term horizons, high capital intensity, and risk exposure of water projects make them unattractive to purely private investors without public guarantees. These structural constraints justify the need for public provision, regulation, and rigorous socioeconomic appraisal before committing large-scale resources.
In Brazil, the Water Security Index (Índice de Segurança Hídrica – ISH), developed by the National Water and Sanitation Agency (ANA) under the National Water Security Plan (PNSH), provides a baseline assessment of water security conditions across the country. Measured across human, economic, ecological, and resilience dimensions, the ISH highlights persistent vulnerabilities in the North-east, where semi-arid conditions—marked by rainfall variability, intermittent rivers, and prolonged dry spells—drive chronic scarcity (Agência Nacional de Águas e Saneamento Básico, 2019). Pernambuco has the lowest per capita water availability in Brazil (Nunes & Ribeiro Neto, 2025), and its semi-arid Agreste region is the most densely populated among the country’s drylands, compounding development challenges.
Recent crises have highlighted this fragility. The Jucazinho Reservoir, the main source for several Agreste municipalities, collapsed in 2016 after a multi-year drought, leaving major cities such as Caruaru and Santa Cruz do Capibaribe under rotational supply schedules exceeding 15 days without service (Aleixo et al., 2019; Cirilo et al., 2021). These episodes illustrate the chronic vulnerability of the region’s supply system and justify the urgency of structural integration through interbasin transfers and redundancy mechanisms. These failures prompted renewed attention to regional integration projects such as the São Francisco River transfer.
São Francisco River Integration Project (PISF) is a federal interbasin transfer initiative designed to redistribute part of the São Francisco River’s flow to the semi-arid North-east, benefiting over 12 million people in Pernambuco, Paraíba, Ceará, and Rio Grande do Norte (Cirilo et al., 2021). It comprises two main conveyance axes—Eastern and Northern—connected to local reservoirs and adduction systems operated by state water companies. The project’s rationale combines drought mitigation, regional equity, and water security for both urban and rural populations across water-deficit basins (Machado et al., 2023).
Within this framework, the Agreste Adduction System constitutes the principal infrastructure branch that operationalizes the PISF’s objectives in Pernambuco. Drawing water from the Ipojuca Reservoir through more than 1,000 km of pipelines, the system interlinks strategic reservoirs and secures long-term supply for 64 municipalities across the drought-prone Agreste. Although the PISF has spurred political, technical, and social debate—particularly concerning river-revitalization priorities, interbasin-transfer necessity, and irrigation viability—there is broad consensus regarding the indispensability of such transfers for urban and rural water supply (Cirilo, 2008). Recent analyses emphasize that the success of large-scale water-transfer systems depends not only on hydraulic performance but also on governance integration, adaptive operation rules, and inter-basin coordination (Cirilo et al., 2021). These insights reinforce the need for comprehensive socioeconomic appraisal and adaptive management to ensure the long-term sustainability of the Agreste system.
Given the project’s scale, cost, and long-term implications, its appraisal requires robust economic evaluation. Cost–Benefit Analysis (CBA) offers a transparent framework to compare total estimated benefits and costs, incorporating both direct financial returns and broader social, environmental, and productivity gains (Stokey & Zeckhauser, 1978; Mishan, 1994). It is particularly suited to contexts with clear market failures, where public investment decisions must weigh competing alternatives and scarce fiscal resources (Arena et al., 2020; Marchioni et al., 2023). CBA not only quantifies net social returns but also tests the robustness of results through sensitivity and risk analysis, identifying critical variables that could affect project viability.
This study applies a socioeconomic CBA to the Agreste Adduction System to quantify its net contribution to regional development in Pernambuco under two distinct scenarios: (i) a baseline scenario, representing the continuation of current conditions with ongoing water risk (economic cost), no induced demand generation, and no autonomous irrigation development; and (ii) an alternative scenario involving the implementation of the adduction system (supply only), which yields cost avoidance benefits, generates benefits from induced demand in water supply, but does not include autonomous irrigation development. By incorporating both monetized and non-monetized benefits, such as health improvements and productivity gains, the analysis seeks to capture the full societal value of the investment. The remainder of this paper is structured as follows: Section 2 outlines the methodology, with emphasis on the CBA framework; Section 3 presents and discusses the results; and Section 4 offers concluding remarks, limitations, and recommendations for future research.
Materials and Methods
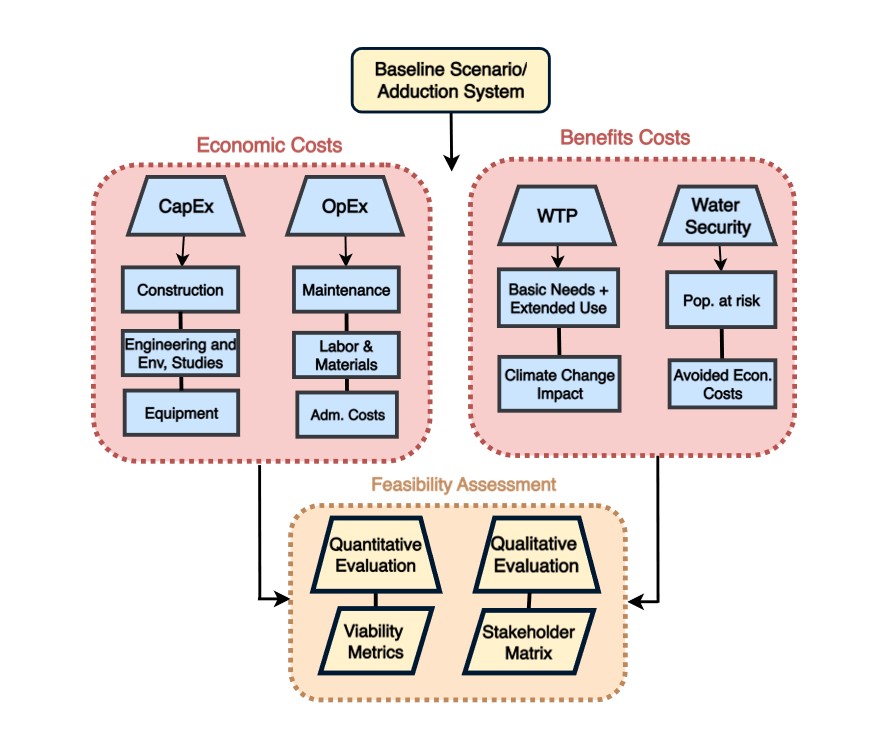
The methodological framework employed in this study is based on a structured Cost-Benefit Analysis (CBA) approach, illustrated in Figure 1. The analysis begins by estimating the economic costs of the infrastructure project, including capital expenditures (CapEx)—such as equipment, construction, and technical studies—and operational expenditures (OpEx), which encompass maintenance, administrative, and recurrent costs. These costs are then compared against a range of socioeconomic benefits, including willingness to pay, improved water security, fulfillment of basic needs, climate change adaptation, and the avoided costs associated with populations at risk in a baseline (no-project) scenario. By quantifying both tangible and intangible benefits and comparing them with project costs, the analysis derives key feasibility indicators such as Net Present Social Value (NPSV), Economic Rate of Return (ERR), benefit-cost ratio, and the overall net benefit, supporting evidence-based evaluation of the project’s social and economic viability.
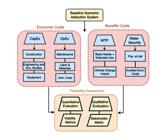
Methodology flowchart for cost-benefit assessment for the proposed water infrastructure Project.
Case study
The Agreste Adduction System is one of the flagship infrastructure initiatives under Brazil’s Water Security Program (PSH) and is strategically aligned with the priorities of the National Water Security Plan (PNSH). The rationale for intervention lies in the chronic and multidimensional water scarcity affecting the Agreste region of Pernambuco, a transitional zone within the Brazilian semi-arid area. According to Aleixo et al. (2019), rural water supply systems in the North-east remain vulnerable, reinforcing the strategic need for regionally integrated systems. This reality highlights the strategic importance of implementing a robust, regionally integrated water system to mitigate supply vulnerability and ensure long-term resilience.
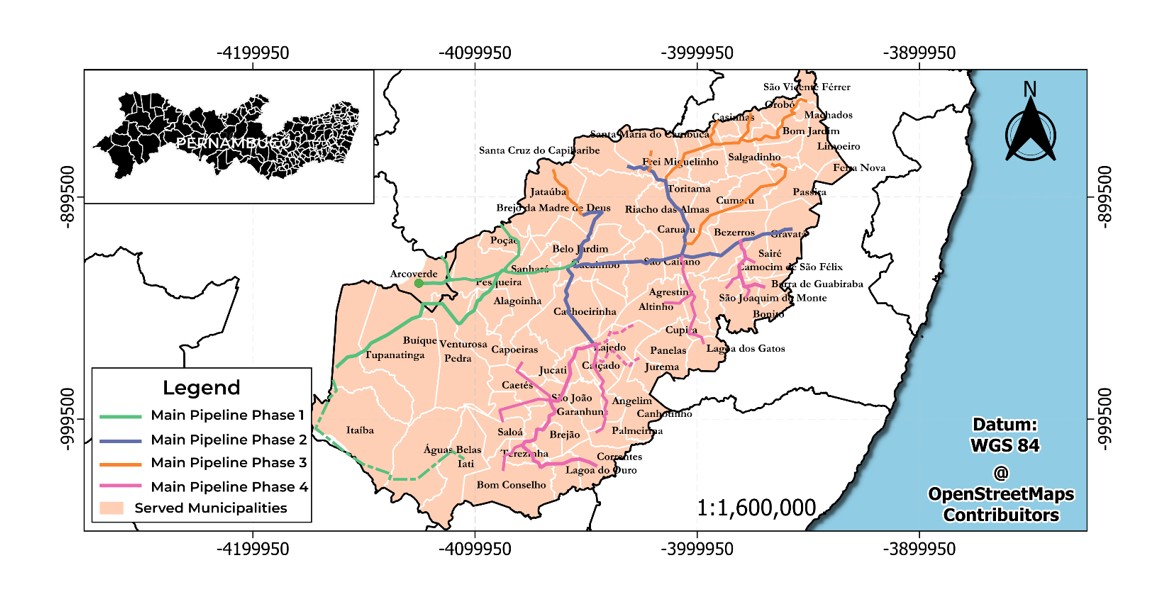
The project’s Indirect Socioeconomic Influence Area, as defined in the Environmental Impact Report (RIMA), encompasses 64 municipalities distributed across four officially recognized Development Regions of Pernambuco: Agreste Central, Agreste Meridional, Agreste Setentrional, and Moxotó. These regions represent the spatial footprint of the project’s long-term contribution to regional water security and serve as priority areas for social and economic development. Figure 2 illustrates the study area that covers the Agreste Adduction System.
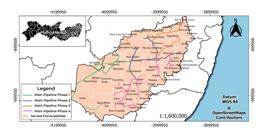
Study area of Indirect Socioeconomic Influence Area that covers the Agreste Adduction System in Pernambuco.
The Agreste Adduction System was conceived as a large-scale hydraulic solution to address structural water insecurity through the conveyance and treatment of water abstracted from the São Francisco River. The system begins at the Ipojuca Reservoir in Arcoverde, the terminal point of the Agreste Branch, and is designed to supply an estimated 2.2 million people across 64 municipalities. Its infrastructure includes a 0.3 km raw water intake pipeline linking the reservoir to a conventional water treatment plant (nominal capacity: 3.3 m3/s), a treated water pumping station with a final design flow of 4.0 m3/s, a 6.0 km treated water trunk pipeline, a 20,000 m3 balancing reservoir, and approximately 1,030 km of steel and ductile iron treated water distribution pipelines supported by five booster pumping stations.
To evaluate the system’s effectiveness and socioeconomic return, a baseline (counterfactual) scenario was constructed to simulate the probable evolution of water access in the absence of the project. In line with the PNSH methodology, this scenario reflects the persistence of existing structural constraints in water supply and the associated economic impacts of scarcity. The PNSH defines water risk as the intersection of exposure (population and economic activities dependent on water) and vulnerability (limitations in supply capacity), quantifying it through water balance calculations that compare demand to the reliable yield of the associated water source, set at a 95% reliability level.
For the baseline, urban population data and projected fractions of the population at risk up to 2035 were adopted, as in the Vaza Barris case study, without considering potential climate-induced changes in supply. This counterfactual serves as the benchmark for estimating the project’s incremental benefits. By comparing the baseline with the with-project scenario, it is possible to measure the avoided economic costs of scarcity, the benefits from induced demand in urban supply, and the extent to which the project can stabilize and expand service coverage, particularly in a context where network access in the urban areas already exceeds 99.5% (Brasil, 2020a). Table 1 summarizes the alternative scenario parameters and the service sectors considered in the Agreste Adduction System analysis.
The Agreste Branch, with a total extension of 70.8 km, functions as the physical linkage between the PISF and the Agreste Adduction System. It channels up to 3 m3/s of raw water from the São Francisco River through a system of reservoirs and conveyance works, which then supplies the treatment and distribution system beginning at Arcoverde. From this node, treated water is distributed through a dense network of pipelines adapted to the rugged topography and settlement patterns of the region.
Given this context, the Agreste Adduction System should be understood not merely as a supply infrastructure, but as a strategic resilience-building intervention. By integrating regional hydraulic systems with national policy instruments, it enhances the capacity of local and state governments to respond to climate variability, reduce structural water deficits, and enable sustainable development in one of Brazil’s most vulnerable territories. The case study thus offers a representative example for evaluating large-scale water security interventions in semi-arid contexts, combining hydraulic engineering, socioeconomic planning, and environmental policy.
Although located outside the Agreste of Pernambuco, the Vaza-Barris case (Companhia Pernambucana de Recursos Hídricos e Meio Ambiente, 2021) was adopted as a methodological proxy because it is the most recent and publicly documented cost–benefit study for a semi-arid water-supply system under comparable hydro-climatic conditions.
Estimation of economic costs
Capital expenditures (CapEx)
The estimation of economic costs includes all expenditures associated with the project, encompassing both the implementation and operational phases of the constructed infrastructure. These costs reflect the net monetary difference between investing in new infrastructure capacity and maintaining the status quo using existing service delivery mechanisms over the same analytical horizon.
For the purpose of this study, potential benefits and negative externalities were not monetized or included in the economic cost calculations. This exception was adopted to avoid double counting, as most direct externalities associated with land acquisition, temporary construction impacts, and environmental management are already embedded in the capital and operational cost estimates provided by the project proponent. Additional monetization of these effects would artificially inflate total costs without representing new external burdens. Conversely, positive externalities, such as increased climate resilience and reduced supply vulnerability, were considered separately in the benefit valuation because they extend beyond the direct operational scope of the project and are not internalized in the financial flows of CapEx or OpEx.
The capital expenditures (CapEx) represent the fixed investment required to create or expand infrastructure capacity. This includes construction costs, technical engineering services, and environmental studies. In the case of the Agreste Adduction System, the project was included in the investment portfolio of the National Water Security Plan (PNSH). Where feasible, CapEx should be disaggregated into categories such as skilled and unskilled labor, commercial and non-commercial domestic inputs, and equipment.
The analysis adopts a 30-year time horizon, with year 0 designated as the base year for valuation purposes. No investment or benefit flows are allocated to year 0—it serves solely as the reference year for discounting. From Year 1 onward, costs and benefits are distributed according to the project implementation schedule. The infrastructure construction phase is assumed to span four years. The initial capital investment was estimated at R$735.64 million (2018 values). This figure was adjusted for inflation using the National Construction Cost Index (INCC) from the Central Bank of Brazil, applying a correction factor of 1.0813, resulting in a revised CapEx of approximately R$795.45 million.
Based on guidelines from the Cost–Benefit Analysis Manual (Brasil, 2021b), the total CapEx was normalized to 100% and disaggregated into two hierarchical levels. At the first level, 10% of the total investment corresponds to off-site engineering services, including project management, field supervision, basic and executive designs, and environmental studies (excluding direct licensing and compliance costs). The remaining 90% represents the physical infrastructure, subdivided as 15% for equipment, 30% for the adduction system (pipelines and associated controls), and 55% for civil works, encompassing all construction components other than pipelines and equipment, such as earthworks, permanent drainage structures, road systems, buildings, control structures, and site preparation.
Residual costs were estimated to reflect the non-depreciated portion of each component’s capital investment at the end of the analysis period. The residual value corresponds to the share of the asset’s useful life remaining beyond the evaluation horizon, calculated proportionally to the total design life as recommended by Agência Nacional de Energia Elétrica (2001). This approach ensures that long-lived civil works and adduction infrastructure retain a positive terminal value in the project’s economic assessment.
Operating expenditures (OpEx)
Operating expenditures (OpEx) refer to the total annual costs incurred by the operator throughout the project’s life cycle. These include engineering services, environmental program implementation, management and administrative costs, as well as preventive and corrective maintenance for civil structures, electromechanical components, and pipelines. Labor, materials, and routine operational inputs are also considered.
For this analysis, OpEx follows a ramp-up profile starting at 50% of the typical operational level in the first year of operation, increasing by 10 percentage points per year until it reaches 100%, consistent with national guidance on commissioning and workforce mobilization (Brasil, 2021a). The base OpEx excluding electricity was set at 5% of CapEx for preliminary studies without detailed operator records. This base OpEx covers management, operation, and maintenance activities and is further disaggregated as 0.5% for environmental programs, 11.06% qualified labor, 15.84% non-qualified labor, 20.00% field services and corrective maintenance, and 53.11% equipment, machinery, and construction materials (no imported inputs assumed).
Consistent with the National Water Security Plan (PNSH) and the Cost–Benefit Analysis Manual (Brasil, 2021b), electricity is treated as a separate operating component due to its magnitude and variability with operating regimes (flow, head, efficiency) and tariff dynamics. To transparently reflect its potential impact, we implement a sensitivity analysis in which electricity represents 40% (Low), 60% (Medium), and 80% (High) of total O&M. Results are reported both excluding and including electricity to avoid double counting and to preserve comparability across alternatives.
All monetary values are expressed in constant BRL of 2020 (2020 reference price year). Inputs not originally reported for 2020 were converted to 2020 BRL using IPCA (IBGE); otherwise, no inflation adjustment was applied. Discounting is performed in real terms. We adopt 2020 as the reference year because the SINISA indicators are more complete for 2020—showing fewer missing values than 2021—which ensures consistent municipal coverage and alignment with the 2020 emergency operations data sets used in the analysis.
Estimation of socioeconomic benefits
The estimation of the project’s economic benefits follows the methodology outlined in the Cost-Benefit Analysis Manual for Water Infrastructure Projects (Brasil, 2021a). The benefit assessment process is based on standardized input data, which is processed according to the procedures prescribed in the manual. Final benefit values are then incorporated into the project’s social cash flow, alongside the previously calculated economic costs. A detailed breakdown of capital and operating cost components, as well as the annual cash-flow structure adopted in the analysis, is provided in Appendix A, Table A1 e A2.
Given that the principal data sources—PNSH, IBGE, SNIS (Brasil, 2019; 2020f), and ATLAS NORDESTE—provide information at the municipal level, all calculations are performed individually for each municipality served by the project. This spatial distribution ensures that the results reflect the heterogeneous conditions and service gaps across the region.
A central component of the benefit valuation is the economic cost imposed on the population due to unreliable water supply, which is reflected in the marginal value of water use. In practical terms, this value corresponds to the maximum amount a user is willing to pay for an additional unit of water, based on the assumption that the new system will significantly reduce the frequency of service disruptions, rationing events, and water insecurity.
This marginal willingness to pay (WTP) functions as a proxy for the economic value of improved water reliability. It quantifies the shift in utility for beneficiaries who transition from intermittent or unsafe supply to a regular, treated source under the project scenario. This approach allows the analysis to capture both direct user benefits and broader welfare gains resulting from improved service conditions.
Willingness to Pay (WTP)
The WTP for reliable water supply services can be estimated using the market price of the least-cost alternative available within the same hydrological region. In cost-benefit analysis, this approach serves as a proxy for the economic value of water to users, assuming that the cost of securing one additional unit of water through alternative means reflects the maximum amount the society would be willing to pay for improved service, when this water provision is considered a human right to be compulsorily assured. For this case study, WTP is estimated to cover both basic human needs and non-essential (extended) consumption.
To quantify water demand for basic needs, the analysis adopts the minimum consumption threshold of 60 L per capita per day, as recommended in the ACB Infra Hídrica Manual (Brasil, 2021a). Using data from the SNIS database (Brasil, 2021c), specifically indicators IN023, IN053, AG003, AG026, and IN005, the analysis computes both the volume of water consumed per household unit (or “economy”) and the number of people per economy in each municipality.
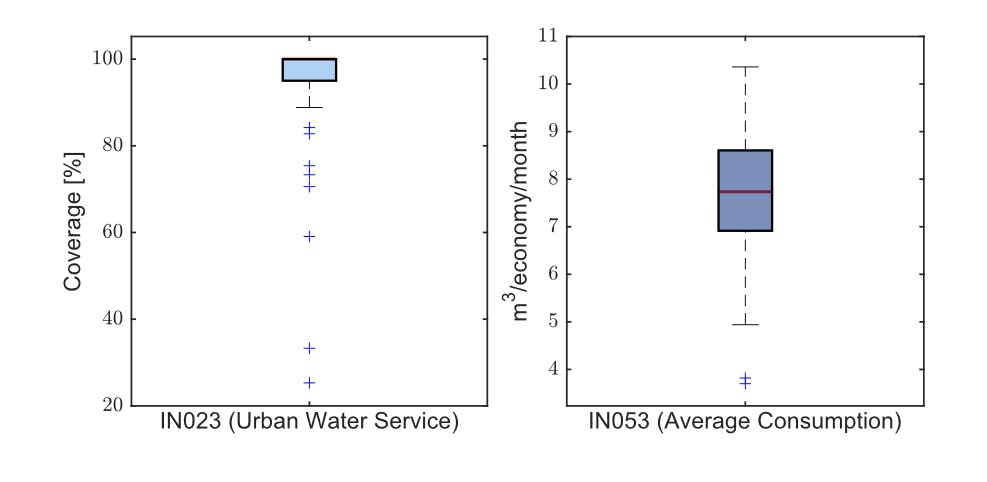
According to SNIS (Brasil, 2021c), the indicator IN023 represents the urban water supply coverage index, defined as the ratio between the urban population served with piped water and the total urban population residing in the municipality. The indicator IN053 corresponds to the average water consumption per household unit (referred to as an “economy”), expressed in cubic meters per economy per month. Both indicators are shown in Figure 3. The variable AG003 indicates the number of active household water connections that were connected to the piped network and had water effectively available from the utility during the reference year. The variable AG026 refers to the urban population served with water supply as of December 31 of the reference year. Finally, the indicator IN005 denotes the average water tariff charged per cubic meter of water consumed.
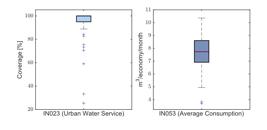
Boxplots of key indicators from the National Sanitation Information System (Brasil, 2020e) for the municipalities served by the Agreste Adduction System. IN023 represents the urban water service coverage index, defined as the percentage of the urban population with access to piped water supply. IN053 corresponds to the average monthly water consumption per household unit (“economy”), expressed in cubic meters per month for the year of 2021.
In the SNIS framework, an “economy” refers to the smallest unit of consumption, encompassing individual dwellings, apartments, businesses, government offices, and other units receiving water and/or wastewater services. Accordingly, the monthly household volume required to meet basic needs was derived by multiplying the threshold of 60 L per person per day by the average household size in each municipality.
Method for valuing emergency trucked water
To estimate the monetary value of this volume, we use the avoided cost of trucked water, the least cost alternative in the project area. According to the Evaluation Report of the Trucked Water Operation (Operação Carro-Pipa – OCP) issued by the Secretariat for Monitoring and Evaluation of Public Policies (SMA) of the Ministry of Planning (Brasil, 2024), the cost of trucked water delivery across Brazil’s semi-arid municipalities ranged between R$ 20 and R$ 115 per m3 in 2019, with most municipalities in the state of Pernambuco concentrated between R$ 33 and R$ 60 per m3.
Based on the methodology used in the Vaza Barris case study, which relied on official local data, a unit cost of R$ 61.26/m3 was adopted. This estimation was calculated using data from the water truck emergency supply operations carried out by the Civil Defense of the State of Sergipe (2020) during the 2020 drought event to derive a unit cost in BRL/m3.
In 2020, emergency water truck operations in Sergipe deployed 65 trucks to serve 40,706 people in rural and some urban areas at a total cost of R$ 8,079,590.15. Using the standard emergency ration of 20 L per person per day—adequate for drinking and meal preparation—the delivered volume was estimated (and converted to m3). Dividing total cost by this volume yields a unit cost of R$ 61.26/m3. The Sergipe Vaza-Barris data set (Brasil, 2021a) reports the same figure for 2020, so we adopt R$ 61.26/m3 as a state-level benchmark and set R$ 61.26/m3. We interpret this parameter as an avoided-cost proxy for basic-needs water under emergency conditions—i.e., the marginal willingness to pay for reliable access to the basic-needs block—and use it only for that lowest tier of consumption.
For non-basic (extended) consumption, the long-run marginal cost (LRMC) proxy derived from tariffs is maintained. This assumption must be interpreted within the context of emergency supply rather than long-term service provision. In Brazil’s semi-arid region, the water-truck system constitutes the main short-term self-supply mechanism during droughts, operated through the federal Operação Carro-Pipa program (Agência Nacional de Águas e Saneamento Básico, 2019; Brasil, 2024). As highlighted in the Cost-Benefit Analysis Manual (Brasil, 2021a), it represents the least-cost alternative for valuing basic-needs consumption under scarcity, yet it is neither economically nor environmentally sustainable for continuous provision. Similar observations appear in Cirilo et al. (2021) and Marengo et al. (2022), who describe water trucking as a temporary coping strategy that highlights structural deficiencies in regional water infrastructure.
LRMC proxy for non-basic consumption and tariff adjustment
For volumes above basic needs, the WTP is proxied by the LRMC of supply. We begin with SNIS IN005 (average tariff, BRL/m3) at the municipal level and apply a +25% adjustment to approximate LRMC in underserved systems (where observed tariffs typically underprice capacity expansion, loss control, and supply continuity). This conservative markup follows the federal ACB guidance for water infrastructure where observed tariffs do not reflect long-run costs in systems with backlog investments. The adjusted LRMC (BRL/m3) is then multiplied by the monthly non-basic volume (IN053 minus basic-needs volume) to obtain . The total municipal WTP is .
To estimate the long-run marginal cost (LRMC) for each municipality, the analysis uses SNIS data (indicator IN005) on average municipal water tariffs. The WTP for consumption beyond basic needs should be proxied by the LRMC of water supply, in line with the economic principle of public pricing. In underserved regions, observed tariffs are often underpriced because they do not account for the costs of service expansion or measures to secure long-term supply continuity. Following the methodology, this underestimation is particularly likely in areas with low service coverage, where the need for investment in source expansion or demand management (e.g., reducing network losses, which can reach 48% in some municipalities such as Itabaianinha according to Itabaianinha Municipal Basic Sanitation Plan) is not reflected in the tariff (Itabaianinha, 2020).
The tariff structure in Pernambuco involves cross-subsidies, whereby larger metropolitan systems (e.g., Recife) partially subsidize tariffs in smaller, lower-income municipalities in the Agreste. As a result, observed municipal tariffs tend to be underpriced relative to long-run marginal costs not only because expansion costs are not internalized, but also due to affordability constraints embedded in the cross-subsidy and social-tariff policies. To mitigate this bias, the municipal tariffs from SNIS were adjusted upward by 25%, an arbitrary but conservative markup consistent with the recommendation to address underpricing (Brasil, 2021a).
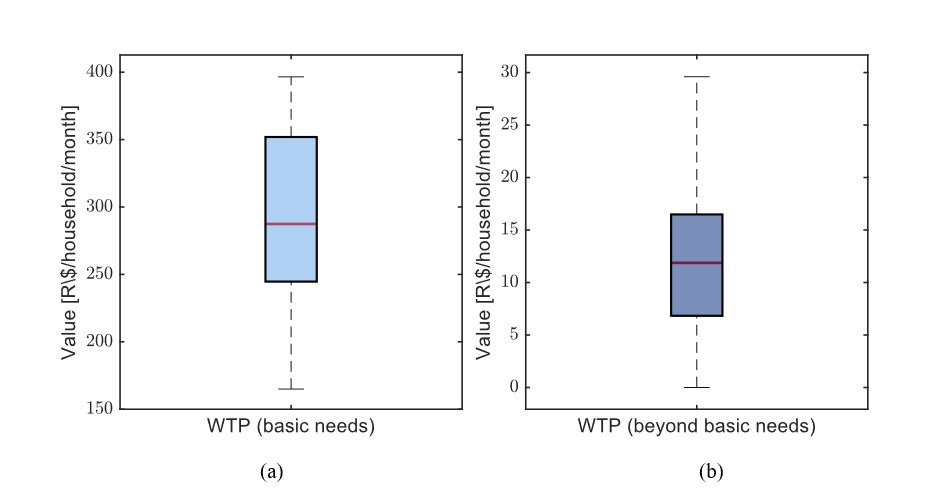
Multiplying the adjusted LRMC (in R$/m3) by the monthly volume consumed beyond basic needs yields the WTP per household for non-basic water use, expressed in R$/household/month. The total WTP per municipality is calculated by summing the values obtained for basic and non-basic water volumes. The results are summarized in Figure 4, which presents the range of total WTP values per household unit across the 64 municipalities included in the study. The monthly WTP per economy ranges from R$177.34 to R$490.96, reflecting significant variability in water demand profiles and economic conditions among the municipalities analyzed.
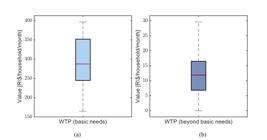
(a) Boxplot of monthly Willingness to Pay (WTP) per household for basic water needs; (b) Boxplot of monthly Willingness to Pay (WTP) per household for water beyond basic needs for the year of 2021.
Impacts of climate change on water supply services
Water insecurity in municipalities facing irregular water supply can manifest in two distinct ways (Companhia Pernambucana de Recursos Hídricos e Meio Ambiente, 2021). The first is existing water insecurity, in which a portion of the population is already living under insecure water access conditions. The second is projected water insecurity, referring to the expected future emergence of such conditions for part of the population in the absence of actions to expand supply and/or reduce demand.
The National Water Security Plan (PNSH) estimated the urban population at risk of water shortage for the years 2017 and 2035, using demand variation driven by population growth. In this context, hydrological risk is defined as post-deficit risk (i.e., when water demand surpasses available supply), which is based on the flow. This indicator corresponds to the low-flow condition used for public supply design and is defined as the discharge that exceeds 95% of the time in a given year, according to historical streamflow records. It is recognized that in semi-arid regions the discharge is often close to zero, which limits its operational meaning. In this study, therefore it is used only as a reference indicator of hydrological scarcity, following the methodological convention adopted in the PNSH.
The PNSH revealed that a significant share of municipal populations faces post-deficit water risk. To account for this, a default persistence of 0.9 months per year was assumed for these events, which represents the average persistence typically observed in short-term hydrological deficit events, corresponding to the temporal memory of monthly streamflow and precipitation series in semi-arid regions. In probabilistic terms, it indicates that approximately 90% of a monthly deficit condition tends to persist into the following month, which is consistent with the lag-1 autocorrelation observed in historical hydro-climatic indicators (e.g., SPI, SRI) across North-eastern Brazil. This assumption follows the reference adopted by the PNSH is subject to uncertainty, therefore sensitivity analysis needs to be conducted.
In this case study, climate change impacts were not directly incorporated into the hydrological balance calculations. The analysis was instead based on the historical seasonality of streamflow records in the basin. However, it is acknowledged that future climate variations may alter water availability and amplify insecurity in supply systems.
To approximate the potential effects of climate change, a conservative 8% reduction was applied to the projected supply performance over the analysis period, reflecting expected hydrological impacts in the region. This was implemented through a linear interpolation from 0% in year 1 to 8% in year 30, resulting in progressively lower supply reliability in the final year (T-30) of the analysis.
According to recent national hydrological simulations based on CMIP6 climate scenarios (Agência Nacional de Águas e Saneamento Básico, 2024), there is a widespread reduction in mean annual runoff across North-eastern and semi-arid basins, with the most pronounced decreases observed in the São Francisco and North-eastern River regions. The 8% reduction assumed in this study is a conservative approximation consistent with the downward trends illustrated in the Agência Nacional de Águas e Saneamento Básico (2024) projections.
Estimation of economies at risk (with and without the project)
To determine the population at risk under the baseline scenario, the same population growth rate was applied to the data on post-deficit water insecurity provided by the PNSH for each municipality in 2017, along with projections for 2035. To estimate the population at risk after implementation of the project, it was necessary to evaluate whether the project would fully meet the existing and growing unmet demand over time, including that associated with population increases.
Water supply demand was calculated using the 2017 and 2035 municipal demand data from the PNSH and extrapolated to 2050 using a linear relationship with population projections derived from the Brazilian Institute of Geography and Statistics (IBGE). This approach was adopted because the PNSH provides demand estimates only for 2017 and 2035, requiring intermediate and longer-term values to be estimated. The assumption of a linear relationship ensures that demand growth remains proportional to the projected population growth, maintaining consistency with the IBGE methodology and preserving comparability across the entire analysis period. With these data and the figures on populations at risk, it was possible to quantify the insecure demand—i.e., the portion of water demand that the project has the potential to meet.
Based on the list of municipalities, the maximum flow rate to be demanded by the system was estimated. The analytical framework assumes that demand will not exceed the system’s capacity before 2025, meaning the project is expected to fully meet demand throughout the analysis period. As a result, the population at risk would be reduced to zero.
Finally, using annual data on the population equivalent at risk of water shortage for both the baseline and project scenarios, combined with data on the number of inhabitants per economy provided by SNIS, the number of annual household economies that no longer experience water deficits was calculated.
Avoided economic costs due to reliable water supply
To quantify the benefits, defined here as the avoided economic costs to the population under the scenario without the project, the willingness to pay (WTP) values were multiplied by the volume of water that is now guaranteed to beneficiary households through the provision of regular water supply during the analysis period. Using the number of beneficiary economies, the monthly WTP per economy, the costs related to the acquisition, installation, and replacement of individual water storage systems, and the annual permanence curve, it was possible to compute the total economic benefit for each municipality.
Feasibility assessment
The socioeconomic evaluation can be compared to the financial analysis in the sense that both approaches rely on similar indicators and logic. However, their objectives differ: while the financial analysis focuses on the return on investment from the perspective of the investor and the operator — including financial sustainability — the socioeconomic evaluation (also known as Cost-Benefit Analysis or CBA) emphasizes the broader impacts of the project on society as a whole. Despite the difference in perspective, both analyses employ comparable performance metrics to assess the viability of the proposed investment.
Viability indicators
Net Present Social Value (NPSV) and Economic Rate of Return (ERR)
The Net Present Social Value (NPSV) is defined as the sum of net benefits (or net costs) accrued over a specific period throughout the entire analysis horizon, brought to present value using the social discount rate (SDR). In other words, the NPSV represents the total discounted value of the project's net cash flows from a societal perspective. It reflects the overall economic efficiency of the intervention. Its calculation follows the expression (Brasil, 2020e):
where t is the year index within the analysis period (dimensionless); T is the final year of the analysis period (ranging from 0 to T, units), BLt is the net economic benefit flow of the project in year 𝑡 (R$ million/year), VR is the residual value of the investment (R$ million/year) and SDR is social discount rate (percentage, expressed as a decimal).
A project is considered socioeconomically viable if its Net Present Social Value (NPSV), discounted at the established rate, is greater than zero. In this case, the benefits generated outweigh the resources invested, reflecting a positive outcome from society's perspective. When multiple mutually exclusive projects are available to achieve the same objective, the preferred option is the one with the highest NPSV.
The Economic Rate of Return (ERR) is defined as the discount rate that results in a NPSV equal to zero—i.e., the point at which the economic benefits of a project precisely offset its costs. This rate represents the project’s internal socioeconomic return. Therefore, if the ERR is greater than the social discount rate adopted for the analysis, the NPSV is positive, indicating that the project should be accepted. Conversely, if the ERR is lower than the discount rate, the project should be rejected. The ERR is a dimensionless figure, independent of scale, and is typically expressed as a percentage. Analysts often use it to evaluate the expected performance of an investment relative to other project alternatives or to a minimum acceptable return threshold, such as the Social Discount Rate.
Equivalent Annual Value (EAV)
The Equivalent Annual Value (EAV) represents the uniform annualized value of a project’s total discounted costs or benefits over its lifespan. In other words, it converts the Net Present Value (NPV) (or Net Present Social Value – NPSV) into an equivalent annual flow, facilitating the comparison between projects with different time horizons or investment magnitudes. The EAV expresses the constant yearly benefit (or cost) that would be economically equivalent to the project’s total present value, given a specified social discount rate (SDR).
where t is the year index within the analysis period (dimensionless); T is the final year of the analysis period (ranging from 0 to T, units), NPSV is the Net Present Social Value (R$ million), and SDR is social discount rate (percentage, expressed as a decimal).
Benefit-Cost Ratio (B/C)
The Benefit-Cost Ratio (B/C) represents the quotient between the present value of total benefits and the present value of total economic costs. If the ratio is greater than 1 (i.e., B/C > 1), the project is considered viable, meaning that the benefits outweigh the costs when both are discounted to present value. This indicator is particularly sensitive to how specific cash flows are categorized—either as direct benefits or as cost reductions. Moreover, it can be unreliable when comparing projects with similar costs, as it does not account for the scale or size of the investment (Cohen & Franco, 1993).
where Bt is the net benefits (R$ million/year) in the considered scenario at time ; and 𝐶𝑡 is the net costs (R$ million/year) in the considered scenario at time .
Social Discount Rate (SDR)
To develop the cash flow and evaluate the viability indicators previously discussed—namely Net Present Social Value (NPSV), Economic Rate of Return (ERR), and the Benefit-Cost (B/C) Index—it is essential to define a discount rate. The Social Discount Rate serves as the investment criterion, since a project should only be undertaken if its socioeconomic return exceeds the opportunity cost of the resources consumed, that is if ERR ≥ SDR.
Additionally, due to the long-term nature of infrastructure investments, the NPSV is highly sensitive to the discount rate. In this context, using different SDR values can result in a reversal of the ranking among alternative solutions with distinct benefit profiles, even for the same intervention. It may also lead to a reordering of priorities among projects within a single investment portfolio. Therefore, while the ∆NPSV (change in net value across scenarios) is indeed sensitive to the choice of SDR, sensitivity analysis should not be performed on ∆NPSV with respect to SDR. For infrastructure investments, the recommended SDR is 8.5% real per year, as advised by SDI (Brasil, 2020b).
Distributive analysis
Cost-benefit analysis is a methodology based on the aggregation of monetized costs and benefits. However, the distribution of these values among beneficiaries is not explicitly reflected in the viability indicators and must be complemented by a distributive analysis. The allocation of project costs and benefits among users and other stakeholders is not adequately captured through the use of shadow pricing in socioeconomic evaluations. To incorporate equity considerations and enhance the social impact of public investments, distributive analysis is employed to assess the welfare implications for different affected groups.
This type of analysis involves identifying the full range of project effects and the key stakeholders who will be impacted by its implementation. These effects may include user charges, changes in access to basic services, improvements in service reliability and safety, and environmental or territorial impacts. In the matrix developed for this study, identified effects included benefits related to water security, and costs associated with the Adductor’s capital expenditures (CapEx), operational expenditures (OpEx), as well as taxes and regulatory obligations.
Methods for distributive analysis may range from the simple identification of stakeholders positively or negatively affected, to more complex projections of macroeconomic indicators (e.g., unemployment, consumption) disaggregated by region and sector (Mackie et al., 2005). In this case, the identified stakeholders include residential users, the contractor, the project developer, the operator, and government entities.
RESULTS AND DISCUSSIONS
Project viability indicators
Once all the cost-benefit analysis indicators have been calculated using the project's social cash flow, they can be interpreted in light of the goals the project seeks to achieve. Table 2 summarizes the results for the proposed alternative, including the baseline case and three sensitivity scenarios that incorporate electricity expenditures as different proportions of total operating costs.
Summary of Cost–Benefit Analysis (CBA) results for the Agreste Adduction System under different sensitivity scenarios.
The proposed alternative presents a negative Net Present Value (NPV) of -R$ 694.74 million from a purely financial standpoint. However, it yields a positive NPSV of R$ 838.28 million, with an ERR of 22.62%, which significantly exceeds the Social Discount Rate (SDR) of 8.5% per year recommended for infrastructure investments (Technical Note No. 19.911; Brasil, 2020d). According to the ACB Infra Hídrica Manual, when the ERR surpasses 11.4%, the project is considered economically viable, contingent upon the completion of a sensitivity and risk analysis. Moreover, since the result exceeds the 8.5–11.4% threshold, probabilistic risk analysis would not initially be required.
Based on the indicators obtained, the project is deemed socially viable, as the economic benefits outweigh the costs by a considerable margin. However, it is important to note that this conclusion should not rely solely on these figures, given that the calculation of both benefits and costs depends on input data that may have inherent inaccuracies, despite being sourced from reliable databases.
One potential source of uncertainty lies in the data from the 2021 SNIS (National Sanitation Information System) Water and Sewerage Services Diagnosis, which provided much of the input for this analysis. Additionally, for the Agreste Adduction System case study, many municipalities lacked complete information, requiring the use of projections based on the available data.
Another element that could enhance the robustness of the viability indicators is the extension to a full sensitivity and risk analysis. This type of analysis is essential to identify critical variables that significantly influence the project's outcome. Such an assessment would involve varying each input by ±1% while holding other variables constant. If a variable causes the NPSV to change by more than 1% in absolute value, it is considered critical. Moreover, the sensitivity analysis should be accompanied by breakpoint (inflexion point) analysis and scenario analysis, in which feasible value combinations are tested to better understand how variations affect the project’s overall viability. This approach enables a more comprehensive and reliable assessment.
The inclusion of electricity expenditures in the operating costs significantly affects the project’s financial indicators but does not compromise its socioeconomic viability. As shown in Table 2, accounting for energy costs equivalent to 40%, 60%, and 80% of total O&M progressively increases the Net Present Value of Costs (from –R$ 694.74 million to –R$ 869.11 million) and reduces the Net Present Social Value (from R$ 838.28 million to R$ 663.91 million). Consequently, the Economic Rate of Return (ERR) declines from 22.6% to 20.5%, while the Benefit–Cost Ratio (B/C) decreases from 2.21 to 1.76.
Despite these reductions, all scenarios maintain positive socioeconomic performance indicators well above the 8.5% Social Discount Rate recommended for public infrastructure investments. This confirms the robustness of the project’s social desirability, even under conservative assumptions regarding energy costs, which represent one of the most uncertain and impactful components of long-term O&M expenditures.
The project’s EAV is approximately R$ 90.41 million, further reinforcing the case for investment from a social viability perspective. The Benefit-Cost Ratio of 2.21 is particularly relevant for public policy, as it reflects the relative size of benefits compared to costs, while the ∆NPSV is concerned with their absolute difference. Unlike the NPSV, the B/C ratio is scale-invariant and thus useful in assessing project efficiency across alternatives. Table 3 presents a comparative summary of the key indicators from this analysis alongside other case studies that employed the same ACB methodology, such as the Vaza-Barris system, the Rio Grande Basin Planning Project, and the Muriaé Dam Complex (Brasil, 2020b, 2020c).
The Cost-Benefit Analysis (CBA) applied to the Agreste Adduction System clearly demonstrates that the project exhibits superior cost-effectiveness compared to other benchmark case studies, such as the Vaza-Barris System, the Rio Grande Basin Planning, and the Muriaé Dam Complex. Alternative 1, in particular, achieves a significantly higher NPSV, as well as stronger performance in terms of EAV, ERR, and B/C Ratio.
Fontenele (2007) evaluated the economic viability of the Ibiapaba Basin Interconnection Program in Ceará State, Brazil. The initiative is part of the state's broader strategy to achieve integrated water resource management and to address the mismatch between water supply and demand. Among the proposed alternatives, Alternative 3, designed with the most extensive infrastructure, stood out as the only economically viable option. It was projected to benefit a population of 244,597 residents, with a B/C ratio of 1.02, an Internal Rate of Return (IRR) of 12.2%, and an NPV of R$ 5.9 million, demonstrating a modest yet positive return on investment.
Brambilla et al. (2017) conducted a cost–benefit analysis of different reservoir operation scenarios for the lower stretch of the São Francisco River, Brazil, focusing on the inclusion of environmental flow requirements. The study evaluated the economic implications of maintaining minimum ecological discharges while sustaining hydropower generation. Results showed that, under normal hydrological conditions, the enforcement of environmental flow rules led to financial losses ranging from US$ 130 million to 340 million. However, during dry periods, these same flow constraints produced net economic gains between US$ 650 million and 1,050 million, as they improved system reliability and reduced energy deficits.
Together, these case studies reinforce the conclusion that the Agreste Adduction System not only meets but exceeds typical thresholds for social and economic viability when compared to other major infrastructure projects assessed using the same CBA framework.
Qualitative evaluation
The stakeholder matrix is organized according to the actors most significantly affected by the project. It serves as a visual tool to illustrate how net present values of costs and benefits are distributed among the key beneficiaries and contributors, thereby allowing for a qualitative assessment of benefit allocation across groups. Based on this matrix, one can evaluate the equity dimension of the project outcomes. Positive values indicate stakeholders who receive net benefits, while negative values represent those potentially disadvantaged or bearing project-related costs, as summarized in Table 4.
As of the time of this analysis, the Agreste Adduction System does not impose direct user tariffs for the provision of water conveyance services. The pricing structure for water supplied via the São Francisco River Integration Project (PISF) is still under discussion between the state government and stakeholders. This cost is expected to vary based on the volume of water consumed and the electricity required for pumping operations.
The distribution of benefits associated with the Agreste Adduction System varies across stakeholder groups and can also be visualized in Table 5. The implementing and funding agency bears the burden of project implementation and maintenance, reflecting a neutral or negative impact (–––) in terms of direct benefit. For dispossessed individuals, impacts may range from negative to slightly positive (––/++), depending on the adequacy of compensation or indemnification measures received. In contrast, citizens of the municipalities experience significant positive impacts (+++), primarily through improved water security and the uninterrupted delivery of essential public services. The municipal services sector also benefits (++), particularly by avoiding disruptions in operations and service provision. Lastly, municipal governments are among the primary beneficiaries (++++), as the project contributes to reducing economic losses and fosters conditions conducive to local development.
Social returns and universal access
It is evident that society stands to benefit significantly from the implementation of the project, even though, under its current configuration, it remains financially supported by the government. The core issue—ensuring water security—would be addressed, and the population would be served equitably through the public water distribution network. Water supply would no longer be limited to more privileged neighborhoods but extended to all residents connected to the system.
As a result, access to safe and regular water can be considered effectively universalized across the 64 municipalities identified as beneficiaries. These municipalities currently include an at-risk urban population of approximately 95,000 people (Agência Nacional de Águas e Saneamento Básico, 2019), within a broader urban population of 7 million in the state of Pernambuco—equivalent to roughly 1% of the state’s total urban residents. By year 30 of the project horizon, the system is expected to serve approximately 135,000 individuals.
Conclusions
Although the literature on cost-benefit analysis for water infrastructure projects in Brazil remains relatively limited, it is essential that such evaluations be conducted with rigor and methodological consistency, given the far-reaching societal implications of these investments. The CBA carried out in this study demonstrated the viability of the proposed investment in addressing the diagnosed water supply deficits across the Agreste region of Pernambuco.
The analysis revealed a substantial net present social value of R$ 838.28 million, confirming that the social benefits substantially outweigh the associated implementation and operation costs. The project also showed an internal economic rate of return that far exceeds the recommended social discount rate, alongside a strong benefit-cost ratio, highlighting its relevance and potential for socioeconomic impact.
Nevertheless, it is important to emphasize that the indicators presented are not, in themselves, sufficient to assert the absolute viability of the Agreste Adduction System. While the economic return rate exceeded the 11.4% threshold, suggesting robustness, the absence of a structured risk analysis leaves uncertainties unaddressed. Future work should therefore include sensitivity analysis and qualitative risk assessments to identify and account for the influence of critical variables. Although a probabilistic approach is not strictly required due to the high ERR, incorporating scenario-based stress testing could strengthen confidence in the project’s resilience under adverse conditions.
The sensitivity analysis performed in this study demonstrated that the project’s economic viability remains robust even when accounting for substantial increases in electricity costs—the largest and most uncertain component of long-term O&M. Including energy as 40%, 60%, and 80% of total operating expenditures reduced the NPSV from R$ 838.28 million to R$ 748.21 million, R$ 706.06 million, and R$ 663.91 million, respectively, and slightly lowered the ERR from 22.62% to 20.49%, while maintaining B/C ratios above 1.7 and all ERR values well above the 8.5% social discount rate. These results confirm the project’s resilience to cost escalation in key operational components and support its prioritization within regional water security policies.
In addition, while the socioeconomic benefits quantified in this study are compelling, there remain several limitations. First, the analysis was constrained by the availability and completeness of municipal-level data, particularly for projections to 2035 and 2050. Some assumptions had to be made using linear interpolation or simplification of SNIS data sets, which may not fully capture local dynamics or infrastructural constraints. Second, the study did not internalize environmental externalities or account for the impact of climate variability on supply reliability—elements that could further influence cost and risk estimates.
Finally, distributive effects, although partially captured via stakeholder matrices, could be enriched by spatially disaggregated welfare analyses to ensure equity among vulnerable groups. While electricity costs were addressed through sensitivity analysis, the project remains exposed to multiple sources of uncertainty—such as capital cost overruns, implementation delays, fluctuations in water demand, tariff and exchange-rate variation, O&M escalation, pumping efficiency, and hydrological variability—that warrant explicit risk treatment.
Future studies should build on this framework by integrating multi-criteria decision-making tools, climate resilience models, and long-term environmental impact assessments. To strengthen robustness and policy confidence, complementary risk analyses should be incorporated, including scenario stress tests, tornado diagrams to rank key drivers, and Monte Carlo simulations to quantify the probability distribution of NPSV, B/C, and ERR under adverse conditions. Moreover, exploring hybrid financing mechanisms and public–private partnership structures could provide additional insight into the financial sustainability and replicability of such infrastructure projects. Given the potential scale and replicability of the Agreste Adduction System, it offers a valuable reference for designing integrated water supply strategies in other semi-arid regions of Brazil and beyond.
-
DATA AVA ILABILITY STATEMENT
Research data is only available upon request.
Appendix A Detailed breakdown of capital (CapEx) and operating (OpEx) expenditures by cost category, and summary of annual costs, benefits, and cash-flow balances used in the socioeconomic cost–benefit analysis of the Agreste Adduction System.
Breakdown of investment (CapEx) and operation (OpEx) components by expenditure category: skilled and unskilled labor, non-tradable and tradable goods, and imported inputs.
References
- Agência Nacional de Águas e Saneamento Básico – ANA. (2019). Plano Nacional de Segurança Hídrica (1. ed.). Brasília.
- Agência Nacional de Águas e Saneamento Básico – ANA. (2021). Atlas Águas: segurança hídrica do abastecimento urbano. Brasília.
-
Agência Nacional de Águas e Saneamento Básico – ANA. (2024). Mudanças climáticas e recursos hídricos: subsídios técnicos para o planejamento e gestão (156 p.). Brasília. Retrieved in 2025, September 17, from https://metadados.snirh.gov.br/.../Mudancas_Climaticas_25012024.pdf
» https://metadados.snirh.gov.br/.../Mudancas_Climaticas_25012024.pdf - Agência Nacional de Energia Elétrica – ANEEL. (2001). Estudo de vida útil econômica e taxa de depreciação. Brasília.
-
Aleixo, B., Pena, J. L., Heller, L., Rezende, S. (2019). Infrastructure is a necessary but insufficient condition to eliminate inequalities in access to water: research of a rural community intervention in Northeast Brazil. The Science of the Total Environment, 652, 1445-1455. https://doi.org/10.1016/j.scitotenv.2018.10.202
» https://doi.org/10.1016/j.scitotenv.2018.10.202 -
Arena, C., Genco, M., Mazzola, M. R. (2020). Environmental benefits and economical sustainability of urban wastewater reuse for irrigation: a cost-benefit analysis of an existing reuse project in Puglia, Italy. Water, 12(10), 2926. https://doi.org/10.3390/w12102926
» https://doi.org/10.3390/w12102926 -
Brambilla, M., Fontes, A. S., Medeiros, Y. D. P. (2017). Cost-benefit analysis of reservoir operation scenarios considering environmental flows for the lower stretch of the São Francisco River (Brazil). Revista Brasileira de Recursos Hídricos, 22(0), e34. https://doi.org/10.1590/2318-0331.0117160014
» https://doi.org/10.1590/2318-0331.0117160014 -
Brasil. Ministério do Desenvolvimento Regional. Secretaria Nacional de Saneamento. (2019). Diagnóstico dos Serviços de Água e Esgotos – 2018 (SNIS-AE 2018) (180 p.). Brasília. Retrieved in 2025, August 11, from https://www.gov.br/mdr/pt-br/assuntos/saneamento/snis/diagnosticos-anteriores-do-snis/agua-e-esgotos-1/2018/Diagnostico_AE2018.pdf
» https://www.gov.br/mdr/pt-br/assuntos/saneamento/snis/diagnosticos-anteriores-do-snis/agua-e-esgotos-1/2018/Diagnostico_AE2018.pdf -
Brasil. Ministério da Economia. Secretaria Especial de Produtividade e Competitividade. (2020a, 24 de dezembro). Estudo de caso ACB infraestrutura hídrica: tipologia oferta de água: Projeto Vaza-Barris. Brasília: Consórcio Engecorps-Ceres. Retrieved in 2025, August 11, from https://www.gov.br/mdic/pt-br/assuntos/choque-de-investimento-privado/avaliacao-socioeconomica-de-custo-beneficio-1/acb-infra-hidrica-estudo-de-caso-vaza-barris.pdf
» https://www.gov.br/mdic/pt-br/assuntos/choque-de-investimento-privado/avaliacao-socioeconomica-de-custo-beneficio-1/acb-infra-hidrica-estudo-de-caso-vaza-barris.pdf -
Brasil. Ministério da Economia. Secretaria Especial de Produtividade e Competitividade. (2020b). Estudo de caso ACB infraestrutura hídrica: tipologia esgotamento sanitário: planejamento na bacia do rio Grande. Brasília: Consórcio Engecorps-Ceres. Retrieved in 2025, August 11, from https://www.gov.br/mdic/pt-br/assuntos/choque-de-investimento-privado/avaliacao-socioeconomica-de-custo-beneficio-1/acb-infra-hidrica-estudo-de-caso-riogrande.pdf
» https://www.gov.br/mdic/pt-br/assuntos/choque-de-investimento-privado/avaliacao-socioeconomica-de-custo-beneficio-1/acb-infra-hidrica-estudo-de-caso-riogrande.pdf -
Brasil. Ministério da Economia. Secretaria Especial de Produtividade e Competitividade. (2020c). Estudo de caso ACB infraestrutura hídrica: tipologia controle de cheias: Complexo de Barragens Muriaé (87 p.). Brasília: Consórcio Engecorps-Ceres. Retrieved in 2025, August 11, from https://www.gov.br/mdic/pt-br/assuntos/choque-de-investimento-privado/avaliacao-socioeconomica-de-custo-beneficio-1/acb-infra-hidrica-estudo-de-caso-muriae.pdf
» https://www.gov.br/mdic/pt-br/assuntos/choque-de-investimento-privado/avaliacao-socioeconomica-de-custo-beneficio-1/acb-infra-hidrica-estudo-de-caso-muriae.pdf -
Brasil. Ministério da Economia. Secretaria de Desenvolvimento da Infraestrutura. (2020d). Nota técnica SEI nº 19911/2020/ME: taxa social de desconto para avaliação de investimentos em infraestrutura: atualização pós consulta pública. Brasília. Retrieved in 2025, August 11, from https://www.gov.br/gestao/pt-br/central-de-conteudo/publicacoes/notas-tecnicas/2020/nt_taxa-social_vf.pdf
» https://www.gov.br/gestao/pt-br/central-de-conteudo/publicacoes/notas-tecnicas/2020/nt_taxa-social_vf.pdf -
Brasil. Ministério das Cidades. Sistema Nacional de Informações sobre Saneamento – SNIS. (2020e). Diagnóstico dos Serviços de Água e Esgotos 2020. Brasília. Retrieved in 2025, October 25, from https://www.gov.br/cidades/pt-br/acesso-a-informacao/acoes-e-programas/saneamento/snis/diagnosticos-anteriores-do-snis/agua-e-esgotos-1/2020
» https://www.gov.br/cidades/pt-br/acesso-a-informacao/acoes-e-programas/saneamento/snis/diagnosticos-anteriores-do-snis/agua-e-esgotos-1/2020 -
Brasil. Ministério do Desenvolvimento Regional. Secretaria Nacional de Saneamento. (2020f). Diagnóstico dos Serviços de Água e Esgotos – 2019 (SNIS-AE 2019) (163 p.). Brasília. Retrieved in 2025, October 25, from https://www.gov.br/mdr/pt-br/assuntos/saneamento/snis/diagnosticos-anteriores-do-snis/agua-e-esgotos-1/2019/diagnostico_ae2019.pdf
» https://www.gov.br/mdr/pt-br/assuntos/saneamento/snis/diagnosticos-anteriores-do-snis/agua-e-esgotos-1/2019/diagnostico_ae2019.pdf -
Brasil. Ministério da Economia. Secretaria Especial de Produtividade e Competitividade. (2021a). Manual de análise socioeconômica de custo-benefício de projetos de infraestrutura hídrica: manual setorial de análise de custo-benefício para investimentos em infraestrutura hídrica de interesse estratégico e relevância regional (165 p.). Brasília: SEPEC/SDI. Retrieved in 2025, August 11, from https://www.gov.br/mdic/pt-br/assuntos/choque-de-investimento-privado/avaliacao-socioeconomica-de-custo-beneficio-1/manual-de-analise-socioeconomica-de-custo-beneficio-infra-hidrica.pdf
» https://www.gov.br/mdic/pt-br/assuntos/choque-de-investimento-privado/avaliacao-socioeconomica-de-custo-beneficio-1/manual-de-analise-socioeconomica-de-custo-beneficio-infra-hidrica.pdf -
Brasil. Ministério da Economia. Secretaria Especial de Produtividade e Competitividade. (2021b). Guia geral de análise socioeconômica de custo-benefício de projetos de investimento em infraestrutura (103 p.). Brasília: SEPEC/SDI. Retrieved in 2025, August 11, from https://asmetro.org.br/portalsn/wp-content/uploads/2021/03/Guia-Geral-ACB.pdf
» https://asmetro.org.br/portalsn/wp-content/uploads/2021/03/Guia-Geral-ACB.pdf -
Brasil. Ministério das Cidades. Sistema Nacional de Informações sobre Saneamento – SNIS. (2021c). Diagnósticos 2021 água e esgoto: tabelas – informações e indicadores. Brasília. Retrieved in 2025, August 11, from https://www.gov.br/cidades/pt-br/acesso-a-informacao/acoes-e-programas/saneamento/snis/diagnosticos-anteriores-do-snis/agua-e-esgotos-1/2021
» https://www.gov.br/cidades/pt-br/acesso-a-informacao/acoes-e-programas/saneamento/snis/diagnosticos-anteriores-do-snis/agua-e-esgotos-1/2021 - Brasil. Ministério do Planejamento e Orçamento – Secretaria de Monitoramento e Avaliação de Políticas Públicas e Assuntos Econômicos – SMA. (2024). Relatório de avaliação da Operação Carro-Pipa (OCP). Brasília.
- Cirilo, J. A. (2008). Políticas públicas de recursos hídricos para o semi-árido. Estudos Avançados, 22(63), 61-82. https://doi.org/10.1590/S0103-40142008000200005
-
Cirilo, J. A., Ribeiro Neto, A., Ramos, N. M. R., Fortunato, C. F., Souza, J. D. S., Bezerra, S. D. T. M. (2021). Management of water supply systems from interbasin transfers: case study in the Brazilian semiarid region. Urban Water Journal, 18(8), 660-671. https://doi.org/10.1080/1573062X.2021.1925703
» https://doi.org/10.1080/1573062X.2021.1925703 - Cohen, E., Franco, R. (1993). Avaliação de projetos sociais Petrópolis: Vozes.
-
Companhia Pernambucana de Recursos Hídricos e Meio Ambiente – CPRH. (2021). Relatório de Impacto Ambiental (RIMA): Sistema Adutor do Agreste Pernambucano (77 p.). Recife. Retrieved in 2025, August 11, from https://www2.cprh.pe.gov.br/wp-content/uploads/2021/02/rima_sistema_adutor_do_agreste_pe.pdf
» https://www2.cprh.pe.gov.br/wp-content/uploads/2021/02/rima_sistema_adutor_do_agreste_pe.pdf -
Dosi, C., Easter, K. W. (2003). Market failure and role of markets and privatization in alleviating water scarcity. International Journal of Public Administration, 26(3), 265-290. https://doi.org/10.1081/PAD-120018875
» https://doi.org/10.1081/PAD-120018875 -
Duchenne-Moutien, R. A., Neetoo, H. (2021). Climate change and emerging food safety issues: a review. Journal of Food Protection, 84(11), 1884-1897. https://doi.org/10.4315/JFP-21-141
» https://doi.org/10.4315/JFP-21-141 - Fontenele, R. E. S. (2007). Análise custo-benefício do programa de interligação de Bacias Hidrográficas: um estudo comparativo das alternativas na região da Ibiapaba, no Estado do Ceará. Revista Ciências Administrativas, 13(3), 91-102.
- Gesualdo, G. C., Sone, J. S., Galvão, C. D. O., Martin, E. S., Montenegro, S. M. G. L., Tomasella, J., Mendiondo, E. M. (2021). A summary of: Unveiling water security in Brazil-current challenges and future perspectives. In Anais do XXIV Simpósio Brasileiro de Recursos Hidrícos, Belo Horizonte, MG. Porto Alegre: ABRH.
- Itabaianinha. Prefeitura Municipal. (2020). Plano Municipal de Saneamento Básico: relatório final. Itabaianinha.
-
Kolahi, M., Davary, K., Omranian Khorasani, H. (2024). Integrated approach to water resource management in Mashhad Plain, Iran: actor analysis, cognitive mapping, and roadmap development. Scientific Reports, 14(1), 162. https://doi.org/10.1038/s41598-023-50697-x
» https://doi.org/10.1038/s41598-023-50697-x - Lima, M. I. L. S., Granziera, M. L. M. (2018). Pagamentos por serviços ambientais: uma perspectiva econômica para a conservação das águas. In A. González-Varas Ibáñez, J. C. M. Brito Filho, L. A. M. G. Silva, M. A. B. Cecato, R. J. Feitosa (Eds.), Direitos sociais, políticas públicas e seguridade e direito agrário e ambiental. Zaragoza: Prensas de la Universidad de Zaragoza.
-
Machado, A. V. M., Oliveira, P. A., Matos, P. G., Santos, A. S. P. (2023). Strategies for achieving sustainability of water supply systems in rural environments with community management in Brazil. Water, 15(12), 2232. https://doi.org/10.3390/w15122232
» https://doi.org/10.3390/w15122232 - Mackie, P., Nellthorp, J., Laird, J. (2005). Distribution of benefits and impacts on poor people (Transport Note, No. TRN-26). Washington, D.C.: World Bank.
-
Marchioni, M., Raimondi, A., Di Chiano, M. G., Sanfilippo, U., Mambretti, S., Becciu, G. (2023). Costs-benefit Analysis for the use of Shallow Groundwater as non-conventional Water Resource. Water Resources Management, 37(5), 2125-2142. https://doi.org/10.1007/s11269-023-03483-3
» https://doi.org/10.1007/s11269-023-03483-3 - Marengo, J. A., Galdos, M. V., Challinor, A., Cunha, A. P., Marin, F. R., Vianna, M. S., Alvala, R. C., Alves, L. M., Moraes, O. L., Bender, F. (2022). Drought in northeast brazil: A review of agricultural and policy adaptation options for food security. Climate Resilience and Sustainability, 1(1), e17.
-
Millington, N. (2018). Producing water scarcity in São Paulo, Brazil: The 2014–2015 water crisis and the binding politics of infrastructure. Political Geography, 65, 26-34. https://doi.org/10.1016/j.polgeo.2018.04.007
» https://doi.org/10.1016/j.polgeo.2018.04.007 - Mishan, E. J. (1994). Cost-benefit analysis: an in-formal introduction. London: Routledge.
-
Nicoletti, L., Sirenko, M., Verma, T. (2023). Disadvantaged communities have lower access to urban infrastructure. Environment and Planning. B, Urban Analytics and City Science, 50(3), 831-849. https://doi.org/10.1177/23998083221131044
» https://doi.org/10.1177/23998083221131044 -
Nunes, L. G. C. F., Ribeiro Neto, A. (2025). Simulation of structural and non-structural measures for climate change adaptation in water resources systems in the Capibaribe and Ipojuca River basins, Pernambuco state, Brazil. Journal of Water and Climate Change, 16(5), 1653-1672. https://doi.org/10.2166/wcc.2025.502
» https://doi.org/10.2166/wcc.2025.502 - Sachs, J. (2001). Macroeconomia y salud: invertir en salud en pro del desarrollo economico informe de la comision sobre macroeconomia y salud Geneva: WHO.
-
Sanchez, G. M., Terando, A., Smith, J. W., García, A. M., Wagner, C. R., Meentemeyer, R. K. (2020). Forecasting water demand across a rapidly urbanizing region. The Science of the Total Environment, 730, 139050. https://doi.org/10.1016/j.scitotenv.2020.139050
» https://doi.org/10.1016/j.scitotenv.2020.139050 -
Sergipe. Secretaria de Estado do Desenvolvimento Urbano e Infraestrutura – SEDURBI. (2020, 26 de agosto). Governo intensifica ações da Operação Carro-Pipa em Sergipe. Aracaju. Retrieved in 2025, October 18, from https://sedurbi.se.gov.br/governo-intensifica-acoes-da-operacao-carro-pipa-em-sergipe/
» https://sedurbi.se.gov.br/governo-intensifica-acoes-da-operacao-carro-pipa-em-sergipe/ -
Stockholm International Water Institute – SIWI. (2005). Making water a part of econornic development: the economic benefits of improved water management and services. Retrieved in 2022, February 18, from https://www.siwi.org/wpcontent/uploads/2015/09/waterandmacroecon.pdf
» https://www.siwi.org/wpcontent/uploads/2015/09/waterandmacroecon.pdf - Stokey, E., Zeckhauser, R. (1978). Primer for policy analysis. New York: W. W. Norton.
-
Tortajada, C. (2016). Water, governance, and infrastructure for enhancing climate resilience. In C. Tortajada (Ed.), Increasing resilience to climate variability and change: the roles of infrastructure and governance in the context of adaptation (pp. 1-13). Singapore: Springer. https://doi.org/10.1007/978-981-10-1914-2_1
» https://doi.org/10.1007/978-981-10-1914-2_1 - United Nations. (2010). A/RES/64/292: the human right to water and sanitation: resolution. New York: General Assembly.
-
Zetland, D. (2021). The role of prices in managing water scarcity. Water Security, 12, 100081. https://doi.org/10.1016/j.wasec.2020.100081
» https://doi.org/10.1016/j.wasec.2020.100081
Edited by
-
Editor-in-Chief:
Adilson Pinheiro
-
Associated Editor:
Rosa Maria Formiga-Johnsson
Research data is only available upon request.