 Evaluation of the influence of bathymetry insertion and topographic resolution on flood wave propagation generated by the hypothetical failure of dams in a moderately incisioned valley
ABSTRACT
Obtaining bathymetric data for dam-break simulations involves technical, logistical, and economic challenges, thereby limiting understanding of its effects on hydrodynamic results. This study evaluated the influence of bathymetry and DEM resolution on dam-break simulations, using as a case study a valley reach representative of Southern Brazil. Four DEMs were analyzed: LiDAR with bathymetry (LiDAR-CB), LiDAR without bathymetry (LiDAR-SB), a photogrammetry-based model (100m-SB), and a global DEM (FABDEM). Two-dimensional simulations were conducted in HEC-RAS, structured in two stages: preliminary and final. In the preliminary stage, breach width and formation time were varied to generate five hydrographs (QP1–QP5). Breach width was identified as the main control on event severity, with differences of up to 70% in peak discharge. Final simulations involved three analyses: topographic comparison, hydraulic parameters (peak discharge, arrival time, depth, velocity), and flood extent. LiDAR-SB performed almost identically to LiDAR-CB, with less than 1% variation in key metrics. The 100m-SB model also showed close agreement, with minor localized divergences. FABDEM presented discrepancies, underestimating depths by more than 13 m and overestimating velocities by over 30%, yet conservatively predicted peak flows (≈9% higher) and inundated areas (≈12% larger). Results show that topographic resolution is a stronger determinant of simulation outcomes than bathymetry.
Keywords:
Dam-break; Bathymetry; Digital elevation models; Hydrodynamic simulation; HEC-RAS
RESUMO
A obtenção de dados batimétricos para simulações de ruptura de barragens envolve desafios técnicos, logísticos e econômicos, o que limita a compreensão de seus efeitos nos resultados hidrodinâmicos. Este estudo avaliou a influência da batimetria e da resolução de Modelos Digitais de Elevação (MDEs) em simulações de ruptura de barragens, utilizando como estudo de caso um vale representativo do Sul do Brasil. Foram analisados quatro MDEs: LiDAR com batimetria (LiDAR-CB), LiDAR sem batimetria (LiDAR-SB), um modelo derivado de fotogrametria aérea (100m-SB) e um modelo global (FABDEM). As simulações bidimensionais foram conduzidas no software HEC-RAS, estruturadas em duas etapas: preliminar e final. Na etapa preliminar, variaram-se a largura e o tempo de formação da brecha para gerar cinco hidrogramas (QP1–QP5). A largura da brecha foi identificada como o principal fator de controle da gravidade do evento, com diferenças de até 70% na vazão de pico. As simulações finais envolveram três análises: comparação topográfica, parâmetros hidráulicos (vazão de pico, tempo de chegada, profundidade e velocidade) e extensão da inundação. O LiDAR-SB apresentou desempenho quase idêntico ao LiDAR-CB, com variação inferior a 1% nos principais parâmetros. O modelo 100m-SB também mostrou boa concordância, com pequenas divergências localizadas. O FABDEM apresentou discrepâncias, subestimando profundidades em mais de 13 m e superestimando velocidades em mais de 30%, mas previu de forma conservadora vazões de pico (≈9% maiores) e áreas inundadas (≈12% maiores). Os resultados mostram que a resolução topográfica é mais determinante nos resultados das simulações do que a batimetria.
Palavras-chave:
Ruptura de barragens; Batimetria; Modelos digitais de elevação; Simulação hidrodinâmica; HEC-RAS
Introduction
Dams are structures widely used around the world for different purposes, such as water supply, irrigation, flow regulation, energy generation, and navigation (Khosravi et al., 2023). However, their failure is considered one of the most destructive events in engineering, potentially causing loss of human lives, damage to property, infrastructure, and the environment (Serinaldi et al., 2018). To study the effects related to dam failures, numerical and computational models have been developed and, over the past two decades, have been consolidated as fundamental tools for simulating such events (Psomiadis et al., 2021). One of the most widely used models is HEC-RAS (Quiroga et al., 2016), developed by the Hydrologic Engineering Center of the U.S. Army Corps of Engineers (USACE).
In one-dimensional modeling, HEC-RAS applies the 1D Saint-Venant equations, which describe gradually varied and unsteady flow. This formulation assumes an incompressible and homogeneous fluid, hydrostatic pressure distribution, resistance expressed through Chézy or Manning, and average velocity representing vertical and transverse variations. Since no analytical solution is feasible, the system is solved numerically using the finite difference method (U.S. Army Corps of Engineers, 2020). In two-dimensional models, the shallow-water equations in 2D result from integrating the Navier-Stokes equations along the vertical axis, describing flow as a function of velocity components in the x and y directions. This approach is particularly suitable for shallow environments such as floodplains and inundation areas and relies on assumptions similar to those of the 1D formulation: incompressible fluid, hydrostatic pressure, and turbulence represented through eddy viscosity (Chaudhry, 2008).
The 2D module of HEC-RAS provides two formulations: (i) the Full Momentum Equations, solving the complete 2D Saint-Venant equations; and (ii) the Diffusive Wave Model, a simplified version obtained by suppressing acceleration terms. In both situations, the mathematical model is formulated from the mass conservation equation (Equation 1), together with the momentum conservation equations in the x and y directions (Equations 2 and 3). Both rely on an implicit finite volume scheme, which enhances stability, allows longer time steps, and properly handles subcritical, supercritical, or mixed flow regimes (U.S. Army Corps of Engineers, 2020). The model also includes a numerical error assessment based on volumetric balance within the simulation domain.
where H is the free surface elevation (m); h is the flow depth (m); is the average velocity component in the longitudinal x-direction (m/s); is the average velocity component in the transverse y-direction (m/s); represents flow contributions or abstractions; t is time (s); is gravitational acceleration (9.81 m/s2); is the turbulent viscosity coefficient (m2/s), associated with momentum diffusion; is the bed friction coefficient (dimensionless or s−1, depending on the formulation) and is the Coriolis parameter (s−1), representing the Earth’s rotational force at large scales.
In dam-break studies, HEC-RAS is not limited to downstream flood wave propagation but also allows defining the breach development plan and simulating the rupture hydrograph. This characterization can be carried out in two ways: (i) by directly specifying breach parameters (height, width, formation time, side slopes, and failure mode); or (ii) by using the software’s internal empirical equations, based on dam and reservoir information such as crest and breach levels, reservoir volume, dam width and material, and slope conditions.
Dam-break studies are complex and require a large amount of data, which is often not available — such as downstream bathymetry and hydraulic conditions at the time of failure. To address this gap, empirical equations for breach and rupture hydrograph parameters have been developed based on historical records (U.S. Bureau of Reclamation, 1988; Froehlich, 1995; Kirkpatrick, 1977; MacDonald & Langridge-Monopolis, 1984; von Thun & Gillette, 1990).
Dams are structures subject to different failure mechanisms that may lead to breach formation. In practice, two of the most commonly discussed processes are overtopping—when water flows over the crest under conditions not intended for spilling—and internal erosion (piping), which occurs when seepage progressively removes material from within the embankment, potentially leading to breach formation and collapse (Collischonn & Tucci, 1997; Mascarenhas, 1990; Ferla, 2018). Other triggers, such as landslides, earthquakes, operational errors, and, more rarely, intentional actions, may also contribute to dam failure and are therefore considered in dam safety assessments (Brasil, 2002).
The Emergency Action Plan (PAE), part of the Dam Safety Plan (PSB) established by the Brazilian National Dam Safety Policy (PNSB), defines the procedures to be adopted in situations of imminent risk. Its mandatory implementation depends on the characteristics of the dam, the downstream valley, and the responsible regulatory agency. Among its components are the delineation of the flood extent, the definition of the Self-Rescue Zone (ZAS) and the Secondary Rescue Zone (ZSS), flood wave arrival time and peak discharge, maximum depths and velocities, and the hydrodynamic risk map (Brasil, 2010, 2022a, 2022b, 2023).
Understanding the factors that shape rivers along their course requires a multidisciplinary approach, since each river has unique characteristics while also sharing common traits that allow for classification into groups. Classification systems, such as that proposed by Rosgen (1994), are fundamental to predicting river behavior, extrapolating results to similar rivers, guiding restoration measures, and providing a consistent and replicable framework (Savery et al., 2001; Magalhães, 2010). Rosgen’s classification, based on observations of hundreds of rivers in North America and New Zealand, has become a universal method for geomorphological characterization, structured into four hierarchical levels ranging from a general description of the channel to detailed measurements. In this study, Level I classification is applied, which provides a general description of the river considering relief, valley morphology, and fluvial conditions, as well as channel configuration, planform, shape, and dimensions, distinguishing nine main classes (Figure 1: Aa+, A, B, C, D, DA, E, F, and G).

Currently, only a few studies incorporate actual bathymetry into the modeling of hypothetical dam-break scenarios, due to the high costs, complexity, and time required to obtain such data (Tschiedel, 2017; Kostecki & Banasiak, 2021; Rossi et al., 2021; Bures et al., 2019). In situations that demand rapid response, these limitations become even more critical. As a result, it is common to use DEMs with artificial channels or without bathymetry, since the most widely used topographic sensors do not capture information below the water surface (Colferai, 2018; Álvarez et al., 2017; Hoogestraat, 2011; Tschiedel et al., 2020; Paiva et al., 2013; Yan et al., 2015). This context raises questions about the actual need for detailed bathymetry, considering its influence on flood wave propagation in dam-break cases.
In this context, this study aimed to analyze the influence of bathymetry insertion on flood wave propagation generated by a hypothetical failure of the João Amado Dam. Specifically, the study assessed how the presence or absence of field-surveyed bathymetry—together with the spatial resolution of digital elevation models—affected flow representation and key hydrodynamic outputs.
As indicated by global sensitivity analyses of HEC-RAS 2D, spatial resolution is a critical factor in hydrodynamic simulations: DEM resolution and computational mesh size are among the most influential drivers of water-level dynamics and maximum water levels, whereas floodplain roughness and upstream boundary conditions exert a stronger influence on inundation extent (Alipour et al., 2022). Consistently, a dam-break application using HEC-RAS 2D also highlighted the relevance of the floodplain Manning coefficient to inundation mapping outcomes, reinforcing roughness as a key source of variability when flood extent is the primary metric (Silva et al., 2024). Moreover, recent evidence from southern Brazil indicates that floodplain topography and valley shape (DEM-derived) strongly control floodable area (Kuchinski & Paiva, 2025).
Low-resolution models tend to smooth the terrain, reduce topographic variability, and simplify valley geometry, which can significantly affect estimates of flood depth, velocity, and inundation extent (Alexopoulos et al., 2024; Muthusamy et al., 2021; Saksena & Merwade, 2015; Zandsalimi et al., 2024).
In this regard, the study aimed to assess whether topographic resolution may prove more decisive for result quality than the inclusion of bathymetry itself. Analyzing this relationship is essential to guide technical and economic decisions on which information should be prioritized in hypothetical dam-break studies.
The analysis was carried out by comparing different digital elevation models, including models with and without bathymetry, in order to highlight the impacts of this information on the estimation of relevant hydraulic parameters, such as discharge, arrival time, depth, velocity, and flood extent. In addition, the characterization of the downstream valley was considered to enable the extrapolation of the analyses to reaches with similar geomorphological conditions. The studied reach corresponds to a moderately incised valley with well-defined floodplains. This representativeness broadens the applicability of the results, allowing the conclusions to be extended to other projects located in analogous physical contexts.
The novelty of this paper lies in (i) incorporating a full in situ bathymetric survey, which is rarely available in practice due to time and cost constraints; (ii) providing evidence to support decision-making on whether bathymetry should be prioritized in dam-break studies; (iii) explicitly benchmarking a freely available global DEM against high-resolution terrain data derived from field surveys, thereby quantifying the practical limitations of global products for dam-break hydraulics; and (iv) coupling the hydraulic analysis with downstream-valley characterization to facilitate extrapolation of findings to river reaches with similar geomorphological conditions.
CASE STUDY
The João Amado Dam is located in Brazil, in the state of Rio Grande do Sul, within the municipality of Palmeira das Missões (Figure 2). The structure is part of the Guarita Small Hydropower Plant (HPP), which began operation in 1953. It has a single generating unit with an installed capacity of 1.86 MW.

The study dam is a concrete gravity structure, approximately 190 m long with a maximum height of 11.5 m. The associated reservoir has an active storage volume of 10.6 hm3 and a total storage volume of 22 hm3. The spillway is of the uncontrolled overflow type, 50 m wide, with its crest about 3.5 m below the dam crest.
For the purposes of this research, the hypothetical failure of the João Amado Dam was considered, along with the propagation of the resulting flood wave for approximately 48 km downstream along the Guarita River, up to the cross-section immediately upstream of the Guarita Dam reservoir.
MATERIAL AND METHODS
The research was carried out through two-dimensional hydrodynamic simulations in HEC-RAS 6.2, aiming to evaluate the impact of bathymetry insertion and topographic resolution on flood wave propagation resulting from the hypothetical failure of dams in moderately incised valleys. The selected case study was the João Amado Dam, chosen for its geomorphological representativeness and the availability of detailed topographic data.
The use of topobathymetric data in this research was previously authorized by CSN-Energia/CEEE-G, the entity responsible for dam operation. Four Digital Elevation Models (DEMs) derived from different acquisition and processing methodologies were employed to enable a comparative assessment of spatial resolution and bathymetry effects: (i) LiDAR-CB, a high-resolution (0.3 m) DEM integrated with echo sounder bathymetry, adopted as the reference model; (ii) LiDAR-SB, the same LiDAR survey without bathymetry, used to evaluate the effect of its absence; (iii) 100m-SB, generated from aerial photogrammetry at ~100 m altitude, also at 0.3 m resolution but with distinct acquisition characteristics; and (iv) FABDEM, a global open-access DEM with 30 m resolution, derived from Copernicus GLO-30 and improved with machine learning techniques to reduce vegetation and building artifacts.
Downstream valley characterization
The morphological characterization of the downstream valley was carried out using Level I parameters of the natural river classification system proposed by Rosgen (1994). These parameters were defined based on the analysis of 20 cross-sections distributed along the study reach, as shown in Figure 3.

For the downstream valley characterization, four geomorphological parameters were adopted, starting with the entrenchment ratio. In this case, the bankfull channel was defined as the area where flow reaches the transition between the main channel and the floodplain. From this, the bankfull width () and maximum depth were obtained, the latter being used to estimate the width of the potentially flood-prone area (). Finally, for each cross-section, the entrenchment ratio was calculated (Equation 4).
The width-depth ratio was determined as the ratio between the bankfull width and the mean bankfull depth (), as expressed in Equation 5. The mean bankfull depth was obtained by averaging the depths measured within the bankfull limits along each analyzed cross-section.
The sinuosity of the reach downstream was determined from 20 cross-sections along the river. For each segment, sinuosity was calculated as the ratio between channel length and straight-line distance (Equation 6), and the mean sinuosity of the entire reach was obtained from the arithmetic mean of all segments.
The river slope was determined as the mean of slopes calculated between the 20 cross-sections. For each segment, slope was obtained as the ratio between the bed elevation difference of two consecutive sections and the channel length following the natural river course (Equation 7).
Simulation scenarios
Based on the literature review, it was found that most empirical equations available in the scientific literature focus on modeling failures in earthfill or rockfill dams (U.S. Army Corps of Engineers, 2020; Wahl, 1998; Veale & Davison, 2013; Enzell et al., 2023). Consequently, there is a scarcity of studies specifically addressing concrete gravity dams, such as the João Amado Dam.
In this context, the breach development was simulated in HEC-RAS, which allows the definition of customized failure scenarios and the generation of a rupture hydrograph consistent with the geometric and structural characteristics of the dam and its breach configuration. This approach provides a representation more consistent with the specific features of the João Amado Dam.
First, preliminary simulations were performed to characterize the breach parameters by varying breach width (Lb) and formation time (Tf), resulting in five different rupture hydrographs (QP1 to QP5). Next, these hydrographs were propagated in the four DEMs, totaling twenty final simulations. The results were comparatively analyzed considering hydraulic parameters such as discharge, flood wave arrival time, depth, velocity, and inundation area.
Preliminary simulations
The preliminary simulations aimed to generate breach rupture hydrographs for subsequent propagation downstream of the João Amado Dam. An inflow hydrograph at the moment of failure was first estimated, and the hydrodynamic model produced the corresponding breach hydrograph. Overtopping was assumed as the failure mechanism, with failure initiated when the reservoir reached the dam crest. At that stage, the reservoir was assumed to operate at the spillway’s maximum capacity (640 m3/s), adopted as the upstream boundary condition. For the downstream boundary condition, normal depth was adopted using a mean slope of 0.005 m/m, estimated from a shortened reach relative to the domain used in the final simulations. This choice reflects the purpose of the preliminary runs, which aimed to derive the breach outflow hydrographs immediately downstream of the studied structure and therefore employed a reduced computational mesh extent.
Previous work using global sensitivity analysis in HEC-RAS 2D for dam-break flood mapping highlighted the relevance of the floodplain Manning coefficient to model outputs (Silva et al., 2024). In this study, it was fixed to avoid confounding effects and to emphasize the role of DEM resolution and bathymetry insertion.
The computational mesh was set to 10 × 10 m, with time steps automatically adjusted by the Courant criterion (0.1-1.0 s). Full Saint-Venant (shallow water) equations were solved, as they better capture transient processes compared to the diffusive-wave approximation (Yilmaz et al., 2023). The Coriolis and turbulence terms were not considered, and all other parameters were kept at default settings.
Simulations were performed exclusively with the LiDAR-CB DEM, adopted as the reference for including detailed submerged morphology. A breakline along the Guarita River axis was inserted to guide channel flow. The reservoir upstream of the dam was represented by its actual elevation-volume curve.
Breach rupture hydrographs were generated by varying breach width and formation time, following ranges recommended by Eletrobras (Centrais Elétricas Brasileiras S.A., 2003) and U.S. Army Corps of Engineers (2014): formation time between 0.1 and 0.5 h and breach width ≤ 50% of dam length (≈190 m). The values adopted in the preliminary simulations are summarized in Table 1.
The simulations were carried out in two stages: first, breach width was varied while keeping the formation time fixed at 0.25 h; then, formation time was varied with breach width fixed at 94.4 m. This approach allowed isolating the effects of each parameter on breach hydrograph generation.
Final simulations
In the final simulations, the breach hydrographs obtained from the preliminary stage were propagated downstream. These hydrographs were imposed as upstream boundary conditions of the hydrodynamic model, representing the initial outflow generated by dam failure. At the downstream boundary, normal depth was again applied; however, the average slope was recalculated based on the expanded domain adopted in the final simulations, resulting in 0.003 m/m, which was uniformly applied in all scenarios. All other model settings were kept unchanged to ensure methodological consistency. The spatial domain was expanded to cover the entire reach downstream of the João Amado Dam up to the cross-section immediately upstream of the Guarita Dam reservoir, ensuring that the flood wave was tracked throughout its natural extent and avoiding interference from the subsequent reservoir.
As shown in Table 1, five breach parameter combinations were defined in HEC-RAS, resulting in five characteristic breach hydrographs, each with a distinct peak discharge, extracted just downstream of the dam. These hydrographs were then propagated under all four DEM scenarios. Thus, five scenarios were simulated for each DEM, totaling 20 flood propagations.
In all simulations, both preliminary and final, the HEC-RAS 2D volume accounting (mass balance) reported in the Computational Log was monitored for the overall model and for each 2D Flow Area. This check summarizes the net gain/loss of water volume over the simulation and reports it as a percent volume error. Throughout the runs, volume errors remained very low, and the Computation Messages did not indicate persistent convergence issues (e.g., repeated time steps reaching the maximum number of iterations with significant numerical errors). Therefore, mass-balance discrepancies did not compromise the consistency or reliability of the hydrodynamic results.
Flood wave propagation downstream of the João Amado Dam was analyzed to assess the effects of bathymetry insertion and spatial resolution on hydrodynamic results. For this purpose, DEMs without bathymetry (LiDAR-SB, 100m-SB, and FABDEM) were compared with LiDAR-CB, adopted as the reference. The analyses were structured in three stages: (i) topographic, comparing minimum elevations from 20 cross-sections and quantifying discrepancies through global statistical errors, namely the Root Mean Square Error (RMSE, Equation 8) and the Mean Absolute Error (MAE, Equation 9); (ii) hydraulic, evaluating simulated parameters (discharge, arrival time, depth, and velocity) based on maximum values and statistical metrics applied to the full time series; and (iii) spatial, analyzing the flood extent through delineation of the inundation boundary and calculation of the inundated area.
where are the data from the reference model (LiDAR-CB); are the data from the compared model (without bathymetry) and is the number of data points extracted along a cross-section.
Cross-sections were strategically selected to be representative of the channel in the reference model. Specifically, sections were placed at locations where the channel was clearly and consistently defined in the bathymetry-enhanced terrain (LiDAR-CB), so that differences relative to the terrain without bathymetry (LiDAR-SB) would be more evident. This approach enabled a robust quantification of altimetric discrepancies and a clearer identification of the resulting hydraulic differences among scenarios.
The comparison also addressed spatial resolution effects, particularly in FABDEM, whose lower horizontal resolution limits terrain representation. Overall, the analysis assessed the relative importance of bathymetry and DEM resolution for achieving consistent hydrodynamic simulations, providing guidance for dam-break studies.
RESULTS AND DISCUSSION
Downstream valley characterization
The downstream valley of the João Amado Dam was characterized using the Level I methodology proposed by Rosgen (1994), applied to the LiDAR-CB DEM. Four geomorphological parameters were analyzed across 20 cross-sections: entrenchment ratio, width-depth ratio, sinuosity, and slope. These indicators allowed for a detailed description of channel geometry and provided insights into its hydraulic behavior, supporting the typological classification of the valley.
Results showed that all cross-sections presented an entrenchment ratio (ER) greater than 2.2 m/m, the threshold that indicates well-developed floodplains prone to inundation. The overall mean of 4.6 m/m confirms the predominance of this morphology, characterized by flat and continuous floodplains. The width-depth ratio (L/P) ranged mostly between 9 and 15 m/m, with a mean of 13.5 m/m, which indicates a moderately incised valley, since values below 9 m/m are typically associated with deeply incised valleys (Rosgen, 1994). Regarding sinuosity, 15 of the 19 analyzed reaches presented values above 1.4, the reference threshold adopted by the author to classify meandering rivers. The overall mean sinuosity was 2.2, confirming a non-linear course with well-developed meanders. River slope was below 0.02 m/m in all reaches, with a mean of 0.001 m/m, which is considered moderate according to standard hydrological criteria and consistent with the valley type found downstream.
Combining these results—high sinuosity, moderate slope, well-developed floodplains, and characteristic entrenchment and width-depth ratios—the downstream valley of the João Amado Dam was classified as Rosgen type “C”. This category corresponds to moderately incised valleys with well-defined meanders and floodplains. Therefore, river reaches classified as Rosgen type “C” may use the findings of this study as a reference when evaluating the expected influence of bathymetry insertion and terrain data resolution on dam-break hydraulics under comparable conditions.
Topographic datasets
A comparative analysis of the different topographic datasets was performed to evaluate the influence of bathymetry and spatial resolution on channel bed representation. Minimum bed elevations were extracted at 20 cross-sections using the four DEMs considered: LiDAR-CB (reference), LiDAR-SB, 100m-SB, and FABDEM. Differences relative to the LiDAR-CB model highlighted the distortions associated with the absence of bathymetry and with varying resolution.
Overall, LiDAR-SB and 100m-SB showed relatively small differences compared to LiDAR-CB, with maximum deviations of 3.1 m (LiDAR-SB, S20) and 3.0 m (100m-SB, S7). These discrepancies correspond to the average channel depth not captured in models without bathymetry, estimated at about 2.3 m across all sections (Frizzle et al., 2024; Farina et al., 2025). Differences were slightly larger for LiDAR-SB than for 100m-SB, but both preserved the general bed morphology. In contrast, FABDEM showed much larger deviations, exceeding 13 m in several upstream sections (e.g., S1, S6, S7, and S18), reflecting a shallower representation of the channel and underestimation of river depth.
Error metrics confirmed these patterns. LiDAR-SB presented the lowest errors, with RMSE ranging from 0.2 to 0.5 m and MAE from 0.03 to 0.1 m, demonstrating high fidelity even without bathymetry due to its high resolution. The 100m-SB model showed greater variability, with RMSE values from 0.4 to 4.1 m and MAE up to 3.0 m, particularly in sections with dense vegetation where laser pulses were partially intercepted by canopy cover. These conditions required interpolation to estimate ground elevation, introducing local uncertainties. FABDEM exhibited the highest errors, with RMSE often above 5 m and MAE above 4 m, confirming its limited capacity to capture bed topography in incised valleys or morphologically complex reaches (Hawker et al., 2022; Marsh et al., 2023).
These findings indicate that while high-resolution LiDAR data without bathymetry can still provide reliable channel representation, global low-resolution DEMs such as FABDEM tend to oversimplify valley geometry. In dam-break studies, this can lead to overestimation of inundated areas and significant distortions in simulated hydraulic parameters (Salgado et al., 2026).
Preliminary simulations
From the preliminary breach scenarios, five rupture hydrographs were generated for propagation in the final simulations. These scenarios varied breach width and formation time to evaluate their influence on hydrograph shape and magnitude. Breach parameters strongly control peak discharge, arrival time, and released volume, thus directly affecting downstream hydraulic results (Marangoz et al., 2024).
Hydrographs QP1–QP3 tested different formation times (0.1, 0.25, and 0.5 h) with constant breach width (94.4 m). Peak discharges were similar — 5400 m3/s (QP1), 5500 m3/s (QP2, +1.8%), and 5200 m3/s (QP3, –3.8%) — while the arrival time shifted consistently with the assumed breach formation time. These results confirm that within the recommended range (Wahl, 2004), formation time has little effect on hydrograph magnitude but controls the timing of peak flow.
Hydrographs QP4 and QP5 evaluated reduced breach widths (57 m and 19 m) with constant formation time (0.25 h). Unlike the previous cases, peak discharge was highly sensitive to breach width: 3500 m3/s for QP4 (–35% relative to QP1) and 1550 m3/s for QP5 (–71%). In these scenarios, peak timing remained nearly unchanged, but flow intensity was substantially reduced.
These results indicate that breach width exerts the strongest influence on hydrograph magnitude, making larger widths the most conservative scenarios for dam-break safety assessments (Karki et al., 2022). In contrast, formation time primarily shifts the hydrograph peak without altering its overall shape. Table 2 summarizes the peak discharge and arrival time for all preliminary scenarios, while Figure 4 presents the corresponding breach hydrographs (QP1–QP5).

Final simulations
In the final simulations, the five breach hydrographs obtained in the preliminary simulations were propagated downstream of the João Amado Dam. For each hydrograph, discharge, arrival time, depth, and flow velocity were extracted at 20 cross-sections along the study reach. In addition, flood extents and inundation areas were generated for each DEM, enabling the comparison of flood patterns across different topographic resolutions and the assessment of bathymetric data insertion.
Results were analyzed in two complementary approaches. The first focused on hydraulic parameters at the cross-sections, considering both maximum values and full time-series differences through Root Mean Square Error (RMSE) and Mean Absolute Error (MAE). The second involved the spatial assessment of flood extent, comparing inundation maps derived from each DEM along with their corresponding inundation areas.
Discharges
The analysis of peak discharges along the study reach provided important insights into the effects of bathymetry insertion and DEM resolution on flood wave propagation. Figure 5 presents the dimensionless ratios of peak discharges obtained from the four DEMs relative to the reference model (LiDAR-CB). Ratios close to 1.0 indicate strong agreement, with values above 1.0 representing conservative overestimation of peak flow and values below 1.0 indicating underestimation.

Results demonstrate that bathymetry insertion had negligible impact on peak discharge values (Alexopoulos et al., 2024). LiDAR-SB and LiDAR-CB produced virtually identical results across all five hydrographs, with differences consistently below 1%. The maximum observed deviation was only 0.28% (Section 2, QP1), confirming that the absence of bathymetry does not compromise flood wave simulation under the modeled conditions (Alexopoulos et al., 2024; Awadallah et al., 2022).
For the 100m-SB DEM, peak discharges remained close to the reference up to approximately 32 km downstream (Section 14), with systematic overestimation below 2%. Beyond this point, results shifted toward underestimation, with differences gradually increasing and reaching up to 6% in QP1–QP3 at the most downstream cross-sections. Although larger than those of LiDAR-SB, these discrepancies still remained within the same order of magnitude, with relative errors below 1% of peak flows in most cases.
The FABDEM exhibited the largest discrepancies. In the upstream half of the reach (Sections 1–13), peak discharges were overestimated by up to 8.8% in QP1–QP3. For lower peak scenarios (QP4 and QP5), differences were reduced to 7.4% and 5.2%, respectively. However, further downstream, FABDEM consistently underestimated peak discharges compared to LiDAR-CB, indicating a reversal in error tendency. Statistical metrics confirmed this behavior: LiDAR-SB maintained very low RMSE and MAE (<3 m3/s), 100m-SB showed a clear but gradual growth in error downstream (RMSE up to ~4 m3/s, MAE up to 3 m3/s), while FABDEM presented the highest discrepancies, with RMSE values exceeding 150 m3/s and MAE between 50 and 70 m3/s in central sections. Relative errors in FABDEM averaged around 6%, peaking at 8.3%.
Taken together, these results confirm that bathymetry has little effect on peak discharge propagation, while DEM resolution exerts a stronger influence. High-resolution DEMs, even without bathymetry, preserved discharge consistency, whereas low-resolution global models such as FABDEM tended to distort peak flow estimates (Salgado et al., 2026; Peramuna et al., 2025). Although FABDEM results remained coherent in terms of order of magnitude, its use in dam-break studies may introduce significant uncertainties in critical sections, highlighting the importance of higher-resolution terrain data when available.
Arrival time
The analysis of arrival time was based on the moment of maximum discharge at 20 cross-sections along the study reach. This parameter is critical for dam-break risk management, as it directly influences evacuation planning and emergency response. Figure 6 shows the dimensionless ratios of arrival times simulated with each DEM relative to the reference (LiDAR-CB).

Results indicate that LiDAR-SB reproduced arrival times almost identically to LiDAR-CB, with differences below 1 min for QP1–QP3 and up to 2 min for QP4–QP5, corresponding to ratios close to 1.0 across all sections. The 100m-SB DEM also showed good consistency, though arrival times were anticipated by up to 8 min in the first two sections for high-discharge scenarios, before stabilizing further downstream. FABDEM presented the largest deviations, with anticipation of arrival times throughout the reach, reaching up to 30 min for QP1–QP3 and more than 50 min for QP4–QP5.
These results confirm that bathymetry insertion has negligible influence on arrival time, while DEM resolution plays a stronger role (Salgado et al., 2026; Peramuna et al., 2023). High-resolution DEMs, even without bathymetry, maintained robust agreement with the reference, whereas the lower-resolution FABDEM consistently accelerated flood wave propagation. Although this bias reduces hydraulic accuracy, it may provide conservative estimates for emergency planning by anticipating flood arrival (Aureli et al., 2024).
Depths
The analysis of maximum depths was performed at 20 cross-sections downstream of the João Amado Dam, as this parameter directly reflects inundation severity and potential impacts on vulnerable areas and infrastructure. Depths simulated with DEMs without bathymetry were compared against the reference (LiDAR-CB) using both absolute differences and dimensionless ratios. Figure 7 presents the dimensionless ratios for the five breach hydrographs (QP1–QP5).

Results show that LiDAR-SB consistently underestimated maximum depths relative to LiDAR-CB, with differences exceeding 2 m in most cross-sections. This behavior reflects the absence of the excavated riverbed in the DEM and corresponds to the real channel depth (Awadallah et al., 2022; Choné et al., 2018; Garrote et al., 2021). Despite this underestimation, LiDAR-SB preserved floodplain geometry and reproduced inundation extent reliably, with very low statistical errors (RMSE <0.5 m in at least 15 sections), confirming that the effect of missing bathymetry is concentrated in the main channel (Awadallah et al., 2022; Choné et al., 2018).
The 100m-SB DEM exhibited similar behavior to LiDAR-SB for maximum depths, but larger section-wide errors when evaluated with RMSE and MAE. While peak depth values were close to LiDAR-CB, the broader profiles showed greater discrepancies due to smoothing and vegetation-related limitations of photogrammetry, particularly in floodplain areas.
FABDEM produced the largest underestimations of maximum depths, with errors exceeding 50% in several cross-sections. RMSE values frequently surpassed those of the other DEMs, reflecting the inability of FABDEM’s coarse resolution (~30 m) to represent the channel form (Meadows et al., 2024; Salgado et al., 2026). Dimensionless ratios confirmed underestimation along nearly the entire reach. Although these differences did not significantly alter the overall inundation extent, they indicate that depth-related impacts (e.g., building stability, structural damage) cannot be reliably assessed with FABDEM.
Together, these results demonstrate that bathymetry mainly affects depth values in the riverbed, while DEM resolution exerts broader structural impacts on depth distribution. High-resolution DEMs, even without bathymetry, preserve reliable inundation patterns, whereas coarse global models such as FABDEM provide only limited accuracy for dam-break studies (Meadows et al., 2024; Salgado et al., 2026).
Velocities
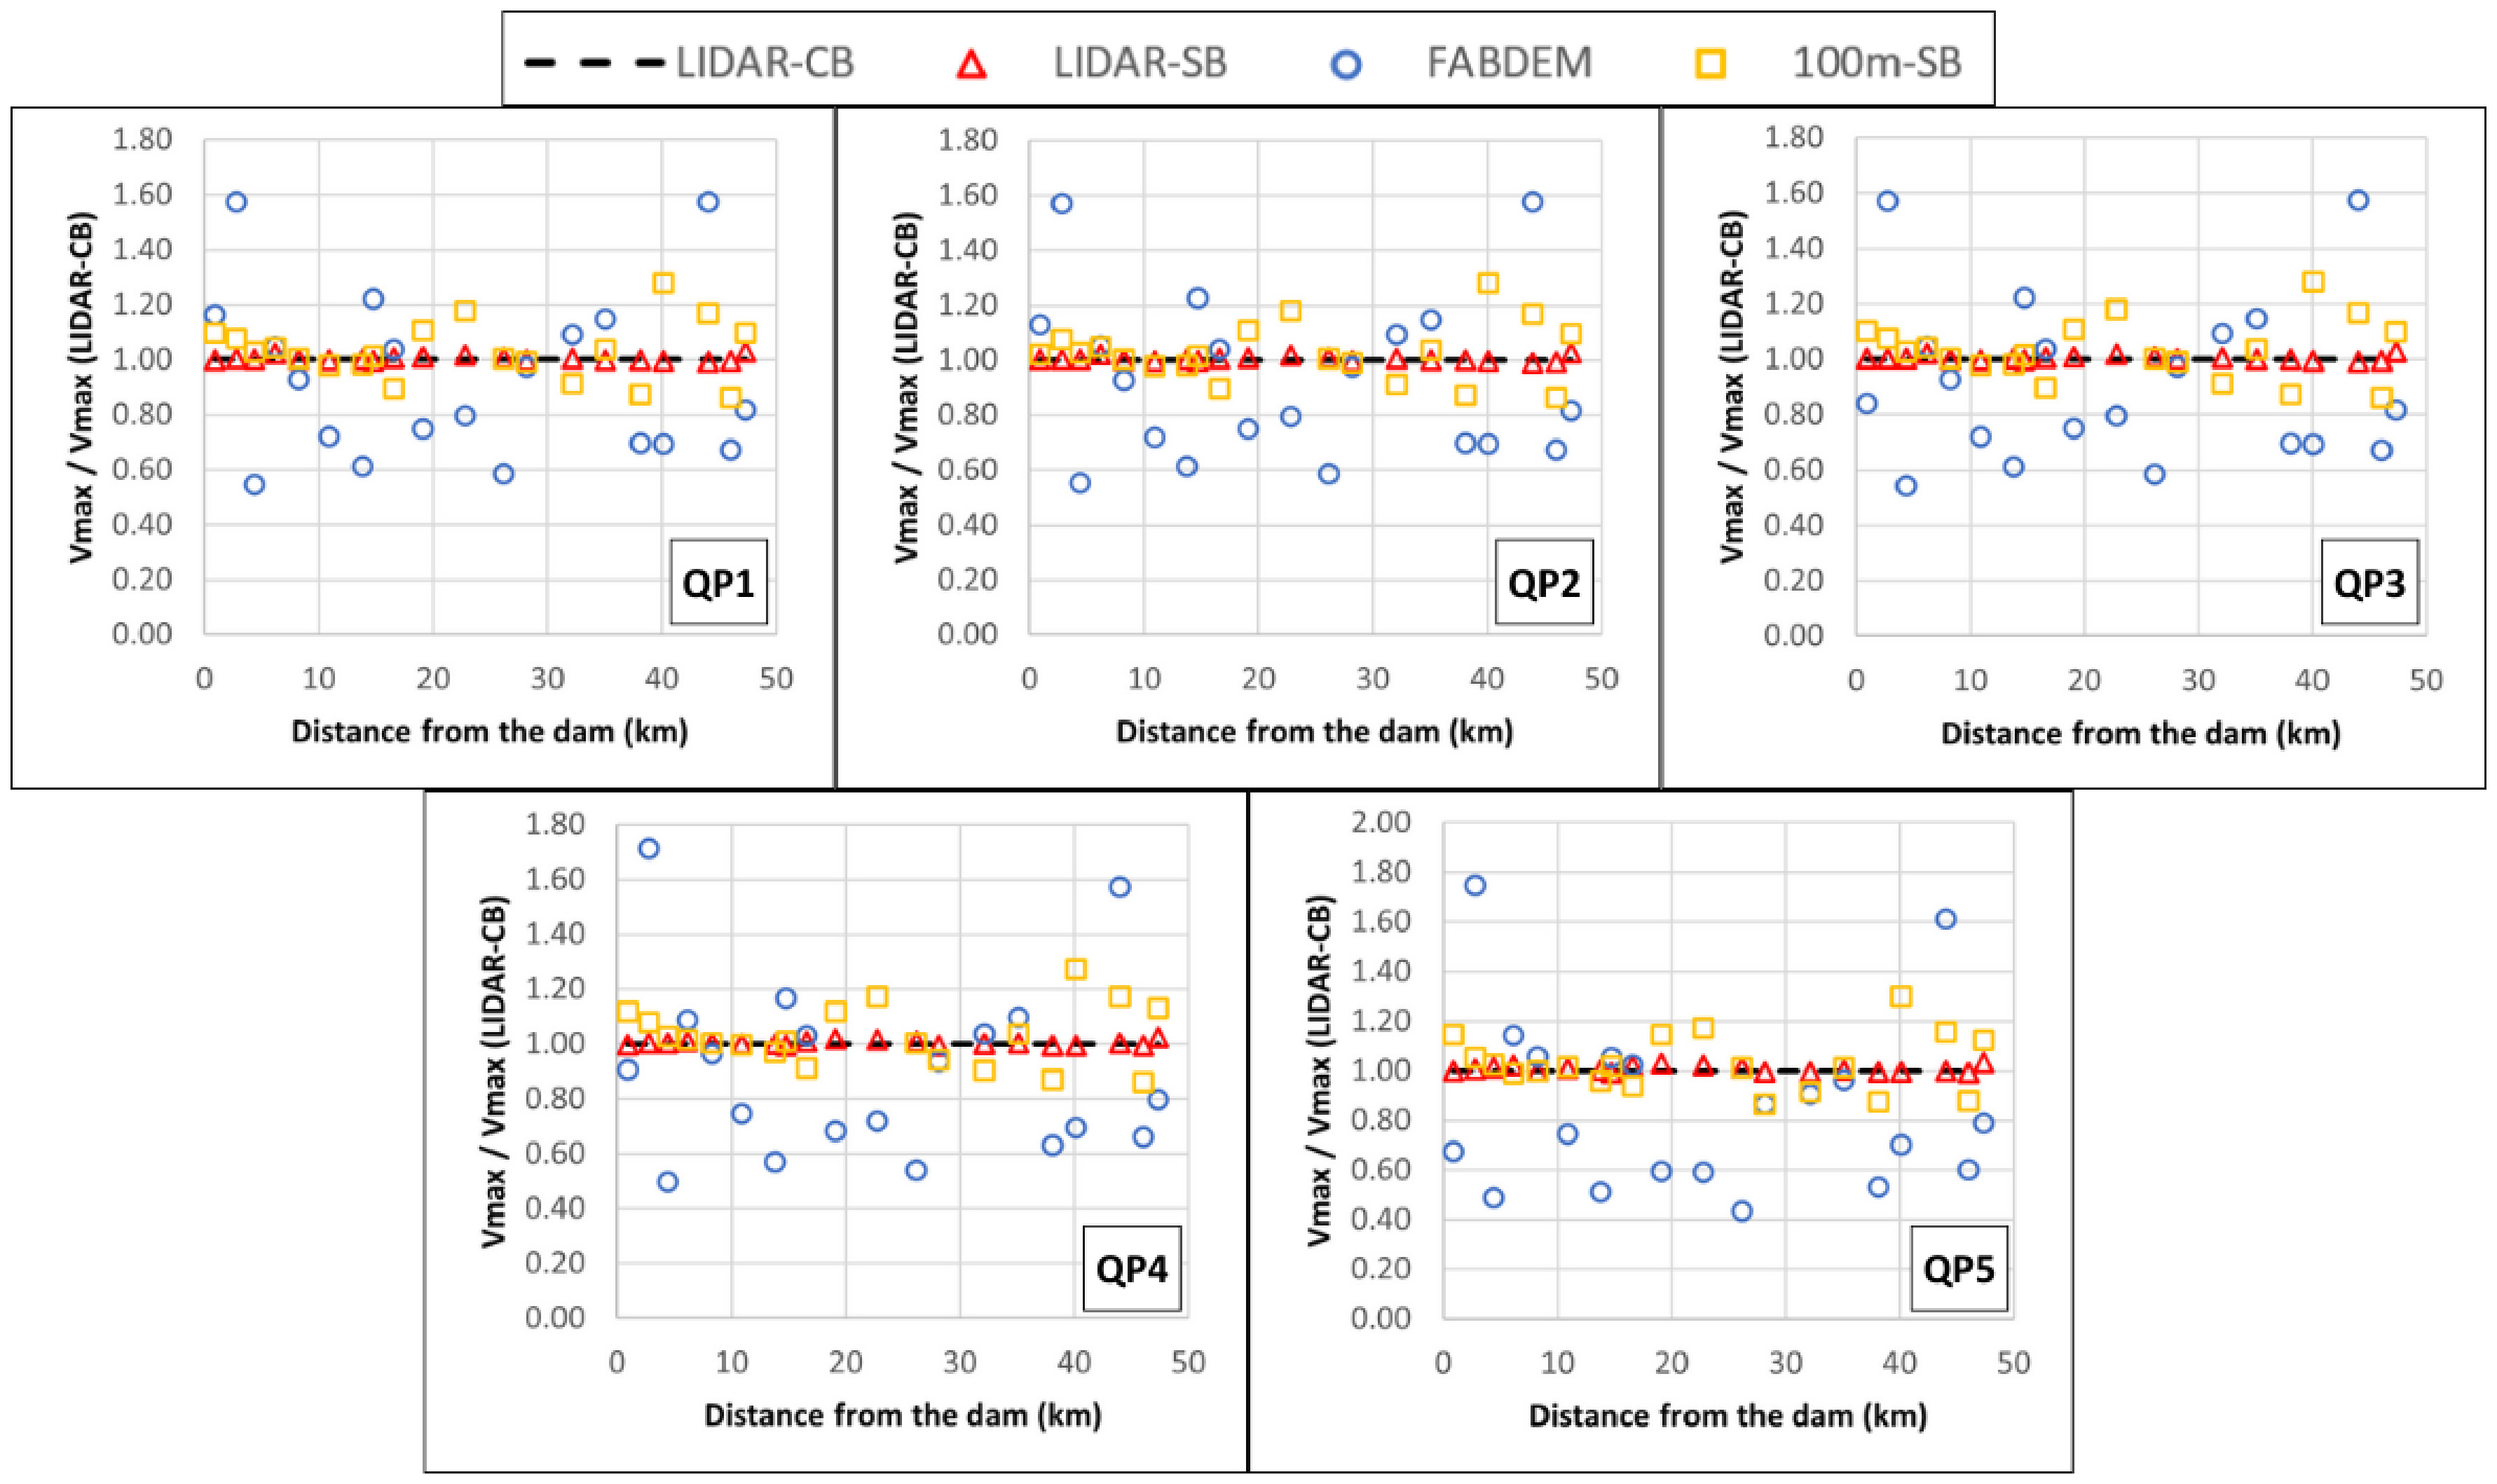
The analysis of maximum velocities was performed at 20 cross-sections along the study reach, as this parameter is directly related to erosion potential, structural stability, sediment transport, and drag forces. Simulated values from the different DEMs were compared against the reference (LiDAR-CB) using absolute differences and dimensionless ratios. Figure 8 presents the ratios of maximum velocities for the five breach hydrographs (QP1–QP5).

LiDAR-SB reproduced maximum velocities with high consistency, showing differences of only –1% to +3% relative to the reference, and average errors below 0.1 m/s. This indicates that the absence of bathymetry did not compromise flow dynamics, since velocity is more strongly controlled by channel slope and hydraulic gradient than by channel depth (Arcement & Schneider, 1989; U.S. Army Corps of Engineers, 2020). These results confirm that high-resolution LiDAR without bathymetry is sufficient for reliably assessing areas of high flow energy.
The 100m-SB DEM showed greater variability, with localized overestimations up to +27% in downstream sections for high-discharge scenarios (QP1–QP3). These deviations were associated with shallower depths and artificially widened flows caused by vegetation-related interpolation errors in photogrammetric data (Muthusamy et al., 2021; Acharya et al., 2021; Naranjo et al., 2021). Nevertheless, RMSE and MAE values remained low (0.2-0.6 m/s), and overall velocity patterns were consistent with the reference model.
FABDEM produced the most inconsistent results, alternating between severe overestimations (>+50%, with peaks above +70%) and underestimations below –50%, depending on the section and scenario. RMSE values frequently exceeded 1 m/s and reached more than 2 m/s in some sections.
The coarse resolution and absence of a well-defined channel geometry led to irregular gradients and distorted acceleration patterns, undermining the physical realism of velocity fields (Miskin et al., 2025; Salgado et al., 2026). Although FABDEM showed large discrepancies, its effect on peak discharge and arrival time remained limited, indicating that it can still be applied in exploratory analyses where velocity is not the primary variable of interest.
Inundation area
The analysis of inundation extents was carried out by delineating the flooded areas along the study reach for the five breach hydrographs (QP1–QP5). The total inundated areas obtained with each DEM are summarized in Table 3, while representative examples of flood extents are presented in Figure 9.

The flood maps correspond to scenario QP1, which represents the reference breach condition, defined with breach width and formation time values considered most suitable for the João Amado Dam. Overall, the flood extents were very similar among scenarios and across DEMs; although the FABDEM results for QP5 exhibited a larger difference (23%), this discrepancy is largely diluted when integrated over the long downstream reach analyzed. Therefore, presenting the inundation maps for QP1 provides a representative visualization of the spatial patterns while focusing on the scenario adopted as the reference configuration for the hypothetical dam-break assessment.
Comparison between the LiDAR-CB and LiDAR-SB models revealed very small differences in inundated area, with deviations below +0.5% for the largest scenarios (QP1–QP3) and slightly higher differences for the lower-discharge scenarios QP4 and QP5, reaching +0.6% and +0.9%, respectively. This behavior is consistent with previous findings (Bures et al., 2019; Awadallah et al., 2022; Tilano et al., 2024), which indicate that the effect of excluding bathymetry is more relevant under smaller discharges, when flow remains largely confined to the main channel — the portion most poorly represented in DEMs without riverbed excavation. In contrast, under higher discharges, water spreads into the floodplain, where surface topography is more accurately captured even without bathymetric data (Awadallah et al., 2022; Tilano et al., 2024). These results confirm that the absence of bathymetry has little influence on the horizontal extent of flooding, since water redistribution occurs mainly in depth rather than laterally (Awadallah et al., 2022). Consequently, LiDAR-SB proved to be suitable for applications where the primary concern is flood extent rather than absolute water depth.
The 100m-SB DEM, although based on photogrammetry rather than LiDAR, also yielded inundation areas in close agreement with the reference model. Deviations ranged from -0.4 to -0.8% relative to LiDAR-CB, even under the most severe scenarios. This indicates that despite the lower capacity of photogrammetry to penetrate vegetation and capture detailed ground morphology, the 100m-SB DEM preserved the essential structure of the valley and floodplain. These results can also be visually confirmed in Figure 9, where the boundaries of the inundation extents simulated with the LiDAR-CB, LiDAR-SB, and 100m-SB models show substantial overlap, revealing very similar spatial patterns.
The FABDEM exhibited the largest discrepancies, with overestimation of inundated areas in all scenarios. As shown in Table 3, increases were approximately +12% for QP1–QP3 and reached +18% and +23% for QP4 and QP5, respectively. These results reflect the coarse resolution (~30 m) and the smoothed representation of terrain features in FABDEM, which eliminate critical topographic controls such as well-defined channels and natural levees (Hawker et al., 2022; Cook & Merwade, 2009; Muthusamy et al., 2021).
Two characteristic behaviors can be identified. In some reaches, as illustrated in Figures 9b and 9c, the flood extent shows a slightly greater lateral spread, although in most of the valley this widening does not exceed 100 m compared to the other models. In more sinuous areas, as shown in Figures 9d and 9e, there is a tendency for adjacent meanders to connect, resulting in a more continuous flood extent along the valley. These patterns reflect minor differences in the representation of inundation, which justify the variations in the calculated flooded areas, but still render the results obtained with FABDEM satisfactory, particularly for preliminary studies or in situations where high-resolution topographic data are unavailable (Miskin et al., 2025). These differences remain within the range reported in previous studies (Cook & Merwade, 2009), which documented increases above 25% when using 30 m DEMs instead of high-resolution LiDAR.
Taken together, these findings highlight two main points: (i) the absence of bathymetry in high-resolution DEMs does not substantially affect inundation extent, confirming that floodplain geometry exerts stronger control than channel depth (Awadallah et al., 2022; Tilano et al., 2024); and (ii) DEM resolution is the dominant factor for flood extent accuracy (Cook & Merwade, 2009; Muthusamy et al., 2021; Miskin et al., 2025). While FABDEM can be useful for exploratory or large-scale applications, its use in local dam-break studies should be treated with caution (Miskin et al., 2025).
Conclusions
This study aimed to evaluate the relative influence of bathymetric insertion and topographic resolution on dam-break flood modeling, using João Amado Dam as a representative case of moderately incised valleys with well-developed floodplains. By comparing LiDAR-based DEMs with and without bathymetry, a photogrammetric DEM, and the global FABDEM dataset, the research assessed impacts on hydraulic parameters and flood extent.
The findings demonstrate that bathymetry plays a minor role compared to topographic resolution, which proved to be the dominant factor controlling hydrodynamic accuracy. Consequently, high-resolution topographic data should be prioritized in dam-break studies, while bathymetry may become relevant only in deeper reaches or under lower-magnitude flood scenarios.
The downstream valley of João Amado Dam was classified as moderately incised, sinuous, and with well-developed floodplains, corresponding to Rosgen’s (1994) class “C.” This geomorphological setting is typical of many dam sites in Brazil, enhancing the representativeness of the results.
Regarding topography, LiDAR-based models (with and without bathymetry) showed nearly identical behavior, differing only in channel depth. The 100m-SB model performed similarly, though more sensitive to densely vegetated areas. In contrast, the global FABDEM dataset revealed structural limitations due to its coarse resolution, with distortions in channel geometry and floodplain representation.
The preliminary simulation results showed that breach width was the dominant factor, exerting a strong control on peak discharge magnitude, while formation time mainly influenced the arrival time without significantly altering its magnitude. These findings highlight the sensitivity of dam-break hydrographs to breach geometry and justify the adoption of multiple scenarios to capture the range of possible flood responses.
For hydrodynamic parameters, the absence of bathymetry had negligible influence on peak discharge and arrival time, which remained nearly unchanged. Conversely, maximum depth was the most sensitive parameter, though differences were restricted to the main channel. Maximum velocity showed little dependence on bathymetry, with strong consistency among LiDAR-based models.
Analysis of flood extent confirmed that lateral inundation was primarily controlled by terrain resolution rather than bathymetry. LiDAR-SB and 100m-SB reproduced flood extents comparable to the reference model, while FABDEM consistently overestimated inundated areas.
Among the limitations, the relatively shallow channel (~2.3 m average depth) likely reduced the role of bathymetry, and the modeling domain was limited to the upstream section of the next reservoir, restricting downstream propagation analysis.
As recommendations, the findings indicate that topographic resolution should be prioritized over bathymetric surveys in dam-break modeling, particularly under extreme flood scenarios. Nonetheless, future applications should test the methodology in deeper reaches and for seasonal or operational floods, where bathymetry may play a more prominent role.
DATA AVAILABILITY STATEMENT
Research data is only available upon request.
Acknowledgments
The authors gratefully acknowledge Engenharia CF (Teixeiras, Minas Gerais, Brazil) for providing the topographic and bathymetric data used in this research. This study was developed within the framework of the R&D project “Development of a methodology for defining floodplain zoning resulting from hypothetical dam failure using topobathymetric data and simplified methods”, carried out in partnership between CSN-Energia/CEEE-G, the UFRGS School of Engineering Enterprise Foundation (FEENG), and the Institute of Hydraulic Research of the Federal University of Rio Grande do Sul (IPH/UFRGS).
References
-
Acharya, B. S., Bhandari, M., Bandini, F., Pizarro, A., Perks, M., Joshi, D. R., Wang, S., Dogwiler, T., Ray, R. L., Kharel, G., & Sharma, S. (2021). Unmanned aerial vehicles in hydrology and water management: applications, challenges, and perspectives. Water Resources Research, 57(11), 1-33. https://doi.org/10.1029/2021WR029925
» https://doi.org/10.1029/2021WR029925 -
Alexopoulos, M. J., Dimitriadis, P., Iliopoulou, T., Bezak, N., Kobold, M., & Koutsoyiannis, D. (2024). Effects of digital elevation model resolution on rain-on-grid simulations: a case study in a Slovenian watershed. Hydrological Sciences Journal, 69(11), 1468-1485. https://doi.org/10.1080/02626667.2024.2378487
» https://doi.org/10.1080/02626667.2024.2378487 -
Alipour, A., Jafarzadegan, K., & Moradkhani, H. (2022). Global sensitivity analysis in hydrodynamic modeling and flood inundation mapping. Environmental Modelling & Software, 152, 105398. https://doi.org/10.1016/j.envsoft.2022.105398
» https://doi.org/10.1016/j.envsoft.2022.105398 -
Álvarez, M., Puertas, J., Peña, E., & Bermúdez, M. (2017). Two-dimensional dam-break flood analysis in data-scarce regions: the case study of Chipembe dam, Mozambique. Water, 9(6), 432. https://doi.org/10.3390/w9060432
» https://doi.org/10.3390/w9060432 - Arcement, G. J., & Schneider, V. R. (1989). Guide for selecting Manning’s roughness coefficients for natural channels and flood plains (U.S. Geological Survey Water-Supply Paper, No. 2339). Reston: U.S. Geological Survey.
-
Aureli, F., Maranzoni, A., & Petaccia, G. (2024). Advances in dam-break modeling for flood hazard mitigation: theory, numerical models, and applications in hydraulic engineering. Water, 16(8), 1093. https://doi.org/10.3390/w16081093
» https://doi.org/10.3390/w16081093 -
Awadallah, M., Juarez, A., & Alfredsen, K. (2022). Comparison between topographic and bathymetric LiDAR terrain models in flood inundation estimations. Remote Sensing, 14(1), 227. https://doi.org/10.3390/rs14010227
» https://doi.org/10.3390/rs14010227 -
Brasil. Secretaria de Infraestrutura Hídrica. Ministério da Integração Nacional. (2002). Manual de segurança e inspeção de barragens. Brasília. Retrieved in 2025, July 23, from http://www.dominiopublico.gov.br/pesquisa/DetalheObraForm.do?select_action=&co_obra=82054
» http://www.dominiopublico.gov.br/pesquisa/DetalheObraForm.do?select_action=&co_obra=82054 -
Brasil. (2010). Lei nº 12.334, de 20 de setembro de 2010. Estabelece a Política Nacional de Segurança de Barragens. Diário Oficial [da] República Federativa do Brasil, Brasília. Retrieved in 2025, July 23, from https://www.planalto.gov.br/ccivil_03/_ato2007-2010/2010/lei/l12334.htm
» https://www.planalto.gov.br/ccivil_03/_ato2007-2010/2010/lei/l12334.htm -
Brasil. Agência Nacional de Mineração – ANM. (2022a). Resolução nº 95, de 7 de fevereiro de 2022. Consolida os atos normativos que dispõem sobre segurança de barragens de mineração. Diário Oficial [da] República Federativa do Brasil, Brasília. Retrieved in 2025, July 23, from https://www.gov.br/anm/pt-br/assuntos/barragens/legislacao/resolucao-no-95-2022.pdf
» https://www.gov.br/anm/pt-br/assuntos/barragens/legislacao/resolucao-no-95-2022.pdf -
Brasil. Agência Nacional de Águas – ANA. (2022b). Resolução nº 121, de 9 de maio de 2022. Altera a Resolução ANA nº 236, de 30 de janeiro de 2017. Diário Oficial [da] República Federativa do Brasil, Brasília. Retrieved in 2025, July 18, from https://participacao-social.ana.gov.br/api/files/Resolucao_n%C2%BA121_-_altera_a_Resolucao_n%C2%BA_236-1652723776600.pdf
» https://participacao-social.ana.gov.br/api/files/Resolucao_n%C2%BA121_-_altera_a_Resolucao_n%C2%BA_236-1652723776600.pdf -
Brasil. Agência Nacional de Energia Elétrica – ANEEL. (2023). Resolução normativa nº 1.064, de 2 de maio de 2023. Diário Oficial [da] República Federativa do Brasil, Brasília. Retrieved in 2025, July 18, from https://www2.aneel.gov.br/cedoc/ren20231064.pdf
» https://www2.aneel.gov.br/cedoc/ren20231064.pdf -
Bures, L., Roub, R., Sychova, P., Gdulova, K., & Doubalova, J. (2019). Comparison of bathymetric data sources used in hydraulic modelling of floods. Journal of Flood Risk Management, 12(Suppl 1), e12495. https://doi.org/10.1111/jfr3.12495
» https://doi.org/10.1111/jfr3.12495 -
Centrais Elétricas Brasileiras S.A. – Eletrobrás. (2003). Critérios de projeto civil de usinas hidrelétricas. Rio de Janeiro. Retrieved in 2026, March 5, from https://eletrobras.com/pt/AreasdeAtuacao/geracao/Manuais%20para%20Estudos%20e%20Projetos%20de%20Gera%C3%A7%C3%A3o%20de%20Energia/Crit%C3%A9rios%20de%20Projetos.pdf
» https://eletrobras.com/pt/AreasdeAtuacao/geracao/Manuais%20para%20Estudos%20e%20Projetos%20de%20Gera%C3%A7%C3%A3o%20de%20Energia/Crit%C3%A9rios%20de%20Projetos.pdf -
Chaudhry, M. H. (2008). Open-channel flow Boston: Springer. https://doi.org/10.1007/978-0-387-68648-6
» https://doi.org/10.1007/978-0-387-68648-6 -
Choné, G., Biron, P. M., & Buffin-Bélanger, T. (2018). Flood hazard mapping techniques with LiDAR in the absence of river bathymetry data. E3S Web of Conferences, 40, 06005. https://doi.org/10.1051/e3sconf/20184006005
» https://doi.org/10.1051/e3sconf/20184006005 -
Colferai, M. (2018). Análise da influência da topobatimetria de jusante em estudo de rompimento de barragem (Dissertação de mestrado). Universidade Federal do Rio Grande do Sul, Porto Alegre. Retrieved in 2025, July 18, from http://hdl.handle.net/10183/179904
» http://hdl.handle.net/10183/179904 -
Collischonn, W., & Tucci, C. E. M. (1997). Análise do rompimento hipotético da Barragem de Ernestina. Revista Brasileira de Recursos Hídricos, 2(2), 191-206. https://doi.org/10.21168/rbrh.v2n2.p191-206
» https://doi.org/10.21168/rbrh.v2n2.p191-206 -
Cook, A., & Merwade, V. (2009). Effect of topographic data, geometric configuration and modeling approach on flood inundation mapping. Journal of Hydrology, 377(1-2), 131-142. https://doi.org/10.1016/j.jhydrol.2009.08.015
» https://doi.org/10.1016/j.jhydrol.2009.08.015 -
Enzell, J., Nordström, E., Sjölander, A., Ansell, A., & Malm, R. (2023). Physical model tests of concrete buttress dams with failure imposed by hydrostatic water pressure. Water, 15(20), 3627. https://doi.org/10.3390/w15203627
» https://doi.org/10.3390/w15203627 -
Farina, G., Pilotti, M., Milanesi, L., & Valerio, G. (2025). A simple method for the enhancement of river bathymetry in LiDAR DEM. Environmental Modelling & Software, 186, 106354. https://doi.org/10.1016/j.envsoft.2025.106354
» https://doi.org/10.1016/j.envsoft.2025.106354 -
Ferla, R. (2018). Metodologia simplificada para análise de aspectos hidráulicos em rompimento de barragens (Dissertação de mestrado). Universidade Federal do Rio Grande do Sul, Porto Alegre. Retrieved in 2025, July 18, from http://hdl.handle.net/10183/180112
» http://hdl.handle.net/10183/180112 -
Frizzle, C., Trudel, M., Daniel, S., Pruneau, A., & Noman, J. (2024). LiDAR topo-bathymetry for riverbed elevation assessment: A review of approaches and performance for hydrodynamic modelling of flood plains. Earth Surface Processes and Landforms, 49(9), 2585-2600. https://doi.org/10.1002/esp.5808
» https://doi.org/10.1002/esp.5808 -
Froehlich, D. C. (1995). Peak outflow from breached embankment dam. Journal of Water Resources Planning and Management, 121(1), 90-97. https://doi.org/10.1061/(ASCE)0733-9496(1995)121:1(90)
» https://doi.org/10.1061/(ASCE)0733-9496(1995)121:1(90) -
Garrote, J., González-Jiménez, M., Guardiola-Albert, C., & Díez-Herrero, A. (2021). The manning’s roughness coefficient calibration method to improve flood hazard analysis in the absence of river bathymetric data: application to the urban historical Zamora City Centre in Spain. Applied Sciences, 11(19), 9267. https://doi.org/10.3390/app11199267
» https://doi.org/10.3390/app11199267 -
Hawker, L., Uhe, P., Paulo, L., Sosa, J., Savage, J., Sampson, C., & Neal, J. (2022). A 30 m global map of elevation with forests and buildings removed. Environmental Research Letters, 17(2), 024016. https://doi.org/10.1088/1748-9326/ac4d4f
» https://doi.org/10.1088/1748-9326/ac4d4f -
Hoogestraat, G. K. (2011). Flood hydrology and dam-breach hydraulic analyses of four reservoirs in the Black Hills, South Dakota. Reston: U.S. Geological Survey. https://doi.org/10.3133/sir20115011
» https://doi.org/10.3133/sir20115011 -
Karki, A., Bhattarai, S., Joshi, P., Kafle, M., & Bhattarai, R. (2022). Dam breach analysis and parameter sensitivity analysis along a river reach using HEC-RAS. Stavební obzor. Civil Engineering Journal, 31(4), 571-585. https://doi.org/10.14311/CEJ.2022.04.0043
» https://doi.org/10.14311/CEJ.2022.04.0043 -
Khosravi, K., Sheikh Khozani, Z., & Hatamiafkoueieh, J. (2023). Prediction of embankments dam break peak outflow: a comparison between empirical equations and ensemble-based machine learning algorithms. Natural Hazards, 118(3), 1989-2018. https://doi.org/10.1007/s11069-023-06060-4
» https://doi.org/10.1007/s11069-023-06060-4 - Kirkpatrick, G. W. (1977). Evaluation guidelines for spillway adequacy. In Evaluation of Dam Safety: Proceedings of the Engineering Foundation Conference (Vol. 1, pp. 395-414), Pacific Grove, CA. Reston: American Society of Civil Engineers.
-
Kostecki, S., & Banasiak, R. (2021). The catastrophe of the Niedów Dam: the causes of the dam’s breach, its development, and consequences. Water, 13(22), 3254. https://doi.org/10.3390/w13223254
» https://doi.org/10.3390/w13223254 -
Kuchinski, V., & Paiva, R. C. D. (2025). The influence of topography on floods in southern Brazil. Revista Brasileira de Recursos Hídricos, 30, e21. https://doi.org/10.1590/2318-0331.302520250009
» https://doi.org/10.1590/2318-0331.302520250009 -
MacDonald, T. C., & Langridge-Monopolis, J. (1984). Breaching characteristics of dam failures. Journal of Hydraulic Engineering, 110(5), 567-586. https://doi.org/10.1061/(ASCE)0733-9429(1984)110:5(567)
» https://doi.org/10.1061/(ASCE)0733-9429(1984)110:5(567) -
Magalhães, H. E. S. (2010). Avaliação do estado de potencial erosão de margens de um curso de água: aplicação nos troços estuarinos de rios do norte de Portugal (Master’s thesis). Faculdade de Engenharia, Universidade do Porto, Porto. Retrieved in 2025, July 18, from https://repositorioaberto.up.pt/bitstream/10216/60520/1/000145252.pdf
» https://repositorioaberto.up.pt/bitstream/10216/60520/1/000145252.pdf -
Marangoz, H. O., Anılan, T., & Karasu, S. (2024). Investigating the non-linear effects of breach parameters on a dam break study. Water Resources Management, 38(5), 1773-1790. https://doi.org/10.1007/s11269-024-03765-4
» https://doi.org/10.1007/s11269-024-03765-4 -
Marsh, C. B., Harder, P., & Pomeroy, J. W. (2023). Validation of FABDEM, a global bare-earth elevation model, against UAV-lidar derived elevation in a complex forested mountain catchment. Environmental Research Communications, 5(3), 031009. https://doi.org/10.1088/2515-7620/acc56d
» https://doi.org/10.1088/2515-7620/acc56d -
Mascarenhas, F. C. B. (1990). Modelação matemática de ondas provocadas por ruptura de barragens (Tese de doutorado). Universidade Federal do Rio de Janeiro, Rio de Janeiro. Retrieved in 2025, July 18, from http://www.coc.ufrj.br/pt/teses-de-doutorado/134-1990/742-flavio-cesar-borbamascarenhas
» http://www.coc.ufrj.br/pt/teses-de-doutorado/134-1990/742-flavio-cesar-borbamascarenhas -
Meadows, M., Jones, S., & Reinke, K. (2024). Vertical accuracy assessment of freely available global DEMs (FABDEM, Copernicus DEM, NASADEM, AW3D30 and SRTM) in flood-prone environments. International Journal of Digital Earth, 17(1), 2308734. https://doi.org/10.1080/17538947.2024.2308734
» https://doi.org/10.1080/17538947.2024.2308734 -
Miskin, T. J., Rosas, L. R., Hales, R. C., Nelson, E. J., Follum, M. L., Gutenson, J. L., Williams, G. P., & Jones, N. L. (2025). Impact of elevation and hydrography data on modeled flood map accuracy using ARC and Curve2Flood. Hydrology, 12(8), 202. https://doi.org/10.3390/hydrology12080202
» https://doi.org/10.3390/hydrology12080202 -
Muthusamy, M., Casado, M. R., Butler, D., & Leinster, P. (2021). Understanding the effects of Digital Elevation Model resolution in urban fluvial flood modelling. Journal of Hydrology, 596, 126088. https://doi.org/10.1016/j.jhydrol.2021.126088
» https://doi.org/10.1016/j.jhydrol.2021.126088 -
Naranjo, S., Rodrigues Junior, F. A., Cadisch, G., Lopez-Ridaura, S., Fuentes Ponce, M., & Marohn, C. (2021). Effects of spatial resolution of terrain models on modelled discharge and soil loss in Oaxaca, Mexico. Hydrology and Earth System Sciences, 25(10), 5561-5588. https://doi.org/10.5194/hess-25-5561-2021
» https://doi.org/10.5194/hess-25-5561-2021 -
Paiva, R. C. D., Buarque, D. C., Collischonn, W., Bonnet, M.-P., Frappart, F., Calmant, S., & Mendes, C. A. B. (2013). Large-scale hydrologic and hydrodynamic modeling of the Amazon River basin. Water Resources Research, 49(3), 1226-1243. https://doi.org/10.1002/wrcr.20067
» https://doi.org/10.1002/wrcr.20067 -
Peramuna, P. D. P. O., Neluwala, N. G. P. B., Wijesundara, K. K., De Silva, S., Venkatesan, S., & Dissanayake, P. B. R. (2023). Review on model development techniques for dam break flood wave propagation. Water, 11(2), e1688. https://doi.org/10.1002/wat2.1688
» https://doi.org/10.1002/wat2.1688 -
Peramuna, P. D. P. O., Neluwala, N. G. P. B., Wijesundara, K. K., DeSilva, S., Venkatesan, S., & Dissanayake, P. B. R. (2025). Enhancing 2D hydrodynamic flood model predictions in data-scarce regions through integration of multiple terrain datasets. Journal of Hydrology, 648, 132343. https://doi.org/10.1016/j.jhydrol.2024.132343
» https://doi.org/10.1016/j.jhydrol.2024.132343 -
Psomiadis, E., Tomanis, L., Kavvadias, A., Soulis, K. X., Charizopoulos, N., & Michas, S. (2021). Potential dam breach analysis and flood wave risk assessment using HEC-RAS and remote sensing data: a multicriteria approach. Water, 13(3), 364. https://doi.org/10.3390/w13030364
» https://doi.org/10.3390/w13030364 -
Quiroga, V. M., Kurea, S., Udoa, K., & Manoa, A. (2016). Application of 2D numerical simulation for the analysis of the February 2014 Bolivian Amazonia flood: application of the new HEC-RAS version 5. Ribagua, 3(1), 25-33. https://doi.org/10.1016/j.riba.2015.12.001
» https://doi.org/10.1016/j.riba.2015.12.001 -
Rosgen, D. L. (1994). A classification of natural rivers. Catena, 22(3), 169-199. https://doi.org/10.1016/0341-8162(94)90001-9
» https://doi.org/10.1016/0341-8162(94)90001-9 -
Rossi, C. L. C. U., Marques, M. G., Teixeira, E. D., Melo, J. F. D., Ferla, R., & Prá, M. D. (2021). Dam-break analysis: proposal of a simplified approach. Revista Brasileira de Recursos Hídricos, 26, e02. https://doi.org/10.1590/2318-0331.262120200066
» https://doi.org/10.1590/2318-0331.262120200066 -
Saksena, S., & Merwade, V. (2015). Incorporating the effect of DEM resolution and accuracy for improved flood inundation mapping. Journal of Hydrology, 530, 180-194. https://doi.org/10.1016/j.jhydrol.2015.09.069
» https://doi.org/10.1016/j.jhydrol.2015.09.069 -
Salgado, S. R., Silva Carvalho, E. M., Viseu, M. T., & Oliveira, O. F. (2026). Comparative analysis of global DEMs for dam-break flood modeling and inundation mapping. Water Resources Management, 40(3), 98. https://doi.org/10.1007/s11269-025-04427-9
» https://doi.org/10.1007/s11269-025-04427-9 -
Savery, T. S., Belt, G. H., & Higgins, D. A. (2001). Evaluation of the Rosgen stream classification system in Chequamegon-Nicolet National Park, Wisconsin. Journal of the American Water Resources Association, 37(3), 641-654. https://doi.org/10.1111/j.1752-1688.2001.tb05500.x
» https://doi.org/10.1111/j.1752-1688.2001.tb05500.x -
Serinaldi, F., Loecker, F., Kilsby, C. G., & Bast, H. (2018). Flood propagation and duration in large river basins: a data-driven analysis for reinsurance purposes. Natural Hazards, 94(1), 71-92. https://doi.org/10.1007/s11069-018-3374-0
» https://doi.org/10.1007/s11069-018-3374-0 -
Silva, I. T. C., Santos, H. A., Pereira, L. C. O., & Nascimento, K. S. (2024). Global sensitivity analysis in flood mapping using HEC-RAS 2D: effects of the floodplain Manning coefficient for a dam-break case. Revista Brasileira de Recursos Hídricos, 29, e38. https://doi.org/10.1590/2318-0331.292420240032
» https://doi.org/10.1590/2318-0331.292420240032 -
Tilano, S. A. R., Boucher, M.-A., Lacey, J., & Parent, J. (2024). Quantifying changes in floods under different bathymetry conditions for a lake setting. Canadian Journal of Civil Engineering, 52(1), 74-88. https://doi.org/10.1139/cjce-2023-0237
» https://doi.org/10.1139/cjce-2023-0237 -
Tschiedel, A. F. (2017). Avaliação de fontes de incerteza em estudos de rompimentos de barragens (Dissertação de mestrado). Universidade Federal do Rio Grande do Sul, Porto Alegre. Retrieved in 2025, July 18, from http://hdl.handle.net/10183/164266
» http://hdl.handle.net/10183/164266 -
Tschiedel, A., Paiva, R., & Fan, F. (2020). Use of large-scale hydrological models to predict dam break-related impacts. Revista Brasileira de Recursos Hídricos, 25, e35. https://doi.org/10.1590/2318-0331.252020190128
» https://doi.org/10.1590/2318-0331.252020190128 -
U.S. Bureau of Reclamation – USBR. (1988). Downstream hazard classification guidelines (ACER Technical Memorandum, No. 11). Denver: USBR. Retrieved in 2025, July 18, from https://mde.maryland.gov/programs/Water/DamSafety/Documents/Dam-BreachAnalysis/USBR-ACER-TM11-Downstream-Hazard-Classification-Guidelines.pdf
» https://mde.maryland.gov/programs/Water/DamSafety/Documents/Dam-BreachAnalysis/USBR-ACER-TM11-Downstream-Hazard-Classification-Guidelines.pdf -
U.S. Army Corps of Engineers – USACE. (2014). Using HEC-RAS for dam-break studies. Davis: USACE. Retrieved in 2025, July 18, from https://www.hec.usace.army.mil/publications/TrainingDocuments/TD-39.pdf
» https://www.hec.usace.army.mil/publications/TrainingDocuments/TD-39.pdf -
U.S. Army Corps of Engineers – USACE. (2020). HEC-RAS, River Analysis System: hydraulic reference manual. Davis: USACE. Retrieved in 2025, July 18, from https://www.hec.usace.army.mil/confluence/rasdocs/ras1dtechref/6.4
» https://www.hec.usace.army.mil/confluence/rasdocs/ras1dtechref/6.4 -
Veale, B., & Davison, I. (2013). Estimation of gravity dam breach geometry. In: Multiple use of dams and reservoirs: needs, benefits and risks. In Proceedings of the NZSOLD/ANCOLD Conference (pp. 79-91), Rotorua, New Zealand. Wellington: IPENZ Proceedings of Professional Groups. Retrieved in 2025, July 18, from https://www.researchgate.net/publication/315766007_Estimation_of_Gravity_Dam_Breach_Geometry
» https://www.researchgate.net/publication/315766007_Estimation_of_Gravity_Dam_Breach_Geometry - von Thun, J. L., & Gillette, D. R. (1990). Guidance on breach parameters (Unpublished internal document). Denver, CO: U.S. Bureau of Reclamation.
- Wahl, T. L. (1998). Prediction of embankment dam breach parameters: a literature review and needs assessment (67 p). Denver: Water Resources Research Laboratory..
-
Wahl, T. L. (2004). Uncertainty of predictions of embankment dam breach parameters. Journal of Hydraulic Engineering, 130(5), 389-397. https://doi.org/10.1061/(ASCE)0733-9429(2004)130:5(389)
» https://doi.org/10.1061/(ASCE)0733-9429(2004)130:5(389) -
Yan, K., Di Baldassarre, G., Solomatine, D. P., & Schumann, G. J.-P. (2015). A review of low-cost space-borne data for flood modelling: topography, flood extent and water level. Hydrological Processes, 29(15), 3368-3387. https://doi.org/10.1002/hyp.10449
» https://doi.org/10.1002/hyp.10449 -
Yilmaz, K., Darama, Y., Oruc, Y., & Melek, A. B. (2023). Assessment of flood hazards due to overtopping and piping in Dalaman Akköprü Dam, employing both shallow water flow and diffusive wave equations. Natural Hazards, 117(1), 979-1003. https://doi.org/10.1007/s11069-023-05891-5
» https://doi.org/10.1007/s11069-023-05891-5 -
Zandsalimi, Z., Feizabadi, S., Yazdi, J., & Salehi Neyshabouri, S. A. A. (2024). Evaluating the impact of digital elevation models on urban flood modeling: a comprehensive analysis of flood inundation, hazard mapping, and damage estimation. Water Resources Management, 38(11), 1-26. https://doi.org/10.1007/s11269-024-03862-4
» https://doi.org/10.1007/s11269-024-03862-4
Edited by
-
Editor-in-Chief:
Adilson Pinheiro
-
Associated Editor:
Iran Eduardo Lima Neto