 Revisiting the statistical method for estimating the Probable Maximum Precipitation (PMP): from theoretical concepts to a satellite-based spatial approach in the state of Minas Gerais
ABSTRACT
Probable Maximum Precipitation (PMP) estimates have recently become a legal requirement for the design of high-hazard hydraulic structures in Brazil. However, the distinctions between the PMP concept and the available estimation models are not well understood by researchers and practitioners, causing confusion on what PMP estimates actually mean and a lack of comprehension about the inherent but implicitly neglected risk. In this paper, we revisit the statistical method proposed by Hershfield (1961, 1965), discussing theoretical aspects and modeling assumptions for highlighting its conceptual incompatibility with physical upper bounds for rainfall amounts. We also derive a new envelope curve for frequency factors for the Brazilian territory and apply it for constructing a satellite-based spatialized daily PMP map in Minas Gerais (MG). Results suggest the original method provides an unrealistic envelope curve for maximum frequency factors and indicate much lower values in Brazil. Moreover, the bias correction procedure of satellite retrievals proved effective in reproducing site-specific daily rainfall characteristics in MG. Despite the method’s theoretical inconsistencies, our approach provides a more realistic appraisal of statistical PMP estimates for supporting decision-making in the country.
Keywords:
PMP; Frequency factors; Satellite retrievals; Bias correction; Heavy-tailed models
RESUMO
Estimativas de Precipitação Máxima Provável (PMP) tornaram-se recentemente um requisito legal para o projeto de estruturas hidráulicas de alto risco no Brasil. No entanto, as distinções entre o conceito de PMP e os modelos de estimativa disponíveis não são bem compreendidas por pesquisadores e profissionais, causando confusão sobre o significado real das estimativas de PMP e falta de compreensão sobre o risco inerente, porém implicitamente negligenciado. Neste artigo, revista-se o método estatístico proposto por Hershfield (1961, 1965), discutindo aspectos teóricos e pressupostos de modelagem para destacar sua incompatibilidade conceitual com os limites superiores físicos para os volumes de precipitação. Também se deriva uma nova curva envoltória para os fatores de frequência para o território brasileiro, a qual é aplicada na construção de um mapa espacializado de PMP diária baseado em precipitação satelital em Minas Gerais (MG). Os resultados sugerem que o método original fornece uma curva envoltória irrealista para os fatores de frequência máximos e indica valores muito menores no Brasil. Além disso, o procedimento de correção de viés das recuperações de satélite mostrou-se eficiente na reprodução das características locais das precipitações máximas diárias em todo o território mineiro. Apesar das inconsistências teóricas do método, a abordagem proposta fornece uma avaliação mais realista das estimativas estatísticas de PMP diária para apoiar a tomada de decisões no país.
Palavras-chave:
PMP; Fatores de frequência; Estimativas satelitais; Correção de viés; Caudas pesadas
INTRODUCTION
The Probable Maximum Precipitation (PMP) is formally defined as “the greatest precipitation for a given duration that is physically possible over a given watershed area or size of storm area at a particular geographic location at a certain time of year, under modern meteorological conditions” (World Meteorological Organization, 2009). Essentially, the PMP concept – which should not be confused with the correspondent estimates – is built upon a theoretical, physical upper bound for rainfall amounts, for a given time scale, which results from critical yet physically plausible meteorological conditions with respect to moist gradients, ascending transport of moist air and precipitation efficiency (National Academies of Sciences, Engineering, and Medicine, 2024; Zorzetto et al., 2024). Such an upper limit might then be employed for the computation of the Probable Maximum Flood (PMF), a PMP-related deterministic quantity frequently utilized in the design of high-hazards hydraulic structures, such as spillways of large dams and nuclear power plants (National Academies of Sciences, Engineering, and Medicine, 2024).
Despite allegedly based on a sound scientific logic, the PMP concept – and, accordingly, the corresponding “no risk” design rationale (Koutsoyiannis, 1999) – has been disputed for a long time. In fact, a fierce debate on whether empirical evidence supports the existence of upper bounds for rainfall and floods (Enzel et al., 1993; Jacoby et al., 2008) or the “nature has no limits” approach (Koutsoyiannis, 2024) should be considered both on physical and philosophical grounds (National Academies of Sciences, Engineering, and Medicine, 2024; Salas et al., 2020) still persists on the scientific community. More importantly, however, is that, irrespectively of the actual existence of a rainfall upper bound, our ability to obtain reliable PMP estimates from finite (and usually short) samples of hydrometeorological variables, and the imperfect knowledge regarding possible states of the atmospheric system (Serinaldi & Kilsby, 2018), remains limited (Costa et al., 2015; Costa & Fernandes, 2017; Fernandes et al., 2010). Despite this, PMP estimates have become mandatory under Brazilian legislation (Brasil, 2022) for the design of hydraulic structures in mining sites and the development of corresponding dam safety plans whenever they surpass the 10,000-year return levels. This fact has renewed interest in PMP estimation methods from both researchers and practitioners across the country.
Typically, two non-complementary (if not theoretically incompatible) approaches are utilized for PMP estimation (World Meteorological Organization, 2009): meteorological methods, which rely on moisture maximization or storm transposition, potentially with “orographic adjustments”, and statistical counterparts (Hershfield, 1961, 1965; Koutsoyiannis, 1999; Papalexiou & Koutsoyiannis, 2006; Martin et al., 2025), which solely involve at-site information on maximum precipitation. More often than not, the former are deemed “more accurate” because of their “physically-based reasoning”. However, their uncertain data-dependent nature is readily perceived as meteorological PMP estimates have been greatly surpassed in many parts of the world – at times, soon after the publication of reports by technical agencies and committees (National Academies of Sciences, Engineering, and Medicine, 2024). Moreover, its estimation requires measurements of many hydroclimatic variables, not always available in the locations of interest, and storm transposition certainly involves expert knowledge and subjective decisions (National Academies of Sciences, Engineering, and Medicine, 2024) – these are obvious hindrances for the widespread use of the meteorological approach for PMP estimation.
Due to these facts, statistical methods have become an appealing alternative for practitioners – rainfall information is often (not always) available, and estimation is, at first sight, straightforward. A common statistical approach is that proposed by Hershfield (1961, 1965), which is based on frequency factors (Chow, 1951) closely related to the method of moments for parameter estimation. In formal terms, the statistical PMP may be expressed as (Hershfield, 1961, 1965)
in which and are, respectively, the sample average and standard deviation, as obtained from a sample of size , and is an (empirical) upper bound for the maximum frequency factors , which Hershfield initially postulated as 15 (Hershfield, 1961), based on data from over 2,600 gauging stations (mostly located in the USA), and latter linked to average maximum precipitation amounts through a nomograph (Hershfield, 1965), thus providing an envelope curve (note that capital letters on the right hand side of Equation (1) (and elsewhere) indicate random variables; as such, statistical PMP estimates are random variables themselves, not deterministic quantities).
Because of its “simplicity”, Hershfield’s statistical method has garnered worldwide attention for about 60 years. Most end-users, however, ignore the theoretical inconsistencies in Hershfield’s framework, which are more thoroughly discussed in the following paragraphs, and assume this to be a general tool for “no-risk” design (Brasil, 2022), at most criticizing the proposed upper bounds for the frequency factors (e.g., Desa et al., 2001; Alias et al., 2013; Chavan & Srinivas, 2017; Sarkar & Maity, 2020). This has entailed a mechanistic approach for PMP estimation in which easy-to-do calculations bypass critical conceptual aspects.
For instance, one should note that, rigorously, frequency factors are populational, model-dependent quantities which are thus not directly applicable to finite samples through induction only (Chow, 1951; Naghettini, 2017). In other words, strictly empirical estimates of frequency factors should be necessarily corrupted by sampling errors and, as a result, cannot communicate upper bounds (or any return level) without uncertainty – as a matter of fact, it is not even possible to fully disentangle the effects of sampling errors in the sample moments from those in the empirical frequency factors in statistical PMP estimation. At the same time, as the process from which maximum frequency factors stem is never explicitly put, it is unfeasible to estimate the theoretical exceedance probabilities related to such variables and, accordingly, to the derived envelope curve (Koutsoyiannis, 1999) – we do not mention return periods here as we are dealing with upper records, not block-maxima realizations of frequency factors. We also note that, for estimating the envelope curve, the maximum frequency factors were computed through an ad-hoc procedure in which the largest sample order statistics were excluded from the estimation of the sample moments, which lacks proper justification under theoretical reasoning and reinforces the random data-dependent nature of . These facts clearly demonstrate the incompatibility of PMP as a conceptual upper bound for rainfall amounts, and statistical PMP empirical estimates, which are, essentially, realizations of a random variable that, by definition, cannot translate meaningful deterministic upper limits.
In addition, as opposed to the assumptions of the original method, there is no empirical evidence of an upper bound for the frequency factors on Hershfield’s dataset (Koutsoyiannis, 1999). In effect, if one assumes that frequency factors are independent and identically distributed (IID) variates, as Hershfield actually did in his pioneering works, a heavy (unbounded) tail stems, which again puts the “no-risk” rationale into perspective – by resorting to extreme value theory, one can assign the return period of 60.000 years for Hershfield’s PMP (Koutsoyiannis, 1999), which, in turn, may not be large enough for some applications (Fernandes et al., 2010). Finally, applications of Hershfield’s approach in many parts of the world have suggested the envelope curves are not general, but rather region-specific (see Barbosa et al., 2023; Salas et al., 2020, and references therein). As a result, many research efforts have addressed modified versions of the statistical approach for more properly reflecting “local” rainfall regimes, arguing the postulated frequency factors in Hershfield’s papers might be “physically unrealistic” in their study regions (Salas et al., 2020).
Overall, the statistical method alone is clearly insufficient for supporting the assumption of physical upper bounds and, at the same time, does not provide a clear probabilistic interpretation of PMP estimates – by quoting Dingman (2015), “… the only merit in the [PMP] value arrived at is that it is a very large one”. In other words, the statistical approach is inherently flawed for reconciling the deterministic nature of the PMP concept and the purely random behavior of statistical PMP estimates. In this sense, by neglecting the stringent distinctions between theory (the conceptual description of the systems of interest) and applied models (simplified mathematical representations of such systems, which usually rely on inductive reasoning only), one may instead miscommunicate risk – in effect, every (data-dependent) PMP estimate will eventually be surpassed, even if the mathematical model that describes the maximum rainfall behavior is upper-bounded (Vogel et al., 2019).
Besides the outlined inconsistencies, many locations in Brazil (and worldwide) still lack proper ground rainfall information, which, to a great extent, hinders the reliable statistical PMP estimation. In fact, despite some recent efforts from Brazilian monitoring agencies, large areas still do not comply with world guidelines for minimum network density (World Meteorological Organization, 2009) and the time series in many gauging stations do not span more than a few years, which may entail highly biased estimates even for lower moments – notice that maximum daily rainfall amounts are more likely heavy-tailed variates (Papalexiou & Koutsoyiannis, 2013), for which inference from short samples is usually troubling (Vogel et al., 2025). In these cases, interpolation techniques (Barbosa et al., 2022; Xavier et al., 2022) might be utilized for indirectly estimating PMP at ungauged or poorly gauged locations. However, such approaches often result in overly smooth surfaces for the predictands at fine time scales (Barbosa et al., 2022; Camera et al., 2014), being thus ineffective in regions with complex terrain or marked by climate transitions (e.g., semiarid to humid tropical). Also, prediction errors may be too large in areas with low density of gauging stations (see the discussion in Sampaio & Costa, 2021), which may severely affect the estimation of very large design precipitation amounts.
In view of these problems, bias-corrected satellite retrievals have emerged as potential tools for dealing with scarce rainfall information (Dao et al., 2025; Katiraie-Boroujerdy et al., 2020; Ma et al., 2021; Maggioni et al., 2014, 2016; Xiao et al., 2022). Due to their spatial coverage and resolution, satellite products may capture abrupt variations in rainfall regimes due to orography or complex interactions among large-scale atmospheric systems, thus providing more detailed descriptions of rainfall spatial patterns of variability (e.g., Adhikari & Behrangi, 2022). Also, relatively long time series (e.g., 30 years or more) are available for some satellite products, which may mitigate the effects of sampling errors in the computations of the maximum rainfall averages and standard deviations (Naghettini, 2017). Nonetheless, for applications in statistical PMP estimation, the bias-correction procedure must be able to properly accommodate the complex error structures from remote sensing products, particularly with respect to extreme events (Duarte et al., 2022). In this sense, the quantile mapping technique has comprised a frequent alternative for addressing nonsystematic bias in maximum precipitation and other variables, under parametric (Zhu et al., 2022), semi-parametric (Rajulapati & Papalexiou, 2023) and nonparametric variants (Lima et al., 2018), as it is designed to preserve the entire marginal distribution of the observations, including more extreme quantiles (Rajulapati & Papalexiou, 2023).
The most common parametric model for bias-correcting precipitation with the quantile mapping technique is the two-parameter Gamma distribution (e.g., Serrat-Capdevila et al., 2016; Heo et al., 2019; Zhang et al., 2022, and references therein) – arguably, this is a relatively flexible model that accommodates distinct levels of skewness (Costa & Fernandes, 2017). However, it might not reproduce the frequency of extreme events due to its light upper tail (Papalexiou, 2022; Rajulapati & Papalexiou, 2023). In effect, as previously mentioned and suggested by many recent studies on extreme precipitation, this variable is more appropriately described by heavy or stretched-tailed models, such as the Weibull distribution (Marra et al., 2023), the Generalized Exponential of type-1 distribution (Rajulapati & Papalexiou, 2023), and the Generalized Gamma distribution (Papalexiou, 2022). Properly characterizing the tail decay, in turn, is necessary for estimating statistical PMP at ungauged locations (i.e., locations in which only satellite retrievals are available), as misinterpreting relatively frequent yet large events with high outliers during bias correction may strongly affect the computation of the sample moments (see Vogel et al., 2025).
Based on the presented arguments, and because of the current legal requirements in Brazilian territory, it is our belief that national agencies and practitioners could benefit from a more “realistic” spatialized PMP estimation procedure. At the same time, it appears necessary to clarify and discuss the assumptions that underly such procedure, to properly inform the usage of PMP estimates as design quantities. This paper attempts to address these issues. For this, we first introduce a new envelope curve for the maximum frequency factors based on Brazilian daily precipitation data, under the same rationale of Hershfield’s 1965 developments – the frequency factors are defined as functions of average maximum rainfall amounts. Next, to deal with irregular or insufficient density of rainfall gauging stations, we resort to a flexible stretched-tailed model, namely, the Generalized Gamma distribution (Papalexiou & Koutsoyiannis, 2016), for bias-correcting satellite retrievals and estimating maximum precipitation moments at ungauged locations. Here, we utilized the Climate Hazards Group InfraRed Precipitation with Station version 2 (CHIRPSv2) product, which is quasi-global, high-resolution merged product that provides rainfall estimates from 1981 onwards. In addition, studies have reported CHIRPS as a reliable source for hydrological and climatological applications, highlighting its accuracy in regions with sparse ground observations and its suitability for extreme rainfall analysis (An et al., 2020; Dhanesh et al., 2020; Gomes et al., 2022; Masood et al., 2023). At last, we derive a daily PMP map for the Brazilian state of Minas Gerais (MG) as an application, albeit our framework could be readily expanded to other Brazilian regions.
We note the stochastic nature of PMP estimates is purposely ignored here for providing a straightforward and “unique” guideline for design of high-hazards hydraulic structures in Minas Gerais. However, we fully discuss the implications of this choice throughout the manuscript. We also acknowledge that no “actual validation” is possible in our study. Instead, we focus on the limitations of statistical methods for PMP estimation, hoping to shed some light at this problematic subject and dispute “mechanistic” rituals that frequently neglect the necessary rigorous scientific perspective. The remainder of this paper is organized as follows. The next section presents the two-part methodology, in which the first one addresses the estimation of a new envelope curve for the Brazilian territory, while the second one describes the study area, datasets and the statistical method for bias correction and statistical PMP estimation in the state of Minas Gerais. Then, the main results are presented, along with an in-depth discussion of advantages and limitations of the proposed approach. Finally, the concluding remarks and envisaged research developments are addressed.
MATERIAL AND METHODS
Part 1 – A new envelope curve for daily PMP estimation in Brazil
In the first part of the methodology, we address a new envelope curve for estimating statistical daily PMP in the Brazilian territory. For this, we utilize 3,196 rainfall gauging stations from the National Agency of Water and Sanitation (ANA) network, irregularly spread across the five geopolitical regions of the country (Figure 1 and Table 1) and whose periods-of-record span at least 40 years – this is intended to mitigate the effects of sampling errors in the computation of sample moments, which, to some extent, would allow a more reliable estimation of the empirical frequency factors. As additional criteria for quality control, we discarded those years surpassing 20% of missing values and excluded those sample points deemed physically unrealistic (larger than 1250mm).
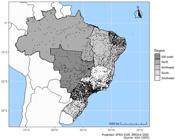
Characteristics of the rainfall gauging network and summary statistics of maximum precipitation in the Brazilian geopolitical regions.
Similarly to Hershfield’s “improved” approach (Hershfield, 1965), our envelope curve is based on the following simplifying assumptions:
-
is an independent spatial process and has the same unconditional distribution across the country – distinct climate characteristics are fully accommodated in and (note that, at this point, all quantities are random variables, i.e., they were not yet observed);
-
For deriving the envelope curve, functional dependence is fully established between and the maximum precipitation first noncentral sample moment ;
-
Maximum frequency factors are not corrupted by sampling and non-sampling errors – implicitly, the derived envelope curve is assumed as the actual (theoretical) upper bound for , irrespective of our imperfect knowledge on the modeled process (Serinaldi & Kilsby, 2018). In other words, we deliberately exclude from subsequent analysis those states of the underlying stochastic process that may theoretically surpass the envelope curve (just as Hershfield did), albeit empirical evidence may not fully support this conjecture (e.g., Koutsoyiannis, 1999); and
-
The envelope curve plots as a decaying exponential function, and the conditional limiting value for , as , is assumed as (Hershfield, 1965), although no theoretical reasoning is utilized for prescribing such an upper bound.
For each gauging station, the empirical maximum frequency factor (i.e., a realization of ) is expressed as:
in which is the maximum observed daily precipitation amount, as obtained from a sample of size , and and are, respectively, the observed mean and standard deviation of the remaining sample points (here, lowercases denote realizations of random variables). Then, the (, ) pairs, at each of the 3,196 gauging stations, are utilized for estimating the “slope” of the envelope curve.
The upper-bound of , at an arbitrary location (contained or not in the set of stations employed in model identification) may be then estimated by
in which is the estimated regression “slope”, as estimated in the previous step, and is the maximum daily precipitation sample average at location , as computed with the available sample points – note that, apart from the upper bound , no explicit assumptions are made about the conditional distribution of , which may conceal its actual random nature in practical applications.
Other remarks can be made on the proposed model for further highlighting the distinctions of PMP as concept and the PMP estimates. First, we have resorted to gauging stations with relatively large samples for benefiting from the consistency properties of the estimators for the sample mean and standard deviation (Naghettini, 2017, p. 207). However, as maximum precipitation amounts are expected to be heavy-tailed variates, large errors can still stem in the computation of the empirical frequency factors. As a result, although some approaches for estimating the exceedance probability of envelope curves are available (Castellarin, 2007; Castellarin et al., 2009), they should not apply for the statistical method, and, accordingly, it is not straightforward to assess the risk associated with statistical PMP estimates. We also note that no theoretical justification exists for specifying as an “outlier” in the estimation of , as suggested by Hershfield (1965) – again, the heavy tail decay might produce several large events as the sample sizes increase; hence, the second higher order statistic may not be too different from the highest one, and the actual “extremeness” of PMP estimates may be more closely related to the conditional limiting value of the envelope curve, which is, in turn, rather arbitrary. Finally, the sample average of maximum daily precipitation alone is unlikely to properly summarize long-term climate conditions, particularly in a continental-scale country, with strikingly different mechanisms for extreme rainfall formation, such as Brazil. As a result, the structural uncertainty stemming from “averaging” the frequency factors over distinct climate regimes should be too high.
Part 2 – Statistical daily PMP estimation from satellite retrievals in the state of Minas Gerais
Study area and datasets
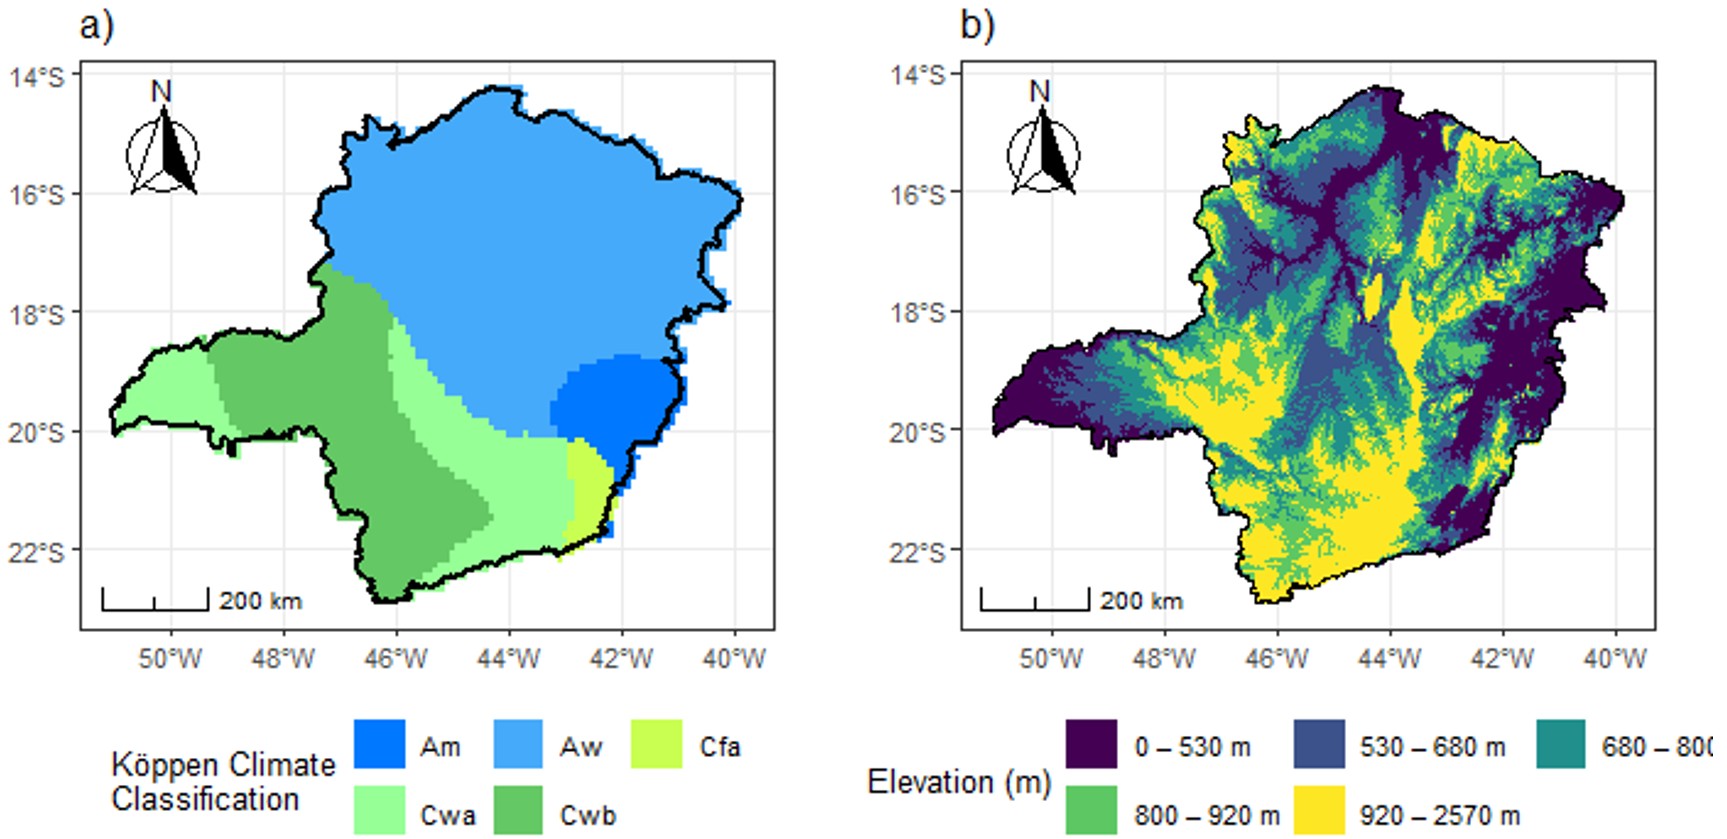
The state of Minas Gerais (MG), located in southeastern Brazil, has an area of approximately 586,000 km2 and a population that exceeds 20 million inhabitants, making it one of the most populated states in the country (Dalagnol et al., 2022; Instituto Brasileiro de Geografia e Estatística, 2024). Several major Brazilian basins originate in MG, from which one may cite the São Francisco, the Doce, the Grande, the Paranaíba, the Jequitinhonha, and the Mucuri river catchments – this fact highlights the state’s strategic importance for water resources management in Brazil (Braga et al., 2015). Due to its geographic location and large territorial extension, MG exhibits a variety of climate classifications, such as tropical (Cwa and Cwb) at the southeastern portion and semiarid (Am) at the northern counterpart (Figure 2 a). MG is also characterized by complex relief and strong topographic gradients (Figure 2 b), which favor the intensification of orographic effects in some areas and further complicates the hydroclimatic regimes (Reboita et al., 2015).

a) Elevation map for Minas Gerais state, b) Köppen-Geiger climate classification for Minas Gerais state.
Hydrometeorology in MG is influenced by a set of atmospheric systems, such as the South Atlantic Convergence Zone (SACZ), which is the primary driver of persistent large‑scale rainfall during the austral summer; frontal systems, that advance from higher latitudes and interact with warm, moist tropical air masses; and mesoscale convective systems, which are enhanced by elevated terrain and diurnal heating cycles (Reboita et al., 2015). The rainfall regime is highly seasonal across the state, with a pronounced wet season, which amounts to about 85% of the mean annual rainfall, from October to March. Annual precipitation amounts vary from over 1300 mm, in mountainous areas, to less than 900 mm in the northern semi‑arid transition zones (Silva, 2014; Reboita et al., 2015; Dalagnol et al., 2022). Mean annual temperatures, in turn, range from 20 to 25 °C along the state, in which areas with lower elevations tend to have higher temperatures (Reboita et al., 2015).
Minas Gerais is the most prominent mining region in Brazil. In effect, as of 2025, 320 tailings dams, from which 19 are classified as high‑hazard structures, are located in the state (Agência Nacional de Mineração, 2025). Some of these dams are situated upstream of densely populated areas, which increases the exposure to catastrophic failures, especially under very extreme rainfall events. As a matter of fact, recent accidents with tailings dams have caused severe social and environmental impacts in MG. In 2015, the collapse of the Fundão tailings dam, in Mariana, released more than 45 million m3 of mining waste, which destroyed the community of Bento Rodrigues, causing 19 fatalities, and contaminating more than 600 km of river systems (Carmo et al., 2017); Almost four years later, the failure of the Córrego do Feijão dam, in Brumadinho, entailed the release of 9.7 million m3 of tailings and resulted in 270 deaths. Extensive environmental contamination in the Paraopeba River catchment was linked to this accident – detailed post-disaster risk assessments highlight persistent contamination and long-term threats to the affected populations (Buch et al., 2024).
These accidents in MG have triggered renewed interest in tailings dams risk assessment and may be considered as a main cause that have led Brazilian legislators to include the PMP concept in design guidelines and safety plans at mining sites with no in-depth evaluation of the theoretical limitations of the available estimation methods. This has caused widespread confusion among practitioners, which mostly acknowledge the fallacy of the “no risk” rationale but, at the same time, still misinterpret PMP estimates as deterministic quantities (see, for instance, Brasil, 2022). Addressing this confusion and properly communicating the usage of statistical PMP estimates, under a more appropriate model for Brazilian rainfall regimes and with an application in this critical mining region, has thus become the main motivation for this study.
For deriving spatialized PMP estimates in Minas Gerais, daily rainfall data from 599 gauging stations across the state were initially obtained from the ANA database (Agência Nacional de Águas e Saneamento Básico, 2025). The raw daily precipitation series were reorganized into water years (October–September) and those years with more than 20% of missing values were excluded. For each valid hydrological year, the annual maximum daily rainfall amount was extracted. Only gauging stations with at least 30 sample points were retained, which resulted in 191 gauging stations for subsequent analyses (Figure 3). From these, 133 were randomly selected for parameter estimation and the remaining 58 sites were utilized for assessing the predictive abilities of the bias correction model – these are treated as ungauged locations.

Satellite retrievals from the CHIRPSv2 product were extracted from ‘https://www.chc.ucsb.edu/data/chirps’ and analyzed to derive annual maximum daily precipitation series by water year, for each pixel defined in the state of Minas Gerais. The raw daily raster datasets, for the period spanning from 1981 to 2023, were organized into daily time series and subsequently filtered to extract annual maxima, resulting in 44 sample points at each location.
Statistical model for satellite maximum daily rainfall bias correction
For applying the quantile mapping technique to bias correct remote sensing precipitation estimates, and obtaining pixel-based sample moments, let us define variables annual maximum daily observed rainfall amounts, , and annual maximum daily satellite retrievals, . Here, both variables are modeled by the Generalized Gamma distribution (GG), following the suggestions in Papalexiou (2022). The probability density function and the distribution function of the GG model are given in Equations (4) and (5), respectively.
in which , is a scale parameter (mm), is a shape parameter (dimensionless) that controls the behavior of the left tail, and is a shape parameter (dimensionless) that controls the “heaviness” of the right tail – higher values indicate faster tail decay. We note the GG distribution is a stretched-exponential distribution with all moments finite.
Parameter estimation, at each of the 133 gauges sites () and at the centers of all pixels defined by the satellite product (), was performed with the method of L-moments (Hosking & Wallis, 1997), by utilizing the R packages lmom and lmonco (Hoskin, 2024; Asquith, 2025). Then, the Inverse Distance Weighting (IDW) interpolation method, with exponent , was utilized for deriving spatialized estimates for the parameters of the distribution at each pixel – note that model parameters reflect long-term climate conditions and, as opposed to the variables’ realizations at a given time, are expected to vary more smoothly in space (Renard, 2011; Duarte et al., 2025); to some extent, this should justify our approach for parameter interpolation.
Finally, the bias corrected precipitation amounts, , at each pixel, are computed as
in which denotes the quantile function of the GG model with spatially interpolated parameters.
For assessing the effectiveness of the bias correction procedure, we estimate the annual maxima at the calibration and validation sites, and compare them to empirical counterparts by means of the following performance metrics
Here, RMSE (mm) is intended to assess the agreement between the highest order statistics of observed and bias corrected maximum precipitation amounts, which could more strongly impact the estimation of sample moments. MAPE (%), in turn, should provide a relative measure of goodness-of-fit for all bias-corrected estimates, thus allowing a more comprehensive evaluation of the quantile mapping performance. Finally, PBIAS (%) should assess systematic under- or overestimation of the empirical sample points, which would complement the quantile mapping effectiveness evaluation.
Estimation of satellite-based statistical daily PMP
After the validation of the proposed interpolation model, the satellite-based daily PMP was estimated in the state of Minas Gerais. To maximize the use of the spatial coverage provided by satellite-based precipitation products, PMP estimation was performed directly at the CHIRPSv2 pixel scale, with a spatial resolution of 0.05° × 0.05°, rather than at gauged locations. This strategy eliminates the need for spatial interpolation of PMP values and enables the direct generation of a quasi-continuous PMP map for the entire state.
For each pixel . , the bias correction method described in the previous section is utilized for computing the 44 “realizations” of variable . . Next, estimates of the sample moments, and , are obtained. Then, Equation (3) would provide the empirical upper bounds for the maximum frequency factors. Finally, statistical PMP estimated are derived from Equation (1).
RESULTS AND DISCUSSION
Part 1 – A new envelope curve for daily PMP estimation in Brazil
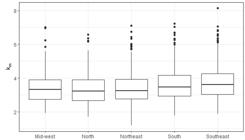
Figure 4 depicts the boxplots of maximum observed frequency factors in each of the Brazilian geopolitical regions. Although we did not perform formal tests, as significant statistical effects may be detected simply because of the large sample sizes (i.e., the differences might not be physically meaningful; see Serinaldi et al., 2018), the unconditional distributions of are similar across the country. In fact, there are only minor differences in medians, inter-quartile ranges, lengths of whiskers, and, with exception of the Southeastern region, in which a high outlier is observed, in the upper records in different regions. Overall, there appears to be little or no climate influence in the unconditional stochastic behavior of , albeit this should not hold for maximum daily precipitation sample moments (we again stress the effects of sampling errors in the computation of are neglected here). As a result, we believe no further issues would stem in grouping the entire set of realizations of the maximum frequency factors for deriving the envelope curve. We note though the stochastic process might not be spatially independent (Serinaldi & Kilsby, 2018), which could further complicate its probabilistic modeling.
We next estimated the empirical envelope curve for , conditionally to average sample maximum daily precipitation amounts. Results are summarized in Figure 5, which also depicts Hershfield’s envelope curve for comparison and the scatterplot of and . The distinctions between Hershfield’s original nomograph and our envelope curve are noticeable – the estimated regression “slopes” are for our model and for Hershfield’s. Consequently, the conditional empirical upper bounds of are much lower in Brazilian territory, which should have a huge impact in design rainfall estimates. This fact is possibly related to the interactions of very complex mechanisms for extreme rainfall formation in equatorial and tropical areas, which may favor the emergence of heavy tails and more frequent large-magnitude maximum rainfall events (Merz et al., 2022), leading to lower realizations of ; Hershfield more likely dealt with actual outliers in his dataset.

On the other hand, in view of the disagreement between models, one may dispute the physical plausibility of the proposed intercept () for Brazilian data, as the derived envelope curve strongly deviates from those realizations of conditioned to lower values of . This issue has been reported in previous research, and alternative limiting values have been proposed (e.g., Sarkar & Maity, 2020). However, unless physical reasoning and proper a priori conceptualization of the system being studied are utilized, every other value for the intercept would be as arbitrary as Hershfield’s. Hence, we decided to keep the original value for this parameter, particularly because no very small realizations for are expected in Brazil and the relatively fast decay of our envelope curve.
It is also worth noting that our envelope curve is strongly influenced by a single point, which is highlighted with a black circle in Figure 5; had this sample point been excluded from inference for any reason (e.g., during data quality checks), a “less extreme” envelope curve would be obtained, irrespective of the model intercept. This “unexpected” conditional behavior, i.e., a relatively large value of associated with a relatively large value of , clearly demonstrates the conceptual limitations of the statistical method, since the stochastic nature of maximum frequency factors might easily dispute model assumptions, as, for instance, the monotonic relationship between and , as postulated by Hershfield (1965). In effect, the scatterplot suggests a more complex functional relationship would be necessary for accommodating the empirical behavior of maximum frequency factors in the envelope curve. This fact reinforces the essentially flawed rationale of solely resorting to induction for prescribing upper bounds – epistemic uncertainty is usually too high and much larger samples (e.g., hundreds or thousands of observations) in each gauging station would be necessary for properly characterizing very extreme behavior and potential finite limits, both conditionally and unconditionally. Even so, one should bear in mind that infinitely-many envelope curves could be derived if experiment repetition was possible, which would certainly preclude the definition of deterministic upper bounds.
The presented results undoubtedly highlight the incompatibility between the deterministic PMP concept (theory) and statistical PMP estimates (model), which is frequently neglected by researchers and practitioners. In fact, PMP estimates are clearly realizations of random variables, associated with unknown yet non-null exceedance probabilities, which, rigorously, should be accounted for, along with the epistemic uncertainty (i.e., sampling and non-sampling errors), for properly informing risk. In this sense, the use of statistical PMP estimates as a deterministic alternative to rainfall frequency analysis (Brasil, 2022) is a highly questionable procedure. As a matter of fact, a probabilistic view of statistical PMP (Koutsoyiannis, 1999) would certainly enhance transparency and objectively guide decision-making in the design of high-hazard structures and in the development of dam safety plans.
On the other hand, our envelope curve better reflects the observed extreme rainfall regime in Brazilian territory, and, notwithstanding our imperfect knowledge on the meteorological processes and not fully validated modeling assumptions, it may provide more realistic estimates of design rainfall amounts, as compared to Hershfield’s original nomograph. Hence, under the envisaged “unique design guideline” perspective, the upper bound for maximum frequency factors may be computed by
which would thus allow estimating the statistical daily PMP in any location in Brazil.
Part 2 - Statistical daily PMP estimation from satellite retrievals in the state of Minas Gerais
We then proceeded to PMP spatialization in the state of Minas Gerais. For this, we first interpolated the parameters of and computed the non-exceedance probabilities of the satellite retrievals at each pixel defined in MG, and then utilized Equation 6 for estimating the bias-corrected rainfall amounts across the entire state. The performance of the quantile-mapping technique in reproducing observed annual maxima at the gauged sites is summarized in Figures 6 and 7.

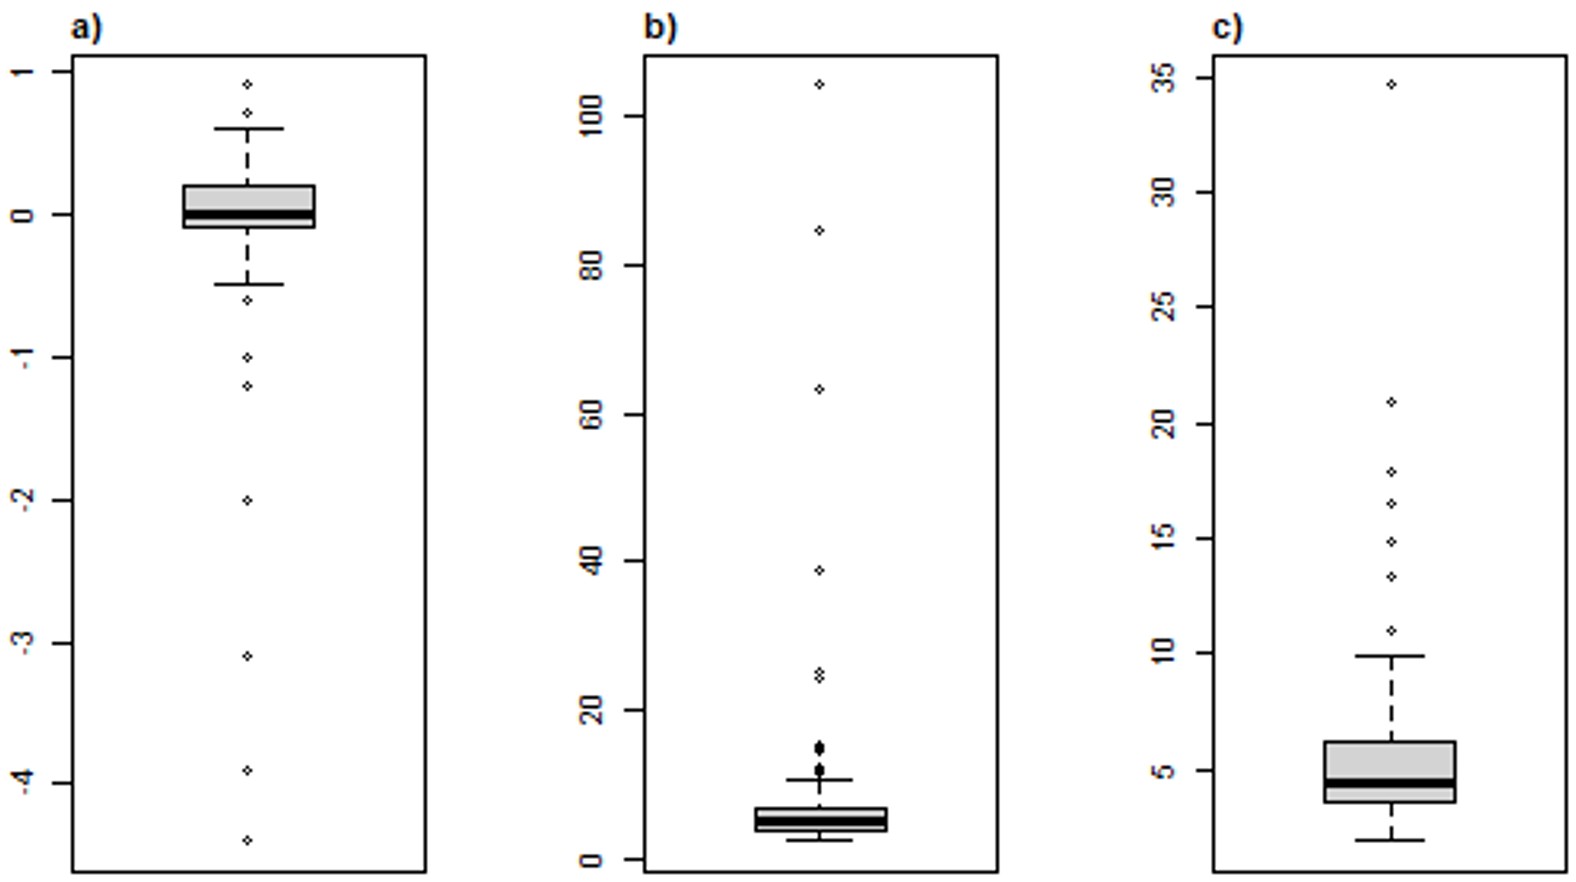
Performance metrics of bias-corrected rainfall amounts at the 133 gauged sites: a) PBIAS (%), b) RMSE (mm) and c) MAPE (%).

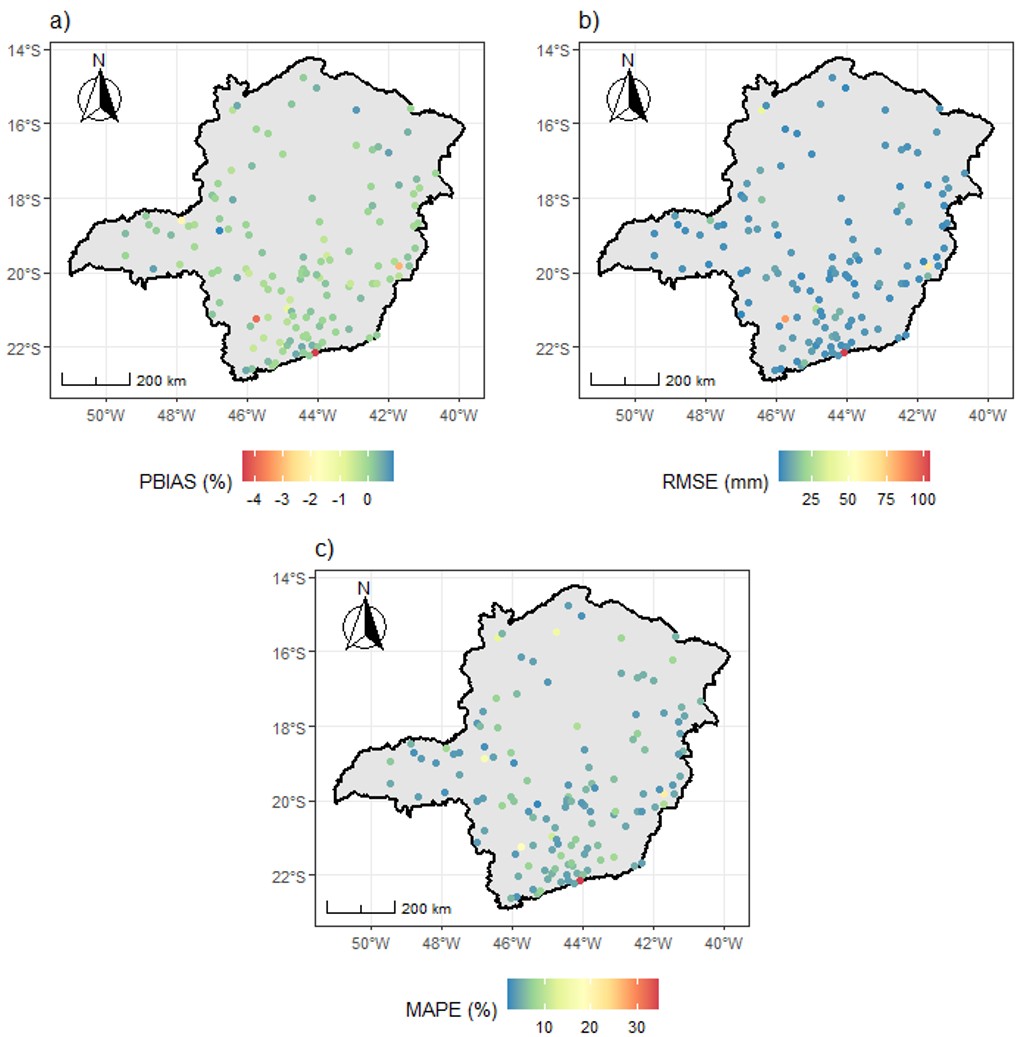
Spatial distribution of metrics at the 133 gauged sites: a) PBIAS (%), b) RMSE (mm) and c) MAPE (%).
One may notice that, in general, estimates are nearly unbiased (Figure 6a) – at most, the model entailed a systematic underestimation of 5%. Also, there is a reasonable agreement among the higher order statistics of observed and bias-corrected rainfall amounts, as indicated by the relatively low values of RMSE (Figure 6b), even for some outliers. In four sites, however, such metric exceeds 40mm and may surpass 100mm, which are deemed very large errors (these sites also present the larger systematic biases). In effect, some studies in MG suggest a threshold of 40mm for identifying extreme daily rainfall events (e.g., Nunes et al., 2018). MAPE (Figure 6c), in turn, indicates median relative errors close to 5%, but a higher number of outliers was verified for this metric – in seven sites, including the previously mentioned ones, the errors ranged from 10% to 35%. To some extent, this suggests that lack-of-fit to lower maximum rainfall amounts also occurred in these locations. However, as these sample points would probably have a lesser impact on sample moments, we believe the errors are acceptable.
By looking at Figure 7, it is not possible to identify spatial patterns for the larger errors, albeit two of the sites in which the bias correction model performed worst are located in high altitude areas in the wettest Southern region of the state. Nonetheless, much lower errors were observed in gauging stations close to these sites, which, to a great extent, excludes climate and topography as influential factors in model performance – the same holds for the other gauging stations with large values of RMSE. Hence, these larger errors and systematic underestimation probably occurred by chance only and might be ascribed to observed high outliers that could not be fully captured by the satellite retrievals. Overall, our results suggest the GG distribution is a reliable model for estimating maximum daily precipitation amounts through quantile-mapping.
Next, we assessed the “out-of-sample” performance of the bias correction model at the 58 sites selected for validation. Boxplots of the metrics are depicted in Figure 8, while Figure 9 depicts their spatial distributions. In median terms, only slightly worst metrics, as compared to the gauged sites, were obtained. However, the dispersions are relatively larger, which, as expected, indicates a more heterogeneous performance. In fact, apart from the outliers, systematic bias (Figure 8a) and relative errors (Figure 8c) are less than or equal to 15% (in absolute value for the former). When considering the outliers, MAPE exceeds 80% and PBIAS approximates 30% in a gauging station in the Northeastern region of MG. On the other hand, the maximum value of RMSE is roughly 45mm in a site in the wettest area of the state, which is considerably lower than those obtained in some of the gauged locations. Also, this metric remains below 20mm at the other validation sites, which is useful for more reliably estimating sample moments – these are strongly influenced by the higher order statistics.

Performance metrics at the 58 validation sites, a) PBIAS (%), b) RMSE (mm) and c) MAPE (%).

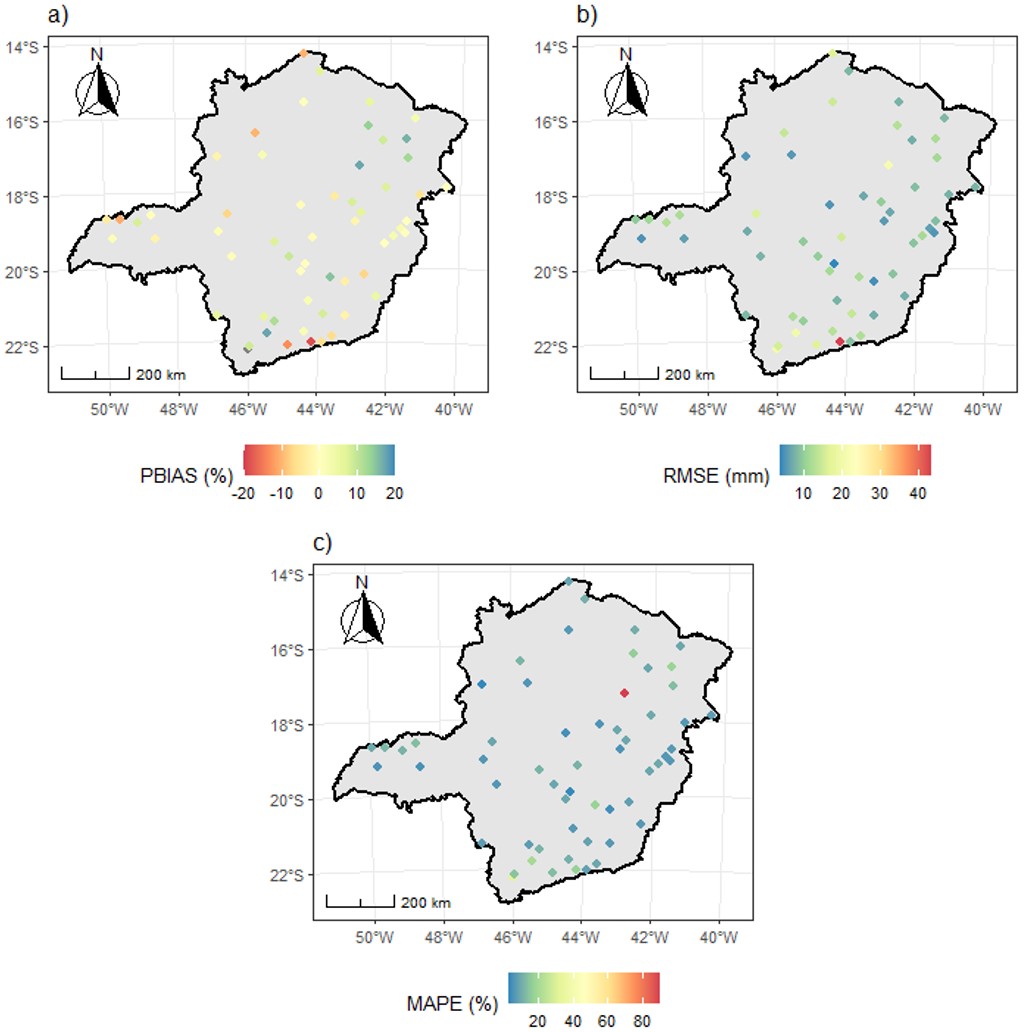
Spatial distribution of metrics at the 58 validation sites: a) PBIAS (%), b) RMSE (mm), and c) MAPE (%).
Similarly to the calibration sites, no clear spatial patterns were verified for the metrics during validation (Figure 9). This fact reinforces our conjecture that bias correction was not strongly affected by climate or topography, and the maximum rainfall fields, almost irrespective of the “roughness” of the process across space, were properly captured by the satellite retrievals. In general terms, and in view of the results in the previous step (i.e., gauged sites), bias correction is deemed effective in most of the state and statistical daily PMP estimates would thus properly reflect site-specific extreme rainfall regimes.
At last, we utilized the estimates of at each pixel defined by the satellite product for computing the sample moments and derived the daily PMP map depicted in Figure 10 by resorting to Equation (1) and (10). Statistical PMP estimates in MG vary from roughly 300mm to more than 700mm at a few pixels, with mean and median values close to 360mm. These very large values, however, do not present clear spatial patterns and at least some of them (e.g., the ones in the northern portion of state) may be physically unrealistic in view of the mechanisms for extreme rainfall formation in the state, thus requiring careful inspection before usage for design purposes. The interquartile range of PMP estimates, on the other hand, is relatively narrow, ranging from 340mm to 370mm, with only 6.7% of the pixels exceeding 400mm, which indicates a highly right-skewed empirical distribution was obtained. We note though that these rainfall amounts merely reflect our modeling assumptions and, as a result, a sound interpretation of “physical realism” and “extremeness” is not feasible due to our imperfect knowledge on the underlying process (Serinaldi & Kilsby, 2018). Hence, it would be meaningless to compare their magnitude with those reported in previous research efforts.

Statistical daily PMP estimates in the state of Minas Gerais - spatial resolution of 0.05°.
It is also possible to verify a northern-southern gradient in daily PMP estimates, which is consistent with climate conditions and long-term rainfall regimes in MG. More specifically, most of the largest estimates are observed in high-altitude areas in the south and south-central area of the state and in regions such as the Zona da Mata, in the southeastern portion of the state, in which steep topography amplifies orographic effects, leading to larger rainfall amounts on average and more extreme events. Interestingly, some of these areas contemplate mining sites with high hazards structures, such as the “Quadrilátero Ferrífero (QF)” region, which, in view of current legal requirements, could greatly benefit from more realistic PMP estimates. To a great extent, the proposed approach proved able to translate observed extreme rainfall fields into coherent spatial patterns of statistical PMP estimates, which should be useful for application in other regions of the country.
CONCLUDING REMARKS
Since its inception in the 1930s (National Academies of Sciences, Engineering, and Medicine, 2024), the PMP concept – a theoretical upper bound for rainfall amounts, for a given time scale and at a particular location –, has guided the design of high-hazard hydraulic structures over the world under a deterministic “no risk” rationale (e.g., Brasil, 2022). Paradoxically, and perhaps because systems and models are often not properly distinguished in applied research and engineering, many failures and accidents have occurred in structures in which PMP estimates were utilized as design rainfall amounts (National Academies of Sciences, Engineering, and Medicine, 2024), which highlights the incompatibility of PMP as a concept and data-dependent PMP estimates. Despite this, the latter are still required in several countries, including Brazil, which has led, in most cases, to a mechanistic approach for PMP estimation with no in-depth physical understanding of atmospheric processes or the extreme rainfall regime. More critical, however, is that the underlying assumptions for deriving PMP models, whether meteorological or statistical, have been (possibly inappropriately) relaxed for accommodating “deterministic changes”, such as those projected by climate change scenarios (e.g., Sarkar & Maity, 2020; Hiraga et al., 2025), which might amplify the confusion between the PMP concept and the correspondent PMP estimates, and misinform future risks.
In this paper, we have attempted to shed some light at the widespread statistical method proposed by Hershfield (1961, 1965), by revisiting theoretical aspects and discussing some of its limitations through an application to Brazilian daily maximum rainfall data. Particularly, we have tried to demonstrate the theoretical inconsistencies of relying on purely inductive reasoning, under a set of overly simplified modeling assumptions, for prescribing upper bounds for design rainfall amounts, as well as the severe impacts this data-dependent approach may have on the derived envelope curves.
On the basis of these arguments, before estimating the new envelope curve for the Brazilian territory, we have emphasized the actual random nature of statistical PMP estimates and the inability of the method of supporting the existence of physical upper bounds. In effect, all quantities involved in statistical PMP estimation are merely “approximations” of the populational measures (i.e., inherently associated with epistemic uncertainty) and empirical frequency factors cannot meaningfully summarize random uncertainty as the theoretical, model-dependent counterparts would. As a result, the derived envelope curves at most “bound our experience” in extreme deviations from average maximum rainfall amounts (Vogel et al., 2019), and, as such, should not be considered “risk free” as implied by the PMP concept. On the other hand, it is by no means straightforward to associate exceedance probabilities with statistical PMP estimates and compute correspondent risk – rigorously, these comprise nothing more than somewhat arbitrary large rainfall amounts, which cannot be scrutinized with respect to physical reality. In this sense, current Brazilian legislation (Brasil, 2022) is indeed misleading, as PMP estimates are incorrectly compared with the 10,000-year return levels under the “return period” rationale for defining design precipitation amounts.
That being said, we have resorted to the same modeling assumptions as in Hershfield’s original method for deriving a new envelope curve with daily precipitation data from over 3,000 gauging stations in Brazil – we restrained our analysis to gauging stations with more than 40 sample points for mitigating the effects of sampling errors in the computation of maximum frequency factors. Despite their structural similarity, however, the distinctions between models are noticeable – as a matter of fact, our conditional upper bounds for maximum frequency factors are much lower than Hershfield’s, which are often utilized by practitioners for design rainfall estimation in the country. These lower values are probably a direct result of the heavier upper tails in our variables (Merz et al., 2022), as compared to those utilized in Hershfield’s papers, and may offer a more realistic perspective for both research and design in Brazilian territory, with potential impacts on the costs of high-hazards hydraulic structures. On the other hand, one should note that the theoretical inconsistencies of the statistical method were not formally addressed, and some modeling assumptions could not be fully validated or properly scrutinized – again, no actual validation is possible here. In this sense, although we provide a well-suited tool for statistical daily PMP estimation in Brazil, under the given assumptions, the method’s limitations should be carefully taken into account for avoiding physically unjustified extrapolations (e.g., nonstationary modeling or future risk assessment under climate change).
Besides developing the new envelope curve for frequency factors, we also discussed a quantile-mapping-based approach for bias correcting annual maximum satellite retrievals, as a means of preserving the “roughness” of rainfall spatial fields when estimating statistical PMP. By using a stretched-exponential model, namely, the Generalized Gamma distribution, for this procedure, bias corrected maximum daily rainfall amounts, at the pixel scale, and, accordingly, the first two sample moments, could be reliably estimated in the entire state of Minas Gerais – in effect, only relatively small errors and systematic biases were verified in most calibration and validation sites, almost irrespective of climate and topographic gradients; to a great extent, the heavier tail of the GG model, as compared to the usual 2-parameter Gamma distribution, avoided the simulation of unreasonable large precipitation amounts during quantile mapping (see Papalexiou, 2022). This rationale allowed us to benefit from the relatively long time series of satellite retrievals – again for mitigating the effects of sampling errors in the estimation and of sample means and standard deviations –, and, at the same time, entailed a proper reproduction of the observed maximum precipitation amounts, particularly the most extremes ones. Our approach thus proved an appealing alternative for computing statistical PMP in poorly gauged areas and could be easily extended for providing statistical PMP estimates across the entire Brazilian territory. This should be addressed in future work.
To sum up, we hope this paper to have provided a clearer understanding of PMP as a concept and as design rainfall estimates – which we believe is paramount for avoiding misinterpretations in view of current Brazilian legislation. From a practical perspective, the proposed approach comprises a straightforward estimation tool under the “unique design guideline” perspective, which, despite the outlined limitations, provides a transparent, objective and more realistic framework for engineering purposes. As a final remark, however, we argue that, given the simplified data-dependent approach proposed in Hershfield’s papers, “deterministic” statistical PMP estimates alone are unable to inform decision-making, and a full-fledge probabilistic framework should always be considered for properly communicating risk to stakeholders. The stochastic nature of PMP estimates should, by no means, be neglected.
DATA AVAILABILITY STATEMENT
Research data is only available upon request.
ACKNOWLEDGEMENTS
This manuscript is a joint effort from researchers of the Technical Committee of Statistical Hydrology from the Brazilian Association of Water Resources (ABRHidro) and the research group Hydrology and Statistics Applied to the Modeling of Water Resources Systems (hydro_stat) in their ongoing work for strengthening the interactions among scholars and the technical community for improving water resources management in Brazil. The authors would like to acknowledge the support and scientific contributions of all members of these organizations. The authors also acknowledge the support by Conselho Nacional de Desenvolvimento Científico e Tecnológico (CNPq), Coordenação de Aperfeiçoamento de Pessoal de Nível Superior (CAPES), and Fundação de Amparo à Pesquisa do Estado de Minas Gerais (FAPEMIG). The authors also wish to acknowledge the anonymous reviewers and editors for the valuable comments and suggestions, which greatly helped improving the paper.
REFERENCES
-
Adhikari, A., & Behrangi, A. (2022). Assessment of satellite precipitation products in relation with orographic enhancement over the western United States. Earth and Space Science, 9(2), e2021EA001906. https://doi.org/10.1029/2021EA001906
» https://doi.org/10.1029/2021EA001906 -
Alias, N. E., Luo, P., & Takara, K. (2013). Probable maximum precipitation using statistical method for the Yodo river basin. Journal of Japan Society of Civil Engineers, 69(4), 157-162. https://doi.org/10.2208/jscejhe.69.I_157
» https://doi.org/10.2208/jscejhe.69.I_157 -
An, Y., Zhao, W., Li, C., & Liu, Y. (2020). Evaluation of six satellite and reanalysis precipitation products using gauge observations over the Yellow River Basin, China. Atmosphere, 11(11), 1223. https://doi.org/10.3390/atmos11111223
» https://doi.org/10.3390/atmos11111223 -
Agência Nacional de Águas e Saneamento Básico – ANA. (2025). HidroWeb: sistema de informações hidrológicas Retrieved in 2026, March 10, from http://www.snirh.gov.br/hidroweb/publico/apresentacao.jsf
» http://www.snirh.gov.br/hidroweb/publico/apresentacao.jsf - Brasil. Agência Nacional de Mineração – ANM. (2022). Resolução ANM no 95, de 07 de fevereiro de 2022. Consolida os atos normativos que dispõem sobre segurança de barragens de mineração. Diário Oficial [da] República Federativa do Brasil, Brasília, seção 1.
-
Agência Nacional de Mineração – ANM. (2025, Janeiro 31). Sistema Integrado de Gestão de Barragens de Mineração Retrieved in 2026, March 10, from https://app.anm.gov.br/sigbm/publico
» https://app.anm.gov.br/sigbm/publico -
Asquith, W. H. (2025). lmomco: L-moments, censored L-moments, trimmed L-moments, L-comoments, and many distributions (Versão 2.5.3) [R package version 2.5.3]. https://doi.org/10.32614/CRAN.package.lmomco
» https://doi.org/10.32614/CRAN.package.lmomco - Barbosa, A. G., Silva, A. F. R., & Costa, V. A. F. (2023, 19-24 Novembro). Estimativa espacial da precipitação máxima provável com duração de 24 horas para o território brasileiro. In Anais do XXV Simpósio Brasileiro de Recursos Hídricos, Sergipe. Porto Alegre: ABRHidro.
-
Barbosa, A. G., Souza Neto, I. R. D., Costa, V. A. F., & Mendes, L. A. (2022). Assessing intensity-duration-frequency equations and spatialization techniques across the Grande River Basin in the state of Bahia, Brazil. RBRH, 27, e43. https://doi.org/10.1590/2318-0331.272220220083
» https://doi.org/10.1590/2318-0331.272220220083 - Braga, B., Tundisi, J. G., Tundisi, T. M., & Ciminelli, V. S. T. (2015). Águas Doces no Brasil: Capital Ecológico, uso e conservação (4. ed.). São Paulo: Escrituras Editora.
-
Buch, A. C., Sims, D. B., De Ramos, L. M., Marques, E. D., Ritcher, S., Abdullah, M. M. S., & Silva-Filho, E. V. (2024). Assessment of environmental pollution and human health risks of mine tailings in soil: After dam failure of the Córrego do Feijão Mine (in Brumadinho, Brazil). Environmental Geochemistry and Health, 46(3), 72. https://doi.org/10.1007/s10653-024-01870-2
» https://doi.org/10.1007/s10653-024-01870-2 -
Camera, C., Bruggeman, A., Hadjinicolaou, P., Pashiardis, S., & Lange, M. A. (2014). Evaluation of interpolation techniques for the creation of gridded daily precipitation (1×1 km2); Cyprus, 1980–2010. Journal of Geophysical Research, D, Atmospheres, 119(2), 693-712. https://doi.org/10.1002/2013JD020611
» https://doi.org/10.1002/2013JD020611 -
Carmo, F. F. D., Kamino, L. H. Y., Junior, R. T., Campos, I. C. D., Carmo, F. F. D., Silvino, G., Castro, K. J. D. S. X. D., Mauro, M. L., Rodrigues, N. U. A., Miranda, M. P. D. S., & Pinto, C. E. F. (2017). Fundão tailings dam failures: the environment tragedy of the largest technological disaster of Brazilian mining in global context. Perspectives in Ecology and Conservation, 15(3), 145-151. https://doi.org/10.1016/j.pecon.2017.06.002
» https://doi.org/10.1016/j.pecon.2017.06.002 -
Castellarin, A. (2007). Probabilistic envelope curves for design flood estimation at ungauged sites. Water Resources Research, 43(4), 2005WR004384. https://doi.org/10.1029/2005WR004384
» https://doi.org/10.1029/2005WR004384 -
Castellarin, A., Merz, R., & Blöschl, G. (2009). Probabilistic envelope curves for extreme rainfall events. Journal of Hydrology (Amsterdam), 378(3-4), 263-271. https://doi.org/10.1016/j.jhydrol.2009.09.030
» https://doi.org/10.1016/j.jhydrol.2009.09.030 -
Chavan, S. R., & Srinivas, V. V. (2017). Regionalization based envelope curves for PMP estimation by Hershfield method. International Journal of Climatology, 37(10), 3767-3779. https://doi.org/10.1002/joc.4951
» https://doi.org/10.1002/joc.4951 -
Chow, V. T. (1951). A general formula for hydrologic frequency analysis. Transactions - American Geophysical Union, 32(2), 231-237. https://doi.org/10.1029/TR032i002p00231
» https://doi.org/10.1029/TR032i002p00231 -
Costa, V., & Fernandes, W. (2017). Bayesian estimation of extreme flood quantiles using a rainfall-runoff model and a stochastic daily rainfall generator. Journal of Hydrology, 554, 137-154. https://doi.org/10.1016/j.jhydrol.2017.09.003
» https://doi.org/10.1016/j.jhydrol.2017.09.003 -
Costa, V., Fernandes, W., & Naghettini, M. (2015). A Bayesian model for stochastic generation of daily precipitation using an upper-bounded distribution function. Stochastic Environmental Research and Risk Assessment, 29(2), 563-576. https://doi.org/10.1007/s00477-014-0880-9
» https://doi.org/10.1007/s00477-014-0880-9 -
Dalagnol, R., Gramcianinov, C. B., Crespo, N. M., Luiz, R., Chiquetto, J. B., Marques, M. T. A., Neto, G. D., de Abreu, R. C., Li, S., Lott, F. C., Anderson, L. O., & Sparrow, S. (2022). Extreme rainfall and its impacts in the Brazilian Minas Gerais state in January 2020: can we blame climate change? Climate Resilience and Sustainability, 1(1), e15. https://doi.org/10.1002/cli2.15
» https://doi.org/10.1002/cli2.15 -
Dao, V., Arellano, C. J., Nguyen, P., Almutlaq, F., Hsu, K., & Sorooshian, S. (2025). Bias correction of satellite precipitation estimation using deep neural networks and topographic information over the western U.S. Journal of Geophysical Research. Atmospheres, 130(4), e2024JD042181. https://doi.org/10.1029/2024JD042181
» https://doi.org/10.1029/2024JD042181 -
Desa, M. N. M., Noriah, A. B., & Rakhecha, P. R. (2001). Probable maximum precipitation for 24 h duration over southeast Asian monsoon region: Selangor, Malaysia. Atmospheric Research, 58(1), 41-54. https://doi.org/10.1016/S0169-8095(01)00070-9
» https://doi.org/10.1016/S0169-8095(01)00070-9 -
Dhanesh, Y., Bindhu, V. M., Senent-Aparicio, J., Brighenti, T. M., Ayana, E., Smitha, P. S., Fei, C., & Srinivasan, R. (2020). A Comparative Evaluation of the Performance of CHIRPS and CFSR Data for Different Climate Zones Using the SWAT Model. Remote Sensing (Basel), 12(18), 3088. https://doi.org/10.3390/rs12183088
» https://doi.org/10.3390/rs12183088 - Dingman, S. L. (2015). Physical hydrology (3rd ed.). Long Grove, Illinois: Waveland Press.
-
Duarte, L. V., Barbosa, A. D. G., Moura, P. M., & Costa, V. (2025). A Bayesian approach to model IDF curves employing max-stable processes. Hydrological Sciences Journal, 70(16), 2934-2952. https://doi.org/10.1080/02626667.2025.2579874
» https://doi.org/10.1080/02626667.2025.2579874 -
Duarte, L. V., Formiga, K. T. M., & Costa, V. A. F. (2022). Analysis of the IMERG-GPM precipitation product analysis in Brazilian midwestern basins considering different time and spatial scales. Water, 14(16), 2472. https://doi.org/10.3390/w14162472
» https://doi.org/10.3390/w14162472 -
Enzel, Y., Ely, L. L., House, P. K., Baker, V. R., & Webb, R. H. (1993). Paleoflood evidence for a natural upper bound to flood magnitudes in the Colorado River Basin. Water Resources Research, 29(7), 2287-2297. https://doi.org/10.1029/93WR00411
» https://doi.org/10.1029/93WR00411 -
Fernandes, W., Naghettini, M., & Loschi, R. (2010). A Bayesian approach for estimating extreme flood probabilities with upper-bounded distribution functions. Stochastic Environmental Research and Risk Assessment, 24(8), 1127-1143. https://doi.org/10.1007/s00477-010-0365-4
» https://doi.org/10.1007/s00477-010-0365-4 -
Gomes, D. J. C., Beltrão, N. E. S., Pereira, F. M., Reis, A. C. M., Pinheiro, A. M. P., & Silva, D. F. (2022). Estimativa de precipitação dos dados CHIRPS e GPCC em anos de extremos climáticos, Bacia Hidrográfica do rio Guamá-PA. Revista Brasileira de Geografia Física, 15(3), 1583-1598. https://doi.org/10.26848/rbgf.v15.3.p1583-1598
» https://doi.org/10.26848/rbgf.v15.3.p1583-1598 -
Heo, J.-H., Ahn, H., Shin, J.-Y., Kjeldsen, T. R., & Jeong, C. (2019). Probability distributions for a quantile mapping technique for a bias correction of precipitation data: a case study to precipitation data under climate change. Water, 11(7), 1475. https://doi.org/10.3390/w11071475
» https://doi.org/10.3390/w11071475 -
Hershfield, D. M. (1961). Estimating the probable maximum precipitation. Journal of the Hydraulics Division, 87(5), 99-116. https://doi.org/10.1061/JYCEAJ.0000651
» https://doi.org/10.1061/JYCEAJ.0000651 -
Hershfield, D. M. (1965). Method for estimating probable maximum rainfall. Journal - American Water Works Association, 57(8), 965-972. https://doi.org/10.1002/j.1551-8833.1965.tb01486.x
» https://doi.org/10.1002/j.1551-8833.1965.tb01486.x -
Hiraga, Y., Tahara, R., & Meza, J. (2025). A methodology to estimate Probable Maximum Precipitation (PMP) under climate change using a numerical weather model. Journal of Hydrology, 652, 132659. https://doi.org/10.1016/j.jhydrol.2024.132659
» https://doi.org/10.1016/j.jhydrol.2024.132659 -
Hoskin, J. R. M. (2024). L-Moments (Versão 3.2) [R package version 3.2]. https://doi.org/10.32614/CRAN.package.lmom
» https://doi.org/10.32614/CRAN.package.lmom -
Hosking, J. R. M., & Wallis, J. R. (1997). Regional frequency analysis: An approach based on L-moments Cambridge: Cambridge University Press. https://doi.org/10.1017/CBO9780511529443
» https://doi.org/10.1017/CBO9780511529443 -
Instituto Brasileiro de Geografia e Estatística – IBGE. (2024). Panorama do Censo 2022 Retrieved in 2026, March 10, from https://censo2022.ibge.gov.br/panorama/
» https://censo2022.ibge.gov.br/panorama/ -
Jacoby, Y., Grodek, T., Enzel, Y., Porat, N., McDonald, E. V., & Dahan, O. (2008). Late Holocene upper bounds of flood magnitudes and twentieth century large floods in the ungauged, hyperarid alluvial Nahal Arava, Israel. Geomorphology, 95(3-4), 274-294. https://doi.org/10.1016/j.geomorph.2007.06.008
» https://doi.org/10.1016/j.geomorph.2007.06.008 -
Katiraie-Boroujerdy, P.-S., Rahnamay Naeini, M., Akbari Asanjan, A., Chavoshian, A., Hsu, K., & Sorooshian, S. (2020). Bias correction of satellite-based precipitation estimations using quantile mapping approach in different climate regions of Iran. Remote Sensing, 12(13), 2102. https://doi.org/10.3390/rs12132102
» https://doi.org/10.3390/rs12132102 -
Koutsoyiannis, D. (1999). A probabilistic view of hershfield’s method for estimating probable maximum precipitation. Water Resources Research, 35(4), 1313-1322. https://doi.org/10.1029/1999WR900002
» https://doi.org/10.1029/1999WR900002 -
Koutsoyiannis, D. (2024). Stochastics of hydroclimatic extremes: A cool look at risk (4th ed.). Athens: Kallipos Open Academic Editions. https://doi.org/10.57713/KALLIPOS-1
» https://doi.org/10.57713/KALLIPOS-1 -
Lima, C. H. R., Kwon, H.-H., & Kim, Y.-T. (2018). A local-regional scaling-invariant Bayesian GEV model for estimating rainfall IDF curves in a future climate. Journal of Hydrology, 566, 73-88. https://doi.org/10.1016/j.jhydrol.2018.08.075
» https://doi.org/10.1016/j.jhydrol.2018.08.075 -
Ma, Y., Sun, X., Chen, H., Hong, Y., & Zhang, Y. (2021). A two-stage blending approach for merging multiple satellite precipitation estimates and rain gauge observations: an experiment in the northeastern Tibetan Plateau. Hydrology and Earth System Sciences, 25(1), 359-374. https://doi.org/10.5194/hess-25-359-2021
» https://doi.org/10.5194/hess-25-359-2021 -
Maggioni, V., Sapiano, M. R. P., & Adler, R. F. (2016). Estimating uncertainties in high-resolution satellite precipitation products: systematic or random error? Journal of Hydrometeorology, 17(4), 1119-1129. https://doi.org/10.1175/JHM-D-15-0094.1
» https://doi.org/10.1175/JHM-D-15-0094.1 -
Maggioni, V., Sapiano, M. R. P., Adler, R. F., Tian, Y., & Huffman, G. J. (2014). An error model for uncertainty quantification in high-time-resolution precipitation products. Journal of Hydrometeorology, 15(3), 1274-1292. https://doi.org/10.1175/JHM-D-13-0112.1
» https://doi.org/10.1175/JHM-D-13-0112.1 -
Marra, F., Amponsah, W., & Papalexiou, S. M. (2023). Non-asymptotic Weibull tails explain the statistics of extreme daily precipitation. Advances in Water Resources, 173, 104388. https://doi.org/10.1016/j.advwatres.2023.104388
» https://doi.org/10.1016/j.advwatres.2023.104388 -
Martin, A., Fournier, É., & Jalbert, J. (2025). Statistical estimation of probable maximum precipitation. Hydrology and Earth System Sciences, 29(19), 4811-4824. https://doi.org/10.5194/hess-29-4811-2025
» https://doi.org/10.5194/hess-29-4811-2025 -
Masood, M., Naveed, M., Iqbal, M., Nabi, G., Kashif, H. M., Jawad, M., & Mujtaba, A. (2023). Evaluation of satellite precipitation products for estimation of floods in data-scarce environment. Advances in Meteorology, 2023, 1-17. https://doi.org/10.1155/2023/1685720
» https://doi.org/10.1155/2023/1685720 -
Merz, B., Basso, S., Fischer, S., Lun, D., Blöschl, G., Merz, R., Guse, B., Viglione, A., Vorogushyn, S., Macdonald, E., Wietzke, L., & Schumann, A. (2022). Understanding heavy tails of flood peak distributions. Water Resources Research, 58(6), e2021WR030506. https://doi.org/10.1029/2021WR030506
» https://doi.org/10.1029/2021WR030506 -
Naghettini, M. (2017). Fundamentals of statistical hydrology Cham: Springer International Publishing. https://doi.org/10.1007/978-3-319-43561-9
» https://doi.org/10.1007/978-3-319-43561-9 -
National Academies of Sciences, Engineering, and Medicine – NASEM. (2024). Modernizing probable maximum precipitation estimation (pp. 27460). Washington: The National Academies Press. https://doi.org/10.17226/27460
» https://doi.org/10.17226/27460 -
Nunes, A. D. A., Pinto, E. J. D. A., & Baptista, M. B. (2018). Detection of trends for extreme events of precipitation in the Metropolitan Region of Belo Horizonte through statistical methods. RBRH, 23(e9), https://doi.org/10.1590/2318-0331.0318170134
» https://doi.org/10.1590/2318-0331.0318170134 -
Open Topography. (2024). OpenTopography API Retrieved in 2026, March 10, from https://portal.opentopography.org/apidocs/#/Public/getGlobalDem
» https://portal.opentopography.org/apidocs/#/Public/getGlobalDem -
Papalexiou, S. M. (2022). Rainfall generation revisited: introducing CoSMoS‐2s and advancing copula‐based intermittent time series modeling. Water Resources Research, 58(6), e2021WR031641. https://doi.org/10.1029/2021WR031641
» https://doi.org/10.1029/2021WR031641 -
Papalexiou, S. M., & Koutsoyiannis, D. (2006). A probabilistic approach to the concept of Probable Maximum Precipitation. Advances in Geosciences, 7, 51-54. https://doi.org/10.5194/adgeo-7-51-2006
» https://doi.org/10.5194/adgeo-7-51-2006 -
Papalexiou, S. M., & Koutsoyiannis, D. (2013). Battle of extreme value distributions: A global survey on extreme daily rainfall: survey on extreme daily rainfall. Water Resources Research, 49(1), 187-201. https://doi.org/10.1029/2012WR012557
» https://doi.org/10.1029/2012WR012557 -
Papalexiou, S. M., & Koutsoyiannis, D. (2016). A global survey on the seasonal variation of the marginal distribution of daily precipitation. Advances in Water Resources, 94, 131-145. https://doi.org/10.1016/j.advwatres.2016.05.005
» https://doi.org/10.1016/j.advwatres.2016.05.005 -
Peel, M. C., Finlayson, B. L., & McMahon, T. A. (2007). Updated world map of the Köppen-Geiger climate classification. Hydrology and Earth System Sciences, 11(5), 1633-1644. https://doi.org/10.5194/hess-11-1633-2007
» https://doi.org/10.5194/hess-11-1633-2007 -
Rajulapati, C. R., & Papalexiou, S. M. (2023). Precipitation bias correction: a novel semi‐parametric quantile mapping method. Earth and Space Science, 10(4), e2023EA002823. https://doi.org/10.1029/2023EA002823
» https://doi.org/10.1029/2023EA002823 -
Reboita, M. S., Rodrigues, M., Silva, L. F., & Alves, M. A. (2015). Climate aspects in Minas Gerais state. Revista Brasileira de Climatologia, 17, https://doi.org/10.5380/abclima.v17i0.41493
» https://doi.org/10.5380/abclima.v17i0.41493 -
Renard, B. (2011). A Bayesian hierarchical approach to regional frequency analysis. Water Resources Research, 47(11), 2010WR010089. https://doi.org/10.1029/2010WR010089
» https://doi.org/10.1029/2010WR010089 -
Salas, J. D., Anderson, M. L., Papalexiou, S. M., & Frances, F. (2020). PMP and climate variability and change: a review. Journal of Hydrologic Engineering, 25(12), 03120002. https://doi.org/10.1061/(ASCE)HE.1943-5584.0002003
» https://doi.org/10.1061/(ASCE)HE.1943-5584.0002003 -
Sampaio, J., & Costa, V. (2021). Bayesian regional flood frequency analysis with GEV hierarchical models under spatial dependency structures. Hydrological Sciences Journal, 66(3), 422-433. https://doi.org/10.1080/02626667.2021.1873997
» https://doi.org/10.1080/02626667.2021.1873997 -
Sarkar, S., & Maity, R. (2020). Estimation of Probable Maximum Precipitation in the context of climate change. MethodsX, 7, 100904. https://doi.org/10.1016/j.mex.2020.100904
» https://doi.org/10.1016/j.mex.2020.100904 -
Serinaldi, F., & Kilsby, C. G. (2018). Unsurprising surprises: the frequency of record‐breaking and overthreshold hydrological extremes under spatial and temporal dependence. Water Resources Research, 54(9), 6460-6487. https://doi.org/10.1029/2018WR023055
» https://doi.org/10.1029/2018WR023055 -
Serinaldi, F., Kilsby, C. G., & Lombardo, F. (2018). Untenable nonstationarity: an assessment of the fitness for purpose of trend tests in hydrology. Advances in Water Resources, 111, 132-155. https://doi.org/10.1016/j.advwatres.2017.10.015
» https://doi.org/10.1016/j.advwatres.2017.10.015 -
Serrat-Capdevila, A., Merino, M., Valdes, J., & Durcik, M. (2016). Evaluation of the performance of three satellite precipitation products over Africa. Remote Sensing, 8(10), 836. https://doi.org/10.3390/rs8100836
» https://doi.org/10.3390/rs8100836 -
Silva, E. D. (2014). Estudo da precipitação no estado de Minas Gerais: MG. Revista Brasileira de Climatologia, 13, https://doi.org/10.5380/abclima.v13i0.33345
» https://doi.org/10.5380/abclima.v13i0.33345 -
Vogel, R. M., Castellarin, A., Matalas, N. C., England Junior, J. F., & Zafirakou, A. (2019). Hydrologic Record Events. In R. S. V. Teegavarapu, J. D. Salas, & J. R. Stedinger (Eds.), Statistical analysis of hydrologic variables: methods and applications Reston: American Society of Civil Engineers. https://doi.org/10.1061/9780784415177.ch12
» https://doi.org/10.1061/9780784415177.ch12 -
Vogel, R. M., Papalexiou, S. M., Lamontagne, J. R., & Dolan, F. C. (2025). When heavy tails disrupt statistical inference. The American Statistician, 79(2), 221-235. https://doi.org/10.1080/00031305.2024.2402898
» https://doi.org/10.1080/00031305.2024.2402898 - World Meteorological Organization – WMO. (2009). Manual on estimation of probable maximum precipitation (PMP) (3rd ed.). Geneva: World Meteorological Organization.
-
Xavier, A. C., Scanlon, B. R., King, C. W., & Alves, A. I. (2022). New improved Brazilian daily weather gridded data (1961–2020). International Journal of Climatology, 42(16), 8390-8404. https://doi.org/10.1002/joc.7731
» https://doi.org/10.1002/joc.7731 -
Xiao, S., Zou, L., Xia, J., Yang, Z., & Yao, T. (2022). Bias correction framework for satellite precipitation products using a rain/no rain discriminative model. The Science of the Total Environment, 818, 151679. https://doi.org/10.1016/j.scitotenv.2021.151679
» https://doi.org/10.1016/j.scitotenv.2021.151679 -
Zhang, Q., Gan, Y., Zhang, L., She, D., Wang, G., & Wang, S. (2022). Piecewise‐quantile mapping improves bias correction of global climate model daily precipitation towards preserving quantiles and extremes. International Journal of Climatology, 42(15), 7968-7986. https://doi.org/10.1002/joc.7687
» https://doi.org/10.1002/joc.7687 -
Zhu, L., Kang, W., Li, W., Luo, J.-J., & Zhu, Y. (2022). The optimal bias correction for daily extreme precipitation indices over the Yangtze-Huaihe River Basin, insight from BCC-CSM1.1-m. Atmospheric Research, 271, 106101. https://doi.org/10.1016/j.atmosres.2022.106101
» https://doi.org/10.1016/j.atmosres.2022.106101 -
Zorzetto, E., Canale, A., & Marani, M. (2024). A Bayesian non-asymptotic extreme value model for daily rainfall data. Journal of Hydrology (Amsterdam), 628, 130378. https://doi.org/10.1016/j.jhydrol.2023.130378
» https://doi.org/10.1016/j.jhydrol.2023.130378
Edited by
-
Editor-in-Chief:
Iran E. Lima Neto
-
Associated Editor:
Adilson Pinheiro


 Sources: a)