 Influence of the spatial distribution of rain gauges on SWAT model calibration in two coastal river basins in Paraná State, Brazil
ABSTRACT
The availability and treatment of rainfall data and its impact on SWAT calibration were evaluated in two watersheds on the coast of Paraná: Nhundiaquara and Guaraguaçu. The tested scenarios combined internal and external stations and also tested harmonization using a double mass curve. Performance was quantified at daily and monthly scales. In the Nhundiaquara (1975–1983), increasing the number of internal stations improved performance. For 1997–2005, the inclusion of an external station without harmonization introduced bias and degraded the model fit; the double mass curve removed the multiplicative bias and recovered performance. In the Guaraguaçu (2008–2009), the inclusion of a neighboring station yielded modest gains; correction was neutral or slightly negative, suggesting prior compatibility between the data series over the short timeframe. It is concluded that expanding the internal network and harmonizing external data series reduces biases and stabilizes calibration, especially in environments with strong orographic control, and that the monthly scale is more robust for evaluation.
Keywords:
Hydrological modeling; SWAT; Double mass curve; Paraná coast; Rainfall data
RESUMO
Avaliou-se a disponibilidade e o tratamento de dados pluviométricos e seu impacto na calibração do SWAT em duas bacias do litoral do Paraná: Nhundiaquara e Guaraguaçu. Os cenários considerados combinaram estações internas e externas e também testaram a harmonização por curva dupla acumulada. O desempenho foi quantificado nas escalas diária e mensal. No Nhundiaquara (1975–1983), o aumento de estações internas elevou o desempenho. Para 1997–2005, a inclusão de uma estação externa sem harmonização introduziu viés e degradou o ajuste; a curva dupla acumulada removeu o viés multiplicativo e recuperou o desempenho. No Guaraguaçu (2008–2009), a inclusão de uma estação vizinha gerou ganhos modestos; a correção foi neutra ou levemente negativa, sugerindo compatibilidade prévia entre séries no horizonte curto. Conclui-se que ampliar a rede interna e harmonizar séries externas reduz vieses e estabiliza a calibração, sobretudo em ambientes com forte controle orográfico, e que a escala mensal é mais robusta para avaliação.
Palavras-chave:
Modelagem hidrológica; SWAT; Curva dupla acumulada; Litoral do Paraná; Dados pluviométricos
INTRODUCTION
Precipitation, marked by strong heterogeneity and significant spatiotemporal variability, constitutes a major challenge for hydrological modeling (Miao et al., 2015; Sirisena et al., 2018). The quality and reliability of precipitation data directly influence the simulation of hydrological-cycle processes, water-resources management, and event forecasting (Liu et al., 2017; Tan et al., 2017; Yang et al., 2022). In regions with sparse rain-gauge networks, interpolation methods tend to smooth local contrasts and may not adequately capture variability in small basins (Falck et al., 2015; Jiang et al., 2020). Furthermore, many approaches do not explicitly account for the role of topography in rainfall spatial distribution, a particularly relevant factor in mountainous environments (Basist et al., 1994; Um et al., 2011; Jiang et al., 2024).
Studies in basins with complex relief show that traditional methods for rainfall representation, such as Thiessen polygons or nearest-station assignment, have limited performance and depend strongly on rain-gauge density and placement; networks concentrated in valleys or low-elevation areas tend to increase uncertainty in precipitation estimates (Buytaert et al., 2006). In the SWAT model, for example, precipitation for each sub-basin is assigned to the rain gauge nearest to its centroid, which simplifies spatial heterogeneity and may introduce bias when rainfall gradients vary over short distances (Szcześniak & Piniewski, 2015). SWAT also allows the use of adjustable parameters to improve the representation of climatic gradients associated with altitude, which may reduce uncertainty in mountainous basins when orographic effects are significant (Li et al., 2016). However, the effectiveness of such adjustments still depends on the representativeness and consistency of the available rainfall observations (Sampaio Júnior et al., 2025).
Given this, model reliability depends on consistent historical precipitation and streamflow series; however, measurement failures, instrument changes, and station relocation may create gaps and discontinuities (Brubacher et al., 2020). Before being used in hydrological modeling, rainfall series should be checked for homogeneity and consistency and, when necessary, corrected or supplemented with alternative data sources (Bárdossy & Pegram, 2014; Depiné et al., 2014). One practical alternative in basins with limited internal rain gauges is the double mass curve (DMC) method (Taveira, 2016). In this approach, cumulative precipitation from one station is compared with that of another station (including a nearby station outside the basin of interest) to assess the similarity and consistency of their rainfall regimes (Kobiyama et al., 2011). When cumulative values align approximately along a straight line, the stations may be considered compatible, allowing the use of a proportional correction factor to harmonize the external series for hydrological modeling. However, DMC assumes that the relationship between the cumulative series remains approximately linear and stationary over time. Changes in slope may reflect instrument changes, relocation, or physical alterations in rainfall controls and should therefore be interpreted with caution (Searcy & Hardison, 1960; World Meteorological Organization, 2011). In addition, the method may be inadequate when stations present strong elevation contrasts or distinct seasonal rainfall regimes, since these conditions violate the proportionality assumption between the series.
In coastal systems, hydrological modeling becomes even more complex. Coastal plains usually have low slopes, increasing sensitivity to small gradient variations, whereas nearby mountainous regions may intensify orographic rainfall and reinforce precipitation variability, making the association between rainfall peaks and hydrological response more difficult (Paula, 2016). The scarcity of rainfall and streamflow gauges in these regions further aggravates model calibration and performance assessment. In this context, the use of rainfall stations from neighboring basins may be beneficial, provided that inter-station compatibility is demonstrated and potential biases are properly addressed.
Some distributed and semi-distributed models offer alternatives to partially mitigate data scarcity, such as the Soil and Water Assessment Tool (SWAT), which is widely used to simulate streamflow and pollutant loads. In SWAT, precipitation is assigned to each sub-basin based on the station closest to its centroid. Particularly in tropical climates, recurrent errors in peak-flow simulation have been associated with limitations in representing the spatiotemporal variability of daily precipitation (Pereira et al., 2016). In the Nhundiaquara Basin, previous SWAT-based applications have investigated hydrossedimentological processes and assessed climate-change impacts on streamflow and sediment transport, providing local context for model setup and expected model behavior in this coastal-mountain environment (Taveira, 2016; Taveira & Santos, 2019).
Based on this context, the hypothesis of this study is that rainfall stations located outside the target watershed can improve SWAT model performance when they increase the spatial representativeness of precipitation forcing and when systematic inter-station bias is previously harmonized using the double mass curve. Therefore, the objective of this study is to apply hydrological modeling to the Guaraguaçu and Nhundiaquara river basins, on the coast of Paraná State, Brazil, and to evaluate different rainfall-forcing configurations. Scenarios combining stations inside and outside the basins were tested, with and without correction factors derived from the double mass curve, in order to quantify their effects on model performance and on the spatiotemporal representativeness of precipitation under different periods of station availability.
STUDY AREA
The study area comprises two coastal basins located on the coast of Paraná State, Brazil — the Guaraguaçu River Basin and the Nhundiaquara River Basin — shown in Figure 1. These basins were selected because they represent contrasting coastal hydrological settings under the orographic influence of the Serra do Mar mountain range, with marked differences in drainage area, topographic gradients, and expected rainfall spatial variability. This regional setting is characterized by abrupt altimetric transitions and strong rainfall enhancement near the Serra do Mar, which are relevant for evaluating precipitation representativeness in SWAT forcing (Paula, 2016; Amorim et al., 2020). The basins are also socio-environmentally relevant due to their role in water supply, the presence of protected areas and indigenous lands, and the occurrence of flood- and landslide-prone zones in the coastal-mountain transition (Elste, 2021; Amorim et al., 2020). These differences make the pair suitable for assessing how rain-gauge distribution affects hydrological model calibration under distinct coastal and orographic conditions.

The Guaraguaçu River Basin covers approximately 441 km2 and is part of the Coastal Hydrographic Region. It spans the municipalities of Matinhos, Paranaguá, and Pontal do Paraná, playing a key role in supplying water to Matinhos and Pontal do Paraná. Within its area of influence are the Saint-Hilaire/Lange National Park, the Guaratuba Environmental Protection Area (APA), the Guaraguaçu Ecological Station, and two Indigenous Lands (Sambaqui and Ilha da Cotinga). The territory includes a mosaic of swamp forests (caixetais), marshes, and floodplains, which are important for biodiversity and water regulation. The sub-basin analyzed in this study contains the ETA–Matinhos Cambará streamflow gauge (−25.7274; −48.5916), with a drainage area of approximately 13 km2 (Figure 2).

Digital Elevation Model (DEM) of the Nhundiaquara and Guaraguaçu River Basins. Source: ALOS PALSAR (ALOS-1/JAXA–JAROS), terrain-corrected DEM, 12.5 m spatial resolution.
The Nhundiaquara River Basin also belongs to the Coastal Hydrographic Region and contributes to the drainage of the Antonina and Paranaguá Bays. Although the total basin area is approximately 520 km2, only the upstream portion above the Morretes gauging station (−25.47694; −48.829) was considered in this study, corresponding to a drainage area of about 141 km2 (Figure 6). The orographic configuration of the Serra do Mar favors high rainfall rates, especially during summer, making the region — including the municipality of Morretes and nearby mountainous areas such as Quatro Barras and Piraquara — highly susceptible to extreme weather events, with records of landslides and floods (Amorim et al., 2020).

The Digital Elevation Model (DEM) used in this study was derived from the ALOS PALSAR (ALOS-1/JAXA–JAROS) sensor, an InSAR system with a spatial resolution of 10–100 meters and an average incidence angle of 34.3°. The dataset was made available as a resampled version of the SRTM at 12.5 m resolution, with terrain corrections applied. The DEM highlights the Serra do Mar mountain range within both the Guaraguaçu and Nhundiaquara river basins, showing abrupt altimetric variations and maximum elevations exceeding 1,000 m (Figure 2).
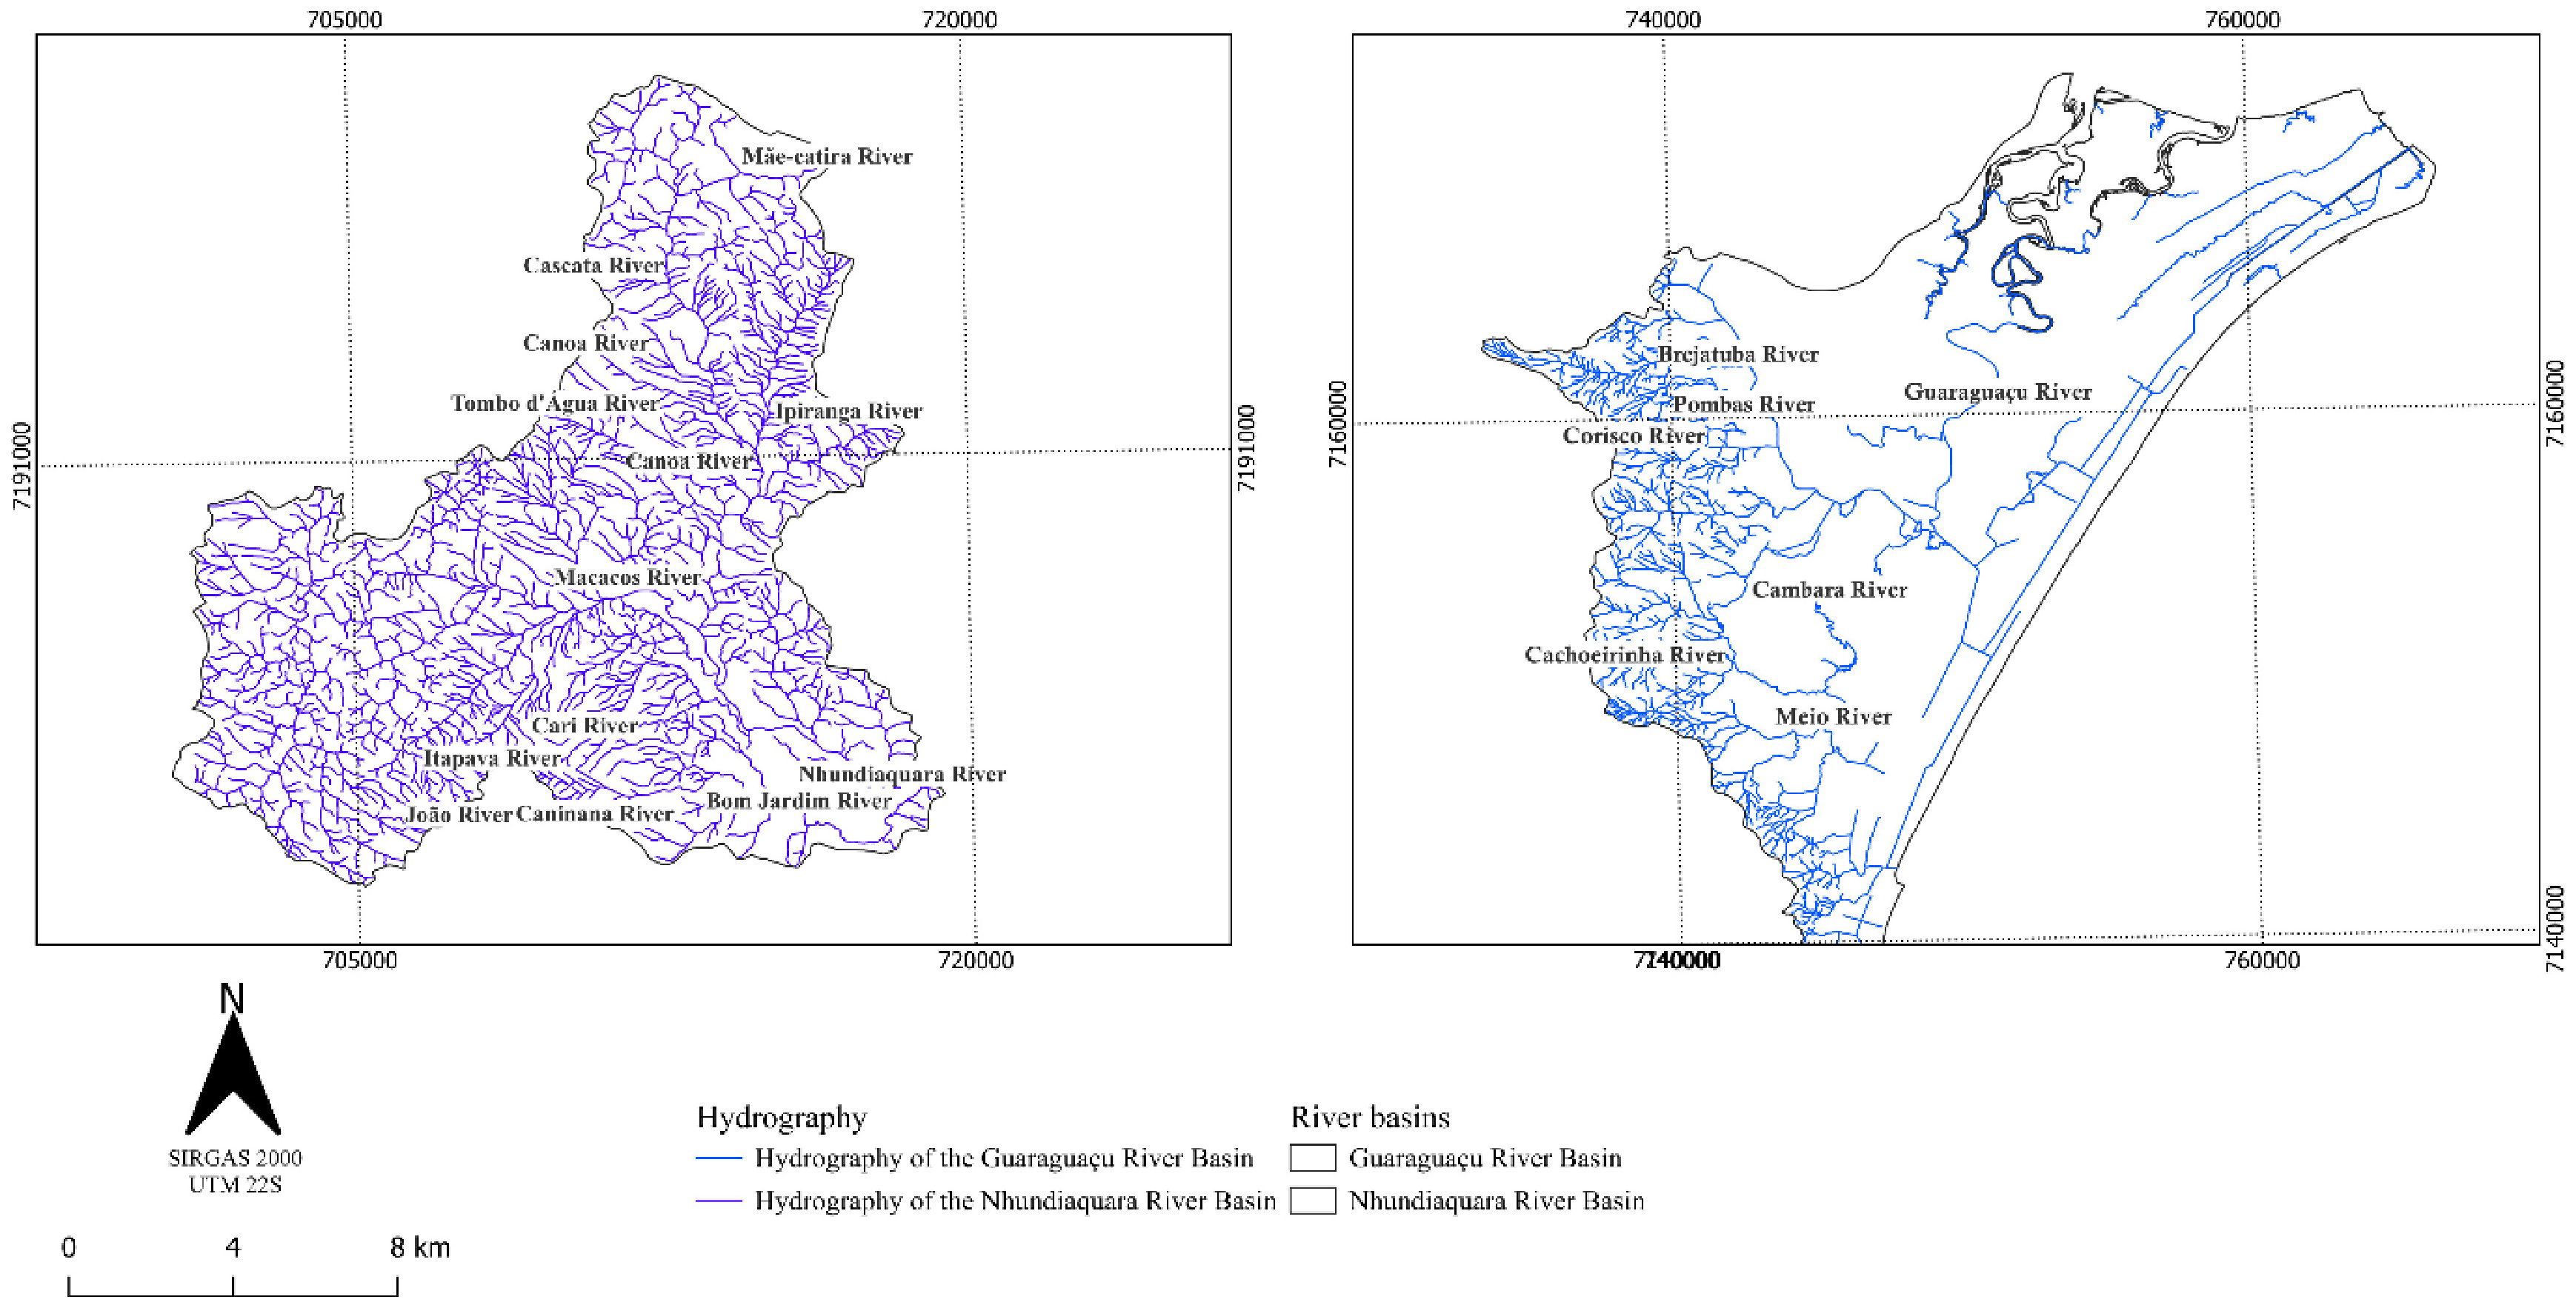
Figure 3 presents the drainage network of the studied basins. The main rivers in the Guaraguaçu River Basin are the Guaraguaçu River (~43.0 km), followed by the Cambará River (~22.0 km) and the Pery River (~17.5 km). The Cambará and Guaraguaçu rivers contain the largest number of tributaries; the Cambará River is a tributary of the Guaraguaçu, and near their confluence lies the Pery River. The latter is the main receptor of urban drainage from the municipality of Pontal do Paraná and exhibits the lowest water quality indices (Elste, 2021). This condition worsens during summer due to population increase and the influence of a nearby landfill, which adds an additional environmental burden.

In the Nhundiaquara River Basin, the longest watercourses are the Nhundiaquara and São João rivers. Both originate at the top of the Serra do Mar and include several tributaries within their drainage network, extending to the upstream limit of the area delineated for this study.
METHODOLOGY
Model description
The Soil and Water Assessment Tool (SWAT) is a physically based, semi-distributed hydrological model developed in the mid-1990s and continuously updated by the USDA–ARS and Texas A&M University (Neitsch et al., 2011). It is designed for large and heterogeneous watersheds and simulates, over long time series, the effects of land-use management on streamflow, sediment loads, and agricultural chemical transport (e.g., nutrients and pesticides). Within the hydrological cycle, the model represents precipitation, evapotranspiration, infiltration, surface runoff, lateral and subsurface flow, and baseflow, in addition to nutrient transport processes. It is widely applied in water quality studies (Lima, 2016). As a semi-distributed model, SWAT allows flow estimation at multiple points within the drainage network and facilitates the creation and comparison of different scenarios.
The model focuses on long-term hydrological responses. The watershed is subdivided into sub-basins based on topography and drainage networks; within each sub-basin, Hydrological Response Units (HRUs) are defined by overlaying land use, soil type, and slope classes, applying minimum area thresholds to exclude very small classes.
In assigning precipitation data, SWAT associates each sub-basin with a single rainfall station—the one closest to its centroid—thereby assigning uniform precipitation values to all HRUs within that sub-basin. This approach disregards the intra-sub-basin spatial heterogeneity of rainfall (Jiang et al., 2024).
On the coast of Paraná, the rainfall regime is highly variable: precipitation tends to increase near the Serra do Mar region and decrease across the coastal plain, resulting in strong spatial heterogeneity. Regional data indicate total annual precipitation values around 2,000 mm on the coastal plain and exceeding 3,500 mm on the ocean-facing slopes of the Serra do Mar. These rainfall maxima are often poorly captured due to the lack of monitoring stations in key topographic compartments (Paula, 2016).
In view of this, the following data composition strategy was adopted using the available rainfall stations for the two sub-basins analyzed. Initially, only data from stations located within the sub-basins were used. Subsequently, data from nearby stations outside the study basins were also considered, both with and without correction. The correction was performed using the double mass curve method, estimating a multiplicative factor (k) between the slopes of the cumulative precipitation curves from different stations. The inclusion of rainfall data from outside the sub-basin allowed an assessment of whether such integration could improve the hydrological model’s performance. In basins with strong orographic control, greater sensitivity to the centroid-based rainfall assignment rule is expected; therefore, considering additional rainfall stations—even those located outside the sub-basin—may enhance model reliability, whether or not data correction is applied.
Land use and land cover
Land use and land cover data are presented in Figure 4 and were obtained from the AMEAC Project (Universidade Tecnológica Federal do Paraná, 2024). In the Nhundiaquara River Basin, land cover is dominated by Dense Ombrophilous Forest (Atlantic Rainforest), which accounts for more than 90% of the total area. Anthropogenic land use is minimal: urbanized areas represent approximately 1%, while agricultural lands account for 2.33%. Other land use classes collectively represent less than 6% of the basin’s total area.

In the Guaraguaçu River Basin, Dense Ombrophilous Forest is also predominant, covering approximately 70% of the total area. Pioneer Formations influenced by fluvial environments occupy around 15.4% of the basin, reflecting the estuarine and marine influence within the system. Anthropogenic land use is more pronounced than in the Nhundiaquara Basin, with urban areas covering about 8.77% of the total basin area. Other land use categories do not exceed 6% of the area.
Overall, the data reveal a coastal plain landscape dominated by lowland forests and pioneer vegetation formations, along with more intense urbanization. The predominance of forest cover in both basins supports the application of the hydrological model across different simulated periods.
Pedology
The soil data for the Guaraguaçu River Basin were obtained from the AMEAC Project (2024) (Universidade Tecnológica Federal do Paraná, 2024), with vector files provided by the Institute of Lands, Cartography and Geosciences (ITCG).
The predominant soil type in the Guaraguaçu River Basin is Humiluvic Spodosol, characterized by the accumulation of organic matter and commonly found in the low-lying coastal plains along the Brazilian coast. The Cambisol is the second most representative soil type, typically occurring in highly undulating or mountainous terrain, characteristic of the Serra do Mar region in Paraná.
In the Nhundiaquara River Basin, Humiluvic Spodosol is also predominant, covering more than 72% of the basin area, followed by Haplic Cambisol. Figure 5 shows the spatial distribution of soils within the studied basins.

In this study, the input parameters related to soil properties were derived from the works of Viana et al. (2018), Antunes (2015) and Noda (2018), as well as from FAO soil information derived from the FAO–UNESCO Soil Map of the World for South America (Food and Agriculture Organization of the United Nations, 1971).
Streamflow and rainfall data
The streamflow stations considered in this study were ETA–Matinhos (ANA code 8222000), located in the Guaraguaçu River Basin, and Morretes (ANA code 82170000), located in the Nhundiaquara River Basin. Figure 6 highlights the streamflow stations (in blue) used in the analysis, with data obtained from the Instituto Águas do Paraná (Instituto das Águas do Paraná, 2025).
The Morretes station has a long historical record, operating continuously since 1938 to the present. In the Guaraguaçu River Basin, the ETA–Matinhos station, managed by the Instituto Água e Terra do Paraná (IAT), provides data from 2005 to 2009. According to Sant’Ana (2023), this gauging point is not affected by tidal influence, thereby allowing hydrological modeling without interference from tidal oscillations.
For rainfall data, stations located both inside and outside the sub-basins of interest were used. In the hydrological model of the Guaraguaçu River Basin, the following stations were included: ETE Matinhos Cambará (code 2548089), Ipanema (2548037), and Colônia Santa Cruz (2548049). In the hydrological model of the Nhundiaquara River, the following stations were used: Morretes (2548000), Véu da Noiva (2548002), São João da Graciosa (2548047), and Mananciais da Serra (2548041). All stations are operated by the ANA and Águas Paraná/IAT.
It is worth noting that the Mananciais da Serra and Colônia Santa Cruz stations are located outside the study basins. Therefore, the double mass curve analysis was applied using the Véu da Noiva and ETE–Sanepar Matinhos stations, respectively. Details of the stations are presented in Table 1, and the location of the rainfall stations used in this study is shown in Figure 7.

The values of solar radiation (Rs), relative humidity (RH), maximum and minimum temperatures (Tmax, Tmin), and wind speed and direction at 2 m (u2) were obtained from the BR-DWGD dataset at a grid point representative of the basins, as shown in Figure 8. In BR-DWGD, wind speed is provided as u2 (wind speed at 2 m height). In the SWAT setup adopted in this study, wind speed was used at the same reference height (2 m); therefore, no height conversion was applied during meteorological input preparation. The BR-DWGD (Brazilian Daily Weather Gridded Data) is a daily meteorological dataset covering the entire Brazilian territory with a grid resolution of 0.1° × 0.1°. The data are generated by interpolating observational measurements using a network of 11,473 rain gauges and 1,252 meteorological stations, with the interpolation method selected via cross-validation between IDW (Inverse Distance Weighting) and ADW (Angular Distance Weighting). For Tmax/Tmin, altitude adjustments are applied using the lapse rate method. (Xavier et al., 2022).

Although BR-DWGD was used as an auxiliary source to maintain meteorological input completeness, a formal quantitative comparison between BR-DWGD rainfall and observed rainfall at local stations was not performed in the original workflow. This is acknowledged as a limitation, since such an evaluation would strengthen confidence in the use of gridded support data in periods with incomplete observations. Recent assessments of gridded meteorological products have shown that their adequacy should be examined not only through comparisons with point observations, but also by evaluating how associated biases propagate into hydrological simulations (Lujano et al., 2025). Nevertheless, BR-DWGD is a widely used Brazilian gridded meteorological dataset developed from an extensive observational network using quality-control procedures and interpolation/cross-validation methods (Xavier et al., 2022), and its use in Brazilian hydroclimatic applications is supported by recent studies that apply BR-DWGD for basin-scale precipitation analyses (Silva Júnior, 2025) and that compare BR-DWGD with INMET station data and ERA5 reanalysis in case studies (Perleberg et al., 2025). In the present study, BR-DWGD support was treated as a pragmatic data-completeness strategy and not as the basis for the rainfall-network scenario comparison.
Data quality control and preprocessing workflow
To improve the transparency and reproducibility of the rainfall forcing used in the hydrological simulations, a data preprocessing workflow was adopted before scenario definition and SWAT setup. The rainfall and streamflow series were first checked for temporal consistency, record continuity, and metadata compatibility (station identification, operation period, and location). The screening step included verification of missing records, duplicated dates, and physically inconsistent values. After this screening, the usable time windows for each station were defined according to the availability of observations within the modeled periods.
The selection of rainfall stations considered as external support candidates was based on geographic proximity to the target basin, data availability during the simulation period of interest, and the existence of an overlapping period with at least one internal reference station that allowed inter-station consistency analysis through the double mass curve. This procedure was adopted to avoid including external stations solely on the basis of distance, without first evaluating whether their rainfall regime was sufficiently compatible with the basin conditions. In addition, station choice was interpreted in light of the regional topographic setting, especially the influence of the Serra do Mar, since elevation contrasts may affect rainfall proportionality and, consequently, the stability of correction factors.
When observed meteorological data required by SWAT were unavailable, gridded BR-DWGD data were used as auxiliary inputs at representative grid points for the study basins. In this study, BR-DWGD was used to provide solar radiation, relative humidity, maximum and minimum air temperature, and wind data, while rainfall forcing in the scenario comparisons remained primarily station-based, following the combinations defined for each scenario. When BR-DWGD rainfall data were used because observed rainfall was unavailable, they were incorporated only to maintain input completeness in the corresponding period. This distinction is important because gridded products and gauge-based series may differ structurally in their spatial representation, with gridded fields tending to smooth local rainfall contrasts relative to point observations. Therefore, BR-DWGD support was treated as a data-completeness strategy and not as a replacement for the scenario-based comparison of rain-gauge network configurations.
The overlap between stations was explicitly considered in the interpretation of double mass curve corrections and in the transferability of correction factors to the simulation periods. For each station pair used in the harmonization procedure, the overlap window was identified and used to estimate the proportional relationship between cumulative rainfall series. The length of overlap was taken as an important indicator of correction robustness, since short overlap periods may capture only part of the interannual and seasonal variability and may therefore reduce the stability of the estimated factor.
Scenarios
Considering the availability of rainfall data in the region, eight hydrological model simulation scenarios were developed for the Nhundiaquara and Guaraguaçu River Basins. Table 2 presents the stations used and the periods adopted for each scenario. All simulations included a 2-year warm-up period. When observed rainfall data were unavailable, series from the BR-DWGD dataset were used.
In the Nhundiaquara River Basin, Scenario 1 employed three internal stations — Véu da Noiva, Morretes, and São João da Graciosa — for the period 1975–1983. Scenario 2 retained only Morretes and São João da Graciosa for the same period (1975–1983). Scenario 3 used the period 1997–2005 with only the Morretes and São João da Graciosa stations. In Scenarios 4 and 5 (1997–2005), the Mananciais da Serra station (outside the basin) was included: without correction (Scenario 4) and with double mass curve correction relative to the Véu da Noiva station (Scenario 5). The double mass curve was performed for the period June 1974 to October 1980 and applied to the 1997–2005 series.
For the Guaraguaçu River Basin, Scenario 6 used exclusively the ETE–Sanepar Matinhos station. In Scenario 7, the Colônia Santa Cruz station was added without applying the double mass curve correction. In Scenario 8, the double mass curve correction was applied to the Colônia Santa Cruz series relative to the ETE–Sanepar Matinhos station. Simulations were restricted to 2008–2009, a period during which the ETE–Sanepar Matinhos station simultaneously recorded rainfall data along with streamflow data from the ETA–Matinhos Cambará station. The double mass curve was performed for the corresponding period from January 2008 to April 2013, and after adjusting the cumulative precipitation, the correction was applied to the series used in the 2008–2009 simulations, ensuring consistency between datasets.
In all scenarios, station allocation follows the SWAT subroutine logic, which assigns each sub-basin to the rainfall station closest to its centroid. Figures 9 and 10 illustrate how HRUs were generated and how station data were allocated in each configuration, with the area highlighted in Figure 10 representing the calibrated sub-basin in the Guaraguaçu Basin, and the implementation of different station combinations according to data availability in each period.

Configuration of the stations used in the hydrological modeling of the Nhundiaquara River Basin for Scenarios 1 to 5.

Configuration of the stations used in the hydrological modeling of the Guaraguaçu River Basin for Scenarios 6 to 8.
Double Mass Curve (DMC) correction and temporal transferability
To ensure a robust comparison among rainfall-network configurations, harmonization of external rainfall series was treated as part of the scenario design rather than only as a post hoc interpretation. In line with prior investigations in the Nhundiaquara River Basin, where double-mass relationships were used to assess rainfall-series consistency and support the treatment of precipitation data under strong orographic influence (Taveira, 2016), double mass curve (DMC) correction was applied only in the scenarios that included an external support station, namely Scenario 5 for the Nhundiaquara River Basin and Scenario 8 for the Guaraguaçu River Basin. In both cases, the purpose of the procedure was to reduce systematic proportional differences between the external and internal rainfall series before their use as precipitation forcing in SWAT.
The DMC analysis was performed using cumulative precipitation from a candidate external station and a reference station located within the target basin. For the Nhundiaquara River Basin, the external station Mananciais da Serra was compared with the internal station Véu da Noiva, and the correction relationship was established over the overlapping period from June 1974 to October 1980. The resulting proportional adjustment was subsequently applied to the Mananciais da Serra series used in the 1997–2005 simulations (Scenario 5). For the Guaraguaçu River Basin, the external station Colônia Santa Cruz was compared with the internal station ETE–Sanepar Matinhos, using the overlapping period from January 2008 to April 2013, and the corresponding adjustment was applied to the Colônia Santa Cruz series used in the 2008–2009 simulations (Scenario 8). In both basins, the corrected external series replaced the uncorrected external series only in the scenario explicitly defined as “with correction,” while all other scenario settings were kept unchanged.
The use of DMC in this study assumes that the cumulative relationship between the station pairs is approximately linear and that the proportionality between the series is sufficiently stable to support temporal transfer of the correction factor from the overlap window to the simulation period. This assumption is considered reasonable when the paired stations are influenced by similar rainfall regimes and when no evidence of abrupt changes in measurement conditions is observed (Taveira, 2016). Because the method is based on proportional consistency, it may become unreliable when nonstationarity is present, including changes related to instrumentation, station relocation, or shifts in seasonal rainfall behavior. Likewise, strong elevation contrasts and marked orographic differences between stations may affect the stability of the relationship and should be considered when interpreting the correction—particularly in Serra do Mar contexts, where orographic rainfall can dominate high-intensity/seasonal totals and may not be consistently represented across datasets or periods (Taveira, 2016; Taveira & Santos, 2019).
For this reason, the DMC procedure was used as a conditional harmonization method, intended to improve compatibility between internal and external rainfall series without altering the SWAT rainfall-allocation rule itself. The method does not remove structural uncertainties associated with sparse gauge coverage or centroid-based assignment, but it reduces the risk that differences between scenarios are dominated by avoidable inter-station bias. This approach allows the comparison between scenarios to focus on the effect of station-network composition and on the contribution of external support stations under corrected and uncorrected conditions, while remaining consistent with the broader evidence that SWAT-based hydrological responses in the Nhundiaquara basin are strongly conditioned by how precipitation regimes—especially orographic components—are represented in the forcing data (Taveira & Santos, 2019).
Sensitivity analysis, parameter selection, and calibration
The model’s performance was evaluated using statistical indices available in SWAT+ Toolbox. For each hydrological simulation, a 2-year warm-up period was applied. The performance indicators used were the Nash-Sutcliffe Efficiency (NSE), Kling–Gupta Efficiency (KGE), Mean Squared Error (MSE), Mean Absolute Relative Error (MARE), and Percent Bias (PBIAS). Table 3 presents the performance-classification criteria adopted in this study.
As a first step in defining the calibration strategy for the hydrological model, the parameter set adopted by Baldissiera (2005) was used as an initial baseline. Subsequently, additional parameters were incorporated based on the sensitivity analysis, in order to improve the representation of the main hydrological processes controlling streamflow simulation. Table 4 lists the parameters considered and adjusted during the calibration procedure.
In general, the selected parameters influence surface-runoff generation and delay, the partitioning and travel time of lateral flow, storage and baseflow recession, infiltration/percolation processes, and the availability of soil water and evapotranspiration. Because model response to rainfall-forcing configuration may vary according to the dominant hydrological processes, parameter selection was first guided by process relevance and then refined using Sobol sensitivity analysis in SWAT+ Toolbox.
Sensitivity analysis of model parameters was conducted using the Sobol method available in SWAT+ Toolbox. This method quantifies the contribution of each parameter to the unconditional variance of model output through sensitivity indices estimated by Monte Carlo integration (Nossent et al., 2011). In this study, 100 Sobol iterations were performed. The Sobol analysis was used to identify and rank the most influential parameters prior to calibration and to support parameter selection for the calibration stage.
Automatic calibration was then performed in SWAT+ Toolbox (v3.2.0) using the CALSI algorithm (Calibration by Latin-hypercube Sampling Iterations), with NSE selected as the objective function. The automatic calibration setup used 20 iterations and a batch size of 50, with range refining threshold = 12, range expansion factor = 5%, global batch = 20, and the option “Include Current Parameter Values” enabled. These settings refer to the calibration procedure and are distinct from the 100 Sobol iterations used for sensitivity analysis.
After the automatic calibration stage, the preliminary best parameter values were manually inspected and refined by testing parameter intervals within ±10% around the preliminary calibrated values in order to evaluate the effective influence of each parameter on model response. Based on this procedure, the final parameter values reported in Table 5 were defined and then kept fixed for the rainfall-network scenario comparisons within each basin, so that differences in model performance could be attributed primarily to rainfall-forcing configuration rather than to scenario-specific recalibration.
Thus, the comparison among scenarios was performed under the same calibrated parameter values within each basin, isolating the effect of rain-gauge distribution and double mass curve correction on hydrological simulation performance. Model setup and simulation management were conducted in SWAT+ Editor (v3.2.0), and sensitivity analysis/calibration procedures were conducted in SWAT+ Toolbox (v3.2.0).
RESULTS
Double mass curve
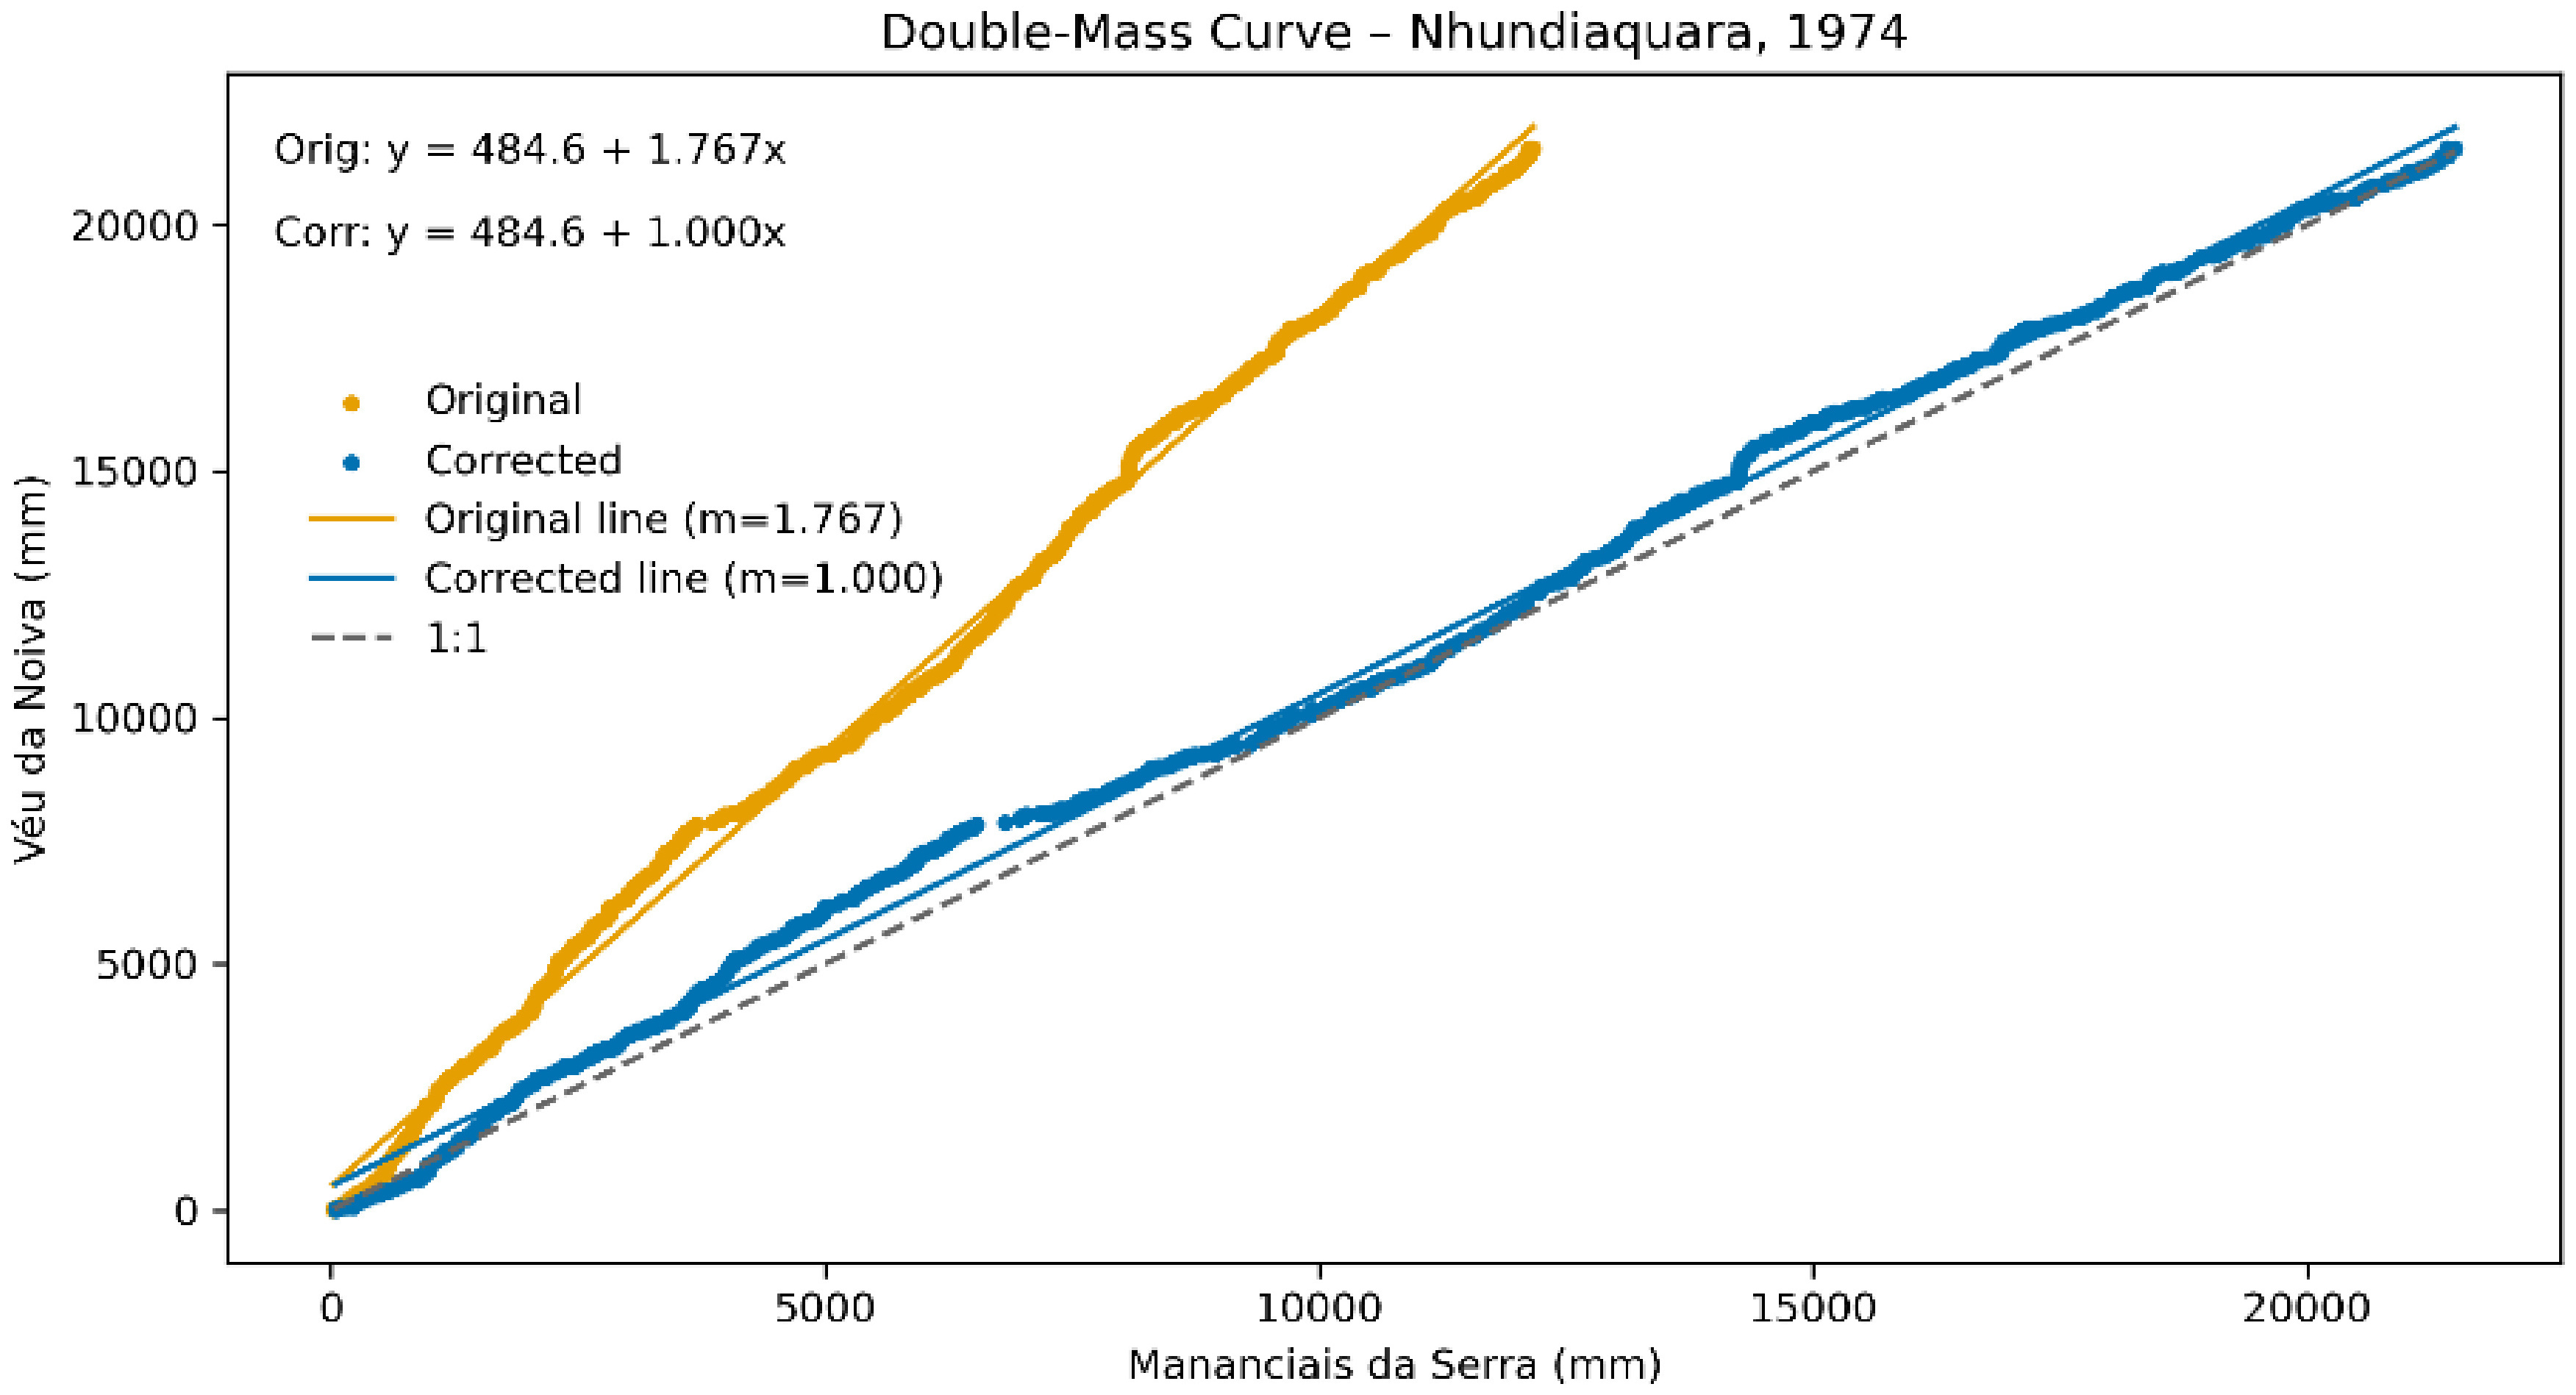
The double mass curve for the Nhundiaquara River Basin model, comparing the Mananciais da Serra series (outside the basin) with Véu da Noiva (inside the Nhundiaquara Basin), is shown in Figure 11. The original relationship indicates an overestimation of precipitation at the Véu da Noiva station compared to Mananciais da Serra, although the relationship is linear, suggesting similarity in the rainfall regimes.
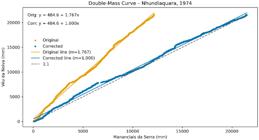
To correct this bias, a multiplicative factor of 1.765 was applied to the daily data from Mananciais da Serra. This adjustment equalized cumulative precipitation, resulting in a slope approximately equal to unity, effectively correcting the data relative to the Véu da Noiva station. This factor was subsequently applied to the 1997–2005 period.
The linear behavior between the stations indicates that the Mananciais da Serra station can be effectively used as a support station in scenarios where the availability of internal stations is limited.
The double mass curve between the ETE–Sanepar Matinhos and Colônia Santa Cruz stations also indicates compatibility between the rainfall regimes, allowing the harmonization of the external series (Colônia) for use in the Guaraguaçu River hydrological model (Figure 12). The adjustment was calculated over the overlapping data period from 2008 to 2013 and applied to the 2008–2009 simulations, ensuring consistency between the datasets used. A correction factor of 1.084 was applied, indicating that the monthly cumulative precipitation at the ETE–Sanepar Matinhos station is approximately 8% higher than the values observed at the Colônia Santa Cruz station.

Double mass curve between the rainfall stations ETE-Sanepar Matinhos and Colônia Santa Cruz.
This value is considerably lower compared to the previous double mass curve, in which an overestimation of approximately 76% was observed relative to the Mananciais da Serra station. This result suggests that the higher values recorded at the Véu da Noiva station may be associated with orographic rainfall, influenced by the morphology of the Serra do Mar, where precipitation peaks tend to be intensified by the terrain—a prominent characteristic of the coastal region of Paraná (Grimm, 2009; Paula, 2016).
The double mass correction factors are not only descriptive of inter-station consistency but also hydrologically relevant because they modify the magnitude of rainfall forcing assigned to sub-basins under the SWAT centroid-based station allocation rule. In practice, a multiplicative factor greater than 1 applied to an external station increases the effective precipitation input to the sub-basins associated with that gauge, which is expected to affect simulated runoff volume, peak-flow magnitude, and recession behavior through changes in soil moisture recharge and runoff partitioning. By contrast, smaller correction factors (or factors close to unity) imply limited changes in forcing and therefore smaller expected impacts on hydrograph metrics. This mechanism helps explain why the correction produced a stronger modeling effect in the Nhundiaquara basin than in the Guaraguaçu basin, where the estimated multiplicative discrepancy was comparatively small.
Model performance in streamflow simulation
The Sobol index analysis shows contrasting responses between the basins (Table 5). In the Guaraguaçu River Basin hydrological model, CN2 clearly dominates, indicating that surface runoff generation primarily controls model adjustment. Other parameters have minor influence, with SURLAG being almost neutral, which is consistent with the coastal plain setting, sandy soils, and fast hydrological response (Paula, 2016).
In the Nhundiaquara River Basin model, sensitivity is concentrated on runoff generation under wet soil conditions: CN3_SWF is the most influential parameter, followed by LATQ_CO, which regulates lateral flow contribution, and SURLAG, which modulates surface runoff delay. Parameters LAT_TTIME and FLO_MIN have little impact within the search space. This pattern is typical of mountainous basins, characterized by greater lateral flow participation and sensitivity to antecedent soil moisture.
In summary, the Guaraguaçu River Basin hydrological model is dominated by immediate surface runoff generation, with CN2 being far more influential than other parameters. In the Nhundiaquara River Basin, sensitivity focuses on runoff generation under wet soil conditions (CN3_SWF) and lateral flow contribution (LATQ_CO), followed by surface runoff propagation (SURLAG). Larger characteristic times (LAT_TTIME) and soil water storage capacity (AWC) act as secondary modulators, providing additional delay and sustaining streamflows.
The sensitivity patterns are consistent with the dominant hydrological mechanisms inferred for each basin and help explain the scenario-dependent response to rainfall-network changes. In the Guaraguaçu River Basin, the dominance of CN2 indicates that model behavior is primarily controlled by rapid runoff generation, which is compatible with a small coastal plain catchment and helps explain why changes in rainfall inputs produce modest but detectable shifts in metrics over a short period. In the Nhundiaquara River Basin, the stronger sensitivity to CN3_SWF, LATQ_CO, and SURLAG is consistent with a larger and topographically complex basin influenced by orographic rainfall gradients, where improved rainfall representativeness can affect not only event peaks but also antecedent wetness and delayed flow components.
Results for the Nhundiaquara River Basin
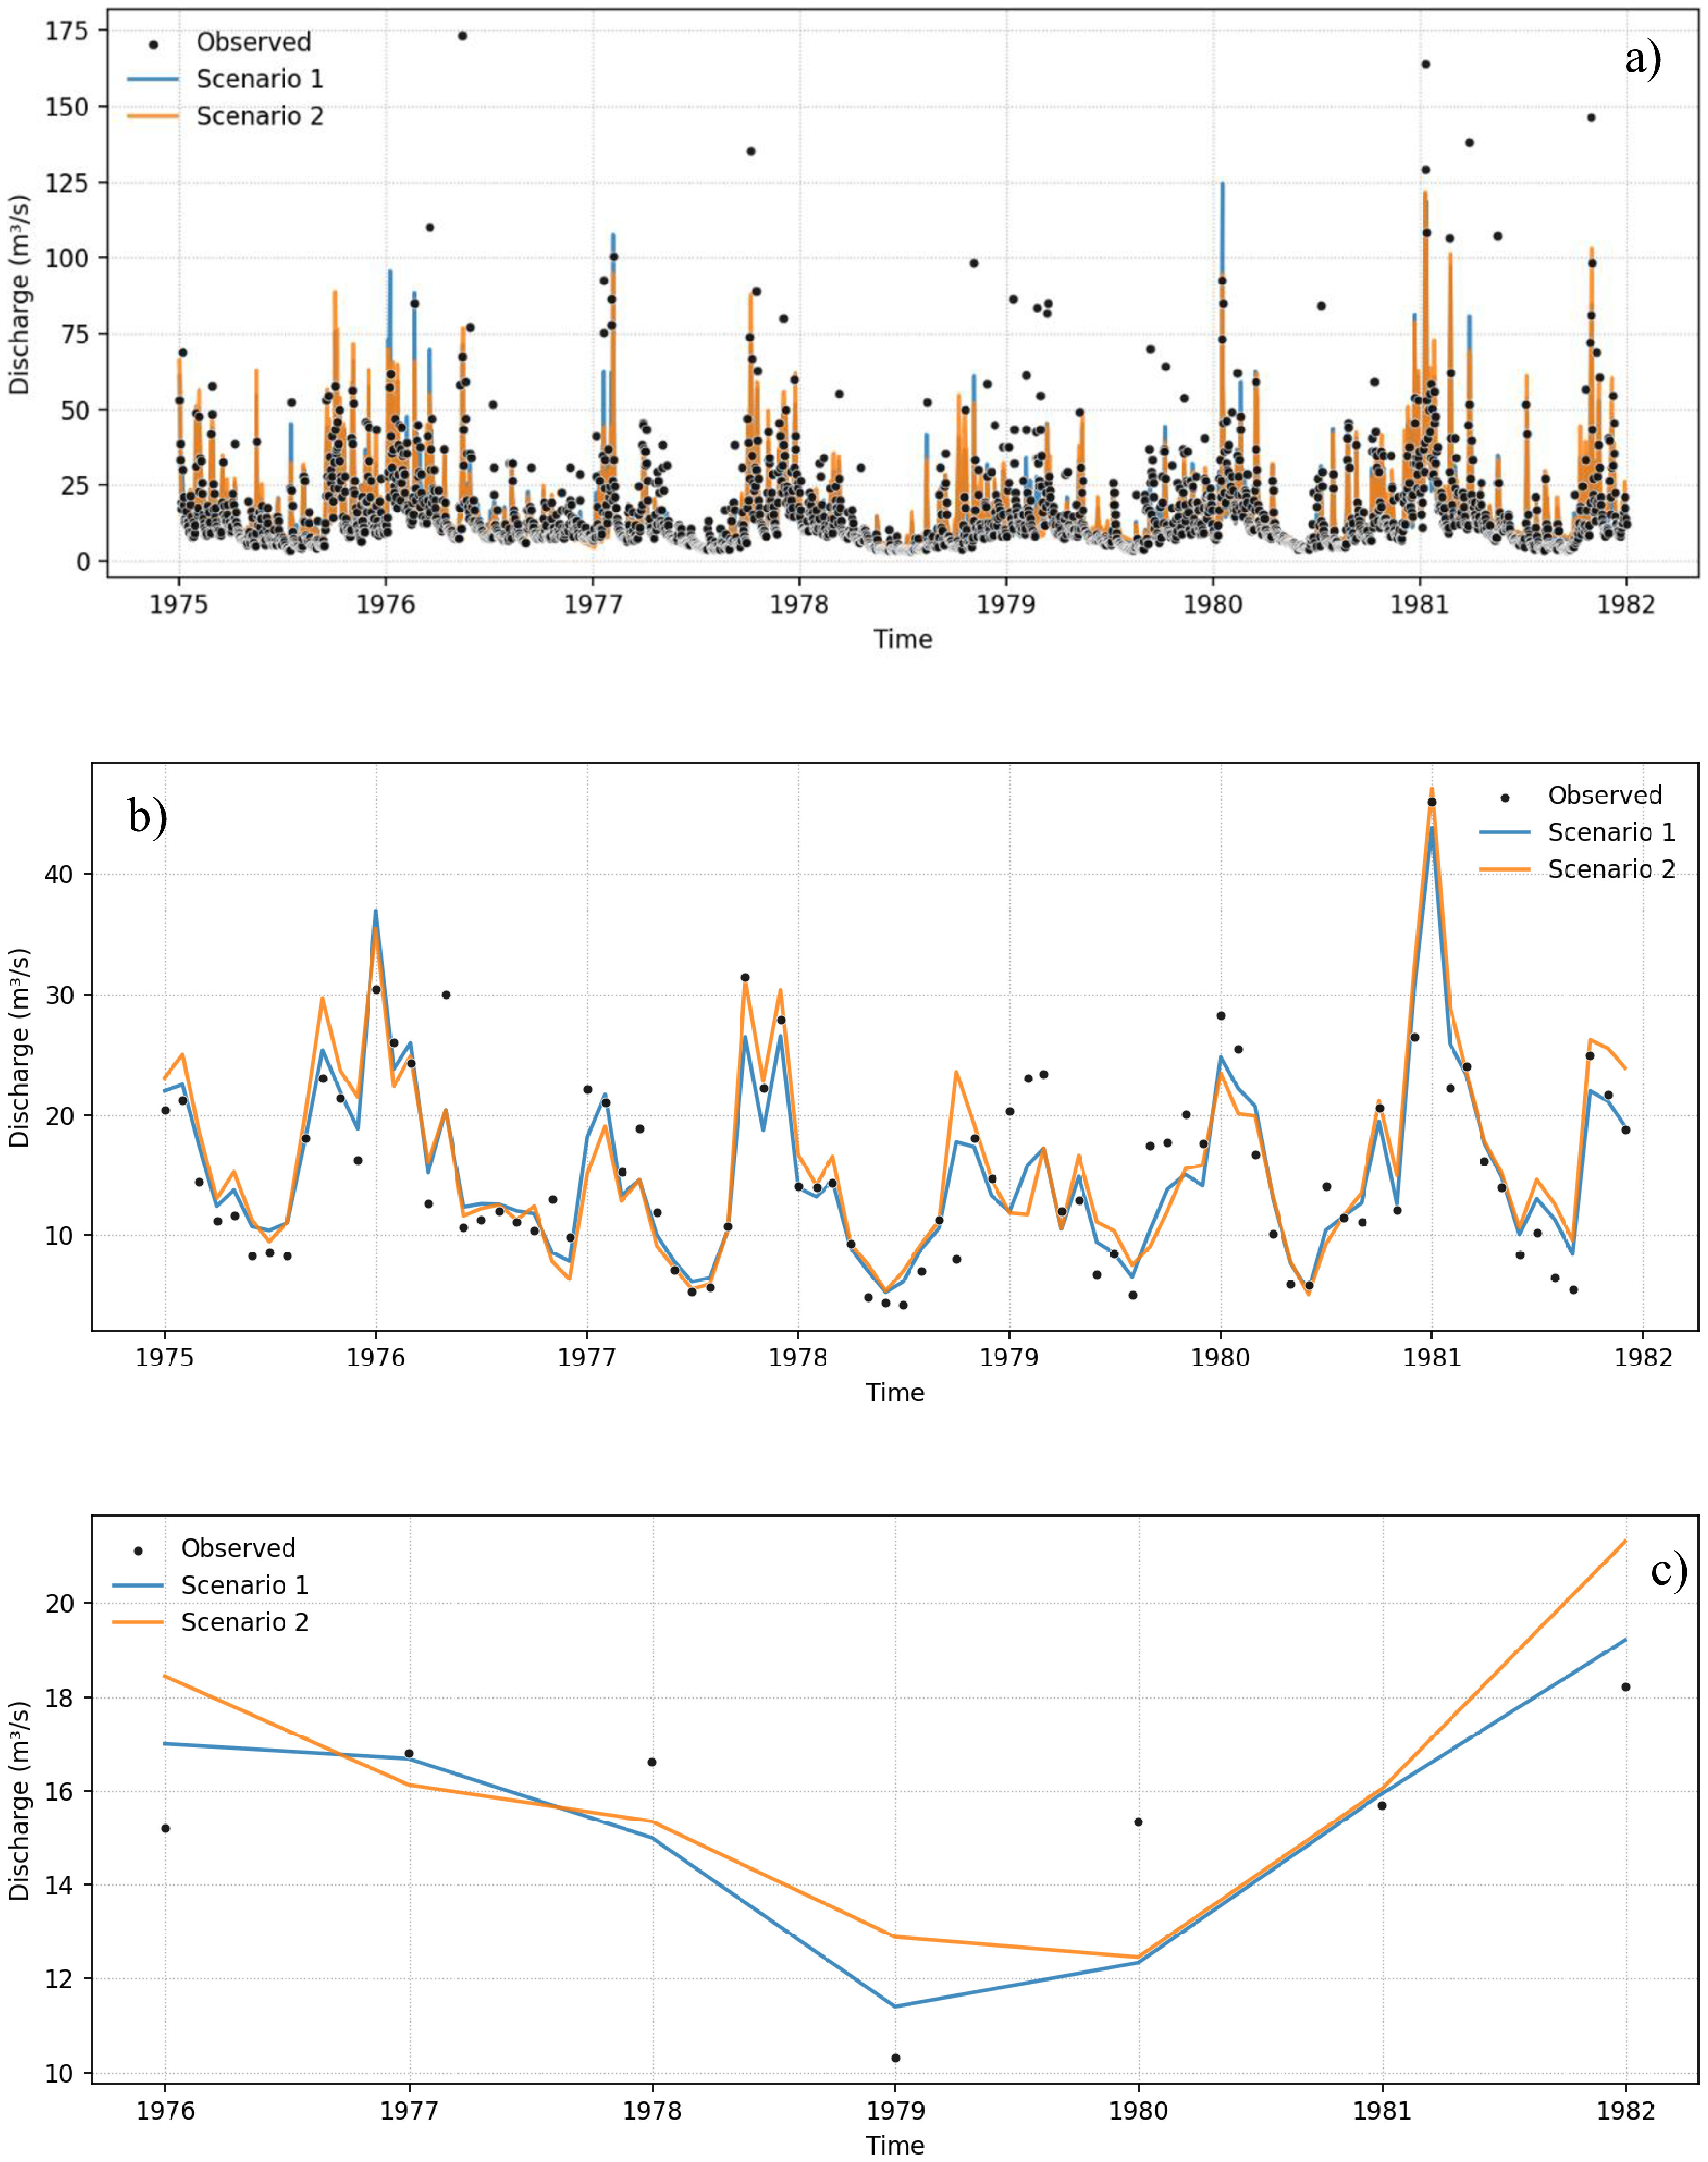
The hydrographs for Scenarios 1 and 2 are shown in Figure 13. The performance metrics for each scenario are presented in Table 6, demonstrating that a greater number of rainfall stations improves the representation of both peak flows and recession periods.

Simulated and observed hydrographs for the period 1975–1983 at daily (a), monthly (b), and annual (c) scales for the Nhundiaquara River hydrological model in Scenarios 1 and 2.
During the 1975–1983 period, Scenario 1, with one additional rainfall station (three stations), performs better than Scenario 2 (two stations). At the daily scale, the Nash-Sutcliffe Efficiency (NSE), which measures simulation accuracy, increases from 0.529 (Scenario 2) to 0.624 (Scenario 1), indicating a reduction in prediction error relative to the observed mean values. This improvement is confirmed by a decrease of approximately 20% in Mean Squared Error (MSE) and around 18% in Mean Absolute Relative Error (MARE), showing reduced errors for both peak and low flows. The Kling–Gupta Efficiency (KGE), which evaluates correlation, bias, and simulation amplitude, also improves, rising from 0.694 to 0.721, meaning the model is better synchronized with the observed data, with lower bias and amplitude closer to observed values. This is further confirmed by PBIAS, which changes from +4.1% to -0.6%, indicating a shift from slight overestimation to slight underestimation, while the total estimated volume remains similar.
At the monthly scale, data aggregation reduces timing errors and reinforces the improvement in estimated flows. NSE increases from Scenario 2 to Scenario 1, from 0.717 to 0.831; KGE from 0.856 to 0.872; MSE decreases by approximately 40%; and MARE by around 24%, with PBIAS remaining practically neutral. In practice, the inclusion of the third rainfall station helps the model better estimate spatially distributed precipitation in the basin, improving the rainfall–runoff representation, reducing peak flow lag, adjusting event magnitudes, and preserving the total water balance in the basin.
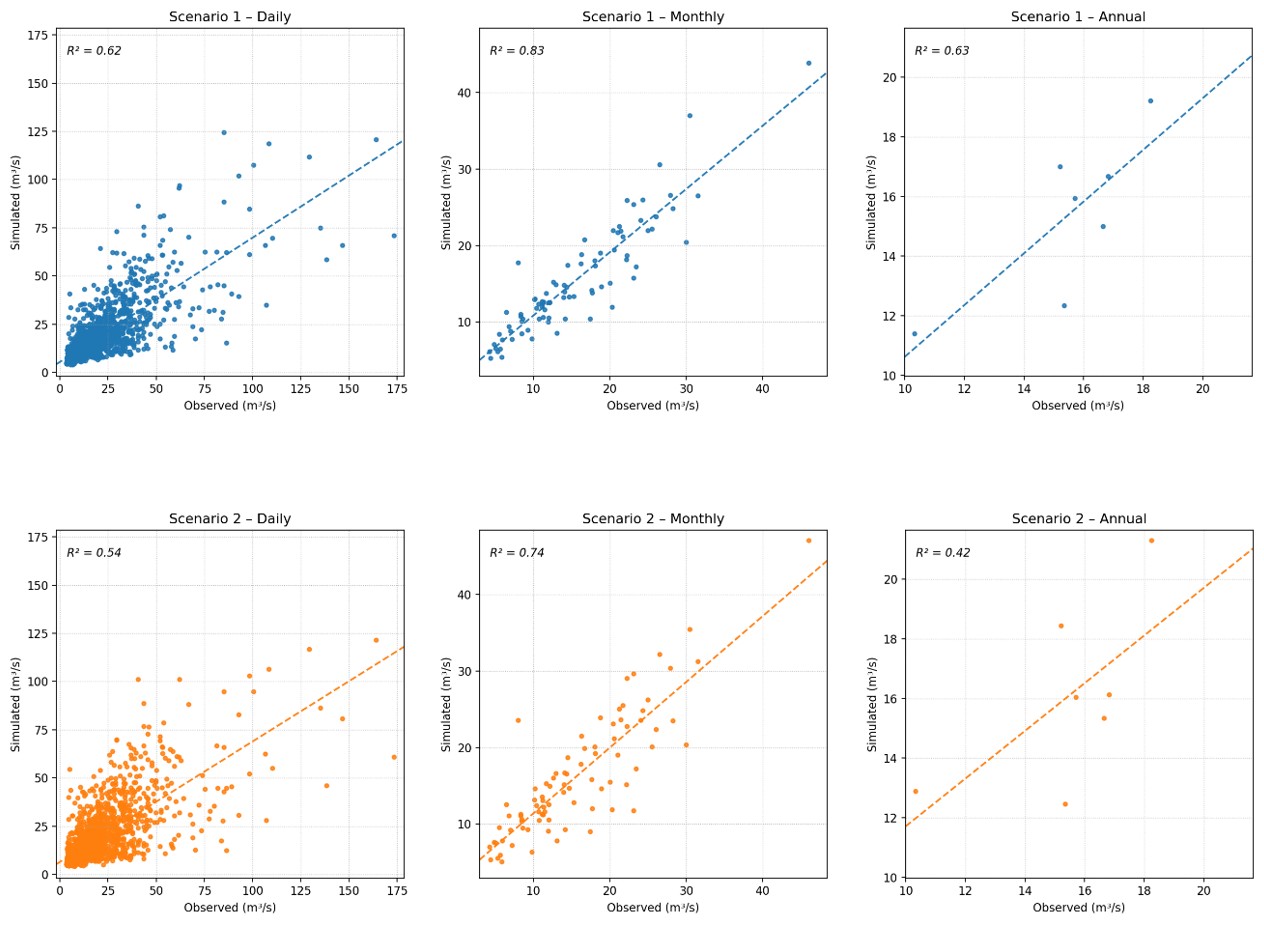
Figure 14 shows that, in Scenario 1, the relationship between observed and simulated streamflow is closer to the 1:1 line (bisector). It is possible to observe that the simulated flows are closer to the diagonal line (bisector), especially at the monthly scale. This indicates that the model was able to adequately represent the observed values, particularly for medium and high flows, as also reflected by the improved NSE and KGE indices.

Observed and SWAT-simulated flows at daily, monthly, and annual scales for the period 1975–1983 in Scenarios 1 and 2.
The difference in the coefficient of determination (R2) between scenarios is more evident in the annual analysis; however, it is important to note that there are few data points at this temporal scale. At the daily scale, the correlation coefficient is 0.62 for Scenario 1, showing that the model represents the observed data better compared to Scenario 2, which has fewer rainfall stations—consistent with the model calibration parameters.
The cumulative residuals, illustrated in Figure 15, are closer to zero in Scenario 1, indicating that the model exhibited minimal monthly bias over time, further reinforcing the quality of the model fit.

Monthly accumulated residuals curve for the period 1975–1983 for the Nhundiaquara River model in Scenarios 1 and 2.
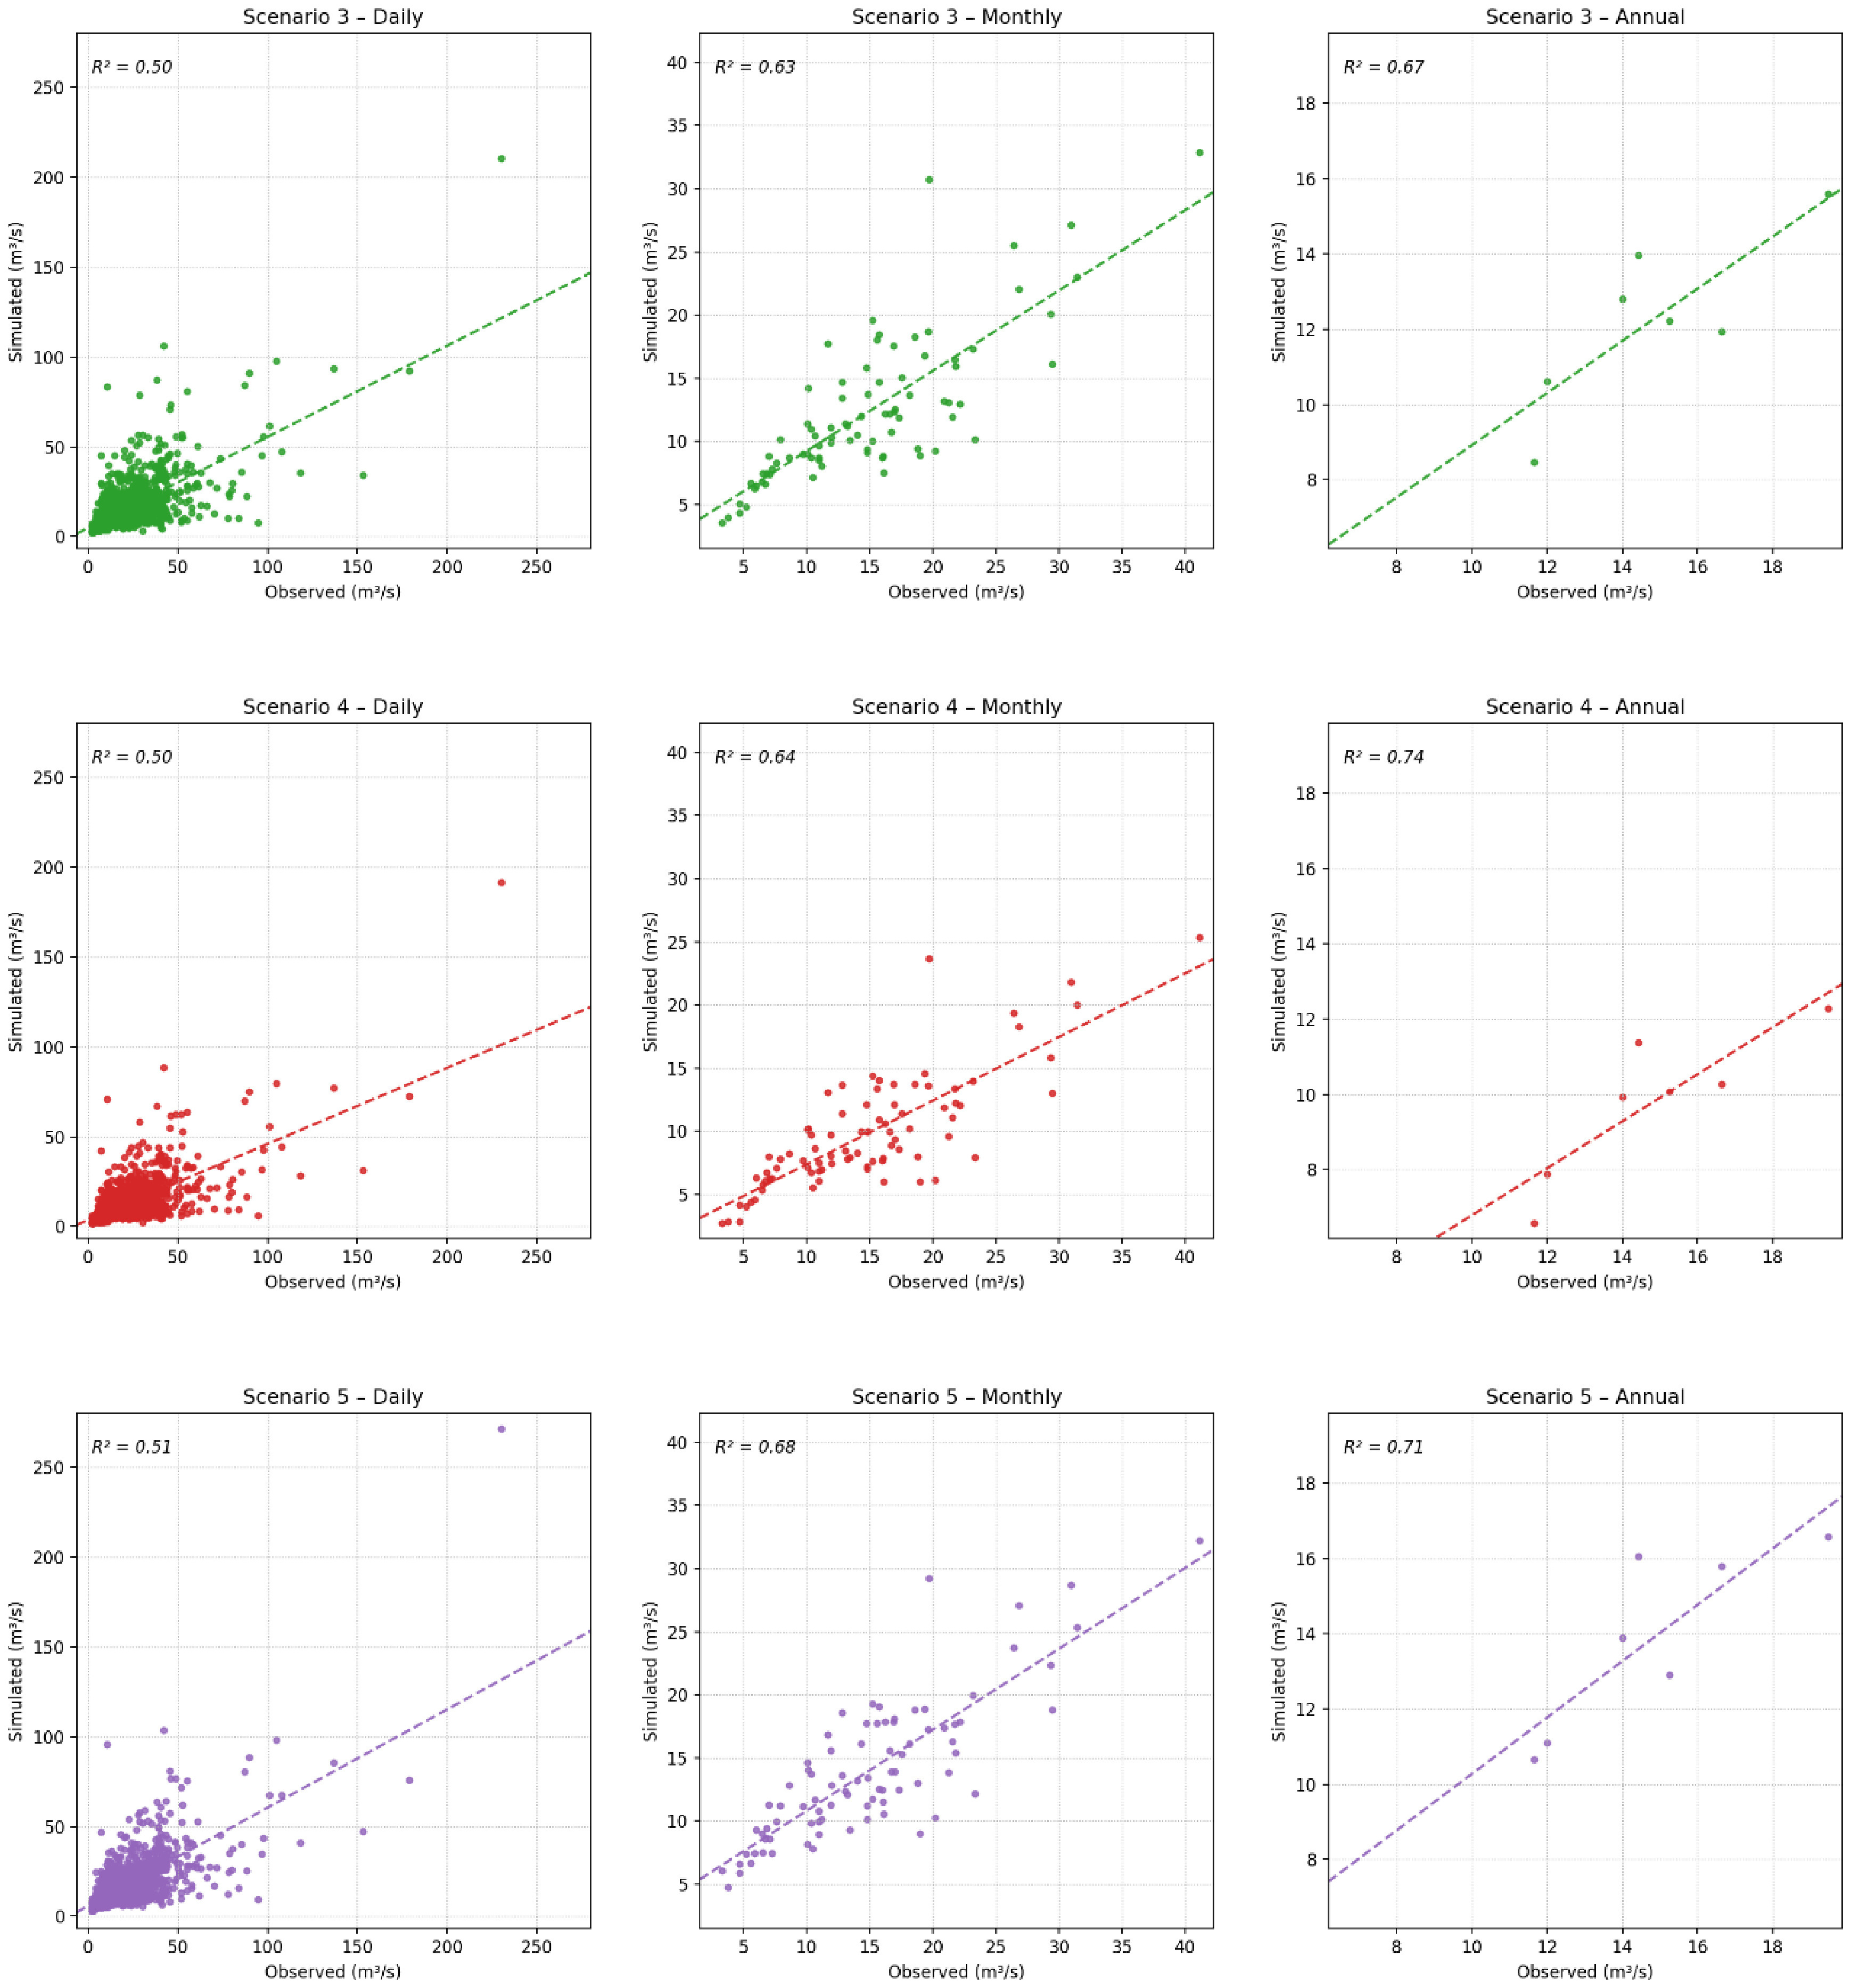
The hydrographs for the period 1997–2005 are shown in Figure 16. During this period, in the Nhundiaquara River Basin hydrological model, the inclusion of the external station in Scenario 4, without applying any correction, significantly worsens model performance, as indicated by the hydrographs, showing an underestimation across all temporal scales. This is confirmed by the decrease in NSE, from 0.464 to 0.362 at the daily scale, and from 0.504 to 0.112 at the monthly scale, indicating a clear bias in cumulative values when using the external station series without harmonization.

Estimated and observed hydrographs for the period 1997–2005 at daily (a), monthly (b), and annual (c) scales for the Nhundiaquara River hydrological model in Scenarios 3, 4, and 5.
However, when the double mass curve correction is applied in Scenario 5, model performance improves significantly, surpassing Scenario 3, which uses only two internal stations. This correction technique helps harmonize external and internal data series, compensating for differences and making the external series more compatible with the internal dataset.
Examining the statistical parameters, Scenario 4 shows an increase in Mean Squared Error (MSE) and a stronger negative bias (around -33%), reflecting systematic underestimation of streamflow by the model. In Scenario 5, with the correction applied, these indicators return to intermediate and more acceptable values, with PBIAS near -6% and MSE reduced, approaching the values of Scenario 3. This demonstrates that applying the double mass curve is effective in improving the reliability of external data used in the hydrological model, benefiting calibration and simulations, especially at daily and monthly scales.
The scatter plots (Figure 17) reflect this difference: in Scenario 4, the data cloud shifts away from the 1:1 line (underestimation of peaks); after applying the correction, the points realign closer to the 1:1 line and the scatter is reduced. The cumulative residual curve (Figure 18) shows that Scenario 5 produced the best results, stabilizing near zero.

Observed and SWAT-simulated flows at daily, monthly, and annual scales for the period 1997–2005 in Scenarios 3, 4, and 5 for the Nhundiaquara River model.

Monthly accumulated residuals for the period 1997–2005 for the Nhundiaquara River model in Scenarios 3, 4, and 5.
Results for the Guaraguaçu River Basin
The hydrographs at the daily and monthly scales are shown in Figure 19 for Scenarios 6 to 8. Only the daily and monthly scales are presented due to the lack of a longer time series, which prevents the use of the annual scale. The performance metrics values for each scenario are presented in Table 7.
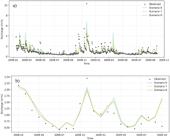
Estimated and observed hydrographs for the period 2008–2009 at daily (a) and monthly (b) scales for the Guaraguaçu River hydrological model in Scenarios 6, 7, and 8.
Performance metrics for the hydrological model scenarios of the Guaraguaçu River sub-basin for the period 2008–2009.
Figure 19 shows that the simulated series are in good phase agreement with the observed data at both daily and monthly scales, despite a moderate attenuation in the amplitude of simulated peaks. The inclusion of the Colônia Santa Cruz station without applying any correction (Scenario 7) yields modest but consistent gains compared to the situation with only one station (Scenario 6). At the daily scale, NSE increases from 0.538 to 0.559, Mean Squared Error (MSE) decreases from 0.294 to 0.281, and Mean Absolute Relative Error (MARE) drops from 0.368 to 0.330; the bias (PBIAS) also approaches neutrality, decreasing from 10.21% to 6.46%, still indicating slight underestimation of total volume. At the monthly scale, these gains are more evident, with improvements in NSE, KGE, MSE, and MARE, although the positive bias remains, consistent with the slight underestimation reflected in the hydrographs.
The application of the double mass curve adjustment (Scenario 8) maintains performance very close to that of Scenario 7, with daily and monthly values of NSE, KGE, MSE, PBIAS, and MARE being very similar. This indicates that differences between the two scenarios represent normal variations for the short time horizon analyzed (2008–2009). This suggests that the external series was already sufficiently compatible with the local climatology, or that the correction introduced minor deviations without significant statistical gain during the period.
The scatter plot between simulated and observed flows, presented in Figure 20, reinforces this interpretation: the daily coefficients of determination (R2) are practically equivalent between scenarios (Table 7), and at the monthly scale they converge to approximately 0.71–0.72, indicating better explanation of variance due to the reduction of temporal noise.

Observed and simulated flows by SWAT at daily and monthly scales for the period 2008–2009 in Scenarios 6, 7, and 8 for the Guaraguaçu River hydrological model.
The monthly cumulative residual curve (Figure 21) shows that Scenario 7 presents the lowest residuals, while Scenario 8 has intermediate values and Scenario 6, with only one station, exhibits the highest residuals over time. This additional evidence confirms that the inclusion of the external station improves the representation of hydrological event amplitudes, even without applying the double mass curve correction.

Monthly accumulated residuals for the period 2008–2009 for the Guaraguaçu River sub-basin hydrological model in Scenarios 6, 7, and 8.
The Guaraguaçu results should be interpreted with caution because the calibrated sub-basin is small and the available calibration window is short (2008–2009). Under these conditions, performance metrics are more sensitive to event sampling and short-term variability, which limits the strength of inference regarding the long-term benefit of adding or correcting external rainfall stations. Therefore, the differences observed among Scenarios 6–8 are interpreted here as indicative tendencies rather than definitive evidence of station-network effects in this basin.
To facilitate cross-scenario comparison, the same performance metrics (NSE, KGE, MSE, PBIAS, and MARE) are consistently reported at daily and monthly scales for all scenarios in Tables 6 and 7, and a compact comparative summary is provided in Table 8. This standardized presentation allows a direct evaluation of the effect of station number, station location (internal vs. external), and double mass correction on model behavior across both basins and simulation periods.
Comparative summary of hydrological model performance metrics (NSE, KGE, and PBIAS) at daily and monthly scales for all rainfall-network scenarios in the Nhundiaquara and Guaraguaçu basins.
DISCUSSION
The number of rainfall stations within a basin significantly influences the response of the hydrological model, especially in regions with strong spatial variability of precipitation. In the case of the model applied to the Nhundiaquara River Basin for the period 1975–1983, greater rainfall coverage resulted in reduced phase errors and correction of flow values during recession periods, reflecting improvements in the NSE and KGE indices. This behavior is consistent with the Serra do Mar orographic gradient and the coastal plain, characteristic of the Paraná coast, where the spatial heterogeneity of rainfall is marked (Paula, 2016). Recent evidence for southern Brazilian watersheds also reinforces that topographic attributes exert a strong control on hydrological and flood responses, supporting the interpretation that relief-mediated spatial heterogeneity is relevant to model behavior in the present coastal basins (Kuchinski & Paiva, 2025).
Across both basins, the comparison of daily and monthly metrics indicates a consistent scale effect: monthly aggregation reduces timing noise and highlights structural differences among rainfall scenarios more clearly than daily evaluation. This pattern is evident in the Nhundiaquara Basin, where the ranking of scenarios becomes more stable at the monthly scale, and in the Guaraguaçu Basin, where monthly residual accumulation helps distinguish modest scenario gains even when daily statistics are close. For this reason, the daily results are interpreted as event-scale diagnostics, whereas the monthly results are used as a more robust basis for comparing rainfall-network configurations.
During the period 1997–2005, the introduction of an external rainfall station without correction resulted in systematic bias in the accumulated precipitation, impairing model adjustment. The application of the double mass curve correction removed this multiplicative bias, recovering model performance at daily and monthly scales, with clear gains at the monthly scale. This indicates that the use of external series should be preceded by correction procedures to obtain real benefits, particularly in environments with high spatial rainfall variability.
In the Guaraguaçu River Basin, for the short period 2008–2009, gains from including a neighboring rainfall station were modest, and the double mass curve correction had a neutral or slightly negative effect. This result aligns with the prior good compatibility between the evaluated series and the short temporal horizon, which limits the robustness and impact of the correction factor.
From a physical control perspective, in the Guaraguaçu sub-basin, the CN2 parameter dominates calibration, indicating that surface runoff generation is the main controller of the hydrograph shape. This outcome is expected for a small basin. In contrast, in the larger Nhundiaquara Basin, parameters related to runoff delays are essential to reproduce hydrograph recessions, reflecting greater subsurface flow contribution in this mountainous region. This difference is directly linked to the different scales of the two basins (13 km2 for Guaraguaçu and 141 km2 for Nhundiaquara) and their orographic characteristics. Smaller basins respond more quickly to precipitation events, with faster flow response, making surface runoff highly sensitive to rainfall intensity, whereas larger basins exhibit a more complex response, involving delays and subsurface contributions.
Moreover, a higher number of rainfall stations relative to the basin area is an important factor. The inclusion of additional external stations in complex orographic environments helps reduce bias in precipitation data and significantly improves the representation of peak flows, as clearly indicated in the Nhundiaquara Basin with the addition of a third station.
Finally, the calibration temporal window influences the adopted metrics: short calibration windows, such as 2008–2009 in Guaraguaçu, can increase statistical variability and mask benefits or drawbacks of implementing stations outside the basin, while longer series, such as 1975–1983 and 1997–2005 in Nhundiaquara, provide more effective evaluations and reveal improvements when there is a greater number of rainfall stations and correction of external data.
CONCLUSION
The comparative analysis indicates that model performance in the analyzed cases is jointly conditioned by spatial representativeness of rainfall forcing and temporal/sample scale (length of the rainfall data series). Monthly metrics generally outperform daily metrics, reducing phase and amplitude noise, while differences between scenarios become clearer with longer series, which reduces the sampling variance of NSE and KGE and stabilizes PBIAS and MARE.
A transferable implication of this study is that, in coastal-mountain environments with strong topographic rainfall gradients, the benefit of adding external rainfall stations depends critically on rainfall-regime similarity and prior bias harmonization. In such settings, the SWAT centroid-based rainfall assignment rule can amplify forcing errors when the available network is sparse or topographically unrepresentative, particularly when a single gauge dominates one or more sub-basins.
In the Guaraguaçu, gains associated with the inclusion of an external station were modest, and double mass curve adjustment did not yield a clear statistical benefit within the short simulation window. This result suggests that, under short records and fast hydrological response, metric differences among rainfall configurations may be small and difficult to interpret robustly without longer time series.
In the Nhundiaquara River Basin, which is influenced by strong topographic gradients near the Serra do Mar, the internal rainfall network played a more important role in representing precipitation variability, and the scenario with a greater number of internal stations (Scenario 1 vs. Scenario 2, 1975–1983) showed clearer performance gains. For 1997–2005, Scenario 5 reduced the pronounced volumetric bias observed in Scenario 4, improving model reliability after harmonization of the external rainfall series. This interpretation is consistent with previous SWAT-based applications in the Nhundiaquara Basin that also highlight the importance of rainfall representation for model performance (Taveira & Santos, 2019).
Therefore, in the two basins analyzed here, the simulation period is a key factor for data reliability and for the interpretation of scenario effects. Short-duration periods, such as 2008–2009 in the Guaraguaçu case, increase metric uncertainty and may mask the benefits of corrections such as the double mass curve, whereas longer periods, as used in the Nhundiaquara scenarios (1975–1983 and 1997–2005), better reveal the effects of rainfall-network configuration.
This study has limitations that should be considered when interpreting and transferring the results. In the Guaraguaçu River Basin, the analysis is based on a short calibration period, which increases sampling uncertainty and reduces the ability to detect statistically robust differences among rainfall configurations. In addition, the study did not include a formal quantitative evaluation of BR-DWGD rainfall against local observed rainfall stations, which should be addressed in future applications to better constrain the reliability of gridded support data at the study region.
DATA AVAILABILITY STATEMENT
Research data is only available upon request.
ACKNOWLEDGEMENTS
This work was carried out with support from the Coordenação de Aperfeiçoamento de Pessoal de Nível Superior - Brasil (CAPES) - Funding Code 001.
REFERENCES
-
Amorim, A. C. B., Scudelari, A. C., Cunha, C., & Gonçalves, J. E. (2020). Eventos extremos de precipitação no litoral do Paraná (Baía de Paranaguá). Revista Brasileira de Meteorologia, 35(4), 563-575. https://doi.org/10.1590/0102-7786354040
» https://doi.org/10.1590/0102-7786354040 - Antunes, T. A. (2015). Modelagem hidrológica da bacia hidrográfica do Alto Canoas através do modelo SWAT (Dissertação de mestrado). Universidade Federal de Santa Catarina, Lages.
- Baldissiera, G. C. (2005). Aplicabilidade do modelo de simulação hidrológica SWAT (Soil and water assessment tool) para a bacia hidrográfica do rio Cuiába/MT (Dissertação de mestrado). Universidade Federal do Mato Grosso, Cuiabá.
-
Bárdossy, A., & Pegram, G. (2014). Infilling missing precipitation records: a comparison of a new copula-based method with other techniques. Journal of Hydrology (Amsterdam), 519, 1162-1170. https://doi.org/10.1016/j.jhydrol.2014.08.025
» https://doi.org/10.1016/j.jhydrol.2014.08.025 -
Basist, A., Bell, G. D., & Meentemeyer, V. (1994). Statistical relationships between topography and precipitation patterns. Journal of Climate, 7(9), 1305-1315. https://doi.org/10.1175/1520-0442(1994)007<1305:SRBTAP>2.0.CO;2
» https://doi.org/10.1175/1520-0442(1994)007<1305:SRBTAP>2.0.CO;2 -
Brubacher, J. P., Oliveira, G. G., & Guasselli, L. A. (2020). Preenchimento de falhas e espacialização de dados pluviométricos: desafios e perspectivas. Revista Brasileira de Meteorologia, 35(4), 615-629. https://doi.org/10.1590/0102-77863540067
» https://doi.org/10.1590/0102-77863540067 -
Buytaert, W., Celleri, R., Willems, P., De Bièvre, B., & Wyseure, G. (2006). Spatial and temporal rainfall variability in mountainous areas: a case study from the south Ecuadorian Andes. Journal of Hydrology (Amsterdam), 329(3-4), 413-421. https://doi.org/10.1016/j.jhydrol.2006.02.031
» https://doi.org/10.1016/j.jhydrol.2006.02.031 -
Depiné, H., Castro, N., Pinheiro, A., & Pedrollo, O. (2014). Preenchimento de falhas de dados horários de precipitação utilizando redes neurais artificiais. RBRH, 19(1), 51-63. https://doi.org/10.21168/rbrh.v19n1.p51-63
» https://doi.org/10.21168/rbrh.v19n1.p51-63 - Elste, G. A. S. (2021). Estudo fisiográfico e limnológico da bacia hidrográfica do rio Guaraguaçu, Litoral do Paraná (Dissertação de mestrado). Universidade Federal do Paraná, Matinhos.
-
Falck, A. S., Maggioni, V., Tomasella, J., Vila, D. A., & Diniz, F. L. R. (2015). Propagation of satellite precipitation uncertainties through a distributed hydrologic model: a case study in the Tocantins–Araguaia Basin in Brazil. Journal of Hydrology, 527, 943-957. https://doi.org/10.1016/j.jhydrol.2015.05.042
» https://doi.org/10.1016/j.jhydrol.2015.05.042 - Food and Agriculture Organization of the United Nations - FAO, & United Nations Educational, Scientific and Cultural Organization - UNESCO. (1971). Soil map of the world: 1:5 000 000 (Vol. IV: South America). Paris: UNESCO.
- Grimm, A. M. (2009). Clima da região Sul do Brasil. In I. F. A. Cavalcanti, N. J. Ferreira, M. A. F. Silva, & M. F. S. Dias (Orgs.), Tempo e clima no Brasil (pp. 260-275). São Paulo: Oficina de Textos.
-
Instituto das Águas do Paraná. Sistema de Informações Hidrológicas - SIH. (2025). Retrieved in 2025, November 10, from http://www.sih-web.aguasparana.pr.gov.br/sih-web/gerarRelatorioAlturasDiariasPrecipitacao.do?action=carregarInterfaceInicial
» http://www.sih-web.aguasparana.pr.gov.br/sih-web/gerarRelatorioAlturasDiariasPrecipitacao.do?action=carregarInterfaceInicial -
Jiang, A., Zhang, W., Liu, X., Zhou, F., Li, A., Peng, H., & Wang, H. (2024). Improving hydrological process simulation in mountain watersheds: integrating WRF model gridded precipitation data into the SWAT model. Journal of Hydrology (Amsterdam), 639, e131687. https://doi.org/10.1016/j.jhydrol.2024.131687
» https://doi.org/10.1016/j.jhydrol.2024.131687 -
Jiang, S., Liu, R., Ren, L., Wang, M., Shi, J., Zhong, F., & Duan, Z. (2020). Evaluation andhydrological application of CMADS reanalysis precipitation data against four satellite precipitation products in the upper Huaihe River Basin, China. Journal of Meteorological Research, 34(5), 1096-1113. https://doi.org/10.1007/s13351-020-0026-6
» https://doi.org/10.1007/s13351-020-0026-6 - Kobiyama, M., Grison, F., & Mota, A. A. (2011). Curso de capacitação em hidrologia e hidrometria para conservação de mananciais (3. ed., 242 p.). Florianópolis: UFSC/CTC/ENS/LabHidro.
-
Kuchinski, V., & Paiva, R. C. D. (2025). The influence of topography on floods in southern Brazil. RBRH, 30, e21. https://doi.org/10.1590/2318-0331.302520250009
» https://doi.org/10.1590/2318-0331.302520250009 -
Li, Y., Ryu, D., Western, A. W., & Wang, Q. J. (2016). Impacts of spatial climatic representation on hydrological model calibration and prediction uncertainty: a mountainous Catchment of Three Gorges Reservoir Region, China. Water (Basel), 8(3), 73. https://doi.org/10.3390/w8030073
» https://doi.org/10.3390/w8030073 - Lima, L. S. (2016). Acoplamento de modelos hidrológicos e hidrodinâmicos para prognóstico ambiental detalhado de longo prazo (Tese de doutorado). Universidade Federal do Rio de Janeiro, COPPE, Rio de Janeiro.
-
Liu, X., Yang, T., Hsu, K., Liu, C., & Sorooshian, S. (2017). Evaluating the streamflow simulation capability of PERSIANN-CDR daily rainfall products in two river basins on the Tibetan Plateau. Hydrology and Earth System Sciences, 21(1), 169-181. https://doi.org/10.5194/hess-21-169-2017
» https://doi.org/10.5194/hess-21-169-2017 -
Lujano, E., Diaz, R. D., Lujano, R., Sanchez-Delgado, M., & Lujano, A. (2025). Hydrological performance of gridded meteorological products in Peruvian Altiplano basins. RBRH, 30, e10. https://doi.org/10.1590/2318-0331.302520240068
» https://doi.org/10.1590/2318-0331.302520240068 -
Miao, C., Ashouri, H., Hsu, K., Sorooshian, S., & Duan, Q. (2015). Evaluation of the PERSIANN-CDR daily rainfall estimates in capturing the behavior of extreme precipitation events over China. Journal of Hydrometeorology, 16(3), 1387-1396. https://doi.org/10.1175/JHM-D-14-0174.1
» https://doi.org/10.1175/JHM-D-14-0174.1 -
Moriasi, D. N., Arnold, J. G., Van Liew, M. W., Binger, R. L., Harmel, R. D., & Veith, T. L. (2007). Model evaluation guidelines for systematic quantification of accuracy in watershed simulations. Transactions of the ASABE, 50(3), 885-900. Retrieved in 2025, November 10, from http://swat.tamu.edu/media/90109/moriasimodeleval.pdf
» http://swat.tamu.edu/media/90109/moriasimodeleval.pdf - Neitsch, S. L., Arnold, J. G., Kiniry, J. R., & Williams, J. R. (2011). Soil and water assessment tool: theoretical documentation College Station: Texas Water Resources Institute.
- Noda, F. S. S. (2018). Avaliação do modelo Soil and Water Assessment Tool (SWAT) na Bacia Hidrográfica do Ribeirão Taquaruçu (Dissertação de mestrado). Universidade Federal do Tocantins, Palmas.
-
Nossent, J., Elsen, P., & Bauwens, W. (2011). Sobol’ sensitivity analysis of a complex environmental model. Environmental Modelling & Software, 26(12), 1515-1525. https://doi.org/10.1016/j.envsoft.2011.08.010
» https://doi.org/10.1016/j.envsoft.2011.08.010 - Paula, E. V. (2016). Análise da produção de sedimentos na área de drenagem da Baía de Antonina, Paraná: Contribuições ao planejamento do território In R. A. Reis, C. M. S. Abrahão, L. M. Tiepolo, & M. Chemin (Orgs.), Litoral do Paraná: Território e Perspectivas (Vol. 1: Sociedade, Ambiente e Gestão, pp. 11-35). Curitiba: Brazil Publishing.
-
Pereira, D. R. R., Martinez, M. A., Pruski, F. F., & Silva, D. D. (2016). Hydrological simulation in a basin of typical tropical climate and soil using the SWAT model: part I, calibration and validation tests. Journal of Hydrology. Regional Studies, 7, 14-37. https://doi.org/10.1016/j.ejrh.2016.05.002
» https://doi.org/10.1016/j.ejrh.2016.05.002 -
Perleberg, B. R., Hosser, S., Pinto, L. B., & Lindemann, D. S. (2025). Análise comparativa dos dados meteorológicos de Rio Brilhante MS: Estação INMET, Banco de dados BR-DWGD e Reanálise ERA5. Ciência e Natura, 47(no. esp. 3), e84142. https://doi.org/10.5902/2179460X84142
» https://doi.org/10.5902/2179460X84142 -
Sampaio Júnior, J. M., Reis, M. M., & Paz, I. S. R. (2025). Impacts of spatial variability in urban hydrological modelling: a case study of the Canal do Mangue Basin in Rio de Janeiro, Brazil. RBRH, 30, e26. https://doi.org/10.1590/2318-0331.302520240004
» https://doi.org/10.1590/2318-0331.302520240004 - Sant’Ana, D. O. (2023). Modelagem hidrológica e hidrodinâmica do Rio Guaraguaçu (Dissertação de mestrado). Programa de Pós-graduação em Engenharia Ambiental, Universidade Federal do Paraná, Curitiba.
- Searcy, J. K., & Hardison, C. H. (1960). Double-mass curves (U.S. Geological Survey Water-Supply Paper 1541-B). U.S. Geological Survey.
-
Silva Júnior, J. A. (2025). Análise de índices de precipitação utilizando dados BR-DWGD na bacia hidrográfica do rio Terra Nova, Pernambuco. Revista Brasileira de Climatologia, 37(21), 454-473. https://doi.org/10.55761/abclima.v37i21.19455
» https://doi.org/10.55761/abclima.v37i21.19455 -
Sirisena, T. A. J. G., Maskey, S., Ranasinghe, R., & Babel, M. S. (2018). Effects of different precipitation inputs on streamflow simulation in the Irrawaddy River Basin, Myanmar. Journal of Hydrology. Regional Studies, 19, 265-278. https://doi.org/10.1016/j.ejrh.2018.10.005
» https://doi.org/10.1016/j.ejrh.2018.10.005 -
Szcześniak, M., & Piniewski, M. (2015). Improvement of hydrological simulations by applying daily precipitation interpolation schemes in meso-scale catchments. Water (Basel), 7(2), 747-779. https://doi.org/10.3390/w7020747
» https://doi.org/10.3390/w7020747 -
Tan, X., Yong, B., & Ren, L. (2017). Error features of the hourly GSMaP multi-satellite precipitation estimates over nine major basins of China. Nordic Hydrology, 49(3), 761-779. https://doi.org/10.2166/nh.2017.263
» https://doi.org/10.2166/nh.2017.263 - Taveira, B. D. A. (2016). Processos hidrossedimentológicos em cenários climáticos na bacia hidrográfica do rio Nhundiaquara, Serra do Mar paranaense (Dissertação de mestrado). Universidade Federal do Paraná, Curitiba.
-
Taveira, B. D. A., & Santos, I. (2019). Avaliação do efeito de mudanças climáticas na vazão e transporte de sedimentos na bacia hidrográfica do rio Nhundiaquara. Boletim de Geografia, 37(2), 29-42. https://doi.org/10.4025/bolgeogr.v37i2.35607
» https://doi.org/10.4025/bolgeogr.v37i2.35607 -
Um, M., Yun, H., Jeong, C., & Heo, J.-H. (2011). Factor analysis and multiple regression between topography and precipitation on Jeju Island, Korea. Journal of Hydrology (Amsterdam), 410(3-4), 189-203. https://doi.org/10.1016/j.jhydrol.2011.09.016
» https://doi.org/10.1016/j.jhydrol.2011.09.016 - Universidade Tecnológica Federal do Paraná – UTFPR. (2024). Projeto AMEAC: avaliando múltiplos estressores em ambientes aquáticos costeiros, no rio Guaraguaçu. Curitiba: UTFPR.
-
Viana, J. F. S., Montenegro, S. M. G. L., Silva, B. B., Silva, R. M., & Sousa, W. S. (2018). Modelagem hidrológica da bacia hidrográfica do rio Pirapama-PE utilizando o modelo SWAT. Journal of Environmental Analysis and Progress, 3(1), 155-172. https://doi.org/10.24221/jeap.3.1.2018.1709.155-172
» https://doi.org/10.24221/jeap.3.1.2018.1709.155-172 - World Meteorological Organization – WMO. (2011). Guide to Climatological Practices (WMO-No. 100). Geneva: WMO.
-
Xavier, A. C., Scanlon, B. R., King, C. W., & Alves, A. I. (2022). New improved Brazilian daily weather gridded data (1961–2020). International Journal of Climatology, 42(16), 8390-8404. https://doi.org/10.1002/joc.7731
» https://doi.org/10.1002/joc.7731 -
Yang, L., Zhao, G., Tian, P., Mu, X., Tian, X., Feng, J., & Bai, Y. (2022). Runoff changes in the major river basins of China and their responses to potential driving forces. Journal of Hydrology (Amsterdam), 607, 127536. https://doi.org/10.1016/j.jhydrol.2022.127536
» https://doi.org/10.1016/j.jhydrol.2022.127536
Edited by
-
Editor in-Chief:
Adilson Pinheiro
-
Associated Editor:
Fernando Mainardi Fan